a high-repetition rate scheme for synchrotron-based ... · a high-repetition rate scheme for...
TRANSCRIPT
A high-repetition rate scheme for synchrotron-based picosecond laser pump/x-rayprobe experiments on chemical and biological systems in solutionFrederico A. Lima, Christopher J. Milne, Dimali C. V. Amarasinghe, Mercedes Hannelore Rittmann-Frank,
Renske M. van der Veen, Marco Reinhard, Van-Thai Pham, Susanne Karlsson, Steven L. Johnson, Daniel
Grolimund, Camelia Borca, Thomas Huthwelker, Markus Janousch, Frank van Mourik, Rafael Abela, and Majed
Chergui Citation: Review of Scientific Instruments 82, 063111 (2011); doi: 10.1063/1.3600616 View online: http://dx.doi.org/10.1063/1.3600616 View Table of Contents: http://scitation.aip.org/content/aip/journal/rsi/82/6?ver=pdfcov Published by the AIP Publishing
This article is copyrighted as indicated in the article. Reuse of AIP content is subject to the terms at: http://scitationnew.aip.org/termsconditions. Downloaded to IP:
192.33.102.90 On: Thu, 20 Feb 2014 16:19:19

REVIEW OF SCIENTIFIC INSTRUMENTS 82, 063111 (2011)
A high-repetition rate scheme for synchrotron-based picosecond laserpump/x-ray probe experiments on chemical and biological systemsin solution
Frederico A. Lima,1 Christopher J. Milne,1 Dimali C. V. Amarasinghe,1,a)
Mercedes Hannelore Rittmann-Frank,1 Renske M. van der Veen,1,b) Marco Reinhard,1
Van-Thai Pham,1,c) Susanne Karlsson,1 Steven L. Johnson,2 Daniel Grolimund,2
Camelia Borca,2 Thomas Huthwelker,2 Markus Janousch,2 Frank van Mourik,1
Rafael Abela,3 and Majed Chergui1,d)
1Laboratoire de Spectroscopie Ultrarapide, Ecole Polytechnique Fédérale de Lausanne, ISIC, FSB,1015 Lausanne, Switzerland2Swiss Light Source, Paul Scherrer Institut, 5232 Villigen, Switzerland3SwissFEL, Paul Scherrer Institut, 5232 Villigen, Switzerland
(Received 28 April 2011; accepted 23 May 2011; published online 27 June 2011)
We present the extension of time-resolved optical pump/x-ray absorption spectroscopy (XAS) probeexperiments towards data collection at MHz repetition rates. The use of a high-power picosecond laseroperating at an integer fraction of the repetition rate of the storage ring allows exploitation of up totwo orders of magnitude more x-ray photons than in previous schemes based on the use of kHz lasers.Consequently, we demonstrate an order of magnitude increase in the signal-to-noise of time-resolvedXAS of molecular systems in solution. This makes it possible to investigate highly dilute samplesat concentrations approaching physiological conditions for biological systems. The simplicity andcompactness of the scheme allows for straightforward implementation at any synchrotron beamlineand for a wide range of x-ray probe techniques, such as time-resolved diffraction or x-ray emissionstudies. © 2011 American Institute of Physics. [doi:10.1063/1.3600616]
I. INTRODUCTION
Over the past 10 years, there have been huge effortsaimed at investigating ultrafast photoinduced structuralchanges in molecules, crystals, materials, and proteins usingstructural probes such as electron and x-ray diffraction,electron microscopy, and x-ray absorption spectroscopy in apump-probe scheme.1 The goal is to retrieve the structural dy-namics of the systems on the atomic scales of space (sub-Å)and time (femtoseconds to picoseconds). Ultrafast electrondiffraction and microscopy are making rapid progress infollowing the structural dynamics of gas phase molecules,materials, thin films, and surfaces.1 Ultrafast x-ray diffractionhas found many applications including the study of coherentphonons2, 3 and phase transitions in solid materials,4 whilethe first x-ray diffraction study on protein crystals has beenachieved with 100 ps time resolution.5 For the case of chem-ical reactions in disordered media such as liquids, which isthe medium wherein most chemical and biological reactionstake place, x-ray scattering has been used in the >100-pstime scale6, 7 but due to the sensitivity of the technique toall atoms in the sample and the complexity of processesoccurring on this time scale in both solvent and solute, theanalysis of the data is nontrivial. The chemical selectivityof x-ray absorption spectroscopy (XAS) makes it ideal as a
a)Present address: Department of Chemical Physics, Lund University,SE-22100 Lund, Sweden.
b)Present address: California Institute of Technology, Pasadena, California91125, USA.
c)Present address: Pacific Northwest National Laboratory, Richland,Washington 99352, USA.
d)Electronic mail: [email protected].
local probe, and allows retrieval of both the local geometricstructure and the electronic environment around a given atomvia analysis of the extended x-ray absorption fine structure(EXAFS) and the x-ray absorption near-edge spectroscopy(XANES) regions of the spectrum. This unique combinationprovides information about the electronic changes that drivethe subsequent structural dynamics as well as information onthe structural changes themselves.1, 8–13
To date, picosecond optical pump/x-ray probe XASexperiments8, 14–28 have been performed with the pump laseroperating at kHz repetition rates in order to take advantageof the high pulse energies available from commercially avail-able amplified laser systems (>1 mJ/pulse). In contrast to this,synchrotron x-ray pulses are generally delivered at MHz rep-etition rates by the storage ring. The experiments typicallymake use of a fast detector to only measure the x-ray pulsesgenerated by an isolated “camshaft” electron bunch of thehybrid filling mode available at third-generation synchrotronsources (see Fig. 1) and are usually based on recording thetransient absorption on a pulse-to-pulse basis. The data ac-quisition is performed in such a way that the x-ray absorp-tion signal of the sample is recorded at twice the repetitionrate of the pump laser using gated detectors, with one x-ray absorption signal corresponding to the laser-excited sam-ple and the next to the unexcited sample. This scheme hasproven capable of measurements limited only by the shotnoise of the synchrotron source.17, 18 Its main drawback isthat while the excitation laser pulses occur at kHz repeti-tion rates, the synchrotron pulses occur at MHz repetitionrates, which means that typically 103 x-ray pulses are un-used. This reduced x-ray flux is a major limiting factor on
0034-6748/2011/82(6)/063111/16/$30.00 © 2011 American Institute of Physics82, 063111-1
This article is copyrighted as indicated in the article. Reuse of AIP content is subject to the terms at: http://scitationnew.aip.org/termsconditions. Downloaded to IP:
192.33.102.90 On: Thu, 20 Feb 2014 16:19:19

063111-2 Lima et al. Rev. Sci. Instrum. 82, 063111 (2011)
the achievable signal-to-noise ratio (S/N) of the experiments,which not only reduces the accuracy of the structural anal-ysis but also places a restriction on samples that can bemeasured with a solubility in the range of tens to hundredsof mM.
In order to exploit all the available camshaft x-ray pulses,it would be necessary to use a pump laser that runs at halfthe repetition rate of the synchrotron source. At the SwissLight Source (SLS, Paul Scherrer Institut, Villigen, Switzer-land), this corresponds to a repetition rate of 1.04 MHz,which would require a laser at 520 kHz. Provided the con-ditions (laser fluence, incident x-ray flux per pulse, sampleconcentration, thickness, etc.) are similar to those of the 1kHz experiments and assuming that the predominant sourceof noise is the shot noise of the x-ray source, an increase of√
520 ≈ 23 in S/N should be expected, resulting in signifi-cantly shorter data acquisition times and expanding the ap-plicability of the technique to the study of dilute liquid-phasesystems.
Previous attempts to implement a high-repetition ratepump-probe scheme at synchrotrons were made by Widdraet al.29, 30 who used a Nd:YVO4 oscillator (1064 nm, 200 nJ,14 ps) with a pulse-picker operating at 1.25 MHz to matchthe single-bunch repetition rate at the BESSY synchrotron(Berlin, Germany) for time-resolved core-level photoemis-sion studies of surfaces. Stern et al.31, 32 used an amplifiedTitanium:Sapphire laser source (800 nm, 3 μJ, 100 fs) oper-ating at 272 kHz at the APS (Advanced Photon Source, Ar-gonne, USA) to study laser-induced melting of Germaniumfilms. The disadvantage of using high-repetition rate excita-tion with solid samples is the sample damage resulting fromthe high average power. For liquid solutions, high repetitionrate excitation is ideal since the flowing sample is continu-ously refreshed, but this has so far not been attempted. Giventhat the main limitation in the picosecond optical pump/XASprobe studies at 1 kHz is the low x-ray flux, it seems worth-while to extend the pump/probe scheme to data collection athigher repetition rates.
Here we report on a portable experimental setup forps XAS studies at both the hard x-ray microXAS beam-line and the tender x-ray PHOENIX I beamline of the SwissLight Source. It uses a compact ps pump laser with vari-able repetition rate, widening the potential application of pi-cosecond x-ray experiments to the many diverse x-ray tech-niques (absorption, emission, diffraction, scattering) availableat synchrotrons. We demonstrate its performance by inves-tigating the well characterized light-induced spin crossoverprocess in [Fe(bpy)3]2+ (Ref. 33) and the oxidation statechange in [Ru(bpy)3]2+,34 showing improved S/N for high-concentration samples and pump-probe signals at high dilu-tions. Additionally, as a demonstration of the new scheme onlow concentration biological systems in physiological media,we report the results of a pump-probe XAS experiment onphotoexcited carboxymyoglobin (MbCO).
II. INSTRUMENTS AND METHODS
The main elements required for a picosecond time-resolved XAS experiment will be briefly reviewed,
].u.a[ ytis
netni esl
up yar-
X
10005000
time [ns]
multibunchlaser
pumpedcamshaft camshaft
unpumped
[I p(E,t)]x-ray
[I unp(E,t)]x-ray
[I unp(E,t)]zero
[I p(E,t)]zero
960 ns (1.04 MHz)
FIG. 1. (Color online) Electron filling pattern used at the SLS. In total, thereare 480 possible buckets spaced 2 ns apart, of which 390 are filled with elec-trons (multibunch). Of the 90 remaining empty buckets, the camshaft pulse inbucket 465 is filled with four times more current than the average multibunchcurrent. The ring repetition rate is 1.04 MHz, which sets an upper limit forthe data acquisition rate of the experiments using the current hybrid fillingmode.
highlighting the specifics of the MHz data acquisitionscheme for comparison to kHz data acquisition.14, 17, 18
A. X-ray source
The probe pulses are derived from the camshaft electronbunch provided by the SLS during normal user operation. Theisolated pulse is a result of the hybrid electron filling patternused at the SLS (Fig. 1) which consists of 390 consecutiveelectron bunches separated by 2 ns, called the multibunch, andan isolated electron bunch, called the camshaft pulse, whichis placed within the empty gap of 180 ns. The isolated singlebunch has four times more current than the individual bunchesin the multibunch structure and a duration of approximately85 ps (FWHM).35 During normal user operation the ring cur-rent is 400 mA and the camshaft current is 4 mA. The ringcurrent is maintained to within 0.5% by use of top-up fillingmode which injects electrons into the storage ring at regularintervals.
The reported experiments were conducted at two dif-ferent beamlines at the SLS. The microXAS beamline, lo-cated in the long straight section X05L of the SLS ring, isequipped with a minigap in-vacuum undulator capable of gen-erating x-rays from 4 to 23 keV with a flux of approximately1012 photons/s/0.015% bandwidth. The photons are colli-mated vertically and focussed horizontally by a Rh-coatedtoroidal mirror and then energy selected over a range of band-widths by a double-crystal, fixed exit monochromator (DCM)containing Si(111), Ge(111), and Si(311) crystal pairs. An el-liptical mirror pair in the Kirkpatrick-Baez (KB) geometry islocated immediately before the experimental station, and iscapable of focusing the x-rays down to < 1 × 1μm2 spot.36
The PHOENIX I beamline covers the tender x-ray spec-trum from 800 eV to 8 keV. The photon source is an ellipti-cal APPLE II undulator with a flux of 1011 photons/s/0.01%bandwidth. The beamline is equipped with a DCM contain-ing Si(111) crystal pairs, for energies above 2.1 keV, and KBmirrors allowing for μm focal spots.
This article is copyrighted as indicated in the article. Reuse of AIP content is subject to the terms at: http://scitationnew.aip.org/termsconditions. Downloaded to IP:
192.33.102.90 On: Thu, 20 Feb 2014 16:19:19

063111-3 Lima et al. Rev. Sci. Instrum. 82, 063111 (2011)
B. Laser source
Since the time-resolution of the XAS experiments isgenerally limited by the synchrotron pulse duration (typically85 ps at the SLS), there is no advantage to using fs lasersystems to excite the sample as done so far. In fact thereare several disadvantages. These sources are amplified,which means they need both a large amount of space andsubstantial cooling. They are often outside the experimentalhutch, implying beam transport over tens of meters to thesample, which results in an increased sensitivity to the laserpointing stability and the far-field laser mode. Here we usea compact, high-average power Nd:YVO4 picosecond laser(Duetto, Time Bandwidth Products, Zürich) operating atvariable repetition rate (50 kHz to 8 MHz), and producing10 ps pulses. This product is primarily aimed at industrialusers meaning emphasis has been placed on turn-key oper-ation and long-term stability. It delivers up to two orders ofmagnitude more energy per pulse than current high-repetitionrate femtosecond oscillators, but still two orders of magnitudeless energy per pulse than kHz amplified femtosecond sys-tems. The Duetto laser system optimizes the amplifier stagediode pump current to extract the maximum possible pulseenergy at any given repetition rate. When operated at halfthe repetition rate of the isolated camshaft pulse (520 kHz)this results in 28 μJ per pulse at the fundamental wavelength,1064 nm. By frequency doubling and tripling one obtains15 μJ per pulse at 532 nm and 6 μJ per pulse at 355 nm. Itis also possible to double the 532 nm light to obtain 266 nmlight. The laser mode has an M2 value of 1.2 for both thedoubled and tripled beams which permits it to be efficientlyfocussed to very small diameter spots, thus allowing similarfluences compared to the kHz experiments at modest beamdiameters (<50 μm).
The use of this pump laser offers three primary advan-tages with respect to amplified fs systems at 1 kHz: (1) the
longer pulse duration results in lower peak power, whichminimizes sample damage and nonlinear effects, and gener-ally results in more efficient sample excitation; (2) the factthat the pulse energy varies with the repetition rate allowsboth the excitation and the repetition rate to be tuned tothe experimental requirements; and (3) Titanium:Sapphire-based amplified systems operate at 800 nm, which can eas-ily be converted into 400 and 266 nm light, while molecularsystems typically absorb in the visible region of the spec-trum (400–700 nm), making these amplified pulses a poorchoice for sample excitation whereas the 532 nm wavelengthavailable from the high-repetition rate laser is ideal. For ex-periments on species with very long-lived excited-state life-times a “slow-difference” scan mode can be used in whichthe transient data are no longer collected by the pulse-to-pulse difference method, but as a difference of the averageof 1 million x-ray measurements with laser on, and sec-ond average of 1 million x-ray measurements with the laseroff. This alternative data collection mode will be detailed inSec. IV C.
C. Synchronization and timing control
Overall stability and synchronization between the pumpand probe sources are crucial for the success of any time-resolved experiments. The pump laser pulses have to be accu-rately synchronized to the x-ray probe pulses in order to havecontrol of the relative temporal delay between them. Here weadopted a similar synchronization and timing control schemeused for previous optical pump/x-ray probe experiments,17, 18
which has previously proven to work reliably over thetime required for the experiments. A simplified scheme ofthe synchronization and the timing control is shown inFig. 2.
This is achieved by exploiting the intrinsic synchroniza-tion of the radio frequency (RF) master clock of the SLS with
oo Transmission
Diode
Fluorescence
APD
ADC Trigger
2.08 MHz
SLS master clock
500 MHz
X-ray pulses (1.04 MHz)
Laser pulses (520 kHz)
DAQcomputer control
Phase modulator
(QPMX-500-S)
Timing stabilizer (CLX-1100)
FEMTO
FEMTO
Track and Hold
MHz ADC
T&H Trigger
1.04 MHz
Synchrotron
Laser
Pulse picker
trigger
FIG. 2. (Color online) Diagram of the high-repetition rate pump-probe setup, see text for details.
This article is copyrighted as indicated in the article. Reuse of AIP content is subject to the terms at: http://scitationnew.aip.org/termsconditions. Downloaded to IP:
192.33.102.90 On: Thu, 20 Feb 2014 16:19:19
063111-4 Lima et al. Rev. Sci. Instrum. 82, 063111 (2011)
the x-ray pulses. This master clock is synchronized to the500 MHz signal of the RF cavities which is, in turn, respon-sible for creating the potential wells inside the storage ring,thus providing the time structure of the generated radiation. Ifa stable phase relationship between the RF and the laser oscil-lator pulses is established, synchronization is achieved. Therelative phase stabilization is done via a commercially pur-chased system (CLX-1100 timing stabilizer, Time BandwidthProducts), which locks the phase of the Duetto laser oscil-lator to the SLS master RF with a timing jitter of less than400 fs.
The relative time delay between the x-rays and laserpulses can be adjusted via a computer controlled timing sys-tem, which is integrated into the data acquisition. The timingof the laser pulse is controlled by synchronous scanning of thetrigger for the Duetto pulse picker and an RF phase modula-tor (QPMX-500-S, I. F. Engineering). The phase modulatorallows precise control over the relative phase of the oscilla-tor with respect to that of the RF, thus changing the relativetime delay between the laser and x-ray pulses with a few psprecision.
D. Detection and data acquisition
The employed data collection strategy is similar to thatused for previous experiments,11, 17, 18 with the important dif-ference that the data acquisition rate is increased to 2 MHz.Briefly, the XAS signal at a specific x-ray energy and pump-probe time delay is recorded at twice the laser repetition rate,alternating between the signal from the excited sample andfrom the unexcited sample 1 μs later (see Fig. 1). In addi-tion, a zero measurement is made for every x-ray measure-ment by reading the detector signal in the fill pattern gapwhere no x-rays are present. This electronic zero level isthen subtracted off the corresponding x-ray signal to compen-sate for any drift in the data acquisition baseline over time.The signals provided to the user correspond to the pumpedXAS signal ([Ip]x-ray−[Ip]zero), the unpumped XAS signal([Iunp]x-ray−[Iunp]zero) and the pulse-to-pulse difference sig-nal of pumped-unpumped with the zeroes being ignored as theelectronic baseline will have no time to drift during the 1 μsseparating the two x-ray measurements ([Ip]x-ray−[Iunp]x-ray).The data acquisition scheme is shown in Fig. 2.
Detectors for a time-resolved XAS experiment mustfulfill three main requirements: (a) they should be fast enoughto isolate the x-ray pulses that come solely from the camshaftbunch, (b) they must generate sufficient signal when exposedto a range of x-ray energies, and (c) they must have linear re-sponse over the range of x-ray flux used. In the present setup,the x-ray pulses are measured using two different types of fastdetectors: for fluorescence signals large-area avalanche pho-todiodes (C30703F, PerkinElmer) with a 1 cm × 1 cm activearea are used when the intrinsic gain of the device is neces-sary to measure signals down to the single x-ray photon level.In transmission, silicon photodiodes are used (AXUV20HS1,International Radiation Detectors) where device linearityover several orders of magnitude of current becomes criticallyimportant. Both types of detectors have rise times <5 ns. The
detectors are shielded with 25 μm thick Be foils to protectthem from scattered laser light. The detector signal is thenamplified using broad-bandwidth (80–200 MHz) current-to-voltage amplifiers (FEMTO DHPCA-100) which allow thesignal to be transferred to the data acquisition system with aminimum of additional noise. We use track-and-hold circuits(AD9100, Analog Devices) to sample the amplified signal onthe maximum of the camshaft pulse. This level is then held forsufficient time for the fast analog-to-digital card to sample thesignal level. The digitizer is an eight-channel ADC/digitizerboard (Struck Innovative System GmbH, model SIS3302)with a sampling rate of up to 100 MHz and 16 bit resolution,capable of sampling up to 8 channels in parallel for eachgiven trigger. The ADC is housed in a virtual machineenvironment (VME) crate together with the hardware forgenerating all the timing signals. Triggers are required for theADC at 2.08 MHz to read the zero signal and the x-ray signal,the laser pulse picker at 520 kHz (or some even sub-multipleof the 1.04 MHz x-ray frequency), and the track-and-holdcircuits at 1.04 MHz. In addition two marker signals aregenerated and digitized in parallel with the data channelsto indicate if a signal originates from the laser-excited orfrom the unexcited sample and if the signal is an x-ray mea-surement or a zero measurement. The VME crate uses thesemarker signals to sort the data prior to performing the signalaveraging.
The reported measurements are performed in transmis-sion and fluorescence yield (FY) modes simultaneously. De-pending on the sample solubility and optical density one canadjust the concentration in order to optimize the signal for ei-ther mode.8 For the hard-x-ray experiments the incident x-rayintensity (I0) was also recorded by measuring the fluorescencefrom a thin Cr foil using an APD. Recording the incomingx-ray flux on a pulse-to-pulse basis allows the normalizationof incoming x-ray fluctuations due to monochromator imper-fections or changes due to the storage ring. Moreover, nor-malization of the unexcited spectra to the incident flux yieldsthe static XAS of the sample. Note that the transient differ-ence measurement does not in general require I0 normaliza-tion since the incident x-ray flux does not change on a 1 μstimescale.
With the laser operating at 520 kHz, two million mea-surements are performed over the course of 1 s: 500 000pumped x-rays, 500 000 pumped zeroes, 500 000 unpumpedx-rays, and 500 000 unpumped zeroes. These signals are thensorted according to the markers, the requisite calculations areperformed and then each of the three signals is averaged, re-turning to the scanning PC the averaged data and the standarderror of the pumped/unpumped/difference measurement foreach of the ADC channels.
The time-dependent transmission transient XAS signal isdefined as
�AT (E, t) = ln
([I Tunp(E)
]x-ray − [I Tunp(E)
]zero
[I T
p (E, t)]x-ray − [
I Tp (E)
]zero
). (1)
The time-dependent fluorescence transient XAS signal is de-fined as
This article is copyrighted as indicated in the article. Reuse of AIP content is subject to the terms at: http://scitationnew.aip.org/termsconditions. Downloaded to IP:
192.33.102.90 On: Thu, 20 Feb 2014 16:19:19

063111-5 Lima et al. Rev. Sci. Instrum. 82, 063111 (2011)
�AF (E, t) =([
I Fp (E, t)
]x-ray − [I F
p (E, t)]zero) −
([I Funp(E)
]x-ray − [I Funp(E)
]zero)I0(E)
. (2)
The subscripts unp and p stand for the ground-state (un-pumped) or excited (pumped) sample, respectively. I0
represents the incoming x-ray intensity, I T stands for thetransmitted, and I F for the fluorescence signals. The super-script x-ray indicates that the signal was recorded with thepresence of x-rays and the superscript zero indicates that itwas recorded without any x-rays, representing the electronicbackground signal of the detection system.
In 1 kHz experiments, this data acquisition methodologydelivers results at the shot noise limit of the x-ray source.17, 18
In this limit, the S/N increases linearly with the fraction ofexcited species, while it increases with
√n of the number
of accumulated x-ray photons, and thus the repetition rate ofthe experiment.8, 37 In the present experiment, the repetitionrate was increased by a factor of 520, meaning that the ex-pected increase on the S/N ratio is
√520 ≈ 23, if all other
parameters (x-ray flux, excitation yield, etc.) are consideredunchanged.
To test the linearity of the photodiode used as transmis-sion detector a series of measurements of the direct x-rayflux were taken, attenuating it by placing successive thin alu-minium foils in the incoming beam. The x-ray intensity wasrecorded directly as the diode current, the track-and-hold out-put, and the data acquisition digitized signal. Assuming a con-stant incoming intensity, which is a reasonable approximationfor the SLS since it operates in top-up mode, we expect thetransmitted signal to follow the Lambert-Beer law. In otherwords, the detector should behave linearly with respect to theincoming intensity. Indeed, the Si diode signal is linearly pro-portional to the incoming x-ray flux (see Fig. 3), even whenthe full flux of the beamline, 1012 photons/s, is used.
E. Spatial and temporal overlap of laser and x-rays
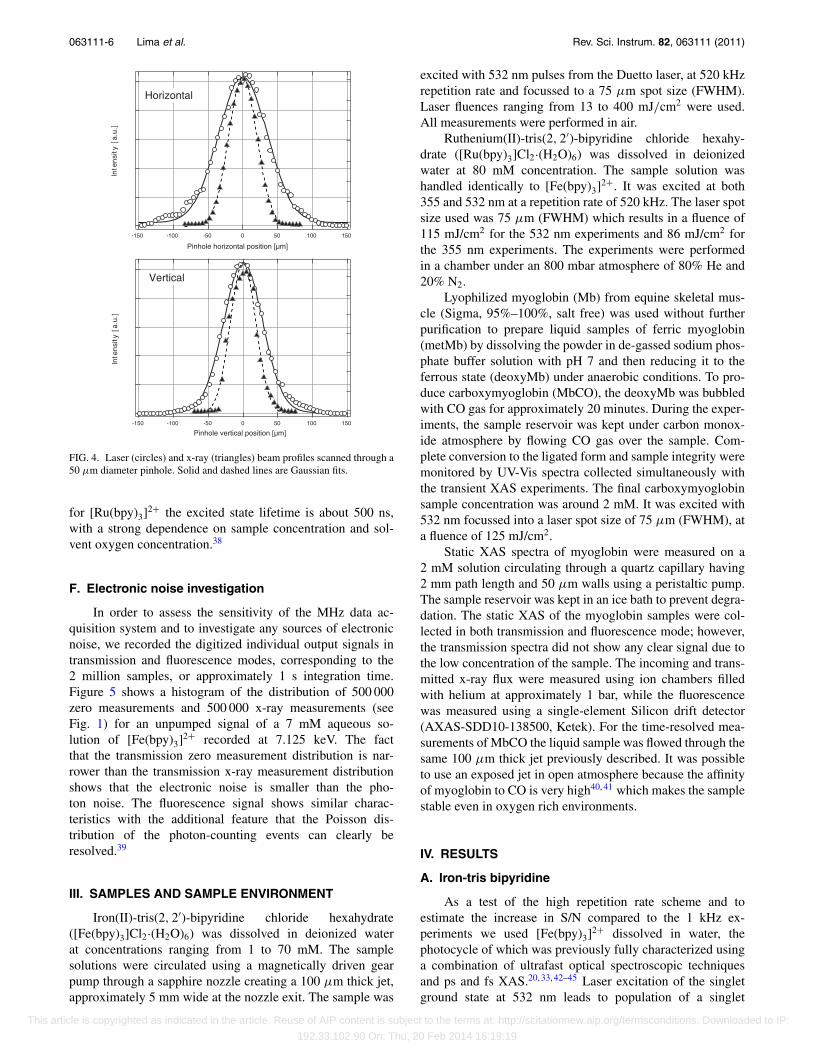
The spatial overlap between laser and x-rays was ob-tained by placing a 50 μm diameter, 25 μm thick tungstenpinhole in the sample position. The x-ray position and size canbe determined by scanning the pinhole through the x-rays us-ing a two-dimensional translation stage (0.1 μm resolution),while monitoring the transmission intensity (see Fig. 4). Oncethe x-ray position is found, the pinhole is moved to that po-sition and the attenuated laser beam is then guided throughthe pinhole and its position is optimized via a motorized lasermirror. Figure 4 shows example scans of the horizontal andvertical beam profiles of the laser and x-rays at the sampleposition. The x-ray spot size was determined to be less than50 μm in both dimensions (FWHM). The beamline x-ray im-age monitor indicates that the x-ray beam is focused down to∼40 μm. The laser beam size was made larger than the x-rayspot (85 μm horizontally and 65 μm vertically), to ensure auniformly excited sample and to facilitate the overlap of thepump and probe beams.
To set the temporal overlap a fast windowless photo-diode having a rise time of 700 ps (AXUVHS5, Interna-tional Radiation Detectors) was placed at the sample posi-tion. Using a 2.25 GHz oscilloscope (Agilent Infiniium) therelative laser and x-ray temporal delay could be determined.The laser pulse-picker timing was then adjusted to shift thelaser timing in coarse steps of 12 ns, and then the phase-shifter was used for finer time steps. In general the two pulsescan be overlapped to within 200 ps which is sufficient forsamples where the excited state lifetime is >200 ps. For[Fe(bpy)3]2+ the excited state lifetime is about 650 ps20 while
2
3
4
5
6
7
89
100
2
3
4
]A
µ[ tnerr
uc ed
oiD
1751501251007550250
Aluminum foil thickness [µm]
6
789100
2
3
4
5
6
7891000
2
].u.
a[ e
du t
ilp
m a
QA
D
DAQ diode
FIG. 3. (Color online) X-ray transmission signal (at 7.05 keV) measured by a fast diode. Left axis shows the diode current (red circles) while the right axisshows the digitized signal amplitude (black crosses). The flux was attenuated by placing aluminium foils of varying thickness in the beam. On a logarithmicscale the signal shows a linear dependence on absorber pathlength over the full range of x-ray flux indicating that the diode and DAQ are linear.
This article is copyrighted as indicated in the article. Reuse of AIP content is subject to the terms at: http://scitationnew.aip.org/termsconditions. Downloaded to IP:
192.33.102.90 On: Thu, 20 Feb 2014 16:19:19
063111-6 Lima et al. Rev. Sci. Instrum. 82, 063111 (2011)
].u.a[ ytis
netnI
-150 -100 -50 0 50 100 150
Pinhole vertical position [µm]
Vertical
].u.a[ ytis
netnI
-150 -100 -50 0 50 100 150
Pinhole horizontal position [µm]
Horizontal
FIG. 4. Laser (circles) and x-ray (triangles) beam profiles scanned through a50 μm diameter pinhole. Solid and dashed lines are Gaussian fits.
for [Ru(bpy)3]2+ the excited state lifetime is about 500 ns,with a strong dependence on sample concentration and sol-vent oxygen concentration.38
F. Electronic noise investigation
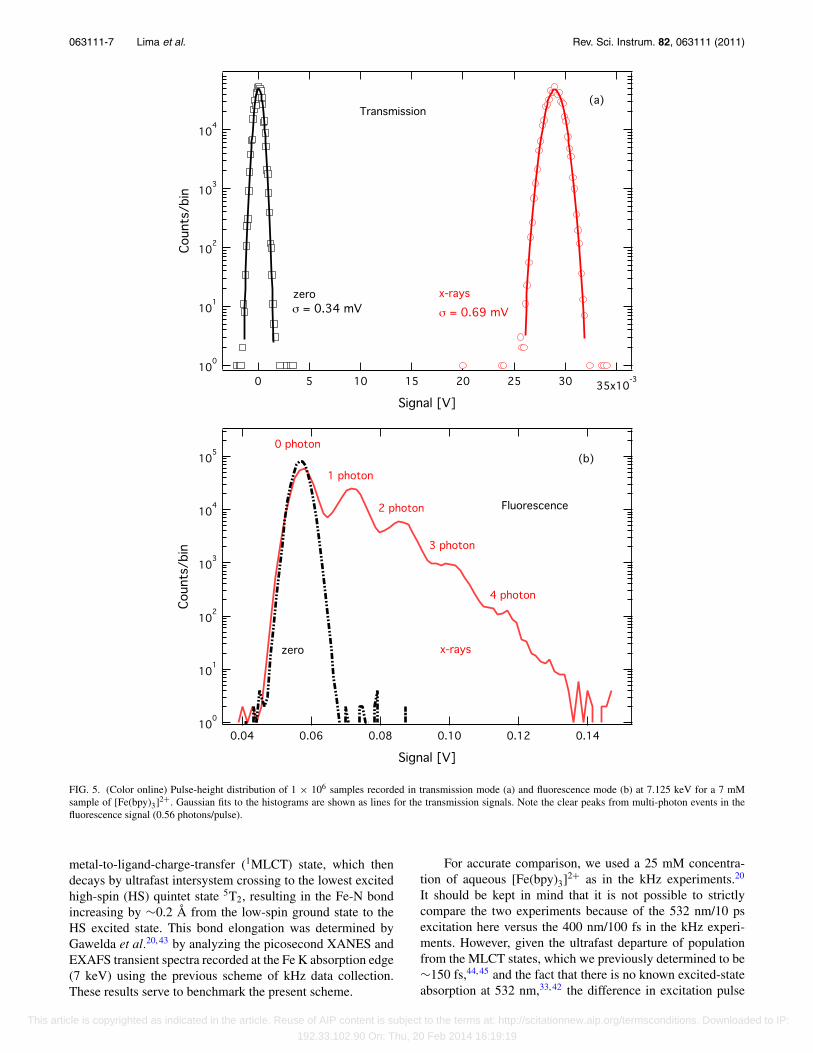
In order to assess the sensitivity of the MHz data ac-quisition system and to investigate any sources of electronicnoise, we recorded the digitized individual output signals intransmission and fluorescence modes, corresponding to the2 million samples, or approximately 1 s integration time.Figure 5 shows a histogram of the distribution of 500 000zero measurements and 500 000 x-ray measurements (seeFig. 1) for an unpumped signal of a 7 mM aqueous so-lution of [Fe(bpy)3]2+ recorded at 7.125 keV. The factthat the transmission zero measurement distribution is nar-rower than the transmission x-ray measurement distributionshows that the electronic noise is smaller than the pho-ton noise. The fluorescence signal shows similar charac-teristics with the additional feature that the Poisson dis-tribution of the photon-counting events can clearly beresolved.39
III. SAMPLES AND SAMPLE ENVIRONMENT
Iron(II)-tris(2, 2′)-bipyridine chloride hexahydrate([Fe(bpy)3]Cl2·(H2O)6) was dissolved in deionized waterat concentrations ranging from 1 to 70 mM. The samplesolutions were circulated using a magnetically driven gearpump through a sapphire nozzle creating a 100 μm thick jet,approximately 5 mm wide at the nozzle exit. The sample was
excited with 532 nm pulses from the Duetto laser, at 520 kHzrepetition rate and focussed to a 75 μm spot size (FWHM).Laser fluences ranging from 13 to 400 mJ/cm2 were used.All measurements were performed in air.
Ruthenium(II)-tris(2, 2′)-bipyridine chloride hexahy-drate ([Ru(bpy)3]Cl2·(H2O)6) was dissolved in deionizedwater at 80 mM concentration. The sample solution washandled identically to [Fe(bpy)3]2+. It was excited at both355 and 532 nm at a repetition rate of 520 kHz. The laser spotsize used was 75 μm (FWHM) which results in a fluence of115 mJ/cm2 for the 532 nm experiments and 86 mJ/cm2 forthe 355 nm experiments. The experiments were performedin a chamber under an 800 mbar atmosphere of 80% He and20% N2.
Lyophilized myoglobin (Mb) from equine skeletal mus-cle (Sigma, 95%–100%, salt free) was used without furtherpurification to prepare liquid samples of ferric myoglobin(metMb) by dissolving the powder in de-gassed sodium phos-phate buffer solution with pH 7 and then reducing it to theferrous state (deoxyMb) under anaerobic conditions. To pro-duce carboxymyoglobin (MbCO), the deoxyMb was bubbledwith CO gas for approximately 20 minutes. During the exper-iments, the sample reservoir was kept under carbon monox-ide atmosphere by flowing CO gas over the sample. Com-plete conversion to the ligated form and sample integrity weremonitored by UV-Vis spectra collected simultaneously withthe transient XAS experiments. The final carboxymyoglobinsample concentration was around 2 mM. It was excited with532 nm focussed into a laser spot size of 75 μm (FWHM), ata fluence of 125 mJ/cm2.
Static XAS spectra of myoglobin were measured on a2 mM solution circulating through a quartz capillary having2 mm path length and 50 μm walls using a peristaltic pump.The sample reservoir was kept in an ice bath to prevent degra-dation. The static XAS of the myoglobin samples were col-lected in both transmission and fluorescence mode; however,the transmission spectra did not show any clear signal due tothe low concentration of the sample. The incoming and trans-mitted x-ray flux were measured using ion chambers filledwith helium at approximately 1 bar, while the fluorescencewas measured using a single-element Silicon drift detector(AXAS-SDD10-138500, Ketek). For the time-resolved mea-surements of MbCO the liquid sample was flowed through thesame 100 μm thick jet previously described. It was possibleto use an exposed jet in open atmosphere because the affinityof myoglobin to CO is very high40, 41 which makes the samplestable even in oxygen rich environments.
IV. RESULTS
A. Iron-tris bipyridine
As a test of the high repetition rate scheme and toestimate the increase in S/N compared to the 1 kHz ex-periments we used [Fe(bpy)3]2+ dissolved in water, thephotocycle of which was previously fully characterized usinga combination of ultrafast optical spectroscopic techniquesand ps and fs XAS.20, 33, 42–45 Laser excitation of the singletground state at 532 nm leads to population of a singlet
This article is copyrighted as indicated in the article. Reuse of AIP content is subject to the terms at: http://scitationnew.aip.org/termsconditions. Downloaded to IP:
192.33.102.90 On: Thu, 20 Feb 2014 16:19:19
063111-7 Lima et al. Rev. Sci. Instrum. 82, 063111 (2011)
100
101
102
103
104
nib/stnuoC
35x10-3302520151050
Signal [V]
zero x-rays
Transmission
= 0.34 mV = 0.69 mV
(a)
100
101
102
103
104
105
nib/stnuo C
0.140.120.100.080.060.04
Signal [V]
zero x-rays
0 photon
1 photon
2 photon
3 photon
4 photon
Fluorescence
(b)
FIG. 5. (Color online) Pulse-height distribution of 1 × 10⁶ samples recorded in transmission mode (a) and fluorescence mode (b) at 7.125 keV for a 7 mMsample of [Fe(bpy)3]2+. Gaussian fits to the histograms are shown as lines for the transmission signals. Note the clear peaks from multi-photon events in thefluorescence signal (0.56 photons/pulse).
metal-to-ligand-charge-transfer (1MLCT) state, which thendecays by ultrafast intersystem crossing to the lowest excitedhigh-spin (HS) quintet state 5T2, resulting in the Fe-N bondincreasing by ∼0.2 Å from the low-spin ground state to theHS excited state. This bond elongation was determined byGawelda et al.20, 43 by analyzing the picosecond XANES andEXAFS transient spectra recorded at the Fe K absorption edge(7 keV) using the previous scheme of kHz data collection.These results serve to benchmark the present scheme.
For accurate comparison, we used a 25 mM concentra-tion of aqueous [Fe(bpy)3]2+ as in the kHz experiments.20
It should be kept in mind that it is not possible to strictlycompare the two experiments because of the 532 nm/10 psexcitation here versus the 400 nm/100 fs in the kHz experi-ments. However, given the ultrafast departure of populationfrom the MLCT states, which we previously determined to be∼150 fs,44, 45 and the fact that there is no known excited-stateabsorption at 532 nm,33, 42 the difference in excitation pulse
This article is copyrighted as indicated in the article. Reuse of AIP content is subject to the terms at: http://scitationnew.aip.org/termsconditions. Downloaded to IP:
192.33.102.90 On: Thu, 20 Feb 2014 16:19:19
063111-8 Lima et al. Rev. Sci. Instrum. 82, 063111 (2011)
0.50
0.45
0.40
0.35
0.30
0.25
0.20
0.15
0.10
0.05
0.00
-0.05
-0.10
-0.15
-0.20
.mr
oN
].u.a[ .s
bA
7.407.357.307.257.207.157.10
X-ray energy [keV]
1.4
1.2
1.0
0.8
0.6
0.4
0.2
0.0
].u.
a[
sb
A m r
oN
(a)
Ground state XAS Transient absorption signal
0.030
0.025
0.020
0.015
0.010
0.005
0.000
-0.005
mro
N].u.a[ sb
A
7.1207.1187.1167.1147.1127.110
X-ray energy [a.u.]
0.16
0.14
0.12
0.10
0.08
0.06
0.04
0.02
].u.
a[
sb
A .
mro
N
(b)
Ground state XAS Transient absorption signal
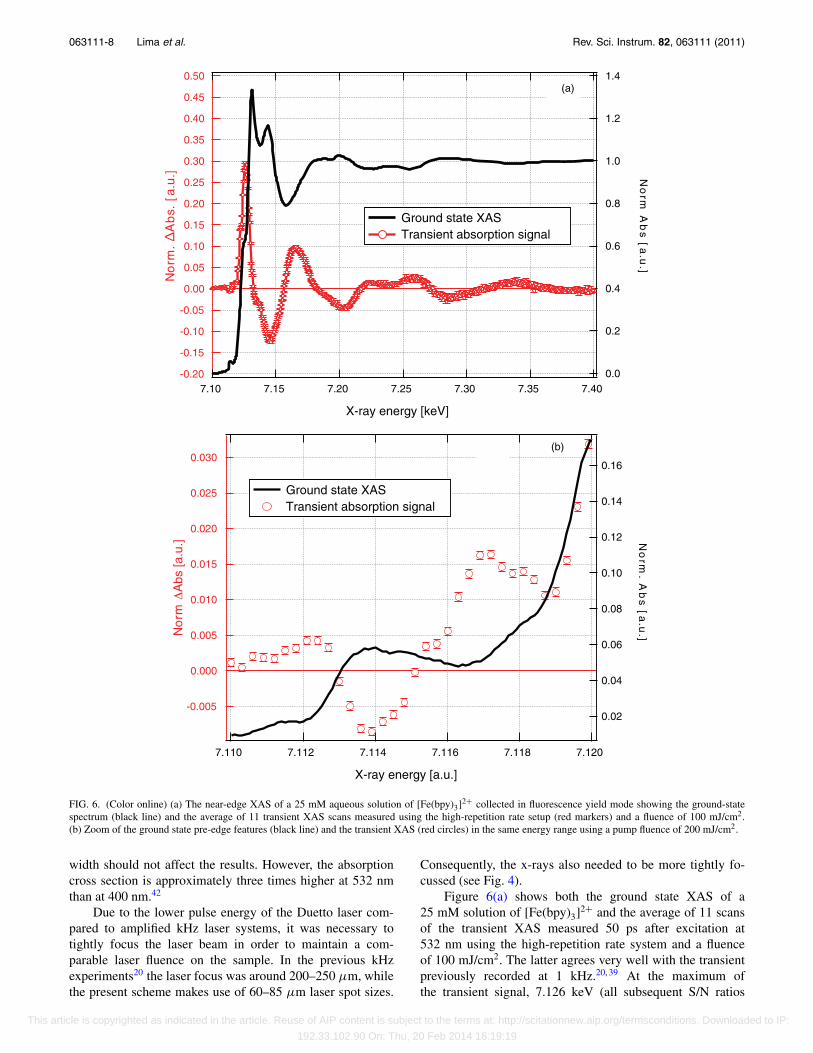
FIG. 6. (Color online) (a) The near-edge XAS of a 25 mM aqueous solution of [Fe(bpy)3]2+ collected in fluorescence yield mode showing the ground-statespectrum (black line) and the average of 11 transient XAS scans measured using the high-repetition rate setup (red markers) and a fluence of 100 mJ/cm2.(b) Zoom of the ground state pre-edge features (black line) and the transient XAS (red circles) in the same energy range using a pump fluence of 200 mJ/cm2.
width should not affect the results. However, the absorptioncross section is approximately three times higher at 532 nmthan at 400 nm.42
Due to the lower pulse energy of the Duetto laser com-pared to amplified kHz laser systems, it was necessary totightly focus the laser beam in order to maintain a com-parable laser fluence on the sample. In the previous kHzexperiments20 the laser focus was around 200–250 μm, whilethe present scheme makes use of 60–85 μm laser spot sizes.
Consequently, the x-rays also needed to be more tightly fo-cussed (see Fig. 4).
Figure 6(a) shows both the ground state XAS of a25 mM solution of [Fe(bpy)3]2+ and the average of 11 scansof the transient XAS measured 50 ps after excitation at532 nm using the high-repetition rate system and a fluenceof 100 mJ/cm2. The latter agrees very well with the transientpreviously recorded at 1 kHz.20, 39 At the maximum ofthe transient signal, 7.126 keV (all subsequent S/N ratios
This article is copyrighted as indicated in the article. Reuse of AIP content is subject to the terms at: http://scitationnew.aip.org/termsconditions. Downloaded to IP:
192.33.102.90 On: Thu, 20 Feb 2014 16:19:19

063111-9 Lima et al. Rev. Sci. Instrum. 82, 063111 (2011)
7.247.227.207.187.167.147.127.10
X-ray energy [keV]
(a)
7.247.227.207.187.167.147.127.10
X-ray energy [keV]
(b)
FIG. 7. (Color online) Representative single scans of the near-edge transient XAS of a 25 mM aqueous solution of [Fe(bpy)3]2+, in transmission (a) andfluorescence (b) modes, collected using both the kHz (red circles) and high-repetition rate (black line) data acquisition techniques.
refer to the signal at this energy), we obtain a S/N � 158in fluorescence mode, and 142 transmission mode. Thistranslates to a S/N � 45 per scan in both modes. Increasingthe laser fluence to 200 mJ/cm2, a value closer to that usedin the kHz experiments, the S/N per scan increases to ∼70 inboth modes. Comparisons of single scans taken using the twodifferent techniques are shown in Fig. 7.
Since the Fe K-edge XAS spectrum of the laser-excited[Fe(bpy)3]2+ is known,20 it is possible to extract the excited-state population by subtracting the unexcited spectrum (low
spin) from the laser-excited spectrum (high spin). The excitedstate spectrum is related to the measured transient XAS, thefraction of excited species and the unexcited spectrum via thefollowing equation:20, 43
�Abs(E, t) = f (t)[Ap(E, t) − Aunp(E)
], (3)
with f (t) being the fractional population of the excited stateat a given time delay, Ap and Aunp the laser pumped and un-pumped normalized XAS spectra of the sample being stud-ied, respectively. We then extract an excitation yield of 60%
This article is copyrighted as indicated in the article. Reuse of AIP content is subject to the terms at: http://scitationnew.aip.org/termsconditions. Downloaded to IP:
192.33.102.90 On: Thu, 20 Feb 2014 16:19:19

063111-10 Lima et al. Rev. Sci. Instrum. 82, 063111 (2011)
0.5
0.4
0.3
0.2
0.1
0.0
-0.1
-0.2
.mr
oN
].u.a[ .s
bA
7.207.187.167.147.127.10
X-ray energy [keV]
0.04
0.02
0.00
-0.02
.mr
oN
].u.a[ .s
bA
7.147.137.127.11X-ray energy [keV]
FIG. 8. (Color online) Average of 10 transient XAS scans 50 ps after excitation, of a 1 mM [Fe(bpy)3]2+ solution excited with a pump fluence of 150 mJ/cm2.The inset shows a single transient XAS scan of a 25 mM aqueous solution of [Fe(bpy)3]2+ at 50 ps delay and collected in fluorescence yield mode with a pumpfluence of 13 mJ/cm2.
for the 25 mM sample excited with 100 mJ/cm2. When us-ing a laser fluence of 200 mJ/cm2 the derived excitationyield increases to 80%–90%. This value is over three timeslarger than the previously reported 22% achieved in the kHzexperiments,20, 43 and can be explained by the approximatelythree times larger optical absorption coefficient at 532 nmcompared to at 400 nm, and by the fact that the longer ex-citation pulse duration of 10 ps compared to 100 fs results inless nonlinear excitation of the solvent39 and more efficientexcitation of the sample.
We can now attempt a more quantitative estimate of thegain in S/N at 520 kHz compared to 1 kHz. The S/N is propor-tional to the excitation yield, the square root of the incomingx-ray flux and the repetition rate of the laser. Therefore thegain in S/N is given by the ratio:
(S/N)520 kHz
(S/N)1 kHz� 70%
22%
√I 520 kHzx-ray
I 1 kHzx-ray
√520
1, (4)
where we have taken as average photolysis yield (70%) fromthe above estimates. Estimating the difference in x-ray fluxbetween the former 1 kHz experiments and the present onesis not straightforward; however, we estimate an approximatefactor of 8 decrease between the two experiments, due todifferences in the beamline setup.46 Thus the factor of threehigher photolysis yield is compensated for by the decrease inx-ray flux. We conclude that the increase in S/N mainly scaleswith the square root of the increase in repetition rate.
Figure 6(b) shows a zoom of the pre-edge region. Theblack curve shows the ground-state pre-edge signal while themarkers show the transient XAS measured using a fluence of
200 mJ/cm2. The pre-edge features correspond to the dipole-forbidden 1s → 3d bound-bound transitions and are sensitiveto the spin-state of the molecule.47 Since these features areless than 1% of the absorption edge jump, very high signal-to-noise is required to resolve them.48 As expected for an octa-hedrally coordinated low-spin Fe2+ metal center the ground-state shows a clear absorption peak corresponding to the 1s →3d(eg) transition (7.1135 keV). Upon excitation to the high-spin state, we see an increase in absorption at lower energiescorresponding to the 1s → 3d(t2g) transition (7.1125 keV) anda decrease at higher energies as the 3d(eg) levels are populatedin the high-spin state (7.114 keV). There is also an increasein absorption at higher energies (7.117 keV) in a region ofthe spectrum where peaks have been tentatively assigned toedge transitions.47 These pre-edge features were also seen byNozawa et al. using kHz laser excitation48 but the increasedS/N in the present experiments allow us to perform a lineshape analysis which will be presented in a forthcoming pub-lication.
Given the gain in S/N, we can now decrease the sampleconcentration and/or the laser excitation fluence. Figure 8shows the average of 10 individual scans of the transientXAS measured in FY mode of a 1 mM solution of aqueous[Fe(bpy)3]2+. This measurement was taken with a fluenceof 150 mJ/cm2 and both transmission and FY data wererecorded simultaneously at 50 ps after excitation. The totalacquisition time for the data shown was about 1 h, yieldingS/N � 4.6 per scan in fluorescence and S/N � 3 in trans-mission. The inset to Fig. 8 shows the transient XAS signalin FY mode of a 25 mM solution of aqueous [Fe(bpy)3]2+,again at 50 ps time delay, but excited with only 13 mJ/cm2.
This article is copyrighted as indicated in the article. Reuse of AIP content is subject to the terms at: http://scitationnew.aip.org/termsconditions. Downloaded to IP:
192.33.102.90 On: Thu, 20 Feb 2014 16:19:19

063111-11 Lima et al. Rev. Sci. Instrum. 82, 063111 (2011)
In the limit of low laser fluence, we are still able to measurea time-resolved signal with a S/N � 8 in a single scan. Theresults of Fig. 8 show that we can now measure very diluteor photochemically unstable samples within reasonable dataacquisition times, opening the way for the investigation ofbiological samples under physiological conditions.
B. Ruthenium tris-bipyridine
One of the advantages of the high-repetition rate setupis its portability. The tender x-ray beamline PHOENIX Ihas recently come online at the SLS enabling us to measurecore transitions of species not covered by the hard x-raymicroXAS beamline. In order to ascertain the feasibility ofsuch low x-ray energy measurements we chose to investigate[Ru(bpy)3]2+ which we previously characterized by ps XASat the Advanced Light Source (ALS, Berkeley, USA).16, 49
Ruthenium tris-bipyridine is a model system for intramolecu-lar electron transfer reactions and is representative of a largeclass of compounds for applications in solar energy conver-sion. Upon visible-UV excitation at either 355 or 532 nm,one reaches the 1MLCT (metal-to-ligand-charge-transfer)state, which decays to the long-lived (several hundred nsin room temperature aqueous solutions50) 3MLCT stateon ultrafast timescales.34 The lifetime of the 3MLCT statecan be reduced by the presence of oxygen in the solvent.38
In the MLCT state the electron is localized on one of thebipyridine ligands: [RuIII(bpy−)(bpy)2]2+.51 Exciting at532 nm reaches the red wing of the absorption, but it has theadvantage of not being reabsorbed by the 3MLCT state.50
Exciting at 355 nm has the advantage of a larger absorptioncross section, resulting in a higher excitation probability, butthere is a strong ligand-centered excited state absorption at355 nm in the 3MLCT which may result in sequentialtwo-photon absorption. The lifetime of this state is <10 ps,meaning we are not probing it at 50 ps, but the potentialexists for other excited photoproducts to occur, includingboth [Ru(bpy)3]+ and [Ru(bpy)3]3+.50 By probing the systemat the Ru L2,3 edges (2.8–3 keV) in picosecond experimentsat 1 kHz, an oxidation state-induced change in the ionizationpotential of 1.8 eV was detected and a Ru–N bond contractionof ∼0.03 Å was derived.49, 52
Excitation of an 80 mM sample of [Ru(bpy)3]2+ at532 nm with a fluence of 115 mJ/cm2 yield the two-dimensional time-energy plot of Fig. 9. The data werecollected as monochromator energy scans around the Ru-L3
edge and taken with time steps of 12 ns out to 200 ns afterexcitation. Each energy scan represents the average of 4individual scans and the total data acquisition time requiredwas 2 h. From Fig. 9 it is clear that, within the signal-to-noise, the transient difference signal appears to simply decayin amplitude with no energy shifts over the course of itsrelaxation, confirming that we are probing the lifetime of the3MLCT state. Neither the ground-state XAS nor the transientindicate the presence of any photoproducts, permanent orphotoexcited, other than the expected [RuIII(bpy−)(bpy)2]2+.The timescale of the excited-state relaxation is 107 ± 16 ns,typical of a high-concentration solution with oxygen
200
150
100
50
0
]sn[ e
miT
284428422840283828362834
X-ray energy [eV]
4
3
2
1
0 ].u.
a[ s
bA
.m r
oN
286028552850284528402835283028252820
X-ray energy [eV]
-20x10-3
-10
0
10
].u.a[ sbA
-0.020
-0.015
-0.010
-0.005
0.000
0.005
0.010
0.015
].u.a[ sbA
FIG. 9. (Color online) Top: Comparison between the ground-state XAS(black line) and transient XAS (red circles) measured 175 ps after time zero atthe Ru L3 edge of an 80 mM solution of [Ru(bpy)3]2+ excited at 532 nm witha fluence of 115 mJ/cm2. Note that the pre-edge signal on the ground-stateXAS, from 2825 to 2830 eV, is the Cl K-edge absorption of the counter-ion.Bottom: Two-dimensional time-energy XAS measured under the same con-ditions.
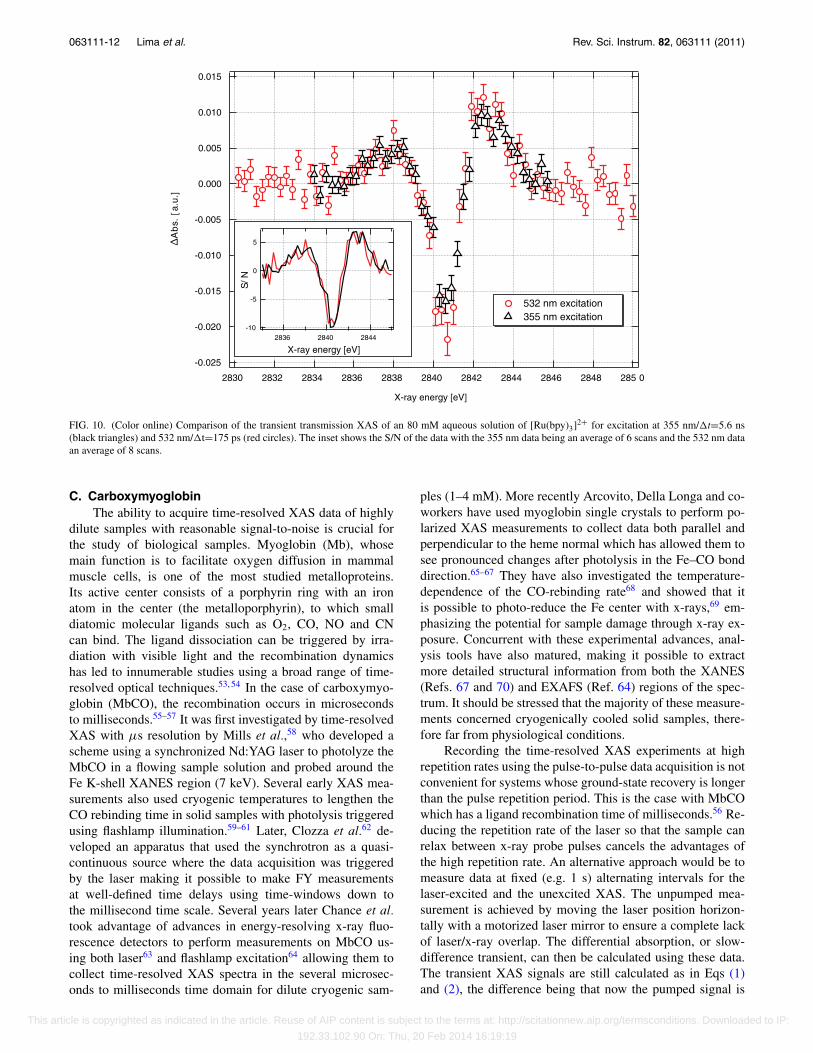
content.38 Figure 10 shows a transient energy scan comparingexcitation at 532 (�t = 175 ps, average of 8 scans) and355 nm (�t = 5.6 ns, average of 6 scans). Both signals showthe expected decrease/increase in absorption at 2841/2843 eVdue to oxidation of the Ru atom from 2+ to 3+. The absorp-tion increase at 2838 eV is due to the creation of a hole in theRu d(t2g) orbital, which can be accessed from the 2p3/2 coreorbital when an electron is transferred to the ligand.16, 18, 49
The fluence at 532 nm was 115 mJ/cm2 while for 355 nmit was 86 mJ/cm2. The differential absorption change issimilar for the two signals. The absorption cross sectionat 532 nm is approximately 3–4 times lower than that at355 nm, however due to the high concentration of the sample(80 mM) the optical density of the 100 μm jet is around 1 for532 nm.
These proof-of-principle results illustrate the portabilityof the high-repetition rate system over the amplified kHz sys-tem. The primary challenge to moving to lower x-ray energiesis the loss of photons to solvent scattering and absorption. Thex-ray transmission through a 100 μm jet of pure water is lessthan 15% at photon energies below 3 keV, making absorptionexperiments increasingly difficult. Clearly the ability to takedata at MHz repetition rates is a distinct advantage for this en-ergy range as the faster data acquisition in part compensatesfor the loss in x-ray flux.
This article is copyrighted as indicated in the article. Reuse of AIP content is subject to the terms at: http://scitationnew.aip.org/termsconditions. Downloaded to IP:
192.33.102.90 On: Thu, 20 Feb 2014 16:19:19
063111-12 Lima et al. Rev. Sci. Instrum. 82, 063111 (2011)
-0.025
-0.020
-0.015
-0.010
-0.005
0.000
0.005
0.010
0.015
].u.a[ .s
bA
285 02848284628442842284028382836283428322830
X-ray energy [eV]
-10
-5
0
5N/
S
284428402836
X-ray energy [eV]
532 nm excitation 355 nm excitation
FIG. 10. (Color online) Comparison of the transient transmission XAS of an 80 mM aqueous solution of [Ru(bpy)3]2+ for excitation at 355 nm/�t=5.6 ns(black triangles) and 532 nm/�t=175 ps (red circles). The inset shows the S/N of the data with the 355 nm data being an average of 6 scans and the 532 nm dataan average of 8 scans.
C. CarboxymyoglobinThe ability to acquire time-resolved XAS data of highly
dilute samples with reasonable signal-to-noise is crucial forthe study of biological samples. Myoglobin (Mb), whosemain function is to facilitate oxygen diffusion in mammalmuscle cells, is one of the most studied metalloproteins.Its active center consists of a porphyrin ring with an ironatom in the center (the metalloporphyrin), to which smalldiatomic molecular ligands such as O2, CO, NO and CNcan bind. The ligand dissociation can be triggered by irra-diation with visible light and the recombination dynamicshas led to innumerable studies using a broad range of time-resolved optical techniques.53, 54 In the case of carboxymyo-globin (MbCO), the recombination occurs in microsecondsto milliseconds.55–57 It was first investigated by time-resolvedXAS with μs resolution by Mills et al.,58 who developed ascheme using a synchronized Nd:YAG laser to photolyze theMbCO in a flowing sample solution and probed around theFe K-shell XANES region (7 keV). Several early XAS mea-surements also used cryogenic temperatures to lengthen theCO rebinding time in solid samples with photolysis triggeredusing flashlamp illumination.59–61 Later, Clozza et al.62 de-veloped an apparatus that used the synchrotron as a quasi-continuous source where the data acquisition was triggeredby the laser making it possible to make FY measurementsat well-defined time delays using time-windows down tothe millisecond time scale. Several years later Chance et al.took advantage of advances in energy-resolving x-ray fluo-rescence detectors to perform measurements on MbCO us-ing both laser63 and flashlamp excitation64 allowing them tocollect time-resolved XAS spectra in the several microsec-onds to milliseconds time domain for dilute cryogenic sam-
ples (1–4 mM). More recently Arcovito, Della Longa and co-workers have used myoglobin single crystals to perform po-larized XAS measurements to collect data both parallel andperpendicular to the heme normal which has allowed them tosee pronounced changes after photolysis in the Fe–CO bonddirection.65–67 They have also investigated the temperature-dependence of the CO-rebinding rate68 and showed that itis possible to photo-reduce the Fe center with x-rays,69 em-phasizing the potential for sample damage through x-ray ex-posure. Concurrent with these experimental advances, anal-ysis tools have also matured, making it possible to extractmore detailed structural information from both the XANES(Refs. 67 and 70) and EXAFS (Ref. 64) regions of the spec-trum. It should be stressed that the majority of these measure-ments concerned cryogenically cooled solid samples, there-fore far from physiological conditions.
Recording the time-resolved XAS experiments at highrepetition rates using the pulse-to-pulse data acquisition is notconvenient for systems whose ground-state recovery is longerthan the pulse repetition period. This is the case with MbCOwhich has a ligand recombination time of milliseconds.56 Re-ducing the repetition rate of the laser so that the sample canrelax between x-ray probe pulses cancels the advantages ofthe high repetition rate. An alternative approach would be tomeasure data at fixed (e.g. 1 s) alternating intervals for thelaser-excited and the unexcited XAS. The unpumped mea-surement is achieved by moving the laser position horizon-tally with a motorized laser mirror to ensure a complete lackof laser/x-ray overlap. The differential absorption, or slow-difference transient, can then be calculated using these data.The transient XAS signals are still calculated as in Eqs (1)and (2), the difference being that now the pumped signal is
This article is copyrighted as indicated in the article. Reuse of AIP content is subject to the terms at: http://scitationnew.aip.org/termsconditions. Downloaded to IP:
192.33.102.90 On: Thu, 20 Feb 2014 16:19:19

063111-13 Lima et al. Rev. Sci. Instrum. 82, 063111 (2011)
2.5x10⁻³
2.0
1.5
1.0
0.5
0.0
-0.5
-1.0
].u.a[ .s
bA
7.357.307.257.207.157.10
X-ray energy [keV]
20
15
10
5
0
-5
-10
N/S
7.207.187.167.147.127.10X-ray energy [keV]
(a)
shot-to-shot mode slow-difference mode
6x10⁻³
5
4
3
2
1
0
-1
-2
-3
-4
].u.a[ .s
bA
7.357.307.257.207.157.10
X-ray energy [keV]
(b)
shot-to-shot mode slow-difference mode
FIG. 11. (Color online) Comparison of the transient XAS signal of a single measurement of a 7 mM aqueous solution of [Fe(bpy)3]2+ excited with150 mJ/cm2 laser fluence, using the pulse-to-pulse and the slow-difference modes in fluorescence (a) and transmission (b). Black circles show the data col-lected using the pulse-to-pulse mode and the red circles show the data collected using the slow-difference mode. Note that both measurement modes have thesame S/N for fluorescence (see inset on (a)) while being drastically different in transmission.
defined as the signal measured when the laser and x-raysare overlapped spatially and unpumped is the signal with nooverlap.
Using this alternative scan technique, other sources ofnoise can contribute to the measured signal since the differ-ential absorption is now being calculated on a 1 s timescale asopposed to a 1 μs timescale. In order to investigate the noisecharacteristics of this slow-difference technique, we recorded
a set of transient energy spectra of a sample of 7 mM aqueous[Fe(bpy)3]2+ at 50 ps time delay using simultaneously boththe regular (pulse-to-pulse) and slow-difference scan modes,enabling a direct comparison of both scan modes under iden-tical experimental conditions.
The transient XAS data collected in fluorescence andtransmission using both modes is shown in Fig. 11. Acomparison of the transient XAS data recorded in FY mode
This article is copyrighted as indicated in the article. Reuse of AIP content is subject to the terms at: http://scitationnew.aip.org/termsconditions. Downloaded to IP:
192.33.102.90 On: Thu, 20 Feb 2014 16:19:19

063111-14 Lima et al. Rev. Sci. Instrum. 82, 063111 (2011)
0.06
0.04
0.02
0.00
-0.02
-0.04
.mroN
].u.a[ sbA
7.207.197.187.177.167.157.147.137.127.11
X-ray energy [keV]
slow difference MbCO XAS (deoxyMb - MbCO) static XAS
FIG. 12. (Color online) Transient XAS of 2 mM MbCO collected in fluorescence yield mode. The sample was excited at 125 mJ/cm2 laser fluence. The blackcurve represents the difference XAS based on the static spectra of deoxyMb and MbCO assuming an excitation yield of 21%.
using both data acquisition modes show no new sources ofnoise that can obscure the signal in the slow-difference mode.The S/N of both data sets (see inset in Fig. 11 (a)) is almostidentical from which we conclude that in the case of sam-ples having long-lived excited states, we can use the slow-difference scan mode in fluorescence to collect transient XASdata while only incurring a factor of two penalty in data ac-quisition times. The comparison of the two scan modes intransmission is shown in Fig. 11 (b). The transmission signalrecorded using the slow-difference scan reveals an enormoussource of noise which obscures the signal, in stark contrast tothe pulse-to-pulse mode. This indicates that there is an exter-nal source of noise on the 1 s time scale, which is absent onthe 1 μs timescale, and is most probably due to the flow of theliquid sample. Indeed small fluctuations in the jet flow speed,pressure and thickness easily introduce changes in the x-rayabsorption signal on the 1 s timescale resulting in large ran-dom changes in the differential absorption. This noise easilyoverwhelms the transient transmission signal and reinforcesthe importance of measuring the difference signals on a pulse-to-pulse basis. For the study of dilute samples it is preferableto use FY detection.
The averaged transient FY XAS signal of photo-excitedMbCO is shown in Fig. 12. It consists of 32 individual scansand a data collection time of 4.5 h, and was measured us-ing the slow-difference scan mode, with a laser fluence of125 mJ/cm2. It exhibits several pronounced changes in theXANES region of the spectrum, with the largest change inabsorption at 7.123 keV being due to a shift to lower-energy
of the Fe absorption edge. This transient represents the differ-ence in XAS spectra of the ligated minus the unligated pro-tein. We measured the static XAS spectra of the CO-ligatedform of myoglobin (MbCO), the unligated form of myoglobin(deoxyMb), and the unreduced form of myoglobin (metMb),as reference. After ligand photo-detachment and in the ab-sence of any intermediate structure on the time scale of themeasurement, we expect the spectrum of the photo-productto resemble that of deoxyMb. The transient spectrum shouldthen be similar to the difference spectrum of the deoxy formminus the ligated form. This difference spectrum representsa limiting case in which all the ligands are photo-detachedand no intermediate structure is present. This is a good ap-proximation for MbCO where there is almost no geminaterecombination55, 56 and no evidence of any partially boundstructural intermediates.5 A scale factor can therefore be usedwhen comparing it to the measured transient XAS, allowingus to estimate the fraction of excited species. Overlaid onthe experimental transient XAS is the difference of the de-oxy static spectrum minus the MbCO static spectrum whichhas been scaled by a factor of 0.21 for comparison, imply-ing an excitation yield of ∼21%. Because the measurementswere done using the slow-difference scan mode, the time de-lay is not well defined. Since the time interval between con-secutive laser pump pulses at 520 kHz is 2 μs, the excited-state population is an ensemble composed of the population at50 ps, which is the time delay set between the pump andprobe pulses, and 2 μs, which is the time interval between twoconsecutive laser pulses. In essence every laser pump pulse
This article is copyrighted as indicated in the article. Reuse of AIP content is subject to the terms at: http://scitationnew.aip.org/termsconditions. Downloaded to IP:
192.33.102.90 On: Thu, 20 Feb 2014 16:19:19

063111-15 Lima et al. Rev. Sci. Instrum. 82, 063111 (2011)
excites a sample which is only partially relaxed, leading to alarger average population of deoxyMb than would exist aftera single excitation pulse.
Comparing the measured transient signal with the pre-dicted difference based on the static XAS, one can see thatwithin the error bars, both signals coincide. A more detaileddiscussion of these results will be presented in a forthcomingpublication.
V. CONCLUSION AND OUTLOOK
We have developed a flexible setup for x-ray absorptionspectroscopy with <100 ps temporal resolution at MHz dataacquisition rates. Our configuration makes use of all the avail-able isolated x-ray pulses from the hybrid filling mode cur-rently employed at most third-generation synchrotrons. Thisallows the measurement of laser-induced changes on the x-ray absorption spectra of dilute samples with concentrationsof the order of a mM. We demonstrate the ability of the setupto perform shot noise limited measurements with an increasein S/N of the order of � √
fL where fL is the repetition rateof the laser pump (520 kHz), compared to the 1 kHz data ac-quisition techniques. The portability of the setup has also beendemonstrated on a tender x-ray beamline. As a final test of thehigh-repetition rate data acquisition technique we also mea-sured the differential XAS of a dilute solution of carboxymyo-globin.
The temporal resolution is limited at present by the dura-tion of the synchrotron x-ray pulses. This can be improved toa few picoseconds using the so-called “low-alpha” mode71–73
available at several third-generation synchrotron sources. Themoderate decrease in x-ray flux is compensated for by thehigher repetition rate, providing intermediate temporal reso-lution between the hundreds of ps obtained directly from syn-chrotrons and hundreds of fs from the electron-laser slicingscheme.74 Finally, the simplicity of the present scheme meansthat it can be implemented at any synchrotron beamline, andextended to any time-resolved x-ray technique (absorption,emission, or diffraction).
ACKNOWLEDGMENTS
We thank Dr. Gaudenz Jud, Mr. A. Oggenfuss, Mr. BeatMeyer, and Mr. R. Wetter for their assistance during thisproject and Drs. W. Gawelda and M. Johnson for fruitful dis-cussions. This work was financed by the FNS via ContractNos. 200020-12723, 200021-116394, and 206021-117401and the NCCR MUST.
1M. Chergui and A. H. Zewail, ChemPhysChem 10, 28 (2009).2S. L. Johnson, P. Beaud, E. Vorobeva, C. J. Milne, E. D. Murray, S. Fahy,and G. Ingold, Acta Crystallogr. A 66, 157 (2010).
3T. Elsaesser and M. Woerner, Acta Crystallogr. A 66, 168 (2010).4P. Beaud, S. L. Johnson, E. Vorobeva, U. Staub, R. A.D. Souza, C. J. Milne,Q. X. Jia, and G. Ingold, Phys. Rev. Lett. 103, 155702 (2009).
5F. Schotte, M. Lim, T. Jackson, A. Smirnov, J. Soman, J. Olson, G. Phillips,M. Wulff, and P. A. Anfinrud, Science 300, 1944 (2003).
6S. Bratos and M. Wulff, Adv. Chem. Phys. 137, 1 (2008).7T. K. Kim, J. H. Lee, M. Wulff, Q. Kong, and H. Ihee, ChemPhysChem 10,1958 (2009).
8C. Bressler and M. Chergui, Chem. Rev. 104, 1781 (2004).
9L. Chen, Angew. Chem., Int. Ed. 43, 2886 (2004).10L. X. Chen, X. Zhang, J. V. Lockard, A. B. Stickrath, K. Attenkofer,
G. Jennings, and D.-J. Liu, Acta Crystallogr. A 66, 240 (2010).11C. Bressler, R. Abela, and M. Chergui, Z Kristallogr. 223, 307 (2008).12C. Bressler and M. Chergui, Annu. Rev. Phys. Chem. 61, 263 (2010).13M. Chergui, Acta Crystallogr. A 66, 229 (2010).14L. X. Chen, J. Electron Spectrosc. 119, 161 (2001).15L. X. Chen, G. Jennings, T. Liu, D. Gosztola, J. Hessler, D. Scaltrito, and
G. Meyer, J. Am. Chem. Soc. 124, 10861 (2002).16M. Saes, C. Bressler, R. Abela, D. Grolimund, S. L. Johnson, P. A.
Heimann, and M. Chergui, Phys. Rev. Lett. 90, 047403 (2003).17M. Saes, F. van Mourik, W. Gawelda, M. Kaiser, M. Chergui, C. Bressler,
D. Grolimund, R. Abela, T. E. Glover, P. A. Heimann, R. W. Schoenlein,S. L. Johnson, A. M. Lindenberg, and R. W. Falcone, Rev. Sci. Instrum. 75,24 (2004).
18W. Gawelda, C. Bressler, M. Saes, M. Kaiser, A. N. Tarnovsky,D. Grolimund, S. L. Johnson, R. Abela, and M. Chergui, Phys. Scr. T115,102 (2005).
19M. Khalil, M. A. Marcus, A. L. Smeigh, J. K. McCusker, H. H.W. Chong,and R. W. Schoenlein, J. Phys. Chem. A 110, 38 (2006).
20W. Gawelda, V.-T. Pham, M. Benfatto, Y. Zaushitsyn, M. Kaiser,D. Grolimund, S. L. Johnson, R. Abela, A. Hauser, C. Bressler, and M.Chergui, Phys. Rev. Lett. 98, 4 (2007).
21V.-T. Pham, W. Gawelda, Y. Zaushitsyn, M. Kaiser, D. Grolimund, S. L.Johnson, R. Abela, C. Bressler, and M. Chergui, J. Am. Chem. Soc. 129,1530 (2007).
22L. X. Chen, X. Zhang, E. C. Wasinger, K. Attenkofer, G. Jennings,A. Z. Muresan, and J. S. Lindsey, J. Am. Chem. Soc. 129, 9616(2007).
23C. G. Elles, I. A. Shkrob, R. A. Crowell, D. A. Arms, and E. C. Landahl,J. Chem. Phys. 128, 061102 (2008).
24R. M. van der Veen, C. J. Milne, A. E. Nahhas, F. Lima, V.-T. Pham,J. Best, J. A. Weinstein, C. N. Borca, R. Abela, C. Bressler, and M. Chergui,Angew. Chem., Int. Ed. 48, 2711 (2009).
25N. Huse, H. Wen, D. Nordlund, E. Szilagyi, D. Daranciang, T. A. Miller,A. Nilsson, R. W. Schoenlein, and A. M. Lindenberg, Phys. Chem. Chem.Phys. 11, 3951 (2009).
26H. Wen, N. Huse, R. W. Schoenlein, and A. M. Lindenberg, J. Chem. Phys.131, 234505 (2009).
27N. Huse, T. K. Kim, L. Jamula, J. K. McCusker, F. M.F. de Groot, and R.W. Schoenlein, J. Am. Chem. Soc. 132, 6809 (2010).
28N. Huse, H. Cho, K. Hong, L. Jamula, F. M.F. de Groot, T. K. Kim,J. K. McCusker, and R. W. Schoenlein, J. Phys. Chem. Lett. 2, 880(2011).
29W. Widdra, D. Brocker, T. Giessel, I. Hertel, W. Kruger, A. Liero, F. Noack,V. Petrov, D. Pop, P. Schmidt, R. Weber, I. Will, and B. Winter, Surf. Sci.543, 87 (2003).
30T. Giessel, D. Brocker, P. Schmidt, and W. Widdra, Rev. Sci. Instrum. 74,4620 (2003).
31E. Stern and D. Brewe, AIP Conf. Proc. 882, 24 (2007).32D. Brewe, S. Heald, E. Stern, K. Beck, and Y. Feng, AIP Conf. Proc. 705,
1399 (2004).33A. Cannizzo, C. J. Milne, C. Consani, W. Gawelda, C. Bressler, F. van
Mourik, and M. Chergui, Coord. Chem. Rev. 254, 2677 (2009).34A. Cannizzo, F. van Mourik, W. Gawelda, G. Zgrablic, C. Bressler, and
M. Chergui, Angew. Chem. Int. Ed. 45, 3174 (2006).35P. Beaud, S. L. Johnson, A. Streun, R. Abela, D. Abramsohn,
D. Grolimund, F. S. Krasniqi, T. Schmidt, V. Schlott, and G. Ingold, Phys.Rev. Lett. 99, 174801 (2007).
36C. Borca, D. Grolimund, M. Willimann, B. Meyer, K. Jefimovs, J. Coma-mala, and C. David, J. Phys.: Conf. Ser. 186, 012003 (2009).
37C. Bressler, M. Saes, M. Chergui, D. Grolimund, R. Abela, and P. Pattison,J. Chem. Phys. 116, 2955 (2002).
38M. Saes, Picosecond X-ray absorption spectroscopy: application to coor-dination chemistry compounds in solution, Ph.D. thesis, (Ecole Polytech-nique Fédérale de Lausanne, 2004).
39W. Gawelda, Time-resolved x-ray absorption spectroscopy of transitionmetal complexes, Ph.D. thesis, (Ecole Polytechnique Fédérale de Lau-sanne, 2006).
40E. Antonini and M. Brunori, Hemoglobin and Myoglobin in Their Reac-tions With Ligands, edited by N.-H. P. Company (North-Holland:London,1971).
41M. Lim, T. Jackson, and P. A. Anfinrud, J. Am. Chem. Soc. 126, 7946(2004).
This article is copyrighted as indicated in the article. Reuse of AIP content is subject to the terms at: http://scitationnew.aip.org/termsconditions. Downloaded to IP:
192.33.102.90 On: Thu, 20 Feb 2014 16:19:19

063111-16 Lima et al. Rev. Sci. Instrum. 82, 063111 (2011)
42W. Gawelda, A. Cannizzo, V.-T. Pham, F. van Mourik, C. Bressler, and M.Chergui, J. Am. Chem. Soc. 129, 8199 (2007).
43W. Gawelda, V.-T. Pham, R. M. van der Veen, D. Grolimund, R. Abela, M.Chergui, and C. Bressler, J. Chem. Phys. 130, 124520 (2009).
44C. Bressler, C. J. Milne, V.-T. Pham, A. E. Nahhas, R. M. van der Veen, W.Gawelda, S. L. Johnson, P. Beaud, D. Grolimund, M. Kaiser, C. N. Borca,G. Ingold, R. Abela, and M. Chergui, Science 323, 489 (2009).
45C. Consani, M. Prémont-Schwarz, A. E. Nahhas, C. Bressler, F. vanMourik, A. Cannizzo, and M. Chergui, Angew. Chem., Int. Ed. 48, 7184(2009).
46A factor of two from tighter x-ray focussing, a factor of two frommonochromator changes and a factor of two from the air path.
47T. Westre, P. Kennepohl, J. DeWitt, B. Hedman, K. Hodgson, and E.Solomon, J. Am. Chem. Soc. 119, 6297 (1997).
48S. Nozawa, T. Sato, M. Chollet, K. Ichiyanagi, A. Tomita, H. Fujii, S.-i.Adachi, and S. ya Koshihara, J. Am. Chem. Soc. 132, 61 (2010).
49W. Gawelda, M. Johnson, F. M.F. de Groot, R. Abela, C. Bressler, andM. Chergui, J. Am. Chem. Soc. 128, 5001 (2006).
50A. N. Tarnovsky, W. Gawelda, M. Johnson, C. Bressler, and M. Chergui,J. Phys. Chem. B 110, 26497 (2006).
51M.-E. Moret, I. Tavernelli, M. Chergui, and U. Rothlisberger, Chem. Eur.J. 16, 5889 (2010).
52M. Benfatto, S. D. Longa, K. Hatada, K. Hayakawa, W. Gawelda,C. Bressler, and M. Chergui, J. Phys. Chem. B 110, 14035 (2006).
53J. Martin and M. H. Vos, Annu. Rev. Biophys. Biomol. 21, 199 (1992).54M. H. Vos, Bba-Bioenergetics 1777, 15 (2008).55E. Henry, J. Sommer, J. Hofrichter, and W. Eaton, J. Mol. Biol. 166, 443
(1983).56W. Tian, J. Sage, V. Srajer, and P. Champion, Phys. Rev. Lett. 68, 408
(1992).57M. Walther, V. Raicu, J. Ogilvie, R. Phillips, R. Kluger, and R. J. D. Miller,
J. Phys. Chem. B 109, 20605 (2005).58D. M. Mills, A. Lewis, A. Harootunian, J. Huang, and B. Smith, Science
223, 811 (1984).59B. Chance, R. Fischetti, and L. Powers, Biochemistry 22, 3820
(1983).
60L. Powers, B. Chance, M. Chance, B. Campbell, J. Friedman, S. Khalid,C. Kumar, A. Naqui, K. Reddy, and Y. Zhou, Biochemistry-Us 26, 4785(1987).
61T. Teng, H. Huang, and G. Olah, Biochemistry-Us 26, 8066 (1987).62A. Clozza, A. Castellano, S. D. Longa, A. Giovannelli, and A. Bianconi,
Rev. Sci. Instrum. 60, 2519 (1989).63M. Chance, M. Wirt, E. Scheuring, L. Miller, A. Xie, and D. Sidelinger,
Rev. Sci. Instrum. 64, 2035 (1993).64M. Chance, L. Miller, R. Fischetti, E. Scheuring, W. Huang, B. Sclavi,
Y. Hai, and M. Sullivan, Biochemistry-Us 35, 9014 (1996).65A. Arcovito, C. Ardiccioni, M. Cianci, P. D’Angelo, B. Vallone, and S. D.
Longa, J. Phys. Chem. B 114, 13223 (2010).66S. D. Longa, A. Arcovito, B. Vallone, A. Castellano, R. Kahn, J. Vicat,
Y. Soldo, and J. Hazemann, J. Synchrotron Radiat. 6, 1138 (1999).67S. D. Longa, A. Arcovito, M. Girasole, J. Hazemann, and M. Benfatto,
Phys. Rev. Lett. 87, 155501 (2001).68A. Arcovito, D. Lamb, G. U. Nienhaus, J. Hazemann, M. Benfatto, and
S. D. Longa, Biophys. J. 88, 2954 (2005).69S. D. Longa, A. Arcovito, M. Benfatto, A. Congiu-Castellano, M. Girasole,
J. Hazemann, and A. L. Bosco, Biophys. J. 85, 549 (2003).70M. Benfatto, S. D. Longa, and C. Natoli, J. Synchrotron Radiat. 10, 51
(2003).71D. Robin, R. Alvis, A. Jackson, and R. Holtzapplet, Micro Bunches: A
Workshop on the Production, Measurement and Applications of ShortBunches of Electrons and Positrons in Linacs and Storage Rings, Upton,L.I., New York, 1995.
72M. Abo-Bakr, J. Feikes, K. Holldack, P. Kuske, W. Peatman, U.Schade, G. Wustefeld, and H. Hubers, Phys. Rev. Lett. 90, 094801(2003).
73X. Huang, J. Safranek, J. Corbett, Y. Nosochkov, J. Sebek, and A. Terebilo,Proceedings of the 2007 IEEE Particle Accelerator Conference (PAC 07).25-29 Jun 2007, Albuquerque, New Mexico. 22nd IEEE Particle Accelera-tor Conference, p. 1308.
74R. W. Schoenlein, S. Chattopadhyay, H. H.W. Chong, T. E. Glover, P. A.Heimann, C. Shank, A. Zholents, and M. S. Zolotorev, Science 287, 2237(2000).
This article is copyrighted as indicated in the article. Reuse of AIP content is subject to the terms at: http://scitationnew.aip.org/termsconditions. Downloaded to IP:
192.33.102.90 On: Thu, 20 Feb 2014 16:19:19