a handbook for stormwater reclamation and reuse...
TRANSCRIPT

A Handbook for Stormwater
Reclamation and Reuse Best Management Practices
in Hawaii
December 2008

The Hawaii Commission on Water Resource Management gratefully acknowledges the funding support of the
U. S. Department of the Interior Bureau of ReclamationLower Colorado Region for development of this handbook.

i
Table of Contents List of Acronyms ..................................................................................... ii Introduction .............................................................................................1 Individual Homes ....................................................................................8 Neighborhoods........................................................................................9 Commercial/Institutional ......................................................................10 Green Space/Recreational....................................................................11 Rural/Agricultural ..................................................................................12 Best Management Practices ................................................................14

ii
Acronyms
ASR Aquifer Storage and Recovery BMP Best Management Practice BOD 5-day Biochemical Oxygen Demand DOH Department of Health HSG Hydrologic Soils Group In/hr Inches per hour LEED Leadership in Energy and Environmental Design LID Low Impact Development mg/l milligrams per liter NOx Total Oxidized Nitrogen (nitrate + nitrite) NRCS National Resources Conservation Services O&M Operation and Maintenance TN Total Nitrogen TP Total Phosphorus TPH Total Petroleum Hydrocarbons TSS Total Suspended Solids U.H.M. University of Hawaii at Manoa UIC Underground Injection Control US EPA United States Environmental Protection Agency USGS U.S. Geological Survey

1
Introduction Hawaii’s groundwater aquifers store some of the highest quality source water in the world. These aquifers are recharged by rain water that percolates through volcanic soil, providing a natural means of filtration that improves the water’s purity. Hawaii’s aquifers provide the vast majority of potable (drinking) and nonpotable (e.g., irrigation) water supplies. As residential and commercial development occurs on all our islands, the potential for affecting our high-purity aquifers increases. Development has several impacts on Hawaii’s supply of fresh water. It short-circuits the water cycle by increasing the amount of impervious surface in stormwater catchment areas, thus decreasing infiltration and groundwater recharge. Development also increases the number of water users, which places additional demand on the finite quantity of potable water in our aquifers, and increases the potential for more contaminants to enter all Hawaii’s water resources This combination of factors leads to the drawdown of the aquifers that supply some of the best quality drinking water in the world. Traditional approaches to development also affect other aspects of our islands’ environment. The reduction of rainfall infiltration has led to an increase in stormwater runoff, which impacts the water quality of inland streams and our near-shore coastal waters with sediment and other pollutants. Increased stormwater runoff during significant rainfall events can also result in flooding, which can cause property damage and threaten life and safety. One inch of rainfall on a 1,000 square foot impervious surface--typical of a single family residence--will generate approximately 600 gallons of runoff. The following table presents the total annual average precipitation values for several cities in Hawaii along with potential capture amounts from 1,000 square feet of impervious surface.

2
City Total Avg. Precipitation, inches / year
Potential Capture from 1,000 sq ft, gallons / year
Honolulu 22.2 13,505 Aiea 22.2 13,505 Kaneohe 76.3 46,416 Kahului 21.1 12,836 Hana 83.4 50,735 Lahaina 17.1 10,403 Hilo 108.0 65,700 Kamuela 63.5 38,629 Lihue 43.5 26,463 Koloa 43.5 26,463 Hanalei 43.5 26,463
The table below presents typical domestic water uses that could potentially be supplied from reclaimed stormwater thereby reducing the demand on the potable water supply and stormwater runoff to streams and oceans. Comparing the above table with the table below, it can be seen that reclamation of nonpotable stormwater applied at the household level can be potentially effective in reducing a portion of the household potable water demand. Rainwater harvesting becomes even more attractive when these results are extrapolated over a number of households in a typical neighborhood. Water Use Rate Number of
Eventsa Total Usage,
Gallons / year Car Washing
116 gallons/wash 90 washes 10,440
Lawn Watering
180 gallons / application 58 waterings 10,440
Toilet Flushing
4-7 gallons / flushb 1,500 flushes 6,000 – 10,500
a Based on Lahaina which represents the lowest rainfall capture potential b Assuming non-water conserving toilet using 7 gallons per flush
Purpose This handbook is intended to be a guide to homeowners, developers, and planners for managing stormwater as a resource rather than as a nuisance to be discharged to our streams and coastal waters. It presents alternative stormwater best management practices (BMP) and

3
technologies for new developments and for retrofits of existing developments as well as for open space, rural, and agricultural areas. Applying these technologies and practices will support groundwater sustainability, improve surface water ecosystems, and protect downstream residential areas from flooding. This is not intended to be a design manual. Though design considerations are provided for each type of BMP, they do not include sufficient detail for design. References are provided for the reader to obtain more information. In all cases, local ordinances, regulations, and standards should be consulted and followed when implementing any stormwater best management practice. Three excellent Hawaii-focused reference documents that include additional information about BMP design include:
Hawaii Office of Planning, Coastal Zone Management Program, Low Impact Development, A Practitioner’s Guide, June 2006 (http://hawaii.gov/dbedt/czm/initiative/lid/lid_guide_2006.pdf)
City and County of Honolulu, Department of Environmental
Services, Stormwater Management Plan, March 2007 (http://www.cleanwaterhonolulu.com/storm/notices/swmp/)
State of Hawaii, Department of Transportation, Highways Division,
Stormwater Permanent Best Practices Manual, March 2007 (http://stormwaterhawaii.com/pdfs/PermanentManual.pdf)
Urban stormwater runoff can be controlled by using various BMPs. BMPs are categorized as structural and nonstructural. Structural BMPs consist of management practices that must be constructed. Many of these “structures” are natural system-based, including both vegetation and soils mechanisms as part of their functioning such as swales, green roofs, and wetlands. They are generally considered “green structures” or “green infrastructure,” as compared to more conventional “concrete” structures, such as hydrodynamic devices and constructed filters. Non-structural BMPs include considerations such as minimizing site disturbance and impervious surface area through reduced road widths and elimination of sidewalks. Organization This handbook is organized to highlight existing BMP technologies and practices that have been proven to work for reclamation of stormwater. It

4
focuses on five different land uses. These land uses and the best management practices appropriate for each are listed below. It is important to note that there is not a clear delineation of BMPs among the various land uses. Vegetated roofs could be used on individual homes, neighborhoods, and commercial developments. Similarly, rain gardens could equally be used for each of these land uses.
Individual Homes
– Bio-Retention Rain Gardens
– Rain Barrels and Rain Tanks
– Subsurface Tanks
– Vegetated Roofs
– Permeable Paving
Neighborhoods
– Minimize Site Disturbance
– Minimize Site Impervious Area
– Minimize Right-of-Way Impervious Surface
– Cluster Development
– Stormwater Dry Well Cartridge Filtration Systems
– Constructed Wetlands
Commercial & Institutional
– Vegetated Roofs – Permeable Paving – Subsurface Chamber Stormwater Management Systems – Hydrodynamic Devices
– Constructed Filters
Green Space/Recreational
– Reinforced Turf Surfaces
– Excavated Basins
– Infiltration Trenches

5
Rural/Agricultural
– Surface Spreading
Each BMP has specific information relating to it, including design considerations, capital and operation and maintenance (costs), installations in Hawaii, references, and other information. An important consideration for commercial & institutional applications is the Leadership in Energy and Environmental Design (LEED) Green Building Rating System™. LEED encourages and accelerates global adoption of sustainable green building and development practices through the creation and implementation of universally understood and accepted tools and performance criteria. LEED is a third-party certification program and the nationally accepted benchmark for the design, construction and operation of high performance green buildings. LEED gives building owners and operators the tools they need to have an immediate and measurable impact on their buildings’ performance. LEED promotes a whole-building approach to sustainability by recognizing performance in five key areas of human and environmental health: sustainable site development, water savings, energy efficiency, materials selection and indoor environmental quality. Most BMPs include a section of potential LEED credits (Source: www.USGBC.org). Appendix A provides a list of suppliers for some of the best management practices components and technologies identified. It is not an exhaustive list. Additional sources can be obtained through an internet search, conference exhibits, and public and private agencies that are implement stormwater management. Disclaimer: All references to manufacturers, suppliers, and professional services are for information only, and are not recommendations.

6
NNeeiigghhbboorrhhooooddss
CCoommmmeerrcciiaall && IInnssttiittuuttiioonnaall

7
RRuurraall//AAggrriiccuullttuurraall
GGrreeeenn SSppaaccee//RReeccrreeaattiioonnaall
IInnddiivviidduuaall HHoommeess

8
Individual Homes The most effective stormwater management techniques are practiced at the source of runoff. “Clean catchment” is where:
Velocities are the lowest.
Quantity is the smallest.
Quality is the least impaired.
Stormwater management at the individual home level offers some of the lowest cost and simplest methods to reclaim stormwater. These techniques can benefit individual homeowners or developers by:
Reducing water bills.
Reducing the size of or eliminating the need for stormwater ponds, thereby increasing developable area.
Reducing stormwater infrastructure capital costs for developers and operations and maintenance (O&M) costs for municipalities.
Protecting downstream areas from flooding, erosion, and sedimentation.
Protecting downstream water quality.
Increasing the quantity and quality of groundwater recharge. The following practices and technologies could be used for individual homes:
Bio-Retention Rain Gardens.
Rain Barrels and Rain Tanks.
Subsurface Tanks.
Vegetated Roofs.
Permeable Paving.

9
Neighborhoods Neighborhood housing developments typically alter the watershed from its natural state. Typical construction activities such as clearing, grubbing, grading, paving and construction of buildings change the hydrologic characteristics such that the sub-catchment area is no longer able to attenuate stormwater where it falls. The current accepted practice for neighborhood development is to collect and convey stormwater to large detention facilities and match post-development discharge to pre-development discharge. This practice requires infrastructure such as inlets, pipes, and detention basins, which typically reduce the amount of land area for development. Stormwater reclamation and reuse techniques can be applied to an individual lot, a street, and a neighborhood area. These techniques offer an additional supply of water to the development. This additional supply might increase in importance as finite water supplies start to limit growth. Developers in Hawaii may soon be required to demonstrate a water source for a proposed project to obtain building permits and begin construction. In addition, these practices offer a more attractive and environmentally sustainable development. The following practices and technologies are discussed for neighborhood developments:
Minimize Site Disturbance.
Minimize Site Impervious Area.
Minimize Right-of-Way Impervious Surface.
Cluster Development.
Stormwater Dry Well Cartridge Filtration Systems.
Constructed Wetlands.

10
Commercial/Institutional Commercial and institutional developments alter the natural conditions of watersheds to varying degrees. On one extreme, big box retailers construct large stores and parking areas that generate large amounts of impervious area and runoff. This runoff has traditionally been treated in large retention basins and/or subsurface infiltration trenches. Some developers in Hawaii are now combining stormwater management with their structural, architectural, water supply, landscaping, and pervious surface requirements. These aspects of their design achieve cost efficiency by reducing capital and operation and maintenance costs. Institutional developments also create large impervious surfaces but they also tend to have more green space designed into their layouts. These green spaces lessen the impact to the watershed and offer opportunities to manage stormwater runoff onsite. An example of a developer thinking strategically about how their development can support itself and minimize the impact on the environment is Dowling Company’s Kulamalu Mauka Town Center on Maui. Low Impact Development (LID) concepts are implemented in this development by clustering the buildings to maximize green space for passive stormwater infiltration, using vegetated roofs to attenuate the quantity and quality of the stormwater, landscaping with drought tolerant vegetation, and installing subsurface chambers for capturing and storing stormwater for non-potable uses such as irrigation and toilet flushing. This development is a model for considering stormwater in the full context of reclamation and reuse. This development is working to sustain Maui’s potable water supply as well protect its natural resources. The following practices and technologies are discussed for commercial and institutional facilities:
Vegetated Roofs.
Permeable Paving.
Subsurface Chamber Stormwater Management Systems.
Hydrodynamic Devices.
Constructed Filters.

11
Green Space/Recreational Green space and recreational areas, although modified from their original state, still approximate natural conditions of meadows or other grassy areas. These areas offer developers opportunities to manage stormwater by using a portion of the open spaces as detention basins. Given the increased focus on providing green space and recreational areas within developments, these areas offer opportunities to attenuate stormwater quality and quantity as well as provide for reclamation and reuse. On a macro level it is easy to see where sport fields and parks can be located to provide an overarching framework of stormwater quality and quantity attenuation. These in turn can back up stormwater management technologies and practices located at the individual household, or neighborhood level. By diverting stormwater overflow from the localized systems to sub-area detention basins (such as sport fields), the developer can generate another opportunity to capture and reuse stormwater prior to discharge. As the detention basins overflow, the runoff can be routed through natural drainage channels and captured at the farthest point downstream, including retention ponds or constructed wetlands. The natural drainage channels offer excellent park space and an opportunity for proven quantity and quality attenuation prior to discharge. Incorporating stormwater management into required park space will enhance a development’s stormwater reclamation and reuse while meeting county park requirements for new developments. The following practices and technologies are discussed for green space and recreational areas:
Reinforced Turf Surfaces.
Excavated Basins.
Infiltration Trenches.

12
Rural/Agricultural Agricultural areas offer excellent opportunities for stormwater reclamation and reuse. The open space, layout of the fields (which convey stormwater in organized flow paths), along with existing infrastructure such as ponds, tanks and irrigation channels provide a backbone of options. These can be further developed to improve their reclamation and reuse characteristics. In addition, other opportunities that may not be as compatible in areas with less space can be examined, such as constructed wetlands, excavated basins, infiltration trenches and injection wells. Harvesting stormwater for agriculture is as old as agriculture itself. Instead of focusing on capturing and using the water just for farming, additional benefits can be achieved such as groundwater recharge and alternative supplies for neighboring developments. This is especially true now as irrigation techniques improve, recycled wastewater is added to the irrigation supply, and as lands previously used for agriculture are being redeveloped into communities. Stormwater will sheet flow until it is diverted by furrows, which are typically parallel to the contours of the land, and then continue as shallow concentrated flow to feed channels along the fringes of the cultivated filed. These channels can then convey the excess flow to stormwater ponds or tanks for capture and reuse onsite, or be connected to irrigation channels to send flow downstream to other portions of the farm or to neighboring developments. Another option for the ponds and irrigation channels is to engineer the bottoms and side slopes to improve their infiltration capacities, similar to excavated basins or infiltration trenches. The irrigation channels could be used to divert a pre-determined quantity of stormwater with weirs or other flow control devices, to injection wells for groundwater recharge. It is important to note that the quality of stormwater is best at the top of the watershed and the ideas described above will be best suited for locations as close to the point of runoff generation as possible. This will limit sediment loads and contact with pesticides, herbicides and fertilizers.

13
Wetlands are an option that can be sited further downstream as the hydraulics and ecosystems associated with wetlands naturally mitigate increased sediment loads and eliminate contaminants associated with pesticides, herbicides and fertilizers. These systems provide for both storage and treatment of stormwater runoff. By expanding the focus of stormwater management on farmland from purely agricultural uses, opportunities exist for stormwater reuse and reclamation while meeting agricultural water requirements. The following practices and technologies are discussed for agricultural areas:
Surface Spreading.

14
Best Management Practices BMPs for each of the land uses are listed below and discussed on the following pages.
Bio-Retention Rain Gardens.............................................................15
Rain Barrels and Rain Tanks............................................................25
Subsurface Tanks.............................................................................31
Minimize Site Disturbance ................................................................37
Minimizing Site Impervious Area ......................................................43
Minimize Right-of-Way Impervious Surface .....................................49
Cluster Development ........................................................................55
Stormwater Dry Well Cartridge Filtration..........................................61
Constructed Wetlands ......................................................................65
Vegetated Roofs ...............................................................................73
Permeable Paving ............................................................................81
Subsurface Chamber Stormwater Management Systems ...............91
Hydrodynamic Devices.....................................................................95
Constructed Filters..........................................................................103
Reinforced Turf Surfaces................................................................111
Excavated Basins ...........................................................................115
Infiltration Trenches ........................................................................121
Surface Spreading..........................................................................127
Injection Wells.................................................................................133

15
Bio-Retention Rain Gardens Rain gardens consist of shallow depressions, which are typically underlain with a gravel layer and planted with native vegetation and sized to capture and treat a specified amount of runoff volume from an impervious surface. Developers can design lawns to function as total treatment systems by providing vegetated forebays with recessed portions of the lawn acting as the rain garden. Depending on the design, the runoff can undergo sedimentation, filtration, adsorption, phytoremediation, evapotranspiration, and infiltration. They can be configured for treatment only or for both flow control and treatment. Suitability Rain gardens can rely on rain gutters or other pipes to collect and convey stormwater to the depression, or to accept sheet flow. Some landscape companies are already constructing these systems in Hawaii. Construction is similar to establishing traditional gardens or other landscaping features. The simple nature of these systems makes them compatible for new construction as well as for retrofit of existing residential developments. Rain gardens are suitable for use throughout Hawaii. An illustration of a typical rain garden is shown on the following page.

16
Vegetated and grassy swales can also be used to collect runoff for infiltration. Illustrations of grassy swales and vegetated swales are provided on the following page.
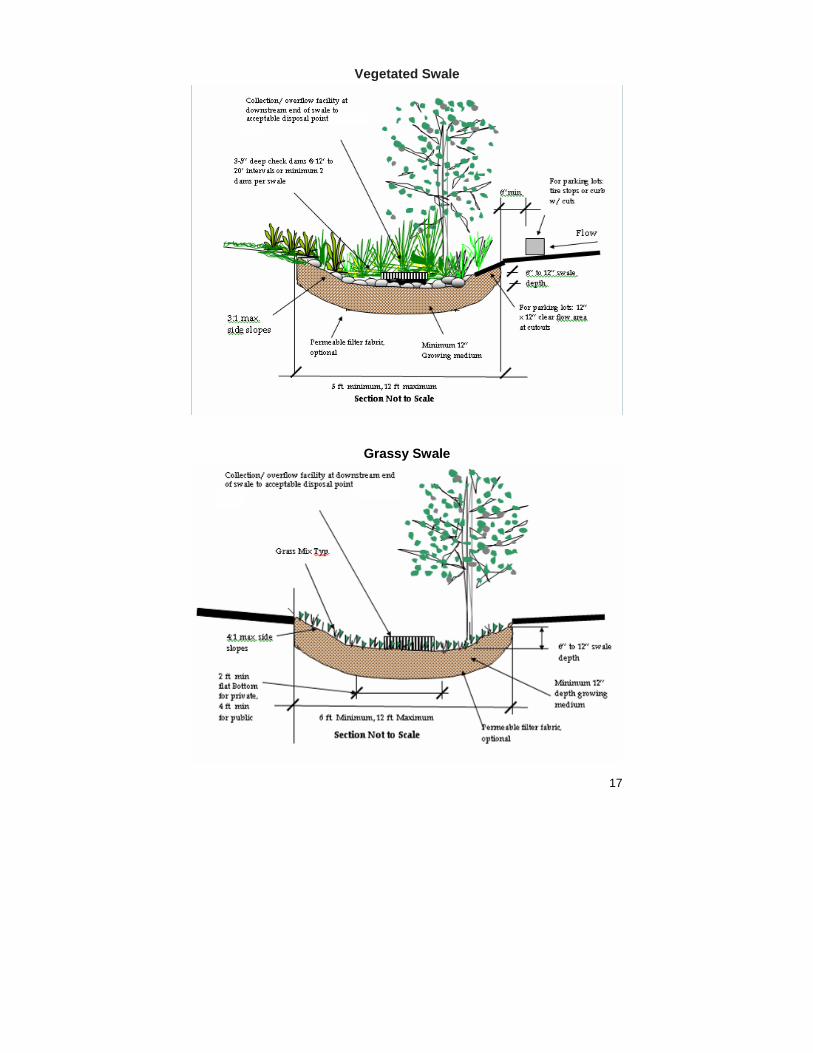
17
Vegetated Swale
Grassy Swale

18
Design Considerations Design considerations for bio-retention rain gardens include the surface area of the rain garden, the storage and treatment depths, plant species, and underdrain as required.
Surface area will depend on how much stormwater can be generated by the site (potential capture volume), how much stormwater is required to be captured (homeowner, developer, or regulatory requirements), typical design ponding depths and available land.
- Volume of Storage (based on location-specific storm events).
- Ponding depth (typically between 4 and 12 inches).
- Area of Rain Garden (an initial assumption is 4% of the area drained; a better approximation of the area required by the rain garden can be calculated by dividing the potential capture volume by the design ponding depth.
Depth of storage and treatment layers will influence storage quantity and treated stormwater quality, and depend on a number of factors:
- Depth to bedrock, which limits depth of the gravel storage layer.
- Depth to water table, which limits depth of the gravel storage layer.
- Depth of engineered soil, which depends on the soil infiltration capacity.
- Depth of gravel storage layer, which is dependent on the soil infiltration capacity. The lower the soil infiltration capacity the greater the required depth of the gravel storage layer. Soils classified by the Natural Resources Conservation Services (NRCS) as hydrologic soils group (HSG) C & D have lower capacities and may require a deeper layer.
Selecting the appropriate plant species is the most complex portion of rain gardens. They must be able to sustain brief periods of inundation and prolonged periods of dry conditions.

19
The University of Hawaii is currently developing a list of native plant species for these types of systems (see References).
Underdrains may be required depending on the infiltration capacity of the underlying soil or where infiltration is not desired, such as in systems used for treatment before storage in subsurface tanks. The infiltration capacity is dependent on the permeability of the soil and depth to bedrock and water table. Native soils in HSG C or D (high clay content) may require underdrains. Drain design considerations include:
- Underdrain pipe diameter as required depending on soil classification (HSG, typically C & D).
- Capacity needed to convey treated water to storage or to a downstream municipal storm drain.
- Head to convey flow from system as to a storage tank or to a connection with municipal storm sewer.
Other considerations include:
- Setback from structures as recommended by a geotechnical engineer or required by local building codes.
- Side slopes should be no greater than 4:1 (Horizontal: Vertical).
- Area of filter fabric to line the bottom of the rain garden to prevent clogging of the under drain is equal to the Area of the Swale.
Effectiveness Rain gardens can be highly effective at reducing runoff quantity and improving quality of recharge or runoff. Stormwater runoff can be treated from roofs and/or paved areas at individual homes. One contractor in Hawaii is already constructing these systems. Depending on the configuration of the system, the reduction in the quantity of stormwater can vary significantly:
Flow-through systems only capture approximately 0.4%.
Infiltration systems can capture 60 to 100% of the volume, depending on the space available.
Time of concentration can be increased up to 1.0 hour and reduce downstream impacts such as flooding. Time of

20
concentration is the time duration when the entire watershed is contributing to discharge. If the time of concentration is greater than or equal to the duration of the storm, not all portions of the watershed will contribute to discharge at the same time. This reduces the peak discharge flow volume and the threat of downstream flooding. In addition, lower velocities are associated with increased times of concentration reducing erosion and mobilization of pollutants.
Infiltration of up to 98% of detained water has been demonstrated. Removal Efficiency Water quality improvements include the removal of metals, suspended solids, carbon, phosphorus, ammonia, and nitrogen. A range of values for typical pollutants removed is provided below:
Zinc - 49 to 95%.
Copper - 28 to 95%.
Lead - 41 to 95%.
Ammonia - 95%.
Phosphorus - 40 to 65%.
Nitrogen - 17 to 50%. Limitations Rain gardens have limitations, including the following:
If the soil infiltration capacity is limited, the rain gardens will quickly pond and overflow.
Availability of native plant species that can withstand alternating periods of inundation and drought.
High sediment loads make rain gardens vulnerable to blinding, or decreasing infiltration. This impact of sediment loads can be mitigated by providing sheet flow to the rain gardens across vegetated filter strips as pretreatment.
Rain gardens are not suitable for treating flow from industrial, commercial, and/or construction sites that carry chemicals or high sediment loads.

21
Areas with slopes greater than 20% present challenges to implementation.

22
Enhanced Stormwater Management Opportunities Using rain gardens in conjunction with vegetated roofs, rain barrels and/or subsurface tanks will greatly enhance the quality of the stormwater for reuse. Construction Costs The amount of excavation and engineered soil and gravel required to augment soils with low infiltration capacity (HSG C & D) are key costs to construct bioretention areas to treat large volumes of runoff. Carollo Engineers (2006) estimates $4,500 to treat runoff from ½ acre, and $3-$15 per square foot of bio-retention area. Rain gardens for households will be less expensive than the $4,500 quoted for ½ acre since the amount of impervious surface generating runoff will be less, as will the amount of excavation and engineered soil for the smaller sized rain garden. Neil Weinstein, Director of the Low Impact Development Center, quoted construction costs of $5,000 to $10,000 per acre drained, depending on soil types. (USEPA, 2000). A Hawaii landscaper has quoted construction costs that are similar to the cost of traditional landscaping (Kovach, 2007). Avoided Costs Avoided costs to the homeowner may be limited, except where rain gardens are used as pretreatment for a rain water harvesting system. Developers may find significant cost savings by installing these systems on-site as a means of reducing the size and the number of traditional stormwater pipes, inlets, and retention ponds. Hawaii Installations Local landscapers have constructed rain gardens in Hawaii. Other Information There are several studies that have identified native plants that may be suitable for rain gardens:

23
“Assessing Native Plants for a Constructed Wetland” (Pagan et al, 2007) identified the Hui Ku Maoli Ola Nursery, an O’ahu based nursery that may supply these species.
Cabugos L, Kaufman A, Cox L, Miura T, Easterday D (2007) “Feasibility of Rooftop Landscaping with Native Hawaiian Plants in Urban Districts of Hawaii” online, http://www.botany.hawaii.edu/gradstudentpages/Grad_Student_Pubs/Cabugosetal2007.pdf.
The “Low Impact Development, Technical Guidance Manual for Puget Sound” (Hinman, 2005) offers several design examples including engineered soil, storage layer and underdrain design. References Additional information for bio-retention rain gardens can be obtained from the following references:
Cabugos L, Kaufman A, Cox L, Miura T, Easterday D (2007) “Feasibility of Rooftop Landscaping with Native Hawaiian Plants in Urban Districts of Hawaii” online, http://www.botany.hawaii.edu/gradstudentpages/Grad_Student_Pubs/Cabugosetal2007.pdf.
Carollo Engineers (2006) “Low Impact Development Literature Review” for San Francisco Public Utility Commission.
EPA Fact Sheet (1999) “Storm Water Technology Fact Sheet Bioretention” online, http://www.epa.gov/owm/mtb/biortn.pdf.
Fairfax County (2005) “LID BMP Fact Sheet – Bioretention Cells” online, http://www.lowimpactdevelopment.org/ffxcty/1-2_bioretentioncell_draft.doc.
Guidance Manual for Puget Sound” online, http://www.psp.wa.gov/our_work/stormwater/lid/lid_manual.htm.
Hinman, Curtis Hinman (2005) “Low Impact Development, Technical Guidance Manual for Puget Sound.”
Pagan J, Whitman W, DeFries T, Dockery L, Da Cruz Pina A (2007), “Assessing Native Plants for a Constructed Wetland”, online, www.ctahr.hawaii.edu/nrem/capstone/2007/Assessing%20Native%20Plants%20for%20a%20Constructed%20Wetland.pdf.

24
USEPA (2000) “Low Impact Development (LID) - A Literature Review”, online, http://www.toolbase.org/PDF/CaseStudies/epa_lid_review.pdf.
Operation & Maintenance Requirements These systems require O&M similar to traditional landscaping and/or gardens. The O&M costs can be borne by the homeowner, homeowners’ association, or by the manufacturer/installer (USEPA Fact Sheet, 1999). Annual costs vary based on the size and type of installation and can range from $100 to $500 per year depending on whether the homeowner or landscape maintenance company performs the maintenance (Carollo Engineers, 2006). Typical maintenance requirements include:
Watering plants during dry periods (native, drought-tolerant species should be chosen to minimize this requirement - see References above).
Inspecting the system periodically and after storms to evaluate erosion and clogging.
Replacing plants, soil, and/or mulch as required.
Trimming or pruning plants to encourage further growth and enhance phytoremediation.
Removing dead plants as required for aesthetics.
Removing and disposing, of sediment; testing may be required depending on expected contaminants.
Potential LEED® Credits
Potential LEED® Credits for Bio-Retention Rain Gardens
Category Credit Points
Sustainable Sites 6.1 – Stormwater Design Quantity Control 1
Sustainable Sites 6.2 – Stormwater Design Quality Control 1
Water Efficiency 1.1 – Water Efficient Landscaping Reduce by 50% 1

25
Potential LEED® Credits for Bio-Retention Rain Gardens (continued)
Category Credit Points
Water Efficiency 1.2 – Water Efficient Landscaping No Potable Water Use or No Irrigation
1
Materials and Resources 4.1 – Recycled Content (10% Post-Consumer + ½ Pre-Consumer)
1
Materials and Resources 4.2 – Recycled Content (20% Post-Consumer + ½ Pre-Consumer)
1
Materials and Resources 5.1 – Regional Materials 10% Extracted, Processed & Manufactured Regionally
1
Materials and Resources 5.2 – Regional Materials 20% Extracted, Processed & Manufactured Regionally
1
Innovation & Design Process 1-1.4 – Innovation in Design 1-4

26
Rain Barrels and Rain Tanks A rain barrel or above-ground tank is intended to capture stormwater runoff that is generated from roofs or other elevated surfaces. They may be used individually or in tandem, and can be used for potable and/or non-potable supply. Suitability The system relies on rain gutters to collect and convey stormwater to barrels or tanks and makes the system compatible for new construction as well as retrofits of existing residential developments. Design Considerations When deciding on rain barrels or tanks, the homeowner should consider the following:
The potential capture volume, which is based on the amount of rainfall and size of the impervious surface in the catchment area.
The amount of total runoff that can be captured can be defined by the amount of area the homeowner can or wants to allocate for barrel(s) or tank(s), and the physical size of the barrel(s) or tank(s).
Taking the amount of area available for storage and dividing it by the cross sectional area of the barrel(s) or tank(s) will yield the number of barrels or tanks that can be physically located on site.
Multiplying the number of barrel(s) or tank(s) by their volume will yield the amount of runoff that can be captured.
If space for storage is not an issue, the number of barrels or tanks required to store all of the potential capture volume can be determined by dividing the capture volume by the volume of one barrel or tank.
Other considerations for connecting the roof surface to the storage barrels or tanks include:

27
- Configuration of gutters, downspouts and storage devices to determine the length of gutters and debris screen.
- Number of downspouts to determine placement or need for manifolds.
- Number of first flush devices and length of header pipe (if utilizing a manifold set up) required.
The Nashville Metro Water Services website gives instructions about how to make a rain barrel:
ftp://ftp.nashville.gov/web/ws/2006_howto_rain_barrel.pdf. Effectiveness This system is a reliable means of capturing runoff from roof surfaces and relies on commercial off-the-shelf components. Pollutant Removal Efficiency The system is primarily designed to reduce runoff quantity and capture it for household use. Water quality is enhanced by reducing velocities across the impervious surface area, which in turn tend to mobilize fewer pollutants. Debris screens over the gutters as well as simple first flush pipes that can be installed on the downspouts will reduce the amount of particulate and/or organic matter entering the rain barrel or tank. Sedimentation will occur in tanks or barrels. Limitations The allowable size and number of barrels and/or tanks is based on space, homeowner preference, and/or homeowners’ association rules. Pertinent information to these limiting factors include:
Typical barrel sizes range from 30 to 80 gallons.
Rain tanks can range from 150 to 50,000 gallons.
One inch of rain will produce approximately 600 gallons of runoff on 1,000 square feet of impervious surface area.
Accordingly, the number of barrels or size of tanks to capture the total volume from large rain events can become significant.

28
Roofing and gutter materials are impact water quality. These materials may contribute pollutants such as copper, zinc, and lead. Specific roof types that are unsuited to use as collection surfaces for rain barrels include:
Tar and gravel.
Asbestos shingle.
Treated cedar shakes. Enhanced Stormwater Management Opportunities Using rain barrels in conjunction with other BMPs, including vegetated roofs, bioretention areas, recessed lawns, vegetated swales, and vegetated filter strips, will greatly enhance the individual homeowner’s stormwater management capabilities. These BMPs are useful particularly for rainfall events that exceed the capacity of the barrels and tanks. Secondary BMPs should be sized to treat overflow from the barrel(s) or tank(s) but can be sized to also include other portions of the lot such as the driveway and sidewalks. Construction Costs Costs for rain barrels range from $100 to $200 per barrel, excluding shipping. (Source: From Clean Air Gardening (2007) online at: http://www.cleanairgardening.com/rainbarrels.html). Costs for tanks vary by size and type of material as shown below.
Budgetary Costs for Tanks
Material Unit Costs/gallon Volume, gallons
Fiberglass $0.50-2.00 500-20,000 Metal $0.30-1.25 150-2,500 Polypropylene $0.35-1.00 300-10,000 Wood $2.00 700-50,000 Polyethylene $0.74-1.67 300-5,000 Source: Texas Water Development Board (2005)

29
Avoided Costs Avoided costs are equal to the volume of harvested rainwater used, multiplied by the current rate per gallon of municipal potable water. Up to 50% of domestic water use for individual homes can be attributed to irrigation of lawns and gardens. Significant cost savings will be experienced in the dry months, assuming adequate supply can be stored in the wet season. Since wastewater rates are based on water usage, savings on wastewater service charges will also be realized. Hawaii Installations Approximately 75% of residents of Puna and 43% of residents of Ka’u in Hawaii County are harvesting rainwater with tanks and/or barrels (Source: http://www.harvesth2o.com/hawaii.html). The technique is most suitable in the wetter parts of the islands. In rural areas at high elevations without municipal water service, it is the only feasible source of water. Other Information Innovative and inexpensive solutions for rain barrels and tanks include the use of recycled materials, trash cans, and old swimming pools. References Additional information for rain barrels and tanks can be obtained from the following references:
Carollo Engineers (2006) “Low Impact Development Literature Review” for San Francisco Public Utility Commission.
Fairfax County (2005) “LID BMP Fact Sheet – Cisterns/Rain barrels” online, http://www.lowimpactdevelopment.org/ffxcty/7-1_rainbarrel_draft.doc.
Macomber, Patricia (2001) “Rainwater Catchment Systems for Hawaii” online,http://www.ctahr.hawaii.edu/oc/freepubs/pdf/RM-12.pdf. Hardcopies of this publication can be ordered with the form found online at: http://www.ctahr.hawaii.edu/ctahr2001/CTAHRInAction/Feb_02/images/RCflier.pdf.
Texas Water Development Board (2005) “The Texas Manual on Rainwater Harvesting - Third Edition” online at:

30
http://www.twdb.state.tx.us/publications/reports/RainwaterHarvestingManual_3rdedition.pdf.
O&M Requirements O&M for rain barrels and tanks includes:
Removing debris from gutter screens, gutters, and first flush devices.
Removing sediment from barrels or tanks.
Treating for mosquitoes, as required.
Checked for water quality periodically depending on end-use.
Disinfection and testing if used for potable supply. Potential LEED® Credits
Potential LEED® Credits for Rain Barrels and Tanks
Category Credit Points Water Efficiency 1 – Water Efficient Landscaping 1-2 Water Efficiency 3 – Water Use Reduction 1-2 Sustainable Sites 6 – Stormwater Management 1-2 Innovation & Design Process 1 – 1.4 - Innovation in Design 1-4
Source: Fairfax County (2005)

31
This page is intentionally left blank.

32
Subsurface Tanks Subsurface tanks can range from standard cylindrical tanks to component systems that can be constructed to suit site characteristics. Component tanks can be made from interlocking concrete or perforated plastic blocks of various dimensions. The assembled blocks can be wrapped in an impervious liner to harvest rain water and retain rainwater for later use. Subsurface tanks can be constructed with or without a liner, the latter allowing for infiltration. Subsurface tanks are typically connected to a pre-treatment system to prevent fouling and/or to improve the water quality for reuse or discharge. Suitability Depth to bedrock and to the water table are key considerations when evaluating subsurface tanks for any application. Sites where underlying rock must be blasted or excavated may render subsurface tanks cost prohibitive. Subsurface tanks may be incompatible with shallow water tables. The interlocking component systems can be easily modified for on-site conditions and therefore suitable for individual household installations. Design Considerations Design considerations for subsurface tanks include:
Potential capture volume will determine the size of the subsurface tank and its pretreatment device.
Depth to bedrock limits the depth of excavation for a tank.
Depth to the water table limits the depth of excavation for tank.

33
Tank dimensions are variable. The storage area available is site specific and will govern the tank dimensions in conjunction with vertical constraints, depth to bedrock, and depth to water table.
Area of geo-textile fabric is based on final dimensions of the subsurface tank system. It will surround the entire subsurface tank and prevent sediment from clogging any individual chambers in the subsurface tanks.
Area of polypropylene liner, if desired, is based on the final dimensions of the subsurface tank system. A polypropylene liner provides an impervious membrane to line the excavation and prevent exfiltration from the subsurface tanks.
Surface protection of the subsurface tank will require a geo-grid (12 inches above tank) and compacted fill (minimum of 20 inches) for vehicle traffic areas; and compacted fill for pedestrian traffic (minimum of 12 inches).
Effectiveness Subsurface tanks are used primarily for stormwater retention and harvesting, or groundwater recharge. Quantity reduction is based on the allowable size of the tank. It is dependent on the size of the system installed, which is determined by homeowner and homeowner association preference. Removal Efficiency Water quality will depend on the source of the stormwater and use of other manufacturers’ products, such as geo-fabric and filters, as well as pre-treatment from other technologies such as vegetated roofs and/or rain gardens. Limitations Erosion and sediment control measures must be integrated into the plan to protect the stormwater system both during and after construction. These practices may have a direct impact on the system’s infiltration performance and longevity, as well as the quality of harvested water. Construction Costs Excavation and removal of the soil where the tank will be installed can be a significant cost. Other costs include:
The tank system.

34
Geo-textile fabric.
Impervious liner.
Pumps and piping as required. Tank systems can be installed for approximately $10.00 per cubic foot in 2007 dollars (Exacta Sales, 2007). Avoided Costs Avoided costs for the homeowner may be limited unless the tanks are used to harvest the stormwater to supply non-potable water for irrigation, car washing, and toilet flushing. Developers may find significant cost savings by installing these systems to reduce the size of traditional stormwater infrastructure, pipes, inlets and large retention ponds. In addition, these systems may save developable area. Hawaii Installations Dowling Company on Maui has proposed a subsurface cistern for its Kulamalu project on Maui to collect stormwater for irrigation and toilet flushing. Invisible Structures Rainstore for stormwater infiltration has been installed at a private residence in Lanikai on Oahu. Another installation was constructed in 2008 at the Kauai National Botanical Gardens. This installation is configured to use captured stormwater to irrigate garden areas. Other Information Some manufacturers of subsurface tanks also provide pretreatment systems and other products related to permeable paving and vegetated roofs.

35
References Additional information on subsurface tanks can be obtained from the following references:
Atlantis Corporation http://www.atlantiscorp.com.au/applications/rainwater_tank.
Exacta Sales I (2007) http://www.invisiblestructures.com/RS3/rainstore.htm.
O&M Requirements Operation and maintenance requirements include removal of sediment, liner repair, and maintenance of the pretreatment system, pumps, pipes and valves.

36
Potential LEED® Credits
Potential LEED® Credits for Subsurface Tanks
Category Credit Points
Sustainable Sites 5.1 – Site Development Protect or Restore Habitat
1
Sustainable Sites 6.1 – Stormwater Design Quantity Control
1
Sustainable Sites 6.2 – Stormwater Design Quality Control
1
Water Efficiency 1.1 – Water Efficient Landscaping Reduce by 50%
1
Water Efficiency 1.2 – Water Efficient Landscaping No Potable Water Use or No Irrigation
1
Water Efficiency 3.1 – Water Use Reduction 20% Reduction
1
Water Efficiency 3.2 – Water Use Reduction 30% Reduction
1
Materials and Resources 4.1 – Recycled content 10% Post-Consumer + ½ Pre-Consumer
1
Materials and Resources 4.2 – Recycled content 20% Post-Consumer + ½ Pre-Consumer
1
Materials and Resources 5.1 – Regional Materials 10% Extracted, Processed & Manufactured Regionally
1
Materials and Resources 5.2 – Regional Materials 20% Extracted, Processed & Manufactured Regionally
1
Innovation & Design Process
1-1.4 – Innovation in Design 1-4

37
This page is intentionally left blank.

38
Minimize Site Disturbance
Minimizing property disturbance is a non-structural BMP that involves a change in stormwater management design techniques. It involves preserving a site’s natural drainage features (e.g., swales, streams, soil permeability, tree cover, floodplains, and wetlands) and incorporating those features into the constructed aspects of the stormwater design. Stormwater management becomes a preliminary focus of the site layout, whereas traditionally, drainage has
been considered after maximizing unit and lot sizes. To be successful, this approach requires other supporting non-structural BMPs such as:
Cluster or conservation development.
Narrower streets.
Zoning requirements that allow for reduced lot sizes, frontage, and setback requirements.
It can also be supported by structural BMPs such as:
Bioretention.
Permeable paving.
Rain barrels.
Vegetated roofs. Suitability This BMP can be applied to all developments since it utilizes the existing natural stormwater management features of the site. In particular, large lot developments (i.e., two houses per acre) will realize the biggest

39
benefit since open space can be shared, which will result in a reduction of the lot size and the area to be developed. Minimizing site disturbance can reduce impervious cover, improve stormwater runoff quality, reduce construction costs, and preserve natural areas. Design Considerations Design considerations for minimizing site disturbance include:
Review of local zoning ordinances governing the type of development to determine restrictions or barriers to cluster/conservation development.
Identify and map areas to be preserved, including floodplains and riparian areas, wetlands, woodlands, natural flow pathways/drainage ways, and steep slopes. These areas should be combined into a Sensitive Resources Map that distinguishes between priority areas that must be maintained (e.g., protected habitat) and those areas sensitive to encroachment (e.g., wetlands or other riparian areas).
Use the Sensitive Resources Map to draw boundary lines around areas to be protected. From this map the remainder of the limits of construction can be determined based on property boundaries, zoning restrictions, or other barriers to cluster/conservation development. This will serve as a map of the potential development area.
Utilize cluster development and low impact development methods to conform to the boundaries of potential development area established on the map.
Effectiveness Minimizing site disturbance reduces the amount of land that will be disturbed, cleared and graded, which impacts a site’s natural ability to capture and infiltrate stormwater. Allowing the site to retain its natural drainage features provides for greater interception, evaporation, and infiltration of stormwater. This greatly enhances the overall stormwater management capability of the site. In addition, utilizing cluster development and conservation development will reduce impervious surface and impervious surface connected directly to the stormwater collection system and consequently reduce the amount of stormwater runoff generated by the development.

40
Natural drainage features reduce the velocity of runoff and increase the time of concentration that will protect downstream areas from erosion/sedimentation and flooding. Time of concentration is the time duration when the entire watershed is contributing to discharge. If the time of concentration is greater than or equal to the duration of the storm, not all portions of the watershed will contribute to discharge at the same time. This reduces the peak discharge flow volume and the threat of downstream flooding. In addition, lower velocities are associated with increased times of concentration reducing erosion and mobilization of pollutants. Removal Efficiency Minimizing site disturbance can reduce nutrient export by 40 to 60% compared to conventional design approaches for residential developments. This is mainly due to the sharp reduction in runoff. Pollutant removal efficiencies are similar to the structural BMPs used in the development, and discussed elsewhere in this handbook. Limitations This BMP can be limited by zoning requirements including lot size, setback and frontage requirements, acceptance of alternative stormwater management techniques by regulators, availability of materials for structural BMPs, and confidence/experience with these types of technologies and concepts. Construction Costs Significant cost savings to the development, through reduced roadway construction and stormwater conveyance construction, can be realized by minimizing site disturbance. In return, properties designed to minimize site disturbance using cluster/conservation development have a track record of appreciating values. Consumer demand is high for sites that incorporate natural features as opposed to conventional development. Developers are benefiting by implementing techniques to reduce or minimize site disturbance. An example is the Pinehills development in Plymouth, Massachusetts, which was able to preserve 80% of the site’s open space. The value of $400,000 condominiums appreciated $100,000 in one year (Roy, 2005).

41
Avoided Costs Avoided costs of using cluster developments to minimize site disturbance include:
Reduced roadway construction.
Reduced stormwater conveyance construction and storage.
Less site grading and reduced cut/fill requirements. Hawaii Installations Dowling Company of Maui is implementing cluster development in its Kulamalu Town Center development. Other Information Minimizing site disturbance is considered one of the easiest opportunities for LEED® credit (Roy, 2005). Maui County Code supports minimizing site disturbance by allowing cluster development, reducing road right-of-way, and streamlining the approval process for cluster developments. (Source: Maui County Code sections 19.83.010, 4 [right-of-way] and 19.83.010 [approval process]). References Additional information for minimizing site disturbance can be obtained from the following references:
Pennsylvania Department of Environmental Protection Bureau of Watershed Management (2006), “Pennsylvania Stormwater Best Management Practices Manual”, online, http://164.156.71.80/WXOD.aspx.
Puttman, Tom and Scott, Alan (2006), “Rethinking the Land”, Land Development Today, online, http://landdevelopmenttoday.com.
Roy, Leo Pierre (2005), “Going Green the Easy Way: Less is More”, Land Development Today, online, http://landdevelopmenttoday.com.

42
Scott, Theodore E., CPESC, 2005, “Integrating Stormwater Management”, Land Development Today, online, http://landdevelopmenttoday.com.
O&M Requirements/Costs O&M of natural areas is typically minimal. Potential maintenance includes:
Controlling invasive species
Clearing debris in channels and streams
Treating for mosquitoes Potential LEED® Credits
Potential LEED® Credits for Minimizing Site Disturbance
Category Credit Points Sustainable Sites Prerequisite 1 – Construction
Activity Pollution Prevention 1
Sustainable Sites 1 – Site Selection 1 Sustainable Sites 2 – Development Density and
Community Connectivity 1
Sustainable Sites 5.1 – Site Development Protect or Restore Habitat
1
Sustainable Sites 5.2 – Site Development Maximize Open Space
1
Sustainable Site 6.1 – Stormwater Design Quantity Control
1
Sustainable Site 6.2 – Stormwater Design Quality Control
1
Innovation & Design Process
1.1.4 – Innovation in Design 1

43
This page is intentionally left blank.

44
Minimizing Site Impervious Area Minimizing site impervious area is a non-structural BMP that seeks to reduce runoff by limiting impervious surfaces and direct connection of impervious surfaces to the stormwater collection system. Non-structural BMPs are integrated to:
Reduce road right-of-way and pavement areas.
Minimize parking stalls.
Redirect downspouts to permeable areas.
Incorporate vegetated strips between sidewalks and road surfaces.
Reduce the number of connecting streets by utilizing longer blocks.
Find alternatives to large radius culs-de-sac.
Use alternative street layouts such as open space, hybrid or headwater street plans.
Minimizing site impervious area can also incorporate structural BMPs such as:
Permeable paving.
Bio-retention areas.
Vegetated filter strips.
Vegetated roofs.
Subsurface chambers.

45
Suitability Minimizing site impervious area can be applied for individual homes, neighborhoods, and commercial and institutional land uses. Paving, including sidewalks can account for 60% of the total impervious area. Examples include Waikiki, Downtown Honolulu, and Kaka’ako districts on Oahu. These areas have approximately 17.5 million square feet or 400 acres of roof area. These roofs alone could generate about 1.5 million cubic feet of runoff during a 1-inch storm event. Including this BMP at the beginning of site design is the easiest way to generate the positive effects. It is also possible to retrofit these schemes into existing infrastructure during regular maintenance and/or replacement activities. Design Considerations Design considerations for minimizing site impervious area include:
Follow natural topographic contours and avoid short circuiting natural drainage pathways with a paved surface.
Avoid crossing streams or other natural drainage features.
Use cluster developments to reduce paving requirements.
Use permeable paving.
Provide for sheet flow to vegetated open swales, constructed filters, or bioretention facilities.
Use sidewalks on one side of the street.
Limit the number of streets and their widths and eliminate or reduce radii of culs-de-sac.
Install rain gardens in the center of large culs-de-sac.
Eliminate direct connections between impervious surfaces and storm sewers.
Effectiveness Reducing impervious surface and directly connected impervious surface reduces the quantity of stormwater runoff and enhances groundwater recharge by:

46
Improving stormwater quality through plant and soil-based treatment.
Extending the time of concentration. Removal Efficiency Pollutant removal efficiencies are similar to the structural BMPs used. Limitations Reducing site impervious area requires acceptance of alternative stormwater management techniques by regulators, availability of materials for structural BMPs, and confidence/experience with these technologies and concepts. Construction Costs Planning, design and permitting costs for implementing this BMP may be higher than conventional-style developments, but costs for construction, labor and materials may be lower. Other costs include the structural BMPs that are implemented as part of the design, but will most likely not incur a cost significantly greater than conventional storm sewers and ponds. Avoided Costs If implemented during the initial development, avoided costs include reduced paving and stormwater conveyance and storage construction costs. Hawaii Installations Installations of permeable paving by Invisible Structures can be seen at the following locations in Hawaii:
‘Iolani School on Oahu (Grasspave2).
East-West Center on Oahu (Grasspave2).
Asian Tropical Zoo on Oahu (Grasspave2).
Magoon Turf Demonstration/Research on Oahu (Gravelpave2).

47
Installations of vegetated roofs in Hawaii can be seen at:
Hoapili Hale on Maui.
Kulamalu project proposed by Dowling Company on Maui. Dowling Company of Maui is implementing cluster development in their Kulamalu Town Center.
Other Information Minimizing site impervious area is a recommended practice in Hawaii’s Coastal Zone Management Nonpoint Pollution Control Program (Hawaii, 1996). References Additional information for reducing site impervious area can be obtained from the following references:
Hawaii Coastal Zone Management Program (1996) “Coastal Nonpoint Pollution Control Program Management Plan Part III Management for Urban Areas”.
Hinman, Curtis (2005) “Low Impact Development, Technical Guidance Manual for Puget Sound”.
Pierce County Washington (2005) “Pierce County Stormwater Management and Site Development Manual”.
Strassler, Eric; Pritts, Jesse; Strellec, Kristen, Engineering and Analysis Division of the Office of Science and Technology (1999) “Preliminary Data Summary of Urban Stormwater Best Management Practices”.
O&M Requirements There are no O&M costs associated with minimizing site imperviousness. However, structural BMPs (such as bio-retention areas) and non-structural components (such as vegetated strips) may require more maintenance than impervious areas.

48
Potential LEED® Credits
Potential LEED® Credits for Site Impervious Area
Category Credit Points
Sustainable Sites 1 – Site Selection 1
Sustainable Sites 4.4 – Alternative Transportation Parking Capacity
1
Sustainable Sites 5.1 – Site Development Protect or Restore Habitat
1
Sustainable Sites 5.2 – Site Development Maximize Open Space
1
Sustainable Sites 6.1 – Stormwater Design Quantity Control
1
Sustainable Sites 6.2 – Stormwater Design Quality Control
1
Sustainable Sites 7.1 – Heat Island Effect Non-Roof 1
Sustainable Sites 7.2 – Heat Island Effect Roof 1
Water Efficiency 1.1 – Water Efficient Landscaping Reduce by 50%
1
Water Efficiency 1.2 – Water Efficient Landscaping No Potable Water Use or No Irrigation
1
Water Efficiency 3.1 – Water Use Reduction 20% Reduction
1
Water Efficiency 3.2 – Water Use Reduction 30% Reduction
1
Materials and Resources
4.1 – Recycled Content 10% Post-Consumer + ½ Pre-Consumer
1
Materials and Resources
4.2 – Recycled Content 20% Post-Consumer + ½ Pre-Consumer
1
Materials and Resources
5.1 – Regional Materials 10% Extracted, Processed & Manufactured Regionally
1
Materials and Resources
5.2 – Regional Materials 20% Extracted, Processed & Manufactured Regionally
1
Innovation and Design Process
1-1.4 – Innovation in Design 1-4

49
This page is intentionally left blank.

50
Minimize Right-of-Way Impervious Surface Minimizing the impervious surface of rights-of-way is a non-structural BMP that seeks to reduce the impervious surface area associated with roadways and sidewalks in a development. Many residential street widths are over-designed and can be reduced. Conventional street layouts, such as curvilinear, disconnected loops, and cul-de-sacs increase impervious surface and contribute large amounts of stormwater runoff.
Suitability Conventional street design, including layout and widths, can account for up to 60% of the impervious area in a watershed. Their design typically results in rapid conveyance of stormwater through curb and gutters or piping. This makes roadways one of the highest contributors of stormwater volume and pollutant loads of urban stormwater. Runoff volumes can be reduced by re-designing roadway widths and cul-de-sac radii. Incorporating cluster developments, narrower street frontages, and setbacks can also reduce runoff quantity. Replacing conventional curbs and gutters and pipes with other structural BMPs such as vegetated swales, bioretention areas, subsurface chambers or tanks, and permeable paving can greatly increase the stormwater reclamation and reuse possibilities of this non-structural BMP. It is important to ensure governmental ordinances permit these measures, including emergency services, such as fire protection, bus operators, and other municipal vehicle operators.

51
Design Considerations Design considerations for minimizing the impervious surface of rights-of-way include:
Higher traffic volume and speed require larger roadways.
Emergency vehicle, bus, garbage truck, and other large vehicle have specific access requirements.
Standard passenger vehicles have minimum turning radii requirements.
Governmental roadway width and parking requirements may be greater than the actual roadway width and parking needs, as shown below:
- Regulations: Two travel lanes and two parking lanes requiring 30 to 40 feet may be specified.
- Actual Demand: Access and parking requirements can often be met at 26 feet or less.
Follow existing topographic contours as much as possible.
Avoid crossing or impeding natural drainage features.
Provide sheet flow across vegetated filter strips to a receiving BMP whenever possible.
Provide fewer paved cross streets. Use impervious paving for cross streets between residential blocks to promote alternative transportation methods such as biking or walking.
Consider alternative layouts such as loop, open space, hybrid and headwater street plans. These street plans can be considered a combination of grid and curvilinear street layouts. These designs eliminate the numerous side streets associated with the standard grid layout while maximizing the size of the cul-de-sac to become a large rain garden (open space).

52
Effectiveness Examples of the effectiveness of reducing the impervious area of rights-of-way are provided below.
Reducing street widths by 6 feet will decrease impervious area by 30%.
Reducing cul-de-sac radii by 10 feet will decrease impervious surface area by 44%.
Incorporating hammerheads result in 76% less runoff than a 40-foot cul-de-sac.
Incorporating BMPs that detain, infiltrate, or capture runoff will further improve this BMPs reclamation and reuse possibilities. Removal Efficiency The majority of pollutants from conventional roadways accumulates in the curb/gutters and flows to storm drains during storm events. Removing the curb and gutter and allowing stormwater to sheet flow across vegetated filter strips into a receiving BMP such as a rain garden or vegetated strip will remove pollutants and improve water quality. Limitations Limitations of reducing the impervious area of rights-of-way include:
Local design standards and zoning that prohibit the reduction of the width of public streets.
Lot size, setback and frontage requirements that do not permit layouts that reduce pavement length by clustering, decrease frontage, and reduce driveway lengths.
Heavy traffic (e.g., exceed 1,000 average daily trips) for arterials, collectors, or other streets may make re-design infeasible.
Construction Costs Construction costs for reducing impervious surface area of rights-of-way are assessed on costs for excavation, grading and paving as required by the site layout.

53
Avoided Costs Reduced roadway lengths and widths can reduce construction costs for paving as well as stormwater conveyance systems. Hawaii Installations There are no Hawaii uses of this BMP identified at this time. Other Information There is no additional information at this time. References Additional information for reducing the impervious area of rights-of-way can be obtained from the following references:
Hinman, Curtis Hinman (2005) “Low Impact Development, Technical Guidance Manual for Puget Sound.”
Pierce County Washington (2005), “Pierce County Stormwater Management and Site Development Manual”.
Strassler, Eric; Pritts, Jesse; Strellec, Kristen; Engineering and Analysis Division of the Office of Science and Technology (1999) “Preliminary Data Summary of Urban Stormwater Best Management Practices”.
O&M Requirements Operation and maintenance requirements for reduced impervious area of rights-of-way are expected to be less than conventional roadways. Potential cracking can occur around interfaces with the edge of pavement. A vegetated shoulder could require additional maintenance, but this can be mitigated with a 2-foot concrete transition or permeable paving along the road shoulder.

54
Potential LEED® Credits
Potential LEED® Credits for Reducing Impervious
Category Credit Points
Sustainable Sites 1 – Site Selection 1
Sustainable Sites 4.4 – Alternative Transportation Parking Capacity
1
Sustainable Sites 5.2 – Site Development Maximize Open Space
1
Sustainable Sites 6.1 – Stormwater Design Quantity Control
1
Sustainable Sites 6.2 – Stormwater Design Quality Control
1
Sustainable Sites 7.1 – Heat Island Effect Non-Roof
1
Innovation & Design Process
1-1.4 – Innovation in Design 1-4

55
This page is intentionally left blank.

56
Cluster Development Cluster development is a non-structural BMP that minimizes site disturbance and impervious area by reducing lot size, setback, and frontage distance. Cluster development groups structures as close together as possible. Increasing the density of developments allows for increases in natural drainage amenities, such as un-compacted soil, forest cover, streams, swales, and wetlands. Suitability Cluster development techniques can be applied to medium and high density developments as well as large lot developments. Zoning and site development ordinances that specifically support cluster developments are helpful, but they are not necessary to apply the concept. The designer should seek to minimize frontage, setback and lot size within the given ordinances with the goal of protecting or restoring as much open space as possible. Design Considerations Design considerations for cluster development include:
Preserve the site’s natural drainage features is the first priority during site layout.
Restore disturbed portions of the site through the course of construction with engineered or amended soil and native plantings.
Cluster structures to maximize open space, using the following guidelines:
- Medium density (4 to 6 units per acre) have a goal 50% open space retained.

57
- High density developments greater than 6 units per acre will require multi-family, cottage, condominium or a mix of attached and detached single family homes.
- Lot sizes of 3,000 to 4,000 square feet.
- Setbacks of 25-foot front yard and 3-foot side yard.
- Zero lot line development.
- Additional stories to structures to add square footage and minimize footprint.
Incorporate structural BMPs such as vegetated roofs, permeable paving, rain barrels, bioretention areas, vegetated filter strips, and subsurface chambers.
Utilize open conveyance such as sheet flow over vegetated filter strips to vegetated swales or biorention areas.
Develop and follow an Open Space/Habitat Management Plan.
Align structures with contours to minimize excess cut and fill. Effectiveness Effectiveness is a function of the types of structural BMPs that are incorporated and are discussed elsewhere in this handbook. Removal Efficiency Nutrient removal can be 45 to 60% over conventional design. Additional pollutant removal is based on the structural BMPs that are incorporated. Limitations Limitations of cluster development are:
Zoning and site layout ordinances that do not support cluster development.
May not be applicable to infill developments, which seek to increase the density of existing developments already, or retrofitting into existing conventional developments.

58
Acceptance of alternative stormwater management techniques by regulators.
Availability of materials for structural BMPs.
Confidence/experience with these types of technologies and concepts.
Availability of financial resources for the operation and maintenance costs, liability insurance, and technical expertise to manage the open space.
Enhanced Stormwater Management Opportunities Structural BMPs such as bioretention, permeable paving, rain barrels, subsurface chambers, and subsurface tanks and non-structural BMPs such as minimize site disturbance, minimize site impervious and minimize right-of-way imperviousness will maximize the effectiveness of cluster development. Construction Costs Significant cost savings for roadway and stormwater conveyance construction can be realized by implementing cluster developments. Developers are already gaining returns on their investment by implementing cluster developments. An example is the Pinehills development which was able to preserve 80% of the site’s open space. The value of $400,000 condominiums appreciated $100,000 in one year (Roy, 2005). Avoided Costs Avoided costs for cluster developments include:
Reduced roadway construction.
Reduced stormwater conveyance construction.
Less site grading and reduced cut/fill requirements:
- Maui County Code 19.83.010, 4 is an example of how Counties can support the reduction in site grading. It supports minimal grading by allowing private roadways, narrower roadway widths, and steeper grades than otherwise permitted.

59
Reduced water and wastewater construction costs.
Reduced development costs through streamlined approval process:
- Another example of how Counties can support cluster developments is by streamlining the review and approval process for projects utilizing cluster development. Maui County Code19.83.010.B states “It is the intent of the Maui County Council…will allow administrative review and approval by the directors of public works and planning, thereby streamlining the development process…”
Hawaii Installations Dowling Company of Maui is implementing cluster development in its Kulamalu Town Center development.
Other Information The easiest opportunity for LEED Credit is through site design and layout (Roy, 2005). References Additional information for cluster developments can be obtained from the following references:
Hinman, Curtis (2005) “Low Impact Development, Technical Guidance Manual for Puget Sound”.
Maui Count Code Chapter 19.83, online http://municipalcodes.lexisnexis.com/codes/maui.
Pennsylvania Department of Environmental Protection Bureau of Watershed Management (2006), “Pennsylvania Stormwater Best Management Practices Manual”, online, http://164.156.71.80/WXOD.aspx.
Pierre, Roy (2005), “Going Green the Easy Way: Less is More”, Land Development Today, online, http://landdevelopmenttoday.com.
Puttman, Tom and Scott, Alan (2006), “Rethinking the Land”, Land Development Today, online, http://landdevelopmenttoday.com.

60
Scott, Theodore E (Certified Professional in Erosion and Sediment Control), 2005, “Integrating Stormwater Management”, Land Development Today, online, http://landdevelopmenttoday.com.
O&M Requirements Operation and maintenance of natural areas is typically minimal and might include:
Eliminate invasive species.
Clear debris from channels and streams.
Control mosquitoes. Potential LEED® Credits
Potential LEED® Credits for Cluster Developments
Category Credit Points Sustainable Sites Prerequisite 1 – Construction
Activity Pollution Prevention 1
Sustainable Sites 1 – Site Selection 1 Sustainable Sites 4.4 – Alternative Transportation
Parking Capacity 1
Sustainable Sites 5.1 – Protect/Restore Habitat 1 Sustainable Sites 5.2 – Maximize Open Space 1 Sustainable Sites 6.1- Stormwater Quantity Control 1 Sustainable Sites 6.2 – Stormwater Quality Control 1 Innovation & Design Process
1-1.4 – Innovation and Design 1-4

61
This page is intentionally left blank.

62
Stormwater Dry Well Cartridge Filtration Dry well filtration chambers are designed to filter stormwater for treatment prior to soil infiltration. They can be operated in-line with other stormwater infrastructure to accommodate full flows. This configuration would require the addition of an overflow weir and bypass piping. The system can also be installed off-line to accept only the required water quality/quantity treatment volume, or “first flush”. Dry wells, also known as vadose zone infiltration wells, are wells installed above the water table but below low permeability soils such as clay. The dry well typically contains a perforated pipe that extends from approximately 1 to 2 feet below ground surface to the bottom of the well. Suitability The chambers can be used for commercial, municipal, industrial, recreational, and residential applications including installation under parking lots and commercial roadways. Design Criteria Design considerations for dry well filtration systems include:
Design peak flow to be treated will determine size.
Type and concentration of pollutants to be removed will determine filter type.
Highly permeable soils (i.e., HSG A & B) provide the best infiltration.
Depth to ground water must be sufficient to allow infiltration.
Depth to bedrock must be sufficient to allow installation.

63
Distance to drinking water wells must be at least 1,000 feet from point of installation.
Bypass piping is needed for storms greater than the design storm. Additional BMPs with piping connections can be used to accommodate excess flows.
Effectiveness These systems target a full range of pollutants, including total suspended solids (TSS), soluble heavy metals, oil & grease, and nutrients. Filter media can be customized based on site-specific conditions. The system’s small footprint minimizes the surface area required for installation. The DryWell Cartridge filter is one configuration mainly focused on water quality improvement but the system can also be integrated into broader stormwater management programs that include reduction in runoff quantity. Removal Efficiency Different media can be used in the cartridges to target specific pollutants. Each media will have its own removal efficiency. The table below summarizes the findings of laboratory studies on the CONTECH web page regarding certain filter media. TSS removal efficiencies arrange from 71 to 87%.
Filter Media TSS
Filtration Rate,
Liters per Minute
Number of Simulations, Event Mean
Concentration
Removal Efficiency
Coarse/Fine Perlite
Silt/Loam 15% Sand 65% Silt 20% Clay
28 21
ND – 247 mg/l 71%
ZPG™
Silty 20% Sand 80% Silt 0% Clay
28 7
0 - 300 mg/l 87%
Coarse Perlite Sandy/Loam 55% Sand
57 21
ND - 301 mg/l 79%

64
40% Silt 5% Clay
Limitations Erosion and sediment control measures must be integrated into the plan to protect the stormwater system both during and after construction. These practices may have a direct impact on the system’s infiltration performance and longevity. Construction Costs Manhole costs are similar to the costs of standard manholes (Source: CONTECH). Systems can range from 48-inch to 72-inch openings and can be delivered fully assembled, ready to install. Retrofits for 48 inch manholes are available, which can save additional excavation costs and be installed faster. Total costs range typically from $2,500 to $6,000 per unit. The variability in price is dependent on the diameter of manhole and the number of cartridges to be installed. An additional 30% of the cost per unit is a reasonable estimate for installation costs. Avoided Costs Systems can be installed so that filtration system is aligned vertically over the dry well. This could save developable area or open space. Hawaii Installations A dry well infiltration system is located at Pu‘uhonua O Honaunau National Historical Park on the Island of Hawaii. References Additional information about dry well infiltration cartridges can be found in the following references:
Brett Homes, Stormwater Design Engineer, CONTECH Stormwater Solutions Inc., California 95661, Tel: 877-626-0013 x5802.

65
Laddie Fromelius, Western Regional Manager, BaySaver Technologies, Inc., Arizona 85308, Tel: 602-687-7797.
O&M Requirements/Costs Operation and maintenance requirements include filter cartridge replacement and sediment removal This can be done by field technicians for a cost of about $250/cartridge or by the owner utilizing a cartridge exchange program for about $150/cartridge (Source: CONTECH). Potential LEED® Credits
Potential LEED® Credits for Stormwater Dry Well Cartridge
Category Credit Points
Sustainable Sites 6.2 – Stormwater Quality Control 1
Innovation & Design Process
1-1.4 – Innovation and Design 1-4

66
Constructed Wetlands Constructed wetlands are shallow marsh systems that are planted with emergent vegetation that are designed to treat stormwater runoff. The most useful type of wetland for stormwater attenuation is the free surface water wetland in which runoff flows through the soil-lined basin at shallow depths. Treatment is provided through sedimentation, adsorption, filtration, phytoremediation, and volatilization. Suitability Constructed wetlands are considered one of the most reliable BMPs by the USEPA. Constructed free water surface wetlands are suitable for treating runoff from large drainage areas. Five to ten acres is the minimum required area unless it is a pocket wetland, which requires a minimum amount of contributing area from 1 to 10 acres. Other sources quote 25 acres as the minimum in humid areas to maintain a permanent pool. A maximum amount of treatable area has been proposed at 50 acres. The area of the wetland should be about 0.5 to 1.5% of the drainage area. The USEPA lists four types of wetlands:
Shallow marsh – This requires the most land and baseflow to maintain water within the wetland.
Extended detention wetland – This is a modified shallow marsh able to store extra water above the normal pool elevation. This configuration attenuates flows and relieves downstream flooding.
Pond/wetland system – This system consists of a wet pond to trap sediment and reduce velocities, and a shallow marsh to provide biological, physical, and chemical treatment.

67
Pocket wetland – This wetland requires excavation down to the groundwater table for reliable water source.
These systems have been used to treat runoff from agricultural, commercial, industrial and residential areas. They are good for all soil types but especially good for HSG C and D. The low infiltration rates of these soils will help maintain the permanent pool. Upstream slopes can be up to 15%. The slope across the wetland should be limited to 5% or less. Design Considerations Design considerations for constructed wetlands are provided below:
Surface area of the wetland should be 0.5 to 1.5% of the drainage area.
Maryland uses 3% of the contributing area for shallow basins.
The length (inlet to outlet) to width ratio should be at least 2:1. If 2:1 ratio can’t be met, baffles, islands, peninsulas can minimize the potential for short circuiting.
Volume of wetland should be sufficient to accept 90% of the runoff producing storms.
Maryland recommends a 24-hour, 1-year storm for extended detention sizing.
Washington State Department of Ecology uses a 6-month, 24-hour rainfall event.
The storage required is the product of the area of drainage and the average rainfall in inches for the design storm.
The volume of treatment requires a storm runoff coefficient, percent site imperviousness, and the contributing area in acres.
A liner may be required to prevent infiltration.
Sufficient head is required to convey flow through wetland. The minimum drop across wetland should be 3 to feet.
Depth to bedrock may limit the suitability of the wetland.
Depth to water table may determine the type of wetland.

68
Pocket wetlands usually require excavation to the water table to maintain permanent pool volume when base flow is not sufficient.
Effectiveness Constructed wetland technology has been proven in the past to effectively wastewater flows. The wetlands varying geometry, depths, vegetation, and area are all key aspects in their ability to attenuate stormwater quantity and quality. Large volumes help to absorb and detain peak flows. They reduce stormwater velocities, erosion, and sedimentation. They also help reduce downstream flooding potential by detaining flow. The geometry and vegetation also help attenuate the quality of the runoff by slowing the runoff and allowing for more sedimentation. Slower velocities increase contact time with vegetation, which allows for absorption of nutrients and metals through plant roots. The root systems provide excellent growing media for microbes that help biologically treat stormwater runoff. Wetland plants help filter macro pollutants such as trash, debris and particulates as the flow passes through the plant mass. Removal Efficiency The following average long-term removal rates have been demonstrated for constructed wetlands (Source: USEPA Fact Sheet Storm Water Wetlands, EPA 832-F-99-026):
TSS – 67%.
Total Phosporus (TP) – 49%.
Total Nitrogen (TN) – 28%.
Carbon (C) – 34%.
Petroleum Hydrocarbons – 87%.
Cadmium – 36%.
Copper – 41%.
Lead – 62%.
Zinc – 45%.

69
Bacteria – 77%.

70
Removal rates for pollutants can be broken down by type of constructed wetland as shown in the table below. (Source: Stormwater Authority website http://www.stormwaterauthority.org/bmp, online handbook.
Percent Removal Rates for Pollutants by Type of Constructed Wetland
Pollutant Shallow Marsh
ED Wetland1
Pond/Wetland System
Submerged gravel
wetlanda
TSS 83 ± 51 69 71± 35 83
TP 43 ± 40 39 56 ± 35 64
TN 26 ± 49 56 19 ± 29 19
Nitrate and Nitrite (NOx)
73 ± 49 35 40 ± 68 81
Metals 36-85 (-80)-63 0-57 21-83
Bacteria 761 NA NA 78 a Data based on fewer than five data points
Limitations Constructed wetlands require a significant amount of space based on the amount of stormwater that will be treated. These space limitations may be overcome by combining this technology with other on-site BMPs that limit the amount of stormwater to be treated. However, in order to maintain the emergent vegetation a permanent pool must be maintained which typically requires up to 25 acres. This may not be feasible in arid climates. In addition to the land requirement, design, construction and operation and maintenance of these systems can be high. Properly designed, constructed and maintained wetland systems can provide excellent stormwater management capabilities. Other limitations to wetland systems include interference with natural habitat if the systems are built “online” with naturally occurring drainage channels, attract “nuisance” species, or introduce invasive species and thermal pollution of downstream waters. Construction Costs

71
The USEPA estimates construction costs in 1999 at approximately $26,000 to $55,000 per acre of emergent wetland with a sediment forebay. These prices include clearing, grubbing, erosion and sediment control, excavating, grading, staking and planting. Permitting, design, and contingency costs can be estimated at 25% of construction cost. The USEPA also suggests the largest costs for these systems are the cost for excavation and plant selection. Land costs in Hawaii might add significantly to the construction costs. Avoided Costs The benefit of constructed wetlands lends itself to improved quality of life for residential developments. These systems can offer a unique attraction for residents and potentially qualify for park space, which is required by most planning and permitting departments for new developments. Hawaii Installations University of Hawaii at Manoa (U.H.M.) has proposed a constructed wetland located west of the U.H.M. Transportation Services facility. Other Information The College of Tropical Agriculture and Human Resources at the U.H.M. completed a study recently, which identified native plant species that could be used for constructed wetlands. Six indigenous species have been identified that are locally available for purchase and have characteristics that make them potentially adaptable to constructed wetlands (i.e. they can tolerate metals, wastewater and drought to some degree). The following table is adapted from Pagan (2007).
Species Metal Tolerance
Wastewater Tolerance
Drought Tolerance
Wetland Habitat
Distribution Probability
Cost per
plant
Aeae Y XXX X 99% $0.60 Aka akai Y XXX X 99% $6.00 Ahu awa Y XXX X 67-99% $2.00 Makaloa Y X X 99% $2.00 Kaluha Y X X 99% $2.50 Mauu akiaki
Y Not enough Information
Not enough information
1-33% $2.00

72
Note: “Y” Indicates that this species displayed metal tolerance “X” Indicates that this species displayed wastewater and drought tolerance. The more “X’s” the higher the tolerance References Additional information for constructed wetlands can be obtained from the following references:
Brown and Caldwell (2004), “Screenings of Feasible Technologies for Wastewater and Stormwater Management for San Francisco Bayside Watersheds”.
EPA Fact Sheet 832-F-99-025 (1999), “Storm Water Wetlands”.
Pagan J.; Whitman ,W.; DeFries, T.; Dockery, L.; Da Cruz Pina, A. (2007), “Assessing Native Plants for a Constructed Wetland”, online, www.ctahr.hawaii.edu/nrem/capstone/2007/Assessing.%20Native%20Plants%20for%20a%20Constructed.%20Wetland.pdf
Stormwater Water Authority (2007), “BMPs in a Flash Site Design Applicability Costs Maintenance and More”, online, http://www.stormwaterauthority.org/bmp.
O&M Requirements/Costs The USEPA recommends maintaining or restoring the organic matter from the native soils after construction since this material plays an important role for pollutant removal. Regular operation and maintenance requirements include:
Maintain established vegetation after construction for the first three (3) years. Inspection and monitoring should be done at least twice a year for the first three years and annually thereafter.
Inspect the wetland after major storms for damage to the embankments, flow channelization, and sediment accumulation.
Replant or harvest vegetation and remove sediment from the wetland pools. Analysis of sediment may be required prior to disposal to characterize contaminants trapped in the sediment layer.
Mow the embankments and maintenance bench (i.e., access way to and around the wetland) twice each year.

73
Remove trash and other debris from trash racks, outlet structures and valves as needed.
Maintenance costs are estimated to be about 2% per year of the construction costs. Potential LEED® Credits
Potential LEED® Credits for Constructed Wetlands
Category Credit Points
Sustainable Sites 5.2 – Site Development Maximize Open Space 1
Sustainable Sites 6.1 – Stormwater Design Quantity Control 1
Sustainable Sites 6.2 – Stormwater Design Quality Control 1
Materials and Resources
5.1 – Regional Materials 10% Extracted, Processed & Manufactured Regionally
1
Materials and Resources
5.2 – Regional Materials 20% Extracted, Processed & Manufactured Regionally
1
Innovation & Design Process
1-1.4 – Innovation in Design 1-4

74
This page is intentionally left blank.

75
Vegetated Roofs Vegetated roofs consist of roofing material that includes media on which native vegetation grows. The vegetation and growth media act to intercept and store rainfall. Thirty to 100% of the potential runoff can be stored, depending on size of the storm event. The retained stormwater percolates through the media, effectively increasing the time of concentration of the runoff. Suitability The most suitable roof tops have slopes between 5 and 20 degrees. Slopes less than 5 degrees may require underdrains. Slopes greater than 20 degrees may require a lath grid to hold soil in place. While runoff from all buildings will be reduced using vegetated roofs, studies suggest that buildings less than 50 feet tall would also gain the most thermal benefits from green roofs, through moderation of internal building temperature. The type of vegetation is the most important aspect of the vegetated roof. It should be able to cope with the local environmental stresses, which is why native vegetation is the most likely to succeed. Scientists at the University of Hawaii have produced initial lists of native plants that are thought to be most suitable for vegetated roofs in Hawaii (see References). An illustration of a typical vegetated roof is shown on the following page.

76
Design Considerations Design considerations for vegetated roofs include the following:
Area of the roof surface will determine the effective capture area.
Slope of the roof will determine if support infrastructure of the roof.
Area of the roof and slope of the roof are used to size the components of the roof system, including:
- Waterproof membrane.
- Root barrier if required.
- Grid to support growing media, for slopes greater than 20%.
Weight of saturated vegetated roof (15-50 pounds per square foot for extensive green roofs) is critical for assessing an existing building’s structural capability of supporting a vegetated roof.
The type and depth of the growing media along with the type and amount of vegetation cover determine:
- Amount stormwater that can be captured.
- Treatment level.

77
- Increase in time of concentration.
- Size and number of underdrain pipes.
- Size and number of outlets.
Depth of soil or growing media:
- 1 to 5 inches for “extensive” green roofs (some reports call for 4 inches minimum).
- 6 inches and greater for “intensive” green roofs.
Locally available growing media include:
- Black cinders (lava rock).
- Macadamia nut hulls.
- Compost.
- Raw or composted sugar cane stalks that have been crushed to extract their juice (bagasse).
- Recycled sewage sludge.
Type and amount of vegetation are based on:
- Species native to Hawaii.
- Aesthetics.
- Ecological compatibility.
- Availability and maintenance requirements. Effectiveness Most studies indicate that vegetated roofs will reduce runoff and increase the time of concentration for stormwater. Runoff volume reductions have been noted to be between 30 and 100%, depending on the storm. Another factor in runoff reduction is the interval between storms. The best results tend to be for short (including intense) storms occurring after relatively long dry spells. Depth of growth media is a key factor in determining how much storage a vegetated roof can potentially provide, and is key to quantity attenuation. Storage volume of a green roof can be calculated based on the green roof area, soil depth, and soil porosity.

78
Removal Efficiency Suspended solids removal efficiency can be as high as 85%. Vegetated roofs also show reduced levels of metals (including copper and zinc) and hydrocarbons. Limitations Limitations of vegetated roofs include the availability of:
Native plants proven to work as a vegetated roof.
Contractors with installation experience.
Component system vendors in Hawaii. There is currently a trend toward researching vegetated roof applications in Hawaii and information from these activities will help encourage further use and investment in this technology. Enhanced Stormwater Management Opportunities Utilizing rain barrels and/or bio-retention areas in conjunction with vegetated roofs will further enhance water quality and attenuate quantity of flow. Construction Costs Costs for vegetated roofs range from approximately $15 to $20 per square foot for new construction, including all green roof components such as waterproof membranes, growth medium, and plants. (Source: The Low Impact Development Center (2005)). Estimated 25-year life cycle costs for a 21,000 square-foot extensive green roof in 2005 dollars are:
$250,000 for initial installation.
$1,600 per year for operation and maintenance, including:
- Weeding every year.
- Infill with cuttings every 5 years.

79
- Soil replenishment every 5 years.
$250,000 for replacement at year 25.
(Source: The Low Impact Development Center (2005)). Additional cost information can be obtained from this website: www.roofmeadow.com. Avoided Costs Reduced stormwater flows can lead to smaller conventional stormwater management infrastructure. Hawaii Installations Installations of vegetated roofs in Hawaii are located at:
Hoapili Hale on Maui.
Kulamalu project proposed by Dowling Company on Maui.
Other Information The following ASTM Standards have been developed for vegetated roofs:
Standard Test Method for Saturated Water Permeability for Granular Drainage Media (Falling-Head Method) for Green Roof Systems (ASTM E2396-05).
Standard Test Method for Water Capture and Media Retention of Geo-composite Drain Layers for Green Roof Systems (ASTM E2398-05).
Standard Guide for Selection, Installation, and Maintenance of Plants for Green Roof Systems (ASTM E2400-06).
Standard Test Method for Maximum Media Density for Dead Load Analysis of Green Roof Systems (ASTM E2399-05).
Standard Practice for Determination of Dead Loads and Live Loads associated with Green Roof Systems (ASTM E2397-05).

80
Roofscapes Inc. offers a “Green Roof Stormwater Performance Simulation” at:
http://www.roofmeadows.com/services/stormwatersim.shtml Vegetated roofs that utilize threatened and/or endangered native plants will provide genetic diversity to those species and serve to protect their long term viability. References Additional information for vegetated roofs tanks can be obtained from the following references:
Cabugos L.; Kaufman, A.; Cox, L.; Miura, T.; Easterday, D. (2007) “Feasibility of Rooftop Landscaping with Native Hawaiian Plants in Urban Districts of Hawaii” online, http://www.botany.hawaii.edu/gradstudentpages/Grad_Student_Pubs/Cabugosetal2007.pdf.
Carollo Engineers (2006) “Low Impact Development Literature Review” for San Francisco Public Utility Commission.
Hawaii State Legislature - Senate Resolution LRB 06-2901.
Hinman C. (2005) “Low Impact Development, Technical Guidance Manual for Puget Sound”.
Pierce County Washington (2005) “Pierce County Stormwater Management and Site Development Manual”.
The Low Impact Development Center (2005) “Low Impact Development for Big Box Retailers” online, http://lowimpactdevelopment.org/bigbox/lid%20articles/bigbox_final_doc.pdf.
University of Hawaii Manoa Green Roof Feasibility Team (2006) “Feasibility of Green Roofs in Hawaii – A Source of Private and Public Benefits” online, http://www.hawaii.edu/offices/eaur/govrel/reports/2007/sr86_2006_feasiblity_study_green_report.pdf.
O&M Requirements Initial maintenance requirements will be high in order to establish the vegetation. If appropriate native species are chosen, maintenance can

81
be reduced as the plants become established. Periodic weeding (manually not with herbicides), removal of non-native species, and soil and plant replenishment may be required similar to other landscape features. All facility components, including structural, waterproofing, drainage, growth media, and vegetation should be inspected twice annually. Potential LEED® Credits
Potential LEED® Credits for Vegetated Roofs
Category Credit Points
Sustainable Sites 5.2 – Site Development Maximize Open Space 1
Sustainable Sites 6.1 – Stormwater Design: Quantity Control 1
Sustainable Sites 6.2 – Stormwater Design: Quality Control 1
Sustainable Sites 7.2 – Heat Island Effect: Roof 1
Water Efficiency 1.1 – Water Efficient Landscaping: Reduce by 50% 1
Water Efficiency 1.2 – Water Efficient Landscaping: No Potable Water Use or Irrigation
1
Materials and Resources 5.1 – Regional Materials: 10% Extracted, Processed & Manufactured Regionally
1
Materials and Resources 5.2 – Regional Materials: 20% Extracted, Processed & Manufactured Regionally
1
Innovation & Design Process 1-1.4 – Innovation and Design 1-4

82
This page is intentionally left blank.

83
Permeable Paving Permeable paving is designed to allow stormwater to infiltrate through the pavement structure. The pavement structure can consist of porous asphalt, porous concrete, interlocking blocks, or plastic grid systems. A uniformly-graded stone bed underlays the permeable pavement. The stone bed provides temporary storage until stormwater can infiltrate into the un-compacted soil layers below. Under-drains can also be incorporated as required or desired. Suitability The plastic grid matrix and interconnecting block paving systems may be the most adaptable to existing developments. These components come in standard sizes and can be easily modified to conform to specific needs. Porous asphalt and concrete need to be tailored to specific locations. They require specific design and manufacturing practices that raise the cost of these systems. Developers can achieve economies-of-scale and the cost of permeable paving will be offset by a reduction in costs of traditional stormwater infrastructure requirements. Other factors include permeability of the soil, depth to bedrock, and depth to water table. These factors relate to the infiltration capacity of the system. Native soils in NRCS HSG C or D (high clay content) may not be as effective for stormwater infiltration and may require a larger underlying gravel course for temporary storage. The USEPA recommends that porous pavement be used on soils with low clay content (i.e., less than 30%). Systems that are installed over soils with infiltration rates as low as 0.1 inch/hour have been successful. In addition, underdrains can be incorporated if required where infiltration rates are low and connected to a conventional stormwater management system. Illustrations of impervious paving designs are provided on the following page.

84
Pervious Concrete Block or “Paver” Systems
Pavers with open surface spaces filled with gravel or sand Setting layer Open-graded base material Filter fabric Subgrade, minimal compaction
Pervious (Open Graded) Concrete and Asphalt Mixes Open-graded pavement mix Open-graded base material Filter fabric Subgrade, minimal compaction Design Considerations Typical permeable pavement structures include a wearing course, base course, separation course (as required for water quality treatment) and the underlying soil or sub-grade.
Wearing Course - the thickness of the area that vehicles will drive on, per manufacturer’s design.
Base Course – Design is based on traffic loading requirements as well temporary storage requirements prior to infiltration into underlying soils or underdrains. Base course design for quantity attenuation is based on the following:
- Storage required is a function of the drainage area and the expected rainfall.

85
- Drainage area is typically the area of the pavement surface. Permeable paving systems are designed to capture runoff from the pavement surface only. Run-on is discouraged to limit the potential for clogging, but can be accommodated with pre-treatment such as vegetated filter strips.
- Average rainfall is measured in inches for required design storm.
- Infiltration rate of the uncompacted soil should be a minimum of 0.5 inches per hour.
- Aggregate depth determines the storage volume (18 to 36 inches is typical). The aggregate provides structural support for the wearing course and will range in size from 2 to 5/8-inch from top to bottom. The aggregate should be wrapped in a geotextile fabric to minimize plugging of the aggregate.
- Void space (porosity) in the aggregate should be 20 to 40%.
- The bottom of the base course should be a minimum of 4 feet above bedrock.
- The bottom of the base course should be a minimum of 4 feet above water table.
A separation layer consisting of engineered soil and a filter fabric may be required for further water quality treatment prior to infiltration or discharge. This layer should be designed with the following considerations:
- Depth of engineered soil as required for quality treatment. An 18-inch minimum depth is recommended, incorporating: compost, sphagnum peat moss or other organic material.
- A filter fabric is needed to underlay the engineered soil.
Other design considerations for permeable pavement structures include:
− Under drain pipe diameter, if required for poorly drained soils (typically HSG C and D) and for conveying stormwater to a downstream system.
− Head (H) to convey flow from system as necessary to a storage tank or rain garden, or to a connection with a municipal storm sewer.

86
− Set back from structures should be 10 feet downgradient and 100 feet upgradient.
− Pavement slope should vary less than 5%. Effectiveness Permeable pavement systems can provide quantity and quality attenuation for stormwater runoff. Most literature agrees that these systems are most effective at treating their own runoff. Runoff from adjacent areas should not be allowed. If runoff is unavoidable, the porous paving should be protected with a vegetative filter strip or other structural BMP to reduce the amount of sediment that may clog the voids. Stormwater quantity attenuation based on infiltration rates for porous paving is highly variable as shown below:
Porous asphalt ranges from 13 to 1,750 inches per hour.
Porous concrete ranges from 240 to 1,440 inches per hour.
Pavers range from 0.58 to 2,000 inches per hour.
For porous asphalt and concrete, the highest rates represent the highest initial rates after fielding of the systems. The lowest rates represent the lowest in-service rates with no maintenance for porous asphalt measured at 3 years and porous concrete measured at 6.5 years. Both the highest and lowest infiltration rates for pavers are considered in-service rates (No time line or maintenance activities are provided). The main factor affecting the infiltration rates of these systems is clogging from fine sediments. This degradation can be reversed by sweeping and vacuuming with a street sweeper. Available literature noted that infiltration rates for porous paving systems are so high initially that even after a significant reduction, the available infiltration rate is still above that needed to capture all the runoff from the paved surface, depending on storm size. Removal Efficiency Quality attenuation is accomplished as the stormwater infiltrates through the pavement structure. The geotextile fabric provides a barrier for suspend solids while the aggregate, depending on the type of stone used, can provide quality treatment in addition to quantity attenuation. Quality can be enhanced further with engineered soils designed for

87
treatment purposes. One study from Germany noted the following removal capabilities from an analysis of the aggregate:
89 – 98% for lead.
74 – 98% for cadmium.
89 – 96% for copper.
72 – 98% for zinc.
Studies from Maryland and Virginia have shown removal efficiencies of:
82 – 95% for sediment.
65% for total phosphorous.
80 – 85% for total nitrogen.
High removal rates for zinc and lead.
The Maryland and Virginia studies included the following as key factors for increased pollutant removal:
Routine vacuum sweeping and high pressure washing.
Drainage time of at least 24 hours.
Highly permeable soils.
Organic matter in sub-soils.
Clean-washed aggregate. Limitations Permeable paving is not recommended for the following applications:
Sites downgradient from areas with high erosion potential.
Sites downgradient from areas where concentrated pollutants are possible (e.g., gas stations, truck stops, or industrial chemical storage facilities).
Sites with seasonably high water tables or shallow bedrock.
Runoff from adjacent areas. Permeable paving should only take runoff generated by the paving surface itself.

88
Slopes that exceed the following:
− Porous asphalt not recommended for slopes greater than 5%.
− Porous concrete not recommend for slopes greater than 6%.
− Pavers not recommended for slopes greater than 10%.
− Grid systems not recommended for slopes greater than 6%. Enhanced Stormwater Management Opportunities Utilizing permeable paving in conjunction with subsurface tanks and bio-retention “rain gardens” will improve water quality and further attenuate quantity of runoff. Construction Costs Construction cost estimates for permeable paving are provided in the table below (Source: Carollo Engineers, “Low Impact Development Literature Review” for the San Francisco Public Utilities Commission).
Type of Permeable Paving
Cost/ft, installed
Cost/ft, installed
Cost/ft, installed
Porous Asphalt $0.50-1.00 $0.60-0.70a $0.50-1.00
Porous Concrete $2.00-6.50 $3.00-5.00 a --
Plastic Grid Systems $1.50-5.75 -- --
Interlocking Blocks $5.00-10.00b $2.50-4.50c $2.00-4.00 a Not including the cost for base aggregate. b Dependent on depth of base and site accessibility, per conversation with Maryland
Unilock ® representative (2002), cited by LID Center (2003). c Eco-Stone permeable interlocking concrete pavers; Cost includes pavers,
aggregate leveling layer, aggregate for the paver openings and joints, and installation. Does not include base material and installation, geotextile, excavation and sediment controls.

89
Avoided Costs Some municipalities are allowing pervious paving systems to be modeled as pervious grass rather than impervious surface. This may have an effect on a development’s required pervious/impervious surface ratio, and potentially allow the developer more square footage to develop. Roads and parking typically account for approximately 30% of land in an urban environment. If porous pavement is used for these areas, a significant reduction in stormwater runoff will occur. This will allow the conventional stormwater system to be smaller. Another potential cost saving is reducing the heat island effect and subsequent energy costs to homeowners and commercial buildings. Some permeable pavement, such as open grid paving, has a noted cooling effect and is included as a technology to achieve heat island reduction in the LEED® for New Construction Manual. Hawaii Installations Invisible Structures has installed permeable paving at the following locations in Hawaii:
A Private Residence on Oahu (Grasspave2 and Draincore2).
‘Iolani School on Oahu (Grasspave2).
East-West Center on Oahu (Grasspave2).
Asian Tropical Zoo on Oahu (Grasspave2).
Magoon Turf Demonstration/Research on Oahu (Gravelpave2). Other Information Pierce County, Washington has allowed permeable paving to be modeled as grass rather than impervious surface. References Additional information for permeable paving can be obtained from the following references:
Carollo Engineers (2006) “Low Impact Development Literature Review” for San Francisco Public Utility Commission.

90
EPA Fact Sheet 832-F-99-023 (1999), “Porous Pavement”.
Hinman, Curtis (2005) “Low Impact Development, Technical Guidance Manual for Puget Sound”.
Kundert, R. (2006), “Testing Traditional Solutions”, online, www.landdevelopmenttoday.com.
Pennsylvania Department of Environmental Protection Bureau of Watershed Management (2006), “Pennsylvania Stormwater Best Management Practices Manual”, online, http://164.156.71.80/WXOD.aspx.
Pierce County Washington (2005) “Pierce County Stormwater Management and Site Development Manual”.
Roy, L.P. (2006) “The Perils of Parking Lots”, online, www.landdevelopmenttoday.com.
O&M Requirements/Costs USEPA suggests inspecting the pavement several times during the first few months after construction and annually thereafter. The annual inspections should be done after large storm events so any puddles can be noted easily. Pre-treatment devices should also be inspected at this time. All referenced documents stress preventative care to limit the potential for clogging. This includes stabilizing adjacent landscaping and including these areas on regular inspections; not allowing muddy construction equipment on the base or paving surfaces; directing sediment-laden runoff to pretreatment areas; and installing filter fabric between the aggregated and underlying soils. Routine cleaning will need to be accomplished as many as four times a year. Cleaning requirements for different types of permeable paving are provided below:
Porous asphalt and concrete can be cleaned using suction, sweeping with suction, or high-pressure wash and suction.
Pavers should be swept with suction when the surface and debris are dry.
Plastic grids topped with gravel should have the entire top course removed using a vacuum truck and replaced.

91
Small holes (½-inch) may be drilled through the porous pavement layer every few feet to relieve spot clogging. Potholes and cracks can be filled with patching mixes unless more than 10% of the surface area needs repair. Estimated annual maintenance costs start from approximately $200 per acre, including four inspections and vacuum sweeping treatments. Potential LEED® Credits
Potential LEED® Credits for Permeable Paving
Category Credit Points
Sustainable Sites 6.1 – Stormwater Design: Quantity Control 1
Sustainable Sites 6.2 – Stormwater Design: Quality Control 1
Sustainable Sites 7.1 – Heat Island Effect: Non-roof 1
Materials and Resources
4.1 – Recycled Content: 10% (post consumer + ½ pre-consumer)
1
Materials and Resources
4.2 – Recycled Content: 20% (post consumer + ½ pre-consumer)
1
Materials and Resources
5.1 – Regional Materials: 10% Extracted, Processed & Manufactured Regionally
1
Materials and Resources
5.2 – Regional Materials: 20% Extracted, Processed & Manufactured Regionally
1
Innovation & Design Process 1-1.4 – Innovation and Design 1-4

92
This page is intentionally left blank.

93
Subsurface Chamber Stormwater Management Systems Subsurface chamber systems are designed to function as stormwater detention, retention, infiltration and/or first-flush storage. These component systems come in dimensions that make them easy to configure for most sites. Their shape makes them durable and able to be placed under roads and parking lots with adequate cover. Concrete chambers are an alternative that can also be used with minimal cover requirements. Suitability Subsurface chambers can be used for commercial, municipal, industrial, recreational, and residential applications including installation under parking lots and commercial roadways. Design Considerations Storage Volume will depend on the quantity of stormwater to be attenuated or harvested. It will also determine the size of various pretreatment units such as sediment sumps and oil/water separators. Subsurface chambers are modular, and will need the following components:
Chambers.
Filter fabric to cover the chambers.
Endcaps to seal the chambers.
Manifolds and connections to collection system.

94
Effectiveness Subsurface chambers are used primarily for stormwater detention, though some infiltration can occur depending on soil porosity. Removal Efficiency These systems are designed typically for storage only. Removal of pollutants could be enhanced if incorporated with pre-treatment systems such as sediment sumps, oil/water separators, and “isolator” rows. The “isolator” is comprised of the same chambers but it is wrapped in a non-woven filter fabric and a woven fabric separating the bottom of the chamber from the crushed rock bed. StormTech offers an “isolator” row which can be added which will accept the first flush. The first flush will fill up the chamber, depositing sediment on the woven fabric. The woven fabric provides a strong material to support the deposited sediment as well as withstand the hydrojetting cleaning process. Stormwater will pass through the sides and bottom of the chambers and through the non-woven and woven fabric. The water will then flow through the rock bed to the outlet. Limitations Erosion and sediment control measures must be integrated into the design to protect the stormwater system during and after construction. These practices may have a direct impact on the system’s infiltration performance and longevity. Construction Costs Installed costs of subsurface chambers range from $3.50 to $7.00 per cubic yard. Avoided Costs Developers may achieve cost savings from these systems through a reduction in the size of traditional stormwater infrastructure (i.e., pipes, inlets, retention ponds) and through an increase in developable area. If the stormwater can be harvested for non-potable uses such as toilet flushing and irrigation, savings will also be realized in reduces potable water and sewer expenses.

95

96
Hawaii Installations There are no known subsurface chamber systems in Hawaii. Other Information These systems are included as a modeling option in all HydroCAD models for stormwater storage, detention, or infiltration. References Additional information about subsurface chambers can be found in the following references:
CULTEC, 2008, http://www.cultec.com.
StormTech, 2008, www.stormtech.com.
StromTrap, 2008, http://www.stormtrap.com. O&M Requirements/Costs O&M requirements include periodic inspection and cleaning of upstream catch basins, sumps, screens/filters, or other pre-treatment devices every 2 to 3 months. The outlet structure should be inspected on the same schedule. The chambers and chamber bed should be inspected annually. Pre-treatment devices will reduce the required maintenance. However, sediment may still build up over time and need to be removed. Hydro-jetting can be used to remove sediment from the isolator row, if installed.

97
Potential LEED® Credits
Potential LEED® Credits for Subsurface Chambers
Category Credit Points
Sustainable Sites 5.1 – Site Development Protect or Restore Habitat
1
Sustainable Sites 6.1 – Stormwater Design Quantity Control
1
Sustainable Sites 6.2 – Stormwater Design Quality Control
1
Water Efficiency 1.1 – Water Efficient Landscaping Reduce by 50%
1
Water Efficiency 1.2 – Water Efficient Landscaping No Potable Water Use or No Irrigation
1
Water Efficiency 3.1 – Water Use Reduction 20% Reduction
1
Water Efficiency 3.2 – Water Use Reduction 30% Reduction
1
Materials and Resources 4.1 – Recycled content 10% Post-Consumer + ½ Pre-Consumer
1
Materials and Resources 4.2 – Recycled content 20% Post-Consumer + ½ Pre-Consumer
1
Materials and Resources 5.1 – Regional Materials 10% Extracted, Processed & Manufactured Regionally
1
Materials and Resources 5.2 – Regional Materials 20% Extracted, Processed & Manufactured Regionally
1
Innovation and Design Process
1-1.4 – Innovation in Design 1-4

98
Hydrodynamic Devices Hydrodynamic devices rely on the energy and velocity of the stormwater flow to remove sediment, debris, floatables and oil. One configuration utilizes baffles and chambers to rotate the flow and create a vortex, which causes the heavier elements in the flow to collect in the center of the chamber. These systems can also incorporate weirs and orifices to further reduce the velocity of the flow to allow finer sediments to settle out and trap material lighter than water (e.g. oil). Another configuration uses baffles and weirs to lengthen the flow path and reduce the velocity of the storm flow through the system. These configurations allow sediment to settle and trap material lighter than water. Suitability These systems can be connected to standard stormwater collection and conveyance infrastructure. They come in various sizes and configurations. Hydrodynamic devices are designed for water quality treatment so their sizes will be smaller relative to other BMPs that incorporate volume attenuation for a given treatment area. Even though they may not be designed to treat the peak flow, most of the devices are designed to be able to pass the peak flow for typical design storms (e.g., 10-year or 25-year events), making them suitable for in-line installation or offline as desired. Their below-grade installation make the devices especially suited for urban areas and stormwater hotspots (localized pollutant sources like gas station islands, equipment storage aprons, and vehicle maintenance areas). They can either be implemented as stand alone treatment devices or as part of chain of treatment along with filters and storage

99
devices to provide further stormwater reclamation and reuse opportunities. Design Considerations Design considerations for hydrodynamic devices are discussed below:
Key considerations for sizing include water quality treatment volume, peak flow from the design storm (minimum 10-year storm), and manufacturer’s standard sizes for the hydrodynamic device. It is recommended that an offline configuration be use if the peak flow from the design storm is greater than 5 times the water quality treatment volume.
− Water quality treatment volume is typically considered the volume of stormwater runoff from a 1” storm or from ½” over the entire drainage area flowing to the device. Local stormwater regulations may determine the required treatment volume.
− Some devices are required to bypass at least the peak flow from the 10-year design storm without washout of collected contaminants.
− Device size is based on the manufacturer’s recommendations. Each manufacturer calculates the amount of flow for the device with slightly different methods that are typically proprietary. Each manufacture has either a design book or computer program to aid in device sizing. Manufacturers should always be consulted for final sizing recommendations. Typical design information required for sizing and system selection includes:
♦ Drainage area.
♦ Site runoff coefficient or impervious area as a percentage.
♦ Precipitation intensity or design storm for the area.
♦ Anticipated pollutants to be removed.
Slope is important since it plays a role in determining the velocity of flow. Higher slopes may require energy dissipation to prevent re-suspension and washout of collected material. Flatter slopes should be checked for effectiveness with the devices.

100
Soil/subsurface conditions will be a factor for determining the size and configuration of the filters. Depth to bedrock and water table may limit the type and size of the device.
Overflow devices may be required when the devices are constructed in-line.
Effectiveness These devices are intended for water quality treatment only. Their effectiveness is determined by the area drained and the nature of pollutants to be treated (e.g., floatables and suspended solids). These devices are not effective for dissolved pollutants. These systems are particularly suited to challenging sites such as urban environments and stormwater “hotspots”. They work well in urban environments because of their small footprint and because they are placed underground. For stormwater hotspots, the devices are effective for removing suspended solids, floatables, oil/grease and other contaminants lighter than water. Removal Efficiency Most removal efficiencies are supplied by the manufacturers. Stormwater Authority (2008) presents the following constituents and range of removal:
TSS - 21 to 51%.
Phosphorus - 17%.
Lead - 24 to 51%.
Zinc - 17 to 39%.
Copper - 21%. CONTECH has several studies regarding the Vortechs™ filter system. The four studies are from the Northeast U. S. with three of them focused on parking areas, which ranged in size from 1.6 to 4 acres (Board, 1999; Allen, 1998; Greenway 2000). The other study described results from a neighborhood sub-catchment of about 9.3 acres (Bloomfield et al, 2001). All four studies included TSS removal efficiencies, which ranged from 60 to 96%. Board (1999) included removal results for copper (56%), lead (46%) and zinc (85%). Greenway (2000) included removal efficiencies for total petroleum hydrocarbons (TPH) (67%) and total solids (38 %).

101
Three studies were reviewed for the proprietary Stormceptor® technology: a 9.9 acre commercial parking lot (1996 City of Edmonton, Alberta), a 0.65 acre truck loading/unloading area (1997 Westwood, Massachusetts) and a study with no description of drainage area (1997 Study by Massachusetts Envirotechnology Partnership Program). The three summaries reported TSS removal efficiencies of 53% from the 9.9 acre commercial parking area, 93%for the 0.65 acre truck loading/unloading area, and 77% from the undefined study area. The 9.9 acre parking area study also included the following removal efficiencies:
Lead - 51.2%.
Oil and Grease – 43.2%.
Copper - 21.5%.
Zinc – 39.1%.
Iron – 52.7%.
Chromium – 40.7%. The 0.65 acre truck loading/unloading area study included removal efficiency of TPH of 82%. Limitations These systems are limited by the size and characteristics of the drainage area. The units are only manufactured to certain dimensions, which limit the volume of runoff they can accept. If large drainage areas are to be treated, other BMPs such as rain gardens or ponds may be more cost effective. As the ratio of system storage to discharge area decreases, the performance of the device also decreases. Drainage area characteristics also play a role. “Unstable” sites which have a higher than normal potential for erosion; sites with exposed aggregate, sand, or soil piles; or sites with unpaved roadways and parking areas will challenge the system. The reason is that these devices are typically designed to treat the “first flush” and pass subsequent flows that typically have less pollutants than the “first flush”. Sites with little ground cover are more likely to be subject to soil erosion and are considered to have a relatively constant sediment load throughout the storm event.

102
These devices have limited or no ability to capture nutrients, fines, and dissolved solids. Additional treatment would be needed if these pollutants are expected to be in the stormwater runoff. Since these units are typically installed below grade, a site with a high water table or bedrock may make these options infeasible. Enhanced Stormwater Management Opportunities Utilizing hydrodynamic devices in conjunction with constructed filters can provide 85% removal for TPH and 98% removal for TSS, (Greenway, 2000). Stormwater runoff could be reclaimed for irrigation and other non-potable uses, if hydrodynamic devices, constructed filters, and subsurface tanks are connected together. Construction Costs Stormwater Authority (2007) reports capital costs for a typical swirl separator between $5,000 and $35,000 per impervious acre. The costs depend on the amount of runoff to be treated and the difficulty of installation. Weiss (2003) estimates capital costs to be approximately $10,000 per impervious acre with the following assumptions: 20 inches of annual rainfall, 100 mg/l TSS, and 70% imperviousness. The same reference also provides an estimate of $2,300 per unit. For custom-built, cast-in-place units, costs may be as high as $40,000 per unit. Costs for land acquisition are not included. Avoided Costs Since these systems are installed underground, developable land or land to meet open space requirements may be preserved. This could add revenue to the overall development by having more land to develop or save permitting costs by meeting open space requirements. Hawaii Installations There are no known installations in Hawaii.

103
References Additional information for hydrodynamic devices can be obtained from the following references:
Allen, V. (1998), “Results from the Vortechs Stormwater Treatment System Monitoring Program at DeLorme Publishing Company Yarmouth Maine”, online at http://www.contech-cpi.com/stormwater/products/hydrodynamic_separation/vortechs/72.
Bloomfield, J.; Lake, D.; Sutherland, J.; and West, T. (2001), Study, “Study of the Effectiveness of a Vortechs Stormwater Treatment System for Removal of Total Suspended Solids and Other Pollutants in the Marine Village Watershed Village of Lake George New York” online at http://www.contech-cpi.com/stormwater/products/hydrodynamic_separation/vortechs/72.
Board, Mary (1999), Masters Thesis, “Vortechs Treatment of Parking Lot Runoff”, online at http://www.contech-cpi.com/stormwater/products/hydrodynamic_separation/vortechs/72.
Brown and Caldwell (2004), “Screenings of Feasible Technologies for Wastewater and Stormwater Management for San Francisco Bayside Watersheds”.
Contech Stormwater Solutions (2007), “Hydrodynamic Separation Products”, online at http://www.contech-cpi.com/media/assets/asset/file_name/249/hds_tech-brief.pdf.
Greenway, A.R. (2000), Report, “Stormwater Treatment Demonstration Project Oil Water/Grit Separator Followed by Sand Filter”, online at http://www.contech-cpi.com/stormwater/products/hydrodynamic_separation/vortechs/72.
Stormceptor Summaries (1996-1997), online at http://www.stormceptor.com/en/technical-information/testing.html.
Stormwater Water Authority (2007), “BMPs In A Flash Site Design Applicability Costs Maintenance and More”, online at http://www.stormwaterauthority.org/bmp/.
O&M Requirements Maintenance centers predominantly on the removal and disposal of sediment. Quarterly to annual estimates for sediment removal range

104
from $500 to $2,500, respectively. Costs may be higher if the material is considered hazardous or contaminated (Stormwater Authority, 2007). Brown and Caldwell (2004) estimates the cost to be $250 annually but also notes that travel distance, cleaning frequency, and nature of the sediment will play a role in determining the operation and maintenance costs. Potential LEED® Credits
Potential LEED® Credits for Hydrodynamic Devices
Category Credit Points
Sustainable Sites 6.2 – Stormwater Design Quality Control 1
Innovation & Design Process 1-1.4 – Innovation in Design 1-4

105
This page is intentionally left blank.

106
Constructed Filters Constructed filters provide treatment options for areas that have limited space. They can be installed above grade or underground. Their designs range from relatively simple planter box-like structures to more complex structures that utilize weirs, permanent pools, trash screens and filter media to capture and treat runoff from roofs and surrounding impervious surfaces. The filters contain engineered soils which provide the treatment required. There are five typical filter configurations:
1. Surface Sand.
2. Subsurface Sand.
3. Perimeter (Delaware).
4. Organic Media.
5. Multi Chamber Treatment Chain. Surface sand and organic media filters are similar to rain gardens. Suitability Constructed filters can receive flow from rain gutters or other pipes when installed at or below grade, or sheet flow when installed below grade. The design can range from the appearance of traditional planters or other landscaping features to more complex structures that impound and screen water to remove large debris prior to filtration through engineered media. Because these systems are designed to provide treatment in a compact form, they are compatible with new construction, existing residential developments, and existing urban stormwater infrastructure. They are especially suitable for urban areas because they can be installed in locations with limited available open space. Constructed filters are one of the few BMPs that are compatible with stormwater “hotspots” (i.e. downstream from automotive repair shops

107
and washing facilities, commercial nurseries, and gas stations). Perimeter (Delaware) filters are particularly suited for siting around the edge of parking lots, equipment storage areas, maintenance aprons and material stockpile areas. Design Considerations Design considerations for constructed filters are discussed below:
Drainage area can be up to 10 acres depending on available room for the filter. Two acres are considered the maximum for perimeter (Delaware) filters. Other drainage area considerations include:
- Water quality treatment volume is typically considered the volume of stormwater runoff from a 1” storm or from ½” over the entire drainage area flowing to the filter.
- Filters are typically required to store at least 75% of the water quality treatment volume prior to filtration and discharge.
Filters can be installed on sites with slopes up to 6%. Sites with low slopes need to be examined to ensure enough head is available over the filter. Five to eight feet of head are required to convey the flow through the filters and downstream. Two feet of head are required for perimeter (Delaware) filters.
Soil and subsurface conditions will be a factor in determining the configuration of the filters:
- Soil Types HSG A & B typically offer the best opportunities for exfiltration.
- Depth to bedrock limits use of subsurface and designs that rely on exfiltration of stormwater.
- Depth to water table limits use of subsurface and exfiltration configurations and should be at least 2 feet to prevent undermining the filter structure.
Diversion structures may be required. They are designed to allow at least 75% of the water quality treatment volume to enter the system prior to bypass.
Overflow devices are only required for in-line filters, such as the perimeter (Delaware) filter. All overflow devices should be able to bypass flows greater than the water quality treatment volume.

108
Pre-treatment can be used to reduce maintenance on the filter and can include dry or wet chambers for sedimentation. Pre-treatment volume is typically 25% of the water quality volume. It can be calculated using the Camp-Hazen equation as adopted by the Washington State Department of Ecology, to provide a length to width ratio of 1.5:1.
Different filter media can be chosen to provide targeted treatment characteristics. Medium sand (ASTM C-33 for concrete sand) or organic media containing a mixture of peat/sand mix or leaf compost is recommended for use. Cross sections can include filter fabric to evenly distribute flow and prevent formation of channels. Organic filters and surface sand filters can include a layer of top soil above the filter media.
Depth of the filter material varies depending on the type of filter. Some examples from the literature are presented below:
- Underground Sand Filter – 24” of sand; minimum depth reported as 18”.
- Perimeter Sand Filter – 18” of sand; minimum depth reported as 12”.
- Organic Filter 1” – 18” of 50% peat and 50% sand mixture over 6 inches of sand.
- Organic Filter 2 – 18” to 24” of leaf compost.
- Flow-through planter – 18” of sandy loam with no more than 5% clay content; 50 to 60% sand; and 20 to 30% compost free of stones, roots, noxious weeds.
Depth of gravel layer should be a minimum of 12” to 18”.
The area of the filter is determined by Darcy’s Law utilizing published coefficients of permeability for the specified filter media.
Ponding depth above filter is determined based on storage requirements and head needed for conveyance. It typically ranges between 6”and 12”.
Plantings can be used to aid in treatment and for aesthetic purposes. Plants should be able to sustain brief periods of inundation and prolonged dry conditions. The University of Hawaii Manoa is currently developing a list of native plant species for these type of systems (see References).

109
Underdrain pipe diameter should be designed as required to sustain flow rates through the soil media and convey treated water to storage or to a downstream municipal stormdrain.
Effectiveness These systems deliver primarily water quality attenuation. There effectiveness is determined by the area drained, pre-treatment provided, and the filter media. They work well in urban environments because of their small footprint and because they can be placed underground. These systems are particularly suited to challenging sites such as urban environments and stormwater “hotspots”. The filters can be configured to treat particular contaminants with higher than normal concentrations such as hydrocarbons, metals, nutrients, and sediments. Removal Efficiency Quality improvements have been compared to bio-retention cells or rain gardens. Contaminant removal includes sediments, metals, hydrocarbons (e.g., oil) and nutrients (nitrogen and phosphorus). The following contaminant removals have been published:
TSS - 66 to 98%.
Metals - 26 to 100%.
Hydrocarbons - mentioned but not specifically reported.
Nitrogen – 30 to 68%.
Phosphorus - 4 to 85%. (Penn, 2006; LID 2005; Vermont, 2002; CCCWP, 2006; Stormwater Authority, 2007). Limitations One major limitation of constructed filters is their in ability to provide water quantity attenuation. Downstream flooding and erosion will still be an issue. Another limitation is the size of the drainage area that can be accommodated by these systems. One system would be too large for

110
areas greater than 10 acres and be more susceptible to fouling because of the increased sediment and debris loads from larger areas. Employing more than one filter to accommodate larger areas may not be as cost effective as traditional stormwater detention/retention ponds. These systems may not be suitable for treating surface runoff if there is insufficient ground slope to meet the head requirements. Enhanced Stormwater Management Opportunities Utilizing constructed filters as pretreatment for stormwater collection systems (e.g., subsurface tanks) can improve water quality for irrigation and prevent fouling of the storage device. Installation of hydrodynamic devices upstream of the filters could reduce sediment load on the filters. A treatment train could include hydrodynamic devices for solids/debris removal; filters for TSS, metals, volatiles, phosphorus, nitrogen; and subsurface chambers for storage, reuse, or infiltration. Construction Costs Stormwater Authority (2007) reports costs for construction to range from $2.50 to $7.50 per cubic foot of treated water. This estimate includes a 25% contingency. Costs for Perimeter (Delaware) and subsurface filters may be greater, but they conserve developable area. Low Impact Development for Big Box Retailers (LID, 2005) quoted costs in 2005 dollars for flow-through planter boxes and tree box filters as $4,000 per ½-acre and $19,000 per ½ acre, respectively. These costs roughly equate to $4.50 and $21.00 per cubic foot respectively, based on ½” rainfall. Avoided Costs Avoided costs may be limited unless the perimeter filter or subsurface filters are used to conserve developable land area. Hawaii Installations There are no known installations in Hawaii. Other Information

111
Systems should be designed to draw down standing water within a specified time-frame to prevent negative impacts associated with standing pools of water such as mosquito breeding.

112
References Additional information for constructed filters can be obtained from the following references:
Cabugos L, Kaufman A, Cox L, Miura T, Easterday D (2007) “Feasibility of Rooftop Landscaping with Native Hawaiian Plants in Urban Districts of Hawaii” online, http://www.botany.hawaii.edu/gradstudentpages/Grad_Student_Pubs/Cabugosetal2007.pdf.
Contra Costa Clean Water Program (2006), “Stormwater C.3 Guidebook”.
Pennsylvania Department of Environmental Protection Bureau of Watershed Management (2006), “Pennsylvania Stormwater Best Management Practices Manual”, online, http://164.156.71.80/WXOD.aspx.
Stormwater Authority “BMPs in a Flash”, 2007, online: http://www.stormwaterauthority.org/bmp/.
The Low Impact Development Center (2005) “Low Impact Development for Big Box Retailers”.
University of Hawaii Manoa Green Roof Feasibility Team (2006) “Feasibility of Green Roofs in Hawaii – A Source of Private and Public Benefits” online, http://www.hawaii.edu/offices/eaur/govrel/reports/2007/sr86_2006_feasiblity_study_green_report.pdf.
Vermont Agency of Natural Resources (2002), “The Vermont Stormwater Management Manual – Volume I Stormwater Treatment Standards”.
O&M Requirements The Vermont Stormwater Manual (2002) recommends the following maintenance on the systems.
Remove sediment from pre-treatment areas once it attains 6” in depth or when drawdown time exceeds 36 hours.
Remove silt/sediment from filter beds when it exceeds a 1” depth.

113
Remove and dispose the top few inches of the filter bed when ponding occurs on the filter bed for 48 hours or more.
Maintain height of vegetation for surface filters to 18”.
Remove trash and debris as necessary.
The LID (2005) report presents annual maintenance costs in 2005 dollars for the constructed flow-through planter box and tree filter box of $150 to $400 annually. This cost includes mulching, weeding, and debris removal, and replacing vegetation. The report also includes an additional cost of $500 in 2005 dollars every 5 years for concrete repair. The LID (2005) costs are based on a ½-acre treatment area and planter-type configurations. The cost to maintain the filters will increase as the treatment area increases and filter configurations become more complex. Potential LEED® Credits
Potential LEED® Credits for Constructed Filters
Category Credit Points
Sustainable Sites 6.2 – Stormwater Design Quality Control
1
Materials and Resources 5.1 – Regional Materials 10% Extracted, Processed & Manufactured Regionally
1
Materials and Resources 5.2 – Regional Materials 20% Extracted, Processed & Manufactured Regionally
1
Innovation & Design Process
1-1.4 – Innovation in Design 1-4

114
This page is intentionally left blank.

115
Reinforced Turf Surfaces Reinforced turf surfaces are high-density polyethylene grid structures designed to house turf grass similar to those used for permeable paving. The grass reinforcement structure distributes loads from pedestrian and vehicle traffic to the base course. The individual cells in the grass pavers minimize grass and root compaction maintaining its infiltration capability. Suitability Reinforced turf surfaces are used in conjunction with normally dry detention areas designed as sport fields or park areas. They provide a rugged support for maintenance vehicle access as well as a means of quickly infiltrating stormwater after storm events. Design Considerations Design considerations for reinforced turf surfaces include the following:
Area of drainage is the area of the sports field, the bottom area of the detention basin, or other as required to maintain discharge rates from dry detention areas.
Average rainfall is for the required design storm in inches.
Infiltration rate of the uncompacted soil should be a minimum of 0.5” per hour.
Filter fabric is required to cover the grid to prevent plugging.
Depth to bedrock should be a minimum of 4 feet.
Depth to water table should be a minimum 4 feet.
Underdrain pipe diameter will be determined depending on the soil type (typically HSG, C and D) and the capacity to convey

116
treated stormwater to storage or a downstream connection with a municipal stormwater system.
Head needed to convey flow from system to a storage tank or connection with municipal storm sewer.
Depth of engineered soil as required for quality treatment. An 18” minimum is required when using compost, sphagnum peat moss or other organic material.
Effectiveness These technologies can be used under public/private sport fields, golf courses, and other public/private green spaces to help infiltrate stormwater. In some cases large sport fields and open green spaces are designed as stormwater detention areas. These systems will enhance the effectiveness of these areas by aiding infiltration into the underlying soil or delaying runoff through soil percolation prior to being conveyed downstream by an underdrain and reduce downstream erosion/sedimentation and flooding. Removal Efficiency Quantity and quality attenuation will be similar to permeable paving. Engineered soils can enhance the removal efficiency of these technologies. Limitations Fertilizers, herbicide and pesticide use should be minimized since these systems will convey excess chemicals downstream or into the underlying soil layers rapidly. Construction Costs Construction cost estimates for plastic grid systems range from $1.50 to $5.75 per square foot installed. Avoided Costs Using park and recreation space as dry detention areas can reduce costs for providing a separate detention/retention area. In addition, eliminating the need for an additional stormwater management area

117
would preserve space for additional development or open space to help meet LEED® credits or county park/open space requirements.

118
Hawaii Installations The company Invisible Structures, Inc. has installed Grasspave2 and Draincore2 reinforced turf surface at a private residence in Hawaii. Other Information These systems offer a stabilized, durable and lush grass surface when used in conjunction with subsurface tanks and other drainage enhancement features. This combination helps reduce pollutants, results in a better environmental outcome, and adds beauty and quality to the landscape. References Additional information about reinforced turf surfaces can be found in the following reference:
Carollo Engineers (2006) “Low Impact Development Literature Review” for San Francisco Public Utility Commission.
O&M Requirements/Costs Operation and maintenance requirements of reinforced turf surfaces include:
Periodic turf trimming and aeration.
Inspection of plastic grid walls.
Replacement of plastic grid sections as necessary.

119
Potential LEED® Credits
Potential LEED® Credits for Reinforced Turf Surfaces
Category Credit Points Sustainable Sites 5.2 – Site Development
Maximize Open Space 1
Sustainable Sites 6.1 – Stormwater Design: Quantity Control
1
Sustainable Sites 6.2 – Stormwater Design: Quality Control
1
Materials and Resources
4.1 – Recycled Content: 10% (post consumer + ½ pre-consumer)
1
Materials and Resources
4.2 – Recycled Content: 20% (post consumer + ½ pre-consumer)
1
Materials and Resources
5.1 – Regional Materials: 10% Extracted, Processed & Manufactured Regionally
1
Materials and Resources
5.2 – Regional Materials: 20% Extracted, Processed & Manufactured Regionally
1
Innovation & Design Process
1-1.4 – Innovation and Design 1-4

120
Excavated Basins Excavated basins include ponds or other basins excavated to depths on the order of 10 to 20 feet below ground surface. This measure is most appropriate in areas where vertical impediments to downward percolation such as low permeability soils are thick or where existing ponds are present, such as at golf courses or parks. These basins may double as temporary stormwater storage facilities. This technique may be applicable in cases where additional measures, such as flood control, can be developed, since the basins provide water storage. Since the amount of stormwater recharge is dependent on contact time of the water with the basin bottom, total recharge is typically higher than for surface spreading methods. Suitability This technique is most suitable in the following circumstances:
Areas with moderate (0.63 to 2.0 inch/hour) to rapid (6.3 to 20.0 inch/hour) soil permeability (HSG A and B), which includes most basaltic terrains and much of the Ewa Plain Caprock.
Rural or open areas with moderate to high land availability.
Suitable geology such as an absence of impermeable layers between the base of the basin and the water table aquifer.
Absence of surficial contamination, critical habitats or historic cultural sites.
A potable or non-potable unconfined aquifer.
If above a potable aquifer, there should be an absence of expanding-contracting clays or fractures in the vadose zone that could allow short-circuiting of the soil horizon, and a presence of

121
sufficient clay, organic-rich sediments, and/or available carbon for adsorption and biodegradation processes (or pretreatment).
Excavated basins are also suitable for use as reservoirs for irrigation.
An illustration of an excavated basin is shown below.
Design Considerations Excavated basins are most appropriate in locations where vacant land is available, and where vertical impediments to infiltration such as low permeability layers in the vadose zone are not present. Excavated

122
basins are often constructed in sequences adjacent to streams, so that excess stormwater flows from the stream or stormwater channel can be diverted under gravity to the first basin, then overflows from each basin to the next under gravity, and back to the stream or stormwater channel at the end. The hydraulic loading rate is preliminarily estimated by soil studies, but final evaluation is completed through operating in situ test pits or ponds. Hydraulic loading rates for rapid infiltration basins typically vary from 65 to 500 feet per year, but are usually less than 300 feet per year (USEPA 2004). The recharge effectiveness will be limited by the lowest vertical permeability layer in the vadose zone. Safety is a concern, and signage is a minimum requirement. Fencing and/or a ladder may be necessary if the basin is open to the public. Effectiveness Field testing for the Farmington Groundwater Recharge Program in the Central Valley of California (www.farmingtonprogram.org) as well as other studies, indicate that infiltration rates are typically higher for excavated pits than for surface spreading. This probably results because any shallow clayey soils and hardpan have been removed and from increased lateral infiltration through larger side-wall areas of the basins. For design and cost estimating purposes, the long-term recharge rate of 1.0 ft/day was assumed for excavated pits. While lower than some of the pilot test results in the Farmington Program, this rate was reasonable when long-term clogging and algal growth were considered. Pollutant Removal Efficiency This technique has an intermediate level of removal of contaminants through filtration and adsorption in the vadose zone (depending on the depth to groundwater and vadose zone characteristics). The effectiveness is less than surface spreading (since the shallow soil horizon has been removed) and thus requires minimal treatment. Turbidity in particular is generally removed in the vadose zone unless short-circuiting occurs. The depth to water, soil characteristics, and potential for short circuiting by fractures must be evaluated for each site. The water table must remain below the base of the pond for vadose zone biodegradation to occur and to maintain high infiltration rates. Limitations

123
The primary limitations on this technique are the following:
Topography.
Excavation feasibility and costs.
Vadose zone permeability.
Physical characteristics of the vadose zone.
Land availability.
Proximity to potential contaminant sites.
Insect breeding.
Public safety issues.
In the non-flood season months, the ponds may require supplementary well water to maintain other uses. Enhanced Stormwater Management Opportunities In addition to groundwater recharge, excavated ponds can provide seasonal habitat and/or recreational opportunities such as for golf courses and parks. Construction Costs Costs associated with construction of excavated pits include the following:
Land acquisition.
Clearing and grubbing.
Excavation and grading.
Site fencing.
A small pumping plant.
Groundwater monitoring well construction.
Excavated recharge pits are considerably more expensive than surface spreading due to soil excavation and removal costs. For cost estimating purposes of new basins, it may be assumed that pits would be 200 feet by 50 feet in area, and excavated to a depth of 15 feet with two-to-one

124
sloped sidewalls. A ramp would be constructed to allow access for equipment to the base of the pit. The pits would be spaced at least 200 feet apart to enable lateral infiltration from each pit. Excavated materials would be redistributed throughout the remainder of the site. Avoided Costs Excavated basins can serve as a back-up water supply for irrigation, which could defray the cost of purchased irrigation water. They also reduce downstream stormwater facility needs. Hawaii and Other Installations There are numerous golf course and park ponds in Hawaii (including many on the Ewa Plain). Some excavated stormwater detention basins also provide infiltration to some degree. Such facilities are also installed and operating at numerous locations in the western United States, especially California and Arizona, including the examples listed below under references, such as Orange County Water District. Other Information Test monitoring of the water quantity and quality entering and exiting the basin; water levels and water quality in adjacent monitoring wells; and other environmental impacts (such as high water table in adjacent basements, insect breeding, etc) is necessary prior to full-scale implementation. If a potable aquifer is being recharged, supply wells or guard monitoring wells should also be monitored. Pilot tests provide the opportunity to evaluate environmental impacts, O&M requirements and costs. References Additional information about excavated basins can be found in the references below:
Bouwer, Herman (1996). Issues in artificial recharge. Water Science and Technology, 33(10–11):381–390.
Central Arizona Project, Recharge Program, on-line at http://www.cap-az.com/static/index.cfm?action=group&contentID=77.

125
Orange County Sanitation District, Orange County Groundwater Replenishment System, on-line at www.gwrsystem.com/.
Stockton East Water District, Farmington Groundwater Recharge Program, on-line at http://www.farmingtonprogram.org/.
United States Geological Survey, Kansas Water Science Center, on-line at http://ks.water.usgs.gov/Kansas/studies/equus/.
U.S. Environmental Protection Agency, Risk Management Research, on-line at http://www.epa.gov/NRMRL/pubs/625r04108/625r04108.htm (section 2.5).
U.S. Environmental Protection Agency, Groundwater & Drinking Water, Underground Injection Control Program, Class V Wells, on-line at http://www.epa.gov/safewater/uic/class5/index.html.
World Health Organization, Water Sanitation and Health, Groundwater Recharge: Criteria for Health Related Guidelines, on-line at www.who.int/water_sanitation_health/wastewater/wsh0308chap2.pdf.
O&M Requirements Annual costs associated with operation and maintenance may include insect abatement services, program management and maintenance, intermittent cleaning, and water level and water quality monitoring. Sediment removal and/or reconstruction of the excavated basin might be necessary as infiltration rates decrease over time.

126 DRAFT
Infiltration Trenches Typical vadose zone infiltration trenches are wider than they are deep, and therefore are not considered Class V injection wells by the USEPA or Hawaii Department of Health (DOH). They are backfilled with porous media. Water may enter at one end into a perforated pipe for distribution along the length of the trench or a riser pipe that allows water to enter at the bottom of the trench to prevent air entrainment. An advantage of vadose zone infiltration trenches is the significant cost savings as compared to direct injection wells. A significant disadvantage is that they cannot be backwashed and a severely clogged trench can be permanently destroyed. Therefore, reliable pretreatment is considered essential to maintaining the performance. Since vadose zone infiltration trenches allow for percolation of water through the vadose zone, water quality improvements commonly associated with soil-aquifer treatment can be expected.
Dry wells, also known as vadose zone infiltration wells, are wells installed above the water table but below low permeability soils such as clay. The dry well typically contains a perforated pipe that extends from approximately 1 to 2 feet below ground surface to the bottom of the well. The entire well is filled with a permeable material. It consists usually of a gravel pack consisting of cobbles, which allows water to percolate through the well to lower, more permeable underlying soils, such as sand and gravel. Dry wells would be installed with a direct water supply to each well.

127
Suitability This technique is most suitable in the following circumstances:
Areas with moderate (0.63 to 2.0 inch/hour) to rapid (6.3 to 20.0 inch/hour) soil permeability (HSG A and B), which includes most basaltic terrains and much of the Ewa Plain Caprock.
Areas with moderate land availability.
Suitable geology that includes an absence of impermeable layers between the base of the trench and the water table.
Absence of surficial contamination, critical habitats or historic cultural sites.
Either potable or non-potable unconfined aquifer.
If above a potable aquifer, there should be an absence of expanding-contracting clays or fractures in the vadose zone that could allow short-circuiting of the soil horizon, and a presence of sufficient clay, organic-rich sediments, and/or available carbon for adsorption and biodegradation processes (or pretreatment).
An illustration of an infiltration trench is shown on the following page.

128
Design Considerations Infiltration trenches are most appropriate in locations where at least some land is available, and where vertical impediments to infiltration such as low permeability layers in the vadose zone are not present. Infiltration trenches or dry wells may be constructed in sequence so that excess stormwater flows from the stream or stormwater channel under gravity to the facilities in sequence. Depending on the stability of the local soils, filter fabric may be necessary on the sides and/or top of the trench to prevent surrounding soil from clogging the facility. An optional layer of pea gravel on top of the filter fabric at the top of the trench can maximize sediment and pollutant removal and easily be replaced if the facility starts to clog. Typical trench depths range from 3 to 12 feet. Infiltration trenches should be designed with a bypass to direct excess flow away from the trench to appropriate locations downstream. This can be done overland or in storm pipes, but should minimize concentrated erosive flow. If the trench is designed to capture sheet flow off an impervious surface, the trench should be oriented perpendicular to the flow direction.

129
A long-term average infiltration rate of 50% of the U. S. Department of Agriculture (USDA) estimated soil permeability of 0.63 to 2.00 inches per hour may be assumed for planning purposes. This estimate assumes that some clogging occurs, but that periodic O&M such as cleaning is performed. For dry wells, the theoretical per well recharge rate can be estimated using Zanger’s equation (Bouwer, 1996). Effectiveness The recharge effectiveness will be limited by the lowest vertical permeability layer in the vadose zone. Infiltration trenches or dry wells are prone to plugging from the accumulation of fine sediment in the coarse material and are only appropriate where the source water has low turbidity or after pretreatment. Clogging materials accumulate over time. Once an infiltration trench or dry well is plugged, it must be redeveloped or replaced. Pilot testing of this measure would be necessary to determine treatment requirements. Pollutant Removal Efficiency This technique has an intermediate level of removal of contaminants through filtration and adsorption in the vadose zone (depending on the depth to groundwater and vadose zone characteristics). Removal is less than surface spreading since the shallow soil horizon has been removed. Turbidity is generally removed in the vadose zone unless short-circuiting occurs. Limitations
The primary limitations on this technique are the following:
Excavation feasibility and costs.
Vadose zone permeability.
Physical characteristics of the vadose zone.
Land availability.
Proximity to potential contaminant sites.
The depth to water, soil characteristics, and potential for short-circuiting by fractures must be evaluated for each site. The water table must

130
remain below the base of the pond for vadose zone biodegradation and high infiltration rates to occur. Enhanced Stormwater Management Opportunities Infiltration trenches or wells provide the opportunity to have overlying habitat and/or recreational opportunities, since most if not all of the facilities are below ground. Construction Costs For cost estimating purposes, it can be assumed that land is already available for infiltration trenches, but the construction costs need to include excavation, fill material, and distribution system facilities. Annual costs associated with the operation and maintenance of infiltration trenches or wells include program management and maintenance, periodic disinfection, and water level and water quality monitoring and maintenance. Avoided Costs Reduction in the size and cost of the off-site stormwater conveyance system might be avoided. Hawaii and Other Installations A infiltration trench is located at the Honoluliuli Wastewater Treatment Plant in the Ewa Plain, but it has never been operated. Such facilities are installed and operating at numerous locations in the western U.S., especially California and Arizona, including the examples listed below under references. Other Information Test monitoring of the water quantity and quality entering and exiting the trench; water levels and water quality in adjacent monitoring wells; and other environmental impacts (such as high water table in adjacent basements) is necessary prior to full scale implementation. If a potable aquifer is being recharged, supply wells or guard monitoring wells should also be monitored.

131

132
References Additional information about infiltration trenches can be found in the following references:
Rice Creek Watershed District, Blaine Minnessota, on-line at http://www.ricecreek.org/bmp/
United States Geological Survey, Kansas Water Science Center, on-line at http://ks.water.usgs.gov/Kansas/studies/equus/.
City of Fresno California Groundwater Recharge Program known as “Leaky Acres has operated since 1970: www.fresno.gov/Government/DepartmentDirectory/PublicUtilities/Watermanagement/GroundwaterRecharg.htm.
U.S. Environmental Protection Agency, Risk Management Research, on-line at http://www.epa.gov/NRMRL/pubs/625r04108/625r04108.htm (section 2.5).
Bouwer, H (1996). Issues in Artificial Recharge. Water Science and Technology, 33(10–11):381–390.
Underground Injection Wells For Stormwater, Best Management Practices Manual Oregon Association of Clean Water Agencies, (2003), on-line at http://www.oracwa.org/.
Ohio EPA, Division of Groundwater and Drinking Water, on-line at: http://www.epa.state.oh.us/ddagw/oacgw.html.
O&M Requirements Sediment removal and reconstruction of infiltration trenches might be required over time, depending on the quality of the water entering the trench.

133
Surface Spreading Surface spreading involves applying water to a relatively undisturbed field and allowing it to infiltrate. Depending on water availability, the field could be flooded quickly to a standing depth of about 1 foot, or water could be delivered continuously at a rate that nearly matches the infiltration rate. The field may be surrounded by a small (two- to three-foot tall) berm and may also include several interior berms to regulate the water levels and flow across the field. Interior berms would be needed on gradually sloped sites. Suitability This technique is most suitable in the following circumstances:
Relatively flat to gentle terrains (i.e., less than 3% slopes), which can be identified on U.S. Geological Survey (USGS) topographic maps.
Hard rocky terrains where excavation would be expensive.
Areas with moderate (0.63 to 2.0 inch/hour) to rapid (6.3 to 20.0 inch/hour) soil permeability (HSG A and B), which includes most basaltic terrains and much of the Ewa Plain Caprock.
Rural or open areas with land availability (it requires the most area/volume of infiltration).
Suitable geology that includes an absence of impermeable layers between the surface and the water table aquifer.
Absence of surficial contamination, critical habitats or historic cultural sites.
Either potable or non-potable aquifer.

134
If above a potable aquifer, there should be an absence of expanding-contracting clays or fractures in the vadose zone that could allow short-circuiting of the soil horizon, and a presence of sufficient clay, organic-rich sediments, and/or available carbon for adsorption and biodegradation processes (or pretreatment).
The ridge and furrow variation features narrow ridges that maintain recharge rates even when the intervening flat bottom ditches plug over time, and is more suitable on sloping land.
An illustration of a surface spreading concept is shown below.
Design Considerations Surface spreading is most appropriate in locations where agriculture has been practiced or other vacant land is available, and where vertical impediments to infiltration such as low permeability soils are not present. If shallow low permeability soils exist at depths less than five feet below ground surface, the field can be ripped to increase infiltration characteristics. Depending on the topography and other land use, intermediate berms may be beneficial to pond water across individual cells. Effectiveness

135
The recharge effectiveness will be limited by the lowest vertical permeability layer in the vadose zone. A long-term average infiltration rate of 50% of the USDA estimated soil permeability of 0.63 to 2.00 inches per hour may be assumed. This estimate assumes that some clogging occurs, but that periodic O&M such as cleaning is performed. Pollutant Removal Efficiency This technique has the maximum removal of contaminants through filtration and biodegradation in the vadose zone, and thus requires minimal treatment. Turbidity is generally removed in the vadose zone. However, the depth to water, soil characteristics, and potential for short circuiting by fractures must be considered for each site. Limitations
The primary limitations on this technique are the following:
Topography.
Soil permeability.
Physical characteristics of the vadose zone.
Land availability.
Proximity to potential contaminant sites. If groundwater recharge is the primary goal, this method has the highest evaporative losses. Enhanced Stormwater Management Opportunities In addition to groundwater recharge, flooded fields could provide seasonal habitat and/or recreational opportunities. In the non-flood season months, the land may be able to support crop production. Construction Costs Costs associated with construction of flooded fields may include land acquisition; shallow ripping; disking and grading; a small pump station; and monitoring well installation and monitoring. Avoided Costs

136
Surface spreading of stormwater may defray some irrigation costs.

137
Hawaii and Other Installations There are no known installations in Hawaii, although some stormwater detention basins provide infiltration to some degree. Such facilities are installed and operating at numerous locations in the western U.S., especially California and Arizona, including the examples listed below under references. Other Information Test monitoring of the water quantity and quality entering and exiting the field; water levels and water quality in adjacent monitoring wells; and other environmental impacts (such as high water table in adjacent basements, mosquitoes, etc.) is necessary prior to full scale implementation. If a potable aquifer is being recharged, supply wells or guard monitoring wells should also be monitored. The Honolulu Board of Water Supply’s Assessment of Recycled Water Irrigation in Central Oahu (BC, 2004) provides data on soil aquifer treatment (SAT) capacities of Hawaiian saprolite soils and volcanic terrains. References
The following references provide additional information about surface spreading:
Bouwer, Herman, (1996). Issues in artificial recharge. Water Science and Technology, 33(10–11):381–390.
Brown and Caldwell, Assessment of Recycled Water Irrigation in Central Oahu, Final Report, for Honolulu Board of Water Supply, 2004.
Central Arizona Project, Recharge Program, on-line at http://www.cap-az.com/static/index.cfm?action=group&contentID=77.
Stockton East Water District, Farmington Groundwater Recharge Program, on-line at http://www.farmingtonprogram.org/.
United States Geological Survey, Kansas Water Science Center, on-line at http://ks.water.usgs.gov/Kansas/studies/equus/.
U.S. Environmental Protection Agency, Risk Management Research, on-line at

138
http://www.epa.gov/NRMRL/pubs/625r04108/625r04108.htm (section 2.5).
World Health Organization, Water Sanitation and Health, Groundwater Recharge: Criteria for Health Related Guidelines, on-line at www.who.int/water_sanitation_health/wastewater/wsh0308chap2.pdf.
O&M Requirements Annual costs associated with the operation and maintenance of flooded fields may include mosquito abatement services, program management and maintenance, intermittent ripping or other cleaning, and water level and water quality monitoring and maintenance. Sediment might need to be removed annually from certain types of spreading basins.

139
This page is intentionally left blank.

140
Injection Wells Direct injection involves pumping stormwater directly into the groundwater aquifer, which is usually a confined aquifer. Direct injection is used where groundwater is deep or where hydrogeological or other conditions are not conducive to surface spreading. Such conditions might include unsuitable soils of low permeability, unfavorable topography for construction of basins, the desire to recharge confined aquifers, or scarcity of land. Direct injection into a saline aquifer can create a freshwater “plume” from which water can be extracted for reuse, particularly in aquifer storage and recovery (ASR) systems (Pyne, 2005). Direct injection is also an effective method for creating barriers against saltwater intrusion in coastal areas. The Hawaii Department of Health identifies Class V wells as those used to inject non-hazardous fluids underground. Most Class V wells are shallow disposal systems that depend on gravity to drain fluids directly in the ground. There are over 20 well subtypes that fall into the Class V category and these wells are used by individuals and businesses to inject a variety of non-hazardous fluids underground. The Class V well category includes complex injection wells that are typically deeper and often used at commercial or industrial facilities (DOH 11-23-23A). Suitability This technique is most suitable in the following circumstances:
Steep terrains and/or areas with slow or vadose zone permeability, which includes parts of the Ewa Plain Caprock.
Urban areas with limited land availability. Injection wells require the least area/volume of infiltration.
Unsuitable geology for surface infiltration due to impermeable confining layers above the targeted aquifer.

141
Presence of surficial contamination, critical habitats or historic cultural sites (since the surface disturbance is minimal).
Preferable for non-potable aquifer, since no soil or vadose zone treatment occurs.
An illustration of an injection well is shown below.
Design Considerations It is important that injection occur below the water table to prevent cascading water and resulting bacterial growth and/or air plugging. Although existing extraction wells can be retrofitted for injection, injection well capacities often decline over time due to plugging, so wells specifically designed for injection are preferable. If used for both injection and extraction, the wells are typically referred to as aquifer storage and recovery (ASR) wells (Pyne, 2005). Many criteria specific to the quality of the stormwater, groundwater, and aquifer material have to be taken into consideration prior to construction and operation. These include possible chemical reactions between the stormwater and groundwater, iron precipitation, ionic reactions,

142
biochemical changes, temperature differences, and viscosity changes. Most clogging problems are avoided by proper pretreatment, well construction, and proper operation. Injection well design and operations should consider the need to occasionally reverse the flow or back-flush the well much like a conventional filter or membrane. In California and Arizona, injection wells are being constructed or retrofitted with dedicated pumping or back-flushing equipment to maintain injection capacity and reduce the frequency of major well redevelopment events (USEPA, 2004). Effectiveness In theory, an injection well can recharge as much as the pumping capacity allows. However, problems associated with water quality, high water temperature, biologic activity, and turbidity often reduce the recharge rate over relatively short periods of time (Driscoll, 1986). Injection wells are not suited for use with stormwater or other sources with high suspended solids without pretreatment because fine particles in the water can quickly plug the aquifer in the near vicinity of the well. Generally, water supplies for injection wells are either treated or obtained from high quality sources to assure that water quality requirements can be reliably and consistently met. Injection rates tend to decrease over time, and a long-term average of 50% of typical extraction rates may be anticipated for planning purposes. If only gravity injection is allowed, the rate can be expected to be even lower. Pollutant Removal Efficiency For both surface spreading and direct injection, locating extraction wells as far as possible from the recharge site increases the flow path length and residence time in the underground, as well as the mixing of the recharged water with the natural groundwater. Treatment of organic parameters does occur in the groundwater system with time, especially in aerobic or anoxic conditions (USEPA, 2004). Limitations
The primary limitations on this technique are the following:
Physical characteristics of the aquifer.
Geochemical mixing issues.

143
Water quality regulatory issues for potable aquifers.
Costs associated with cleaning or replacement of plugged wells.
Disposal of back-flush water to waste.
Direct injection requires higher quality water than for surface spreading because of the absence of vadose zone and/or shallow soil matrix treatment afforded by surface spreading. Water quality is also important to maintain the hydraulic capacity of the injection wells, which are prone to physical, biological, and chemical clogging. At a minimum, removal of solids and disinfection is required to prevent clogging. If injection is into a potable water aquifer, treatment to meet drinking water standards might be required. Enhanced Stormwater Management Opportunities Injection wells do not provide many opportunities for other benefits, but they require relatively little land area and are compatible with most other land uses. Construction Costs Costs for injection wells include drilling, installation of screens and casing, and associated piping for stormwater conveyance to the well. Costs associated with construction of injection wells would generally not include land acquisition since wells are generally compatible with existing land uses, but must include monitoring well installation and monitoring. Avoided Costs Avoided costs associated with injection wells might include improvement to non-potable water quality (e.g., Ewa caprock) for use to augment recycled water or potable water use for irrigation. Hawaii and Other Installations Numerous injection wells are present on the major islands below the state’s Underground Injection Control (UIC) line for the disposal of wastewater, brines, and cooling water. The USGS has recently studied the impacts of one wastewater injection well system near Kihei on Maui (Hunt, 2007).

144
Such facilities are installed and operating at numerous locations in the western United States, especially California and Arizona, including the examples listed below under references. Injection wells have been operated for decades in Southern California by the Los Angeles County Flood District as a barrier to prevent salinity intrusion since the 1950s (Todd and Mays, 2005). Case studies are included in Pyne (2005). Other Information Test monitoring of the water quantity and quality entering the well; water levels and water quality in adjacent monitoring wells; and other environmental impacts (such as high water table in adjacent basements if an unconfined aquifer is being recharged) is necessary prior to full scale implementation. In particular, careful monitoring of injection rates over time is required to prevent irreparable well plugging. If a potable aquifer is being recharged, supply wells or guard monitoring wells should also be monitored. References More information about injection wells can be obtained from the following references:
Bouwer, Herman, (1996). Issues in artificial recharge. Water Science and Technology, 33(10–11):381–390.
Bouwer, Herman, Groundwater Hydrology, McGraw-Hill series in water resources and environmental engineering, 1978.
Brown and Caldwell, Assessment of Recycled Water Irrigation in Central Oahu, Final Report, for Honolulu Board of Water Supply, 2004.
Central Arizona Project, Recharge Program, on-line at http://www.cap-az.com/static/index.cfm?action=group&contentID=77.
Driscoll, F., Groundwater and Wells, Johnson Filtration Systems, Inc., 1986.
Hunt, Charles D., Jr., Ground-Water Nutrient Flux to Coastal Waters and Numerical Simulation of Wastewater Injection at Kihei, Maui, Hawaii, Scientific Investigations Report 2006–5283, 2007.
Orange County Sanitation District, Orange County Groundwater Replenishment System, on-line at www.gwrsystem.com/.

145
Pyne, R. David G., 2005. Aquifer Storage Recovery: A Guide to Groundwater Recharge Through Wells (2nd Ed.).
Todd, K. David, Mays, W. Larry., Groundwater Hydrology, Third Edition. John Wiley & Sons, Inc., 2005.
Underground Injection Wells For Stormwater, Best Management Practices Manual, Oregon Association of Clean Water Agencies, 2003: http://www.oracwa.org/.
U.S. Environmental Protection Agency, Guidelines for Water Reuse, EPA/625/R-04/108, with U.S. Agency for International Development, 2004.
U.S. Environmental Protection Agency, Risk Management Research, on-line at http://www.epa.gov/NRMRL/pubs/625r04108/625r04108.htm (section 2.5). United States Geological Survey, Kansas Water Science Center, on-line at http://ks.water.usgs.gov/Kansas/studies/equus/
World Health Organization, Water Sanitation and Health, Groundwater Recharge: Criteria for Health Related Guidelines, on-line at www.who.int/water_sanitation_health/wastewater/wsh0308chap2.pdf.
O&M Requirements Annual costs associated with the operation and maintenance of injection wells may include program management and maintenance, well disinfection, back-flushing or other cleaning, and water level and water quality monitoring and maintenance.