a guided tour of the european etf marketplace · pdf filea guided tour of the european etf...
TRANSCRIPT

A Guided Tour of the European ETF Marketplace
Morningstar Manager ResearchNovember 2014
Authors: Hortense Bioy, CFA Director of European Passive Strategies ResearchJose Garcia-Zarate Senior Fund Analyst, European Passive Strategies ResearchCaroline Gutman Fund Analyst, European Passive Strategies ResearchKenneth Lamont, CAIA Fund Analyst, European Passive Strategies ResearchGordon Rose, CIIA, CAIA Fund Analyst, European Passive Strategies Research

Page 2 of 60©2014 Morningstar. All rights reserved. This document includes proprietary material of Morningstar. Reproduction, transcription or other use, by any means, in whole or in part, without the prior written consent of Morningstar is prohibited. The Morningstar Investment Management group of Morningstar, Inc. includes Morningstar Associates, Ibbotson Associates, and Morningstar Investment Services, which are registered investment advisors and wholly owned subsidiaries of Morningstar, Inc. The Morningstar name and logo are registered marks of Morningstar.
Executive Summary
In this report, we analyse the evolution of the European exchange-traded product (ETP) market, scrutinising asset flows, discussing the competitive dynamics and commenting on the latest trends. We provide a comprehensive educational guide to the replication methods and portfolio manage-ment techniques used by European providers of UCITS exchange-traded funds (ETFs). We share the due diligence work we have conducted on Europe’s 10 largest UCITS ETF providers1, namely iShares, db X-trackers, Lyxor, UBS, Source, Amundi, Vanguard, State Street, Deka, and ComStage. In detailed profiles, we examine the most important aspects of their portfolio manage-ment techniques, ranging from the replication methods they employ and the way they optimise returns to the policies they have in place to manage risk.
Landscape HighlightsAssets under management in European ETPs have more than doubled over the last five years to reach €362 billion at the end of September 2014. ETPs represent only 5.5% of the total investment fund assets in Europe. This compares with 12% in the more mature US market.The European ETP market remains highly concentrated, with the top three providers managing more than two thirds of the assets. iShares retains a solid market lead. By contrast, its two closest challengers—db X-trackers and Lyxor—have lost ground, to the benefit of smaller players like UBS and Source.The need for innovation and product differentiation has increased. Recent examples of innovative offerings include currency-hedged and strategic beta ETPs. Strategic beta, also known as ‘smart beta’, has become the new key battleground for providers. ETPs have yet to become mainstream. The move away from retrocession- to fee-based advisery models is key to facilitate distribution. But changes in investing culture are also needed. The usage of ETPs in Europe is evolving, with a growing number of investors favouring a more strategic deployment, specifically as core portfolio building blocks. ETP providers have responded to this shift by cutting fees and launching low-cost ‘core’ ETF ranges.
ETF Portfolio Management InsightsIrrespective of replication methodology, we find ETF portfolio management to be a highly automated process. All providers rely on sophisticated IT solutions for the day-to-day portfolio building and risk-management tasks. Behind these automated processes, there is still room for skilled human intervention. Some tasks (e.g. tracking monitoring) are common to all, while others are determined by the replication methods
2 Executive Summary
4 Foreword
5 The European ETP Landscape and Recent Trends
16 A Guide to Replication Methods and Portfolio Management Techniques
25 Provider Profiles25 Amundi ETF 28 ComStage 30 db X-trackers 34 Deka ETFs 37 iShares 39 Lyxor 43 Source 45 SPDR ETFs 47 UBS ETFs 50 Vanguard 52 Appendix: Securities Lending Activity per Provider
3
3
3
3
3
3
3
3
3
3
3
1 Excluding providers who specialise in the provision of non-UCITS exchange-traded commodities (ETCs).

Page 3 of 60©2014 Morningstar. All rights reserved. This document includes proprietary material of Morningstar. Reproduction, transcription or other use, by any means, in whole or in part, without the prior written consent of Morningstar is prohibited. The Morningstar Investment Management group of Morningstar, Inc. includes Morningstar Associates, Ibbotson Associates, and Morningstar Investment Services, which are registered investment advisors and wholly owned subsidiaries of Morningstar, Inc. The Morningstar name and logo are registered marks of Morningstar.
3
3
3
employed. Managers of physical ETFs have a strong focus on minimising costs (e.g. in the trading of securities) while seeking ways to enhance returns. Meanwhile, those managing synthetic ETFs are more focused on the monitoring of swap counterparty activity.ETF portfolio management is a team endeavour. Economies of scale borne out of the automation of processes mean that a small team (often working on a rotating basis) are responsible for the management of a large number of funds. Providers continue to respond to clients’ concerns over counterparty risk by adapting their practices. Examples include switching replication method from synthetic to physical and capping or in some cases stopping securities lending activity altogether.Securities lending programmes have improved, with a few providers returning a bigger portion of lending revenues to investors. Despite these advancements, it remains difficult to assess the fairness of the various revenue sharing arrangements in place.
3
3
3

Page 4 of 60©2014 Morningstar. All rights reserved. This document includes proprietary material of Morningstar. Reproduction, transcription or other use, by any means, in whole or in part, without the prior written consent of Morningstar is prohibited. The Morningstar Investment Management group of Morningstar, Inc. includes Morningstar Associates, Ibbotson Associates, and Morningstar Investment Services, which are registered investment advisors and wholly owned subsidiaries of Morningstar, Inc. The Morningstar name and logo are registered marks of Morningstar.
Foreword
In light of the success of our previous industry studies, Synthetic ETFs Under the Microscope (2012) and Securities Lending in Physical Replication ETFs (2012), we have produced a comprehensive guide on the management practices of Europe’s largest ETF providers.
A lot has changed in the European ETP marketplace over the past couple of years. For starters, assets under management have grown by more than a third, reaching €362 billion at the end of September 2014. Meanwhile, ETP usage has evolved, new types of investors have adopted the vehicle, products have proliferated and competition has intensified. ETP providers have responded to these changes in various ways—for instance by cutting fees, launching core ETF ranges, switching replication methods, or simply by engaging more with investors and stepping up education.
This research report is split into three parts. In the first part, we examine the European ETP land-scape, analysing asset flows and discussing the latest trends. In the second part, we provide an educational guide on the replication methods and portfolio management techniques used by ETF managers.
Finally, in the third part, we provide comprehensive profiles for each of Europe’s 10 largest ETF providers, detailing the most important aspects of their portfolio management practices.
While primarily focusing on the processes, we also set out to shed light on the activities carried out by the people behind them. To that effect, we asked each provider to complete a due diligence questionnaire and subsequently conducted face-to-face interviews with the key stakeholders (e.g. portfolio managers, traders, product developers). These personal accounts have allowed us to find singularities behind what, at first sight, may look like similar practices. We hope these findings will help investors in their ETF provider selection process.
The passive strategies research team at Morningstar is committed to helping ETF investors make better informed decisions. We are strong believers in the virtues of the ETFs, not only because of the flexibility and tremendous breadth of choice they offer, but also because of their contribution to investor empowerment.
We hope you find the information gathered in this report and our commentaries useful.

Page 5 of 60©2014 Morningstar. All rights reserved. This document includes proprietary material of Morningstar. Reproduction, transcription or other use, by any means, in whole or in part, without the prior written consent of Morningstar is prohibited. The Morningstar Investment Management group of Morningstar, Inc. includes Morningstar Associates, Ibbotson Associates, and Morningstar Investment Services, which are registered investment advisors and wholly owned subsidiaries of Morningstar, Inc. The Morningstar name and logo are registered marks of Morningstar.
3
3
3
The European ETP Landscape and Recent Trends
The European ETP market has solidly established itself over the past decade. From humble begin-nings, with assets under management (AUM) at barely €10 billion in 2004, its size had increased to €362 billion by the end of September 2014, to represent 20% of a global ETP market which continues to be dominated by the US.
Exhibit 1: Europe ETP Market Growth
Positive growth expectations for the ETP market in Europe in the coming years are underpinned by the noted shift towards passive investing across the globe. Indeed, the basic dual message that a) active fund managers are highly unlikely to consistently meet their targets and b) high management fees dramatically erode long-term returns, is increasingly gaining recognition amongst the wider investor community. This should facilitate the take-up of low-cost passive investment propositions such as ETPs. However, the need for enduring educational efforts remains paramount. For all the successes attained over the past decade, ETPs only represented 5.5% of the total investment fund AUM in Europe as of September 30, 2014.
48
36
24
60
12
400
320
240
160
80
AUM Net Flows
2004 2005 2006 2007 2008 2009 2010 2011 2012 2013 2014Jan–Sep
AUM (€ billion) Net Flows (€ billion)
Source: Morningstar Direct, Morningstar Research. Data as of September 30, 2014.

Page 6 of 60©2014 Morningstar. All rights reserved. This document includes proprietary material of Morningstar. Reproduction, transcription or other use, by any means, in whole or in part, without the prior written consent of Morningstar is prohibited. The Morningstar Investment Management group of Morningstar, Inc. includes Morningstar Associates, Ibbotson Associates, and Morningstar Investment Services, which are registered investment advisors and wholly owned subsidiaries of Morningstar, Inc. The Morningstar name and logo are registered marks of Morningstar.
3
3
3
Strong Rebound in Net InflowsThe positive growth expectations are also predicated on the significant increase in net new money into the ETP market in Europe so far this year. In the first nine months of 2014, net inflows amounted to €33 billion; handsomely surpassing the full-year totals in each of the previous three years and more fitting with the trend witnessed between 2008 and 2010, when net inflows averaged €40 billion per year.
The strong rebound of net inflows in 2014 has helped dispel concerns that the European ETP market could have plateaued. This reversal has muted some critics of passive investing, who argued that investor interest in passive funds would naturally deflate once the global recovery gathered pace. The evidence—not just from Europe, but also from the US—points to ongoing growth of passive investing, regardless of the phase of the economic cycle.
Distribution by Asset ClassThe European ETP market began as an equity market only affair. Over the years, we have seen growth in the offering of other asset classes, most notably fixed income. However, as of September 30, 2014, equity ETPs still account for 68% of Europe’s total ETP market AUM. The dominance of equity market exposure is not surprising. The early development of the ETP market in Europe coincided with the latter stage of the equity market bull run before the global crisis hit. But more importantly, equity market indices had a key comparative advantage vis-a-vis others, namely that of being truly investable propositions. This made them ready to use by ETPs. By contrast, most fixed income indices were created as research tools, with little consideration for the realities of actual investing in an over-the-counter (OTC) market with special liquidity conditions. Investors’ shift towards fixed income after 2008 spurred efforts to improve the investable nature of fixed income benchmarks. In turn, this favoured the growth of the fixed income ETP segment. AUM in fixed income ETPs account for close to 21% of the total ETP market. ETP providers see fixed income as a key growth area in the coming decade. ETPs have given the wider investor community access to areas previously out of bounds for non-fixed income practitioners. The fortunes of commodity ETPs (i.e. ETFs and ETCs) have been determined by the ups and downs of investors’ attitude to gold as a safe-haven. AUM in commodity ETPs now account for 8.5% of the total ETP market, down from a peak of 19% in 2011-2012. The money market ETP segment has met a similar fate to commodities though driven instead by the dampening effects of ultra-loose monetary policy on interest rates. AUM now represent a mere 0.6% of the total ETP market, down from a peak of 9.6% in 2008.

Page 7 of 60©2014 Morningstar. All rights reserved. This document includes proprietary material of Morningstar. Reproduction, transcription or other use, by any means, in whole or in part, without the prior written consent of Morningstar is prohibited. The Morningstar Investment Management group of Morningstar, Inc. includes Morningstar Associates, Ibbotson Associates, and Morningstar Investment Services, which are registered investment advisors and wholly owned subsidiaries of Morningstar, Inc. The Morningstar name and logo are registered marks of Morningstar.
3
3
3
The remainder of the European ETP market is made up of a collection of products which Morningstar classes as ’alternative’. This includes short and leveraged products and currency strategy vehicles, amongst others. AUM in this segment was 1.9% of the total ETP market, down from a peak of 3.9% in 2008.
Exhibit 2: Europe ETP Market Share by Broad Asset Class
Exhibit 3: Europe ETP Market Flows by Broad Asset Class
90
50
40
30
20
100%
10
0102030405060708090
100
80
70
60
Commodity Equity Fixed Income Money MarketAlternative
Source: Morningstar Direct, Morningstar Research. Data as of September 30, 2014.2004 2005 2006 2007 2008 2009 2010 2011 2012 2013 2014
20
10
0
30
-10
40
50
60
-20-10
10203040
60
Source: Morningstar Direct, Morningstar Research. Data as of September 30, 2014.2004 2005 2006 2007 2008 2009 2010 2011 2012 2013 2014
Jan–Sep
Commodity Equity Fixed Income Money MarketAlternative € billion

Page 8 of 60©2014 Morningstar. All rights reserved. This document includes proprietary material of Morningstar. Reproduction, transcription or other use, by any means, in whole or in part, without the prior written consent of Morningstar is prohibited. The Morningstar Investment Management group of Morningstar, Inc. includes Morningstar Associates, Ibbotson Associates, and Morningstar Investment Services, which are registered investment advisors and wholly owned subsidiaries of Morningstar, Inc. The Morningstar name and logo are registered marks of Morningstar.
3
3
3
The Providers’ Story: Consolidation, Partnerships and New Entrants
Exhibit 4: Europe ETP Providers League Table
The European ETP market remains highly concentrated, with the top three providers managing more than two thirds of the assets. Of these, however, two, namely db X-trackers and Lyxor, have lost market share over the years, to the benefit of smaller players like UBS and Source. By contrast, iShares has strengthened its market leading position, largely thanks to its acquisition of Credit Suisse’s ETF business in 2013.
AUM (€ billion) Market Share (%)
iShares 166.4 46.0
db X-trackers 42.6 11.8
Lyxor 38.0 10.5
UBS ETFs 16.8 4.6
Source 15.1 4.2
Amundi ETF 14.3 3.9
ETF Securities* 11.5 3.2
Vanguard 8.8 2.4
SPDR ETFs 8.2 2.3
Deka ETFs 6.5 1.8
ZKB* 6.2 1.7
Comstage 5.7 1.6
HSBC ETFs 4.7 1.3
EasyETF 3.3 0.9
XACT 2.5 0.7
Swiss and Global 2.1 0.6
DB ETCs 2.1 0.6
Ossiam 1.4 0.4
Powershares 1.4 0.4
RBS 0.8 0.2
Think ETFs 0.7 0.2
Others 3.1 0.9
Total 362.1 100.0
*ETF Securities and ZKB specialise in provision of ETCsSource: Morningstar Direct, Morningstar Research. Data as of September 30, 2014

Page 9 of 60©2014 Morningstar. All rights reserved. This document includes proprietary material of Morningstar. Reproduction, transcription or other use, by any means, in whole or in part, without the prior written consent of Morningstar is prohibited. The Morningstar Investment Management group of Morningstar, Inc. includes Morningstar Associates, Ibbotson Associates, and Morningstar Investment Services, which are registered investment advisors and wholly owned subsidiaries of Morningstar, Inc. The Morningstar name and logo are registered marks of Morningstar.
3
3
3
Exhibit 5: Market Share Evolution by ETP Provider
The geographically fragmented nature of the European market has strongly conditioned the develop-ment of the ETP industry. Some ETP providers have successfully navigated the varying national regulatory and financial market environments to establish themselves as truly pan-European forces. Others have failed to expand much beyond the confines of single national markets, but have felt compelled to launch and list ETPs in multiple exchanges for the sake of visibility. The end result has been a marked proliferation in the number of products available to the public, many with very little traction amongst investors. In fact, the European ETP offering is larger than that of the US despite being one fifth of the size in AUM.
This situation has consistently spurred predictions of consolidation amongst providers in order to streamline the market. However, for all these predictions, there has been very little movement on the consolidation front. Indeed, the only instance of corporate consolidation in the past five years was the purchase of Credit Suisse’s ETF business by iShares in 2013, which allowed Europe’s leading ETP provider to gain a firm foothold in the Swiss domestic market.
Rather than pursuing European intra-market mergers or takeovers, some European ETP providers have sought strategic partnerships with external players to support and grow their business. These partnerships have come in the form of direct investment and ad-hoc collaboration in product development. Source is perhaps the most obvious example. US-based private equity firm Warburg Pincus acquired a majority stake in Source in early 2014. Another example is Boost ETP, a provider of short and leveraged ETPs set up in 2012. In early 2014, the US’ fifth largest ETP provider WisdomTree acquired a majority stake in the business.
20
15
10
25
5
30
50%
45
40
35
51015202530354045
Source: Morningstar Direct, Morningstar Research. Data as of September 30, 2014.
2011 20142008
DekaETFs
Lyxor Source ZKBAmundi ETF
ComStage db X-trackers
iShares SPDRETFs
VanguardUBSETFs
ETFSecurities

Page 10 of 60©2014 Morningstar. All rights reserved. This document includes proprietary material of Morningstar. Reproduction, transcription or other use, by any means, in whole or in part, without the prior written consent of Morningstar is prohibited. The Morningstar Investment Management group of Morningstar, Inc. includes Morningstar Associates, Ibbotson Associates, and Morningstar Investment Services, which are registered investment advisors and wholly owned subsidiaries of Morningstar, Inc. The Morningstar name and logo are registered marks of Morningstar.
3
3
3
Whereas consolidation actions have been scarce, the number of providers entering the European ETP marketplace has increased since 2011. Amongst these, a number of houses with established operations in the US ETP market are now aiming to secure a slice of the growing European ETP pie. Vanguard has been the most visible and successful, quickly building a firm base in the UK, with plans to expand to other national markets. Other US houses with operations in Europe now include First Trust and WisdomTree (via Boost ETP). Other major US ETP players, such as Guggenheim, ProShares, Charles Schwab and Fidelity have all started to look at when and how to enter the European market.
New entrants have not been confined to US players. Aside from the aforementioned Boost ETP, a number of new small European new providers have also entered the ETP race. FinEx, Nordea and Icelandic-based Landsbref all arrived in 2013. ABN Amro set up a small ETF operation in 2014, but wound it up after only four months in business. Meanwhile, UK-based Legal & General has expressed an interest in launching its own ETF range.
Product Proliferation and Innovation
Exhibit 6: European ETP Market: Launches vs. Closures
The strong growth of the European ETP market over the last decade has come hand-in-hand with product proliferation and innovation. The number of new products grew steadily from 2004 to 2010 as ETP providers looked to plant their flags in the sand, with the aim of building a complete range of products that would cover every corner of the market. Over that period, a flurry of ‘me-too’ ETPs came to market.
200
150
100
250
50
300
350
0
50
100
150
200
250
300
350
Source: Morningstar Direct, Morningstar Research. Data as of September 30, 2014.2004 2005 2006 2007 2008 2009 2010 2011 2012 2013 2014
Jan–Sep
ClosuresLaunches Number of Products

Page 11 of 60©2014 Morningstar. All rights reserved. This document includes proprietary material of Morningstar. Reproduction, transcription or other use, by any means, in whole or in part, without the prior written consent of Morningstar is prohibited. The Morningstar Investment Management group of Morningstar, Inc. includes Morningstar Associates, Ibbotson Associates, and Morningstar Investment Services, which are registered investment advisors and wholly owned subsidiaries of Morningstar, Inc. The Morningstar name and logo are registered marks of Morningstar.
3
3
3
Launch activity has since slowed down as the space has become more crowded, with fewer holes to fill. At the same time, the need for product differentiation has increased. Recent examples of innovative offerings include triple leveraged and short, currency-hedged and strategic-beta ETPs.
Strategic beta, also known as ‘smart beta’, has become the new key battleground for the majority of leading ETP providers. While the concept behind strategic beta ETPs is not new, it is being heavily marketed as a new avenue to explore for investors looking for alternative ways to diversify their portfolios. Concerns, however, are mounting over the proliferation of these products and their increasing complexity. For more detail, see A Global Guide to Strategic-Beta Exchange-Traded Products (2014).
Meanwhile, the number of ETP liquidations has increased in recent years as cost-conscious providers feel compelled to rationalise their product line-ups and business strategy in the face of intensifying competition. This is an additional sign that the European ETP market is slowly maturing.
The Physical-Synthetic SplitA peculiarity of the European ETP market is the co-existence of two replication methodologies, namely physical and synthetic. This co-existence has been rather fractious at times. In fact, back in 2011–2012, in the wake of a series of critical reports against ETPs by the likes of the IMF, BIS and G20 FSB, the two sides of the European ETP industry engaged in open PR warfare on the issue of counterparty risk. At the time, while rebuffing what we deemed as ill-informed criticism, Morningstar kept a neutral stance, acknowledging that both replication methods have pros and cons. Tensions have since abated. However, the dispute had a significant effect on investors’ attitudes, and in turn, on the way the European ETP industry subsequently developed.
Exhibit 7: Europe ETP AUM by Replication Method
90
50
40
30
20
100%
10
0102030405060708090
100
80
70
60
Source: Morningstar Direct, Morningstar Research. Data as of September 30, 2014.2004 2005 2006 2007 2008 2009 2010 2011 2012 2013 2014
SyntheticPhysical

Page 12 of 60©2014 Morningstar. All rights reserved. This document includes proprietary material of Morningstar. Reproduction, transcription or other use, by any means, in whole or in part, without the prior written consent of Morningstar is prohibited. The Morningstar Investment Management group of Morningstar, Inc. includes Morningstar Associates, Ibbotson Associates, and Morningstar Investment Services, which are registered investment advisors and wholly owned subsidiaries of Morningstar, Inc. The Morningstar name and logo are registered marks of Morningstar.
3
3
3
The analysis of ETP market flows from 2011 onwards shows that the synthetic side of the European ETP industry came out of the dispute badly bruised. The market share gains achieved by synthetic providers before 2011 fully reversed thereafter. The broad 50/50 split in AUM between the two replication methodologies in 2009–2010 has since turned into a 70/30 split.
The trend towards physical replication has had a significant effect on the European ETP market offering. The two leading providers of synthetic ETPs—db X-trackers and Lyxor—took a pragmatic approach by ditching their ‘swap only’ label to embrace a mixed 'swap and physical' line. Both providers have since switched a share of their synthetic ETP offering to physical replication and said they will continue to expand their physical range. In addition, Vanguard—the only new entrant to the European ETP marketplace since 2011 to have had a significant effect in AUM terms—is an advocate of physical replication.
‘Price War’, What Price War?Another noteworthy development in the European ETP marketplace over the past couple of years has been the widespread reduction in fees. Similar to what has been witnessed in the US, a number of European ETP providers, including iShares, db X-trackers, Lyxor, Amundi, UBS, Source, Vanguard and SPDR have slashed total expense ratios (TERs) on ETFs linked to some of the most popular bench-marks (e.g. FTSE 100, S&P 500, MSCI Emerging Markets).
The cuts have been significant, ranging from 0.05 to 0.28 percentage points (pp) on the newly-created suite of ‘Core’ iShares ETFs for instance, while Amundi has slashed expense ratios by 0.25 pp on several Emerging Market and regional ETFs. Investors can now gain exposure to US and UK large cap-equities for a modest 0.05% and 0.09% in annual fees, respectively.
Most providers have explained the cuts as the result of economies of scale while categorically denying the existence of a ‘price war’. However, we believe some felt compelled to lower fees in response to the intensifying competition, especially following the entry of low-cost issuer Vanguard in 2012. While it remains to be seen if this race to the bottom will pay off for the providers, it certainly benefits investors, who will give up less of their returns in the form of fees.
Not everyone, however, may benefit from the fee cuts. Some providers have lowered fees on only one version of specific ETFs, most likely the dividend-accumulating ones, which may not suit long-term investors seeking income.
That said, the analysis of flows for the first nine months of 2014 showed that, when faced with a dual pricing structure, investors—both new and existing—have tended to opt for the cheaper version. This has been particularly notable in the case of iShares which has seen large transfers out of its pricier FTSE 100 and S&P 500 ETFs into its cheaper “core” alternatives. This confirms the notion that, for some investors, price is the most crucial factor in their ETF selection process.
Page 13 of 60©2014 Morningstar. All rights reserved. This document includes proprietary material of Morningstar. Reproduction, transcription or other use, by any means, in whole or in part, without the prior written consent of Morningstar is prohibited. The Morningstar Investment Management group of Morningstar, Inc. includes Morningstar Associates, Ibbotson Associates, and Morningstar Investment Services, which are registered investment advisors and wholly owned subsidiaries of Morningstar, Inc. The Morningstar name and logo are registered marks of Morningstar.
3
3
3
Shift in the Usage of ETPsFrom being a tool almost exclusively used by institutions, ETPs have yet to become mainstream as European investment fund distribution slowly moves away from retrocession-based and towards advisery fee-paying models. Whether driven by regulation, as has been the case in the UK and Netherlands, or led by fund distributors themselves, we would expect more countries in Europe to embrace these changes in years to come.
At this stage, we have only scratched the surface of how retail investors use ETPs, and while changes in distribution should help, the real growth potential in the retail take-up of ETPs will only be truly unlocked with changes in long-held investment habits and culture. In that respect, there are some positive signs. For example, aside from challenging traditional commercial-bank-dominated distribution channels, the increased popularity of online-based platforms encourages individuals to become more actively involved in the investment decision-making process. With widespread cuts to pensions and welfare benefits, investors will need to take an even more active role in saving and investing for retirement. Running in parallel to changes in fund distribution, we are seeing a shift in the end-usage of ETPs. Tactical investing seems to be slowly losing predominance, as a growing number of investors now use ETPs more strategically as portfolio core building blocks. As a response, ETP providers such as iShares and db X-trackers have launched low-cost ranges of ‘core’ ETFs specifically targeted at long term buy-and-hold investors. We have also witnessed changes in the way financial advisers think about ETPs and how to add value with them, particularly in countries like the UK. Multi-asset solutions, for instance, are becoming increasingly popular, with advisers using ETPs as building blocks to package and deliver low-cost diversified long-term investment solutions to their clients.
Regulation Continues to Shape the European ETP LandscapeThe most significant pan-EU regulatory development of recent years has been the European Securities and Markets Authority (ESMA) guidelines on ETFs and other UCITS issues, which came into force in February 2013. The guidelines set out a range of disclosure and documentation require-ments for ETFs, with the ultimate aim of increasing transparency for investors.
The most visible of these measures is the requirement to include the ‘UCITS’ label in the name of all UCITS ETFs. The guidelines also required improved collateral diversification and increased disclosure surrounding replication methodology, swap counterparties, leverage, securities lending, and indices tracked.
On a national level, the UK saw the introduction of the Retail Distribution Review (RDR) in January 2013. RDR dictates increased disclosure of advisery fees to clients and prohibits advisors from

Page 14 of 60©2014 Morningstar. All rights reserved. This document includes proprietary material of Morningstar. Reproduction, transcription or other use, by any means, in whole or in part, without the prior written consent of Morningstar is prohibited. The Morningstar Investment Management group of Morningstar, Inc. includes Morningstar Associates, Ibbotson Associates, and Morningstar Investment Services, which are registered investment advisors and wholly owned subsidiaries of Morningstar, Inc. The Morningstar name and logo are registered marks of Morningstar.
3
3
3
receiving commission payments. Similar legislation has been passed in The Netherlands; Switzerland and Sweden are both currently working on their own equivalents.
The change from commission-based to fee-paying advisory models is seen as key to facilitating the growth of ETPs amongst retail investors. However, predictions that the likes of RDR would have immediately led to large inflows into ETPs proved too optimistic, with many blaming the lack of education amongst the advisor community. So far pursued on a country-by-country basis, this change may become common across the EU if, as expected, it is included as part of the impending second instalment of the Markets in Financial Instruments Derivative (MiFID II), which is due to come into force in 2017.
MiFID II is also expected to address the challenges of trading ETPs in a geographically fragmented market with multiple exchanges but where most transactions are actually carried out OTC. This may include the requirement for a pan-European consolidated tape, requiring all trades, including those currently unreported OTC trades, to be reported and aggregated to provide a complete picture of trading volumes for ETPs.
The ability to properly assess the real liquidity of ETPs is essential to encourage more investors to trade on exchange. In April 2014, industry support for a consolidated tape was codified in an open letter to the Chairman of ESMA signed by a selection of major industry players.
In addition to MiFID II, in January 2014 the European Commission proposed increasing reporting requirements and levels of transparency surrounding securities lending, which is likely to pave the way for further guidance. All the while, the Commission continues to work on proposed changes to both UCITS legislation (i.e. UCITS VI) and the European Market Infrastructure Regulation (EMIR). The ETP industry has expressed concerns about some of these proposals. In particular, those covering asset eligibility may limit the development of new ETPs while others may restrict the use of derivatives.
Evolving Securities Lending PracticesImproved Revenue Sharing ArrangementsIn the face of increased regulatory, client and media scrutiny in recent years, European ETP providers have made important changes to their securities lending programmes. The most recent and noteworthy developments include improved revenue sharing arrangements. In early 2014, SPDR ETFs moved to a 70/30 split from 60/40, meaning that the funds now receive 70% of the gross proceeds from securities lending activity, while State Street keeps 30% as a fee for its lending services. iShares and EasyETF too have sweetened the pot, with iShares now applying a 62.5/37.5 split—a slight improvement from 60/40—and EasyETF now returning 80% to its funds, versus 45% before.

Page 15 of 60©2014 Morningstar. All rights reserved. This document includes proprietary material of Morningstar. Reproduction, transcription or other use, by any means, in whole or in part, without the prior written consent of Morningstar is prohibited. The Morningstar Investment Management group of Morningstar, Inc. includes Morningstar Associates, Ibbotson Associates, and Morningstar Investment Services, which are registered investment advisors and wholly owned subsidiaries of Morningstar, Inc. The Morningstar name and logo are registered marks of Morningstar.
3
3
3
While welcoming these moves, as they mean investors are better remunerated for the risk they assume in relation with the practice, we still find it difficult to assess whether or not the various arrangements in place are fair. ESMA guidelines require that all securities lending revenues, net of direct and indirect operational costs, be returned to the fund, and that these costs be disclosed. While not denying ESMA’s positive intentions, we feel that the requirement, as it was formulated, has not helped investors much. The rule remains subject to interpretation, especially as to how one defines ‘costs’, which, according to our study, can amount to anything between 10% and 40% of gross proceeds.
Two additional changes noted in the last 12 months include HSBC scrapping its securities lending programme for its whole ETP line-up in response to client demand for a simpler approach, and UBS introducing a 50% cap on the amount of securities that its ETFs can lend out. Previously, UBS ETFs were permitted to lend out up to 100% of their assets—in accordance with UCITS rules—although they lent much less in practice. The move aimed to provide investors with greater comfort.
Decline in Securities Lending ActivityWhile the percentage of physical ETFs engaged in securities lending (about 30% of total physical ETFs) has not changed, we have seen a significant decline in the quantity of securities on loan over the past couple of years. Over 80% of physical ETFs engaged in the practice are now lending less than 10% of their assets on average, compared with 58% two years ago. Also, only 4% of the ETFs are currently lending more than 50% on average, versus 18% previously (see appendix for individual fund activity). The decline in securities lending activity can be attributed to a combination of factors, including reduced borrowing demand, tax harmonisation, and self-imposed limits.
Exhibit 8: Average On-Loan Levels
2011–2012 2013–2014
Average on Loan (%) Number of ETFs % of ETFs Number of ETFs % of ETFs
X<10 88 58 143 82
20≤X<30 24 16 10 6
30≤X<50 13 9 15 9
X≥50* 27 18 7 4
Total 152 175
*ComStage ETFs are allowed to lend up to 100% of their assets but the average on-loan level was not disclosed.Source: Morningstar Research.

Page 16 of 60©2014 Morningstar. All rights reserved. This document includes proprietary material of Morningstar. Reproduction, transcription or other use, by any means, in whole or in part, without the prior written consent of Morningstar is prohibited. The Morningstar Investment Management group of Morningstar, Inc. includes Morningstar Associates, Ibbotson Associates, and Morningstar Investment Services, which are registered investment advisors and wholly owned subsidiaries of Morningstar, Inc. The Morningstar name and logo are registered marks of Morningstar.
A Guide to Replication Methods and Portfolio Management Techniques
Like any index fund, ETFs are designed to track the performance of an index. While this concept is easy to understand, putting it into practice is far more difficult than it seems. Indices are theoretical portfolios that don’t reflect what is happening in the ‘real’ world as they ignore the practicalities of portfolio construction and ongoing management.
The key objective of ETF managers is to minimise tracking deviations—as commonly measured by tracking difference and tracking error—by choosing the most appropriate replication method for a fund and putting in place efficient portfolio management techniques.
Two Measures of Tracking Efficiency:
In this section, we examine each aspect of the ETF portfolio management process, starting with the choice of replication method.
The method employed to replicate an index is key to the success of an ETF and the choice of one over another is often made on a case-by-case basis. When deciding which methodology to use, portfolio managers consider several factors such as the size and liquidity of the index, operational efficiency, ownership restrictions, cost, tax, tracking error tolerance, and client demand.
The various replication methods used by European ETF providers can be split into two main group-ings: physical replication and synthetic replication.
Physical Replication Physical replication, also known as direct replication, is the most straightforward way to mimic the performance of an index. Physical ETFs own the constituents of the index they track. This can be done in one of three ways: full replication, sampling or optimisation.
Each approach has benefits and drawbacks depending on the circumstances of a particular ETF.
Tracking Error
Tracking error is the volatility (as measured by the annual-ised standard deviation) of a fund’s return differences over a period of time (return differences referring to the differences in periodic returns between the fund and its benchmark). A low tracking error indicates the fund has consistently tracked its benchmark.
Note: For more detail, see On The Right Track: Measuring Tracking Efficiency in ETFs (2013)
Tracking Difference
Tracking difference is the difference in returns between a fund and its benchmark over a period of time. A small negative tracking difference indicates the fund has done a good job matching its benchmark. A positive tracking difference indicates the fund has outperformed its benchmark.
Page 17 of 60©2014 Morningstar. All rights reserved. This document includes proprietary material of Morningstar. Reproduction, transcription or other use, by any means, in whole or in part, without the prior written consent of Morningstar is prohibited. The Morningstar Investment Management group of Morningstar, Inc. includes Morningstar Associates, Ibbotson Associates, and Morningstar Investment Services, which are registered investment advisors and wholly owned subsidiaries of Morningstar, Inc. The Morningstar name and logo are registered marks of Morningstar.
3
3
3
Full ReplicationWith full replication, portfolio managers build a portfolio of all the index constituents in the same weights as stipulated by the index. This approach works well for highly liquid indices such as the Euro Stoxx 50 or the FTSE 100.
Full replication may not be possible or economically efficient when the index being tracked refer-ences a high number of securities or contains small and relatively illiquid components (e.g. MSCI World with over 1,600 constituents, MSCI Emerging Markets, Barclays Global Aggregate with over 10,000). To replicate these indices, managers may use sampling or optimisation techniques.
SamplingSampling involves investing in a select basket of the largest and most liquid components of the index in an effort to minimise costs. The portfolio manager will segment the index components into sub-groups (e.g. by sector, country, interest rate, credit rating, currency or issuer) and then purchase underlying securities representative of each sub-group.
While sampling has undeniable cost advantages by virtue of excluding smaller, less liquid compo-nents of an index, it creates a potential source of tracking error as the fund strays from perfectly mirroring its benchmark.
Sampling tends to work well during normal market conditions. However, in an adverse market environment, historical statistical attributes (correlations, volatility measures, etc.) are less likely to align with the index and sampling can result in higher-than-expected tracking error.
OptimisationUnlike sampling, optimisation uses a risk model based on the security’s size, valuation characteris-tics, historic momentum or historic volatility, among other pre-defined variables.
Optimisation has the benefit of minimising tracking error and works relatively well in low volatility environment. However, because it considers market access in structuring the selection and weighting of individual securities, it introduces a trade-off between greater investability and the extent to which the index adequately represents its chosen market. Optimisation techniques are not practical in fixed income markets for this reason, as well as because of the over-the-counter nature of bonds.
Active Management TechniquesManaging a physically-replicated ETF is not limited to choosing the most efficient replication method. Portfolio managers use ‘active’ management techniques to try to minimise costs and enhance returns. This includes techniques such as managing cash, trading around index reconstitutions, using derivatives, optimising tax, and engaging in securities lending.

Page 18 of 60©2014 Morningstar. All rights reserved. This document includes proprietary material of Morningstar. Reproduction, transcription or other use, by any means, in whole or in part, without the prior written consent of Morningstar is prohibited. The Morningstar Investment Management group of Morningstar, Inc. includes Morningstar Associates, Ibbotson Associates, and Morningstar Investment Services, which are registered investment advisors and wholly owned subsidiaries of Morningstar, Inc. The Morningstar name and logo are registered marks of Morningstar.
3
3
3
When trying to minimise costs and/or enhance returns, the challenge for ETF managers is not to deviate too much from the index and to keep tracking error as low as possible. These objectives are potentially conflicting.
Index portfolio managers operate within a framework where risk is tightly monitored and controlled. Their day-to-day actions are highly automated and tightly constrained by parameters set and reviewed regularly in partnership with the business, under the control of the risk management department. This leaves very little room for operational error, with the risk of a ‘fat finger’ virtually nil.
Index ChangesIndex changes that occur as a result of index rebalancing and corporate actions are the most frequent source of activity for managers of physical-replication ETFs. They can be handled in a variety of ways.
Index RebalancingMost index providers carry out regular index reviews to ensure their universe remain representative of the underlying market. At these reviews, they make additions and deletions deemed necessary in accordance with the index methodology. These changes are usually announced several days in advance, which portfolio managers may take advantage of to formulate a trading strategy.
When appropriate, managers may begin buying securities prior to the day that they are added to the index, and conversely, securities may also be sold ahead of the deletion date. This is often done to minimise market impact, and may at times capture some value that can offset some other-unavoid-able-costs of portfolio management. With this, a small amount of market risk is introduced which may affect the tracking accuracy of the fund. However, if executed effectively, this may improve the fund’s tracking performance.
Corporate ActionsIn the equity space, there are a number of events such as mergers and acquisitions, bankruptcy, right issues and initial public offerings that can lead to noteworthy changes in the index.
Examples of corporate actions that may strongly affect the value of fixed income securities—and therefore the index they belong to—include the temporary suspension of interest payments, instances of voluntary or forced debt restructuring and, ultimately, default.
All these changes, which are also usually announced in advance, are managed in a similar way as regular index rebalancings.

Page 19 of 60©2014 Morningstar. All rights reserved. This document includes proprietary material of Morningstar. Reproduction, transcription or other use, by any means, in whole or in part, without the prior written consent of Morningstar is prohibited. The Morningstar Investment Management group of Morningstar, Inc. includes Morningstar Associates, Ibbotson Associates, and Morningstar Investment Services, which are registered investment advisors and wholly owned subsidiaries of Morningstar, Inc. The Morningstar name and logo are registered marks of Morningstar.
3
3
3
TradingMinimising transaction costs is a key consideration for passive fund managers. Given the scale of their firm’s investment operation, some managers are able to effect portfolio transactions through internal crossing. These transactions are traded off-market, without any brokerage commissions.
Where internal crossing transactions are not available or permitted, managers attempt to execute transactions in the most cost-effective manner, relying on low-cost, often automated, external trading and trade-crossing systems.
Cash ManagementThere are many instances where managers of physical-replication ETFs will be faced with cash flows which need to be managed efficiently in order to limit cash drag and ultimately minimise tracking error. For instance, when an index changes composition, there may be a time lag between the liquidation of the index’s old constituents and the addition of its new constituents. During this span, the fund will hold cash.
Also, for those ETFs that regularly distribute income to shareholders, there can often be a lag between the time when the ETF receives dividends (or coupon payments) from its underlying holdings and the time that it ultimately distributes this income to its own investors.
In both cases, depending on the underlying index, portfolio managers can re-invest the cash through the use of futures contracts or other derivatives. For markets not covered by futures, managers may use proxy and correlation techniques.
Dividend and Coupon ReinvestmentWhen the ETF is benchmarked to a total return index that re-invests dividends, the portfolio manager must re-invest the dividends according to the index methodology.
Total return equity indices typically add dividends on the ex-dividend date and assume they are re-invested from that point. However, funds often don’t receive the cash until sometime after this date. For example, for Japanese stocks, there can be a difference of 70 days between the ex-divi-dend and payment dates. To minimise tracking risk, managers may equitise accrued dividends from the ex-date using index futures. Once the account reaches a certain size (generally less than 2% of the portfolio value), futures positions are reduced and the cash is reinvested. At all times, the portfolio remains unleveraged and its beta to the benchmark remains equal to one.
For bond ETFs, the cash from coupon payments is left un-invested until the next rebalancing date—typically the end of the month as is customary for most bond indices—at which time the portfolio managers invest across the portfolios. When the ETFs pay out dividends, securities are sold to meet those payments.

Page 20 of 60©2014 Morningstar. All rights reserved. This document includes proprietary material of Morningstar. Reproduction, transcription or other use, by any means, in whole or in part, without the prior written consent of Morningstar is prohibited. The Morningstar Investment Management group of Morningstar, Inc. includes Morningstar Associates, Ibbotson Associates, and Morningstar Investment Services, which are registered investment advisors and wholly owned subsidiaries of Morningstar, Inc. The Morningstar name and logo are registered marks of Morningstar.
3
3
3
Scrip DividendsInstead of traditional cash dividends, some stocks issue optional dividends in which shareholders can choose to receive either cash or discounted stocks. Indices usually assume that investors elect for the cash option. Managers can try to add value by opting for the discounted stock and subsequently sell it at a profit or sell the optionality to a counterpart. These solutions can be implemented at virtually no risk.
Tax OptimisationIndices make assumptions for the amount of withholding tax applied on the dividends paid by index constituents. In practice, managers can recoup either a portion of or all of this tax, depending on the fund’s country of domicile and double tax treaties. This activity, known as tax optimisation or dividend tax enhancement, can boost a fund’s return relative to its benchmark.
Foreign Exchange Exposure ManagementFX exposure is managed in line with the index methodology. Portfolio managers may outsource their FX transactions or execute them in-house via the trading desk. Some managers may use forwards, call options, put options and non-deliverable forwards (NDFs) in order to hedge portfolios against exchange rate fluctuations.
ADRs & GDRsManagers may also use ADRs and GDRs (American and Global Depositary Receipts) to gain exposure to stocks which it would not be efficient or possible to hold directly because of local restrictions, liquidity, taxes or quota limitations. ADRs and GDRs are certificates issued by a custodian bank which purchases stocks of foreign companies and hold them on deposit in the companies’ home country. These instruments are typically used for accessing emerging markets (e.g. Russia and India).
Securities LendingSecurities lending is perhaps the most popular technique to enhance performance. Portfolio managers lend out a fund’s assets to generate income, which in turn can help partially, or in some cases completely, offset management fees and other sources of tracking difference. However, this practice is not free of risk. Specifically, there is always a risk that the borrower of the fund’s securi-ties becomes insolvent and is unable to return them.
To mitigate counterparty risk, borrowers are carefully selected and their creditworthiness is closely monitored. Moreover, borrowers are requested to post collateral in an amount usually in excess of the value of the securities on loan. Should a borrower default, the collateral would be liquidated in compensation to the fund.
As an additional risk mitigating measure, a majority of ETF issuers, usually through their lending agent, provide borrower default indemnification. They offer to indemnify investors for any shortfall

Page 21 of 60©2014 Morningstar. All rights reserved. This document includes proprietary material of Morningstar. Reproduction, transcription or other use, by any means, in whole or in part, without the prior written consent of Morningstar is prohibited. The Morningstar Investment Management group of Morningstar, Inc. includes Morningstar Associates, Ibbotson Associates, and Morningstar Investment Services, which are registered investment advisors and wholly owned subsidiaries of Morningstar, Inc. The Morningstar name and logo are registered marks of Morningstar.
3
3
3
between the proceeds from the liquidation of the collateral and the market value of the unreturned securities.
For a more detailed examination of this practice, see Securities Lending in Physical Replication ETFs: A Review of Providers’ Practices (2012).
Synthetic ReplicationSynthetic replication, also known as indirect replication, offers advantages in terms of tracking error and operational efficiency. While it tends to deliver closer tracking2 than physical replication, it is also often the most efficient way to track indices made up of illiquid or difficult to access securities such as those on emerging markets.
There are two main models currently used by European ETF providers to track an index synthetically: the unfunded-swap model and the funded-swap model.
Unfunded-Swap ModelThe unfunded swap model is the most commonly used synthetic-replication method.
Exhibit 9: Simplified Unfunded-Swap ETF Structure
The ETF enters into a total return swap agreement with a counterparty (often the provider’s parent bank) to receive the performance of the index. Effectively, the portfolio manager uses cash from investors to buy a basket of securities from the swap counterparty which commits to deliver the performance of the index (adjusted for a swap spread) in exchange for the performance of the securities bought by the fund.
2 On the Right Track: Measuring Tracking Efficiency in ETFs
Source: Morningstar Research.

Page 22 of 60©2014 Morningstar. All rights reserved. This document includes proprietary material of Morningstar. Reproduction, transcription or other use, by any means, in whole or in part, without the prior written consent of Morningstar is prohibited. The Morningstar Investment Management group of Morningstar, Inc. includes Morningstar Associates, Ibbotson Associates, and Morningstar Investment Services, which are registered investment advisors and wholly owned subsidiaries of Morningstar, Inc. The Morningstar name and logo are registered marks of Morningstar.
3
3
3
Substitute BasketThe assets bought by the ETF, which are also referred to as ‘substitute basket’, ‘fund holdings’ or ‘asset portfolio’, typically do not include the constituents of the reference index but can have a high degree of correlation with them. For UCITS ETFs, the substitute basket must comply with UCITS regulations on asset type, liquidity and diversification. The securities are held in a segregated account at a custodian where they are monitored and verified daily.
It is important to note that at all times the fund remains the owner of these assets and the portfolio manager enjoys direct access to them. This means that if the swap counterparty defaults, the manager should be able to liquidate the assets swiftly should this option be chosen and in accor-dance with the relevant home domicile law.
Counterparty Risk DefinedSwap transactions expose ETFs to counterparty risk, i.e. the possibility that the party providing the swap will fail to fulfil its obligation to deliver the performance of the index being tracked.
Net counterparty exposure is measured as the difference between the net asset value (‘NAV’) of the ETF and the value of the substitute basket. And in accordance with UCITS regulations, this exposure should not exceed 10% of the fund’s NAV. In other words, the daily NAV of the substitute basket should amount to at least 90% of the fund’s NAV.
How is Counterparty Risk Managed?Counterparty risk in ETFs that employ the unfunded-swap model is actively managed by the fund managers on a daily basis. Swaps are marked-to-market daily and reset whenever the counterparty exposure approaches the 10% UCITS limit (or a lower limit set at the discretion of the firm). In the case of a swap reset, the manager asks the counterparty to pay the swap marked-to-market value by delivering additional securities to top up the substitute basket.
Some managers may engage multiple swap counterparties in an effort to minimise exposure to any one of them.
In practice, swap reset policies vary across providers, but today, the majority employing the unfunded-swap structure apply much stricter reset triggers than the UCITS rule of 10%, which results in more frequent resets and generally lower counterparty risk. Some ETFs may even see their swaps reset to zero on a daily basis as a result of daily creation/redemption activity or a daily target of zero counterparty exposure.
Funded-Swap ModelUnder the funded—also known as fully funded—swap model, the portfolio manager transfers investors’ cash to a swap counterparty in exchange for the index performance (adjusted for a swap

Page 23 of 60©2014 Morningstar. All rights reserved. This document includes proprietary material of Morningstar. Reproduction, transcription or other use, by any means, in whole or in part, without the prior written consent of Morningstar is prohibited. The Morningstar Investment Management group of Morningstar, Inc. includes Morningstar Associates, Ibbotson Associates, and Morningstar Investment Services, which are registered investment advisors and wholly owned subsidiaries of Morningstar, Inc. The Morningstar name and logo are registered marks of Morningstar.
3
3
3
spread) plus the principal at a future date. The counterparty posts collateral assets in a segregated account with a third party custodian.
Exhibit 10: Simplified Funded-Swap ETF Structure
Collateral Composition and AccessThe collateral basket posted by the counterparty complies with UCITS regulations on asset type, liquidity and diversification.
Regulations also require that appropriate haircuts (or margins) be applied to the assets posted as collateral to account for the risk of value fluctuations and the fact that the fund doesn’t hold the assets. The level of haircuts (or margins) applied typically depends on the type of securities delivered and the relevant home domicile law.
As a direct result of these rules, funds relying on the funded-swap approach are normally over-collat-eralised, i.e. the market value of the collateral posted by the swap counterparty exceeds the net asset value (‘NAV’) of the ETF.
The collateral account can be held either in the name of the fund (in the case of a transfer of title) or in the name of the counterparty and pledged in favour of the fund (in the case of a pledge arrangement).
With a transfer of title, the collateral is treated as the property of the fund. This means that if the swap counterparty defaults, the portfolio manager should be able to gain direct access to the assets and sell them. Under a pledge structure, the manager would have to claim ownership of the collateral assets before liquidating them.
Source: Morningstar Research.

Page 24 of 60©2014 Morningstar. All rights reserved. This document includes proprietary material of Morningstar. Reproduction, transcription or other use, by any means, in whole or in part, without the prior written consent of Morningstar is prohibited. The Morningstar Investment Management group of Morningstar, Inc. includes Morningstar Associates, Ibbotson Associates, and Morningstar Investment Services, which are registered investment advisors and wholly owned subsidiaries of Morningstar, Inc. The Morningstar name and logo are registered marks of Morningstar.
3
3
3
As with the unfunded-swap model, providers using funded swaps may engage multiple swap counterparties in an effort to minimise exposure to any one of them.
Counterparty Risk DefinedSwap transactions expose ETFs to counterparty risk, i.e. the possibility that the party providing the swap will fail to fulfil its obligation to deliver the performance of the index being tracked.
Net counterparty exposure is measured as the difference between the fund’s NAV and collateral value (less haircuts or margins). Under UCITS, the net counterparty risk exposure may not exceed 10% of the fund’s NAV, which means that at least 90% of the ETF must be collateralised.
How is Counterparty Risk Managed?Counterparty risk in ETFs that employ a funded-swap model is actively managed by portfolio managers on a daily basis.
Whenever the collateral value falls below the level of collateralisation agreed with the swap counterparty, the manager will ask the counterparty to post additional collateral. This is to ensure that the agreed-upon level of collateralisation is maintained at the end of each business day.
Page 25 of 60©2014 Morningstar. All rights reserved. This document includes proprietary material of Morningstar. Reproduction, transcription or other use, by any means, in whole or in part, without the prior written consent of Morningstar is prohibited. The Morningstar Investment Management group of Morningstar, Inc. includes Morningstar Associates, Ibbotson Associates, and Morningstar Investment Services, which are registered investment advisors and wholly owned subsidiaries of Morningstar, Inc. The Morningstar name and logo are registered marks of Morningstar.
Provider Profiles
Please note that the information provided in these profiles was either supplied to us directly by the relevant providers or taken from public sources. As such, we cannot guarantee that it is complete, accurate, or timely. Please refer to ETF prospectuses and providers’ websites for the latest information.
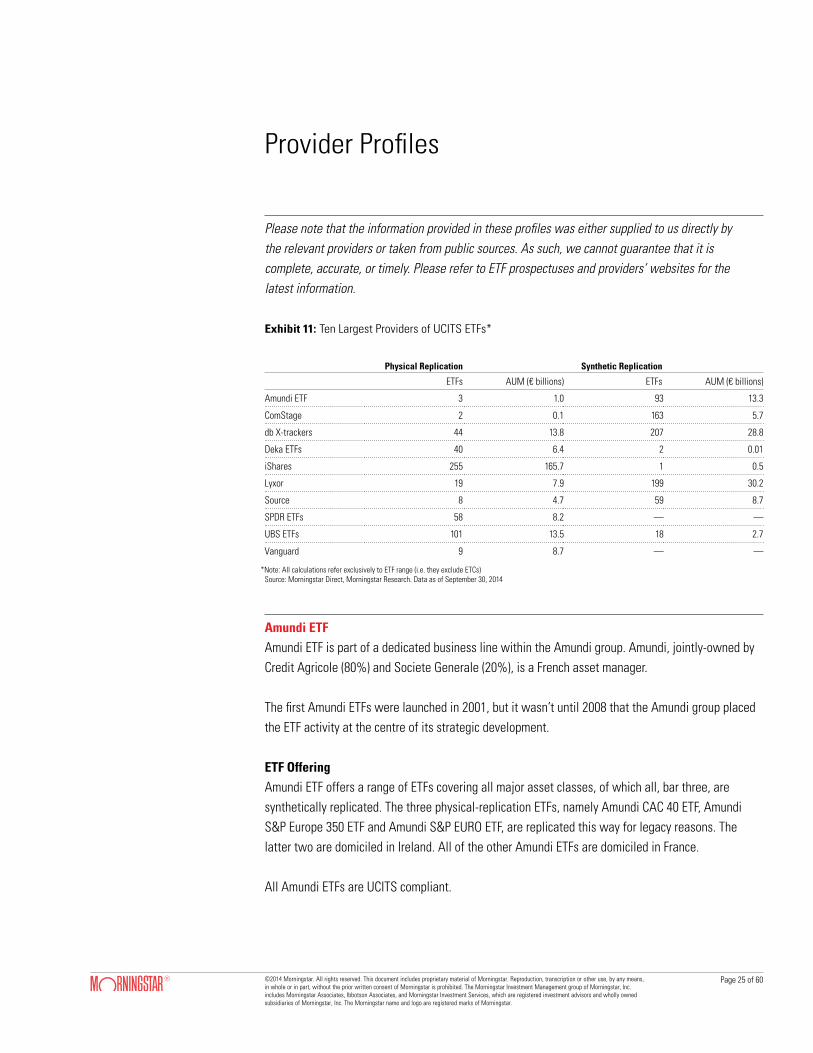
Exhibit 11: Ten Largest Providers of UCITS ETFs*
Amundi ETFAmundi ETF is part of a dedicated business line within the Amundi group. Amundi, jointly-owned by Credit Agricole (80%) and Societe Generale (20%), is a French asset manager.
The first Amundi ETFs were launched in 2001, but it wasn’t until 2008 that the Amundi group placed the ETF activity at the centre of its strategic development.
ETF OfferingAmundi ETF offers a range of ETFs covering all major asset classes, of which all, bar three, are synthetically replicated. The three physical-replication ETFs, namely Amundi CAC 40 ETF, Amundi S&P Europe 350 ETF and Amundi S&P EURO ETF, are replicated this way for legacy reasons. The latter two are domiciled in Ireland. All of the other Amundi ETFs are domiciled in France.
All Amundi ETFs are UCITS compliant.
Physical Replication Synthetic Replication
ETFs AUM (€ billions) ETFs AUM (€ billions)
Amundi ETF 3 1.0 93 13.3
ComStage 2 0.1 163 5.7
db X-trackers 44 13.8 207 28.8
Deka ETFs 40 6.4 2 0.01
iShares 255 165.7 1 0.5
Lyxor 19 7.9 199 30.2
Source 8 4.7 59 8.7
SPDR ETFs 58 8.2 — —
UBS ETFs 101 13.5 18 2.7
Vanguard 9 8.7 — —
*Note: All calculations refer exclusively to ETF range (i.e. they exclude ETCs)Source: Morningstar Direct, Morningstar Research. Data as of September 30, 2014
Page 26 of 60©2014 Morningstar. All rights reserved. This document includes proprietary material of Morningstar. Reproduction, transcription or other use, by any means, in whole or in part, without the prior written consent of Morningstar is prohibited. The Morningstar Investment Management group of Morningstar, Inc. includes Morningstar Associates, Ibbotson Associates, and Morningstar Investment Services, which are registered investment advisors and wholly owned subsidiaries of Morningstar, Inc. The Morningstar name and logo are registered marks of Morningstar.
3
3
3
PeopleAmundi manages all of its ETFs in-house through a dedicated ETF team within the Amundi ETF & Indexing business line. At the time of writing, the team is comprised of 52 professionals, 16 of whom are engaged directly in the management of the ETF portfolios. The equity management team headed by Laurent Trottier is composed of 13 portfolio managers, five of whom are based in Tokyo. The fixed income management team headed by Isabelle Vic-Philippe consists of three portfolio managers.
Portfolio Management Process: Synthetic ETFsAll of Amundi’s synthetic ETFs use the unfunded swap model. Under this model, each ETF buys and holds a basket of securities and simultaneously enters into a swap agreement with a counterparty that commits to pay the index performance in exchange for the performance of the fund holdings.
Swap CounterpartyEach Amundi ETF enters into a swap agreement with a single counterparty. BNP Paribas is used as swap provider for equity and commodity ETFs, while Societe Generale is used for fixed-income ETFs.
Counterparties are selected following an auction process implemented every five years, with competitiveness monitored and changes negotiated on an ongoing basis.
Substitute BasketSubstitute baskets for equity ETFs consist mainly of stocks in the MSCI Europe index and/or stocks from the underlying index and, to a lesser extent, stocks in the S&P500 and/or the Nikkei 225. Additionally, the UCITS diversification rule applies.
For fixed income and commodity ETFs, portfolio managers buy investment grade bonds issued by OECD countries and/or securities from the underlying index and to a lesser extent investment grade corporate or covered.
As an additional protection measure, BNP Paribas and Societe Generale securities are excluded from the funds’ assets.
No securities lending is carried out within the substitute baskets.
How is Counterparty Risk Managed?For its ETF range, Amundi aims to maintain zero daily counterparty exposure. To achieve this, the portfolio manager resets the swap on a daily basis regardless of exposure.
In the event of a swap-counterparty default, Amundi may appoint another swap counterparty, switch to physical replication or return funds to investors by liquidating the ETF.

Page 27 of 60©2014 Morningstar. All rights reserved. This document includes proprietary material of Morningstar. Reproduction, transcription or other use, by any means, in whole or in part, without the prior written consent of Morningstar is prohibited. The Morningstar Investment Management group of Morningstar, Inc. includes Morningstar Associates, Ibbotson Associates, and Morningstar Investment Services, which are registered investment advisors and wholly owned subsidiaries of Morningstar, Inc. The Morningstar name and logo are registered marks of Morningstar.
3
3
3
DisclosureThe composition of the substitute basket, the marked-to-market swap value and the swap counter-party name are disclosed and published daily on the company website.
Portfolio Management Process: Physical ETFsAll three Amundi physical ETFs are fully-replicated, that is, the manager buys all the securities in the weights stipulated by the tracked index.
TradingAll trading is done in-house via Amundi Intermediation, a 100%-owned subsidiary of Amundi. By aggregating trades from other parts of the group, Amundi Intermediation can take advantage of economies of scale and ensure that transactions costs are minimised.
Cross-buying, the act of transacting internally with other business groups in order to reduce transac-tions fees, is not used within the firm.
Index-Related EventsIn order to minimise market risk, Amundi does not attempt to pre-empt market events (e.g. corporate actions, index rebalances) but rather reacts to events as they happen.
Cash and Dividend ManagementPortfolio managers use futures for cash management purposes, including for the reinvestment of dividends to minimise tracking error. In the case of scrip dividend, portfolio managers decide between receiving the dividend in stock or cash.
Securities LendingAmundi uses an agency-based securities lending programme for its three physically-replicated ETFs. A list of 30 counterparties is selected by Amundi’s Risk Committee and reviewed continuously after an annual due diligence process.
A team within Amundi’s Risk Department is dedicated to monitoring counterparty risk.
Acceptable collateral include equities, bonds and cash. Amundi takes equities from well-known large-cap indices. Accepted bonds include G5, G7, G10 bonds and minimum AA-rated corporate bonds. The following haircuts are applied: 110.5% for equities, 103% for cash and 105% for bonds. The marked-to-market collateral is held in a segregated account in the name of the fund by CACEIS, which also acts as the custodian of the ETF. The collateral received cannot be re-lent.
The maximum authorised amount lent out per fund is 23%.

Page 28 of 60©2014 Morningstar. All rights reserved. This document includes proprietary material of Morningstar. Reproduction, transcription or other use, by any means, in whole or in part, without the prior written consent of Morningstar is prohibited. The Morningstar Investment Management group of Morningstar, Inc. includes Morningstar Associates, Ibbotson Associates, and Morningstar Investment Services, which are registered investment advisors and wholly owned subsidiaries of Morningstar, Inc. The Morningstar name and logo are registered marks of Morningstar.
3
3
3
Securities lending revenues are split 60/40, with the fund receiving 60% and Amundi 40% of the gross revenues. The provider covers all operational costs. Investors are not offered indemnification in the event of borrower default.
Currently, information about securities lending in Amundi ETFs is disclosed upon request but is expected to be made available on the provider’s website in future.
ComStageComStage, the ETF brand of Germany’s Commerzbank AG, launched its first ETFs in 2008.
ETF OfferingAll ComStage ETFs, bar two, are synthetically-replicated, for cost, tax and tracking efficiency reasons. The two non-synthetically-replicated ETFs, namely ComStage ETF FR DAX and ComStage ETF FR EURO STOXX 50, use physical replication, in response to investor demand.
All ComStage ETFs are UCITS compliant and domiciled in Luxembourg.
PeopleThe management company for ComStage ETFs is Commerz Funds Solutions S.A. (CFS), a Luxembourg-based fully-owned subsidiary of Commerzbank. The team is split between Frankfurt and Luxembourg. The Frankfurt portfolio management team, which consists of three people, is in charge of fund management, while the Luxembourg team is responsible for risk control and compliance. Product management and distribution is mainly done in Frankfurt.
Portfolio Management Process: Synthetic ETFsFor its entire range of synthetic ETFs, ComStage used the unfunded, fully collateralised swap model. Under this model, each ETF buys and holds a basket of securities and simultaneously enters into a swap agreement with a counterparty that commits to pay the index performance in exchange for the performance of the fund holdings. Positive swap exposures are collateralised.
Swap CounterpartyComStage’s synthetic ETFs currently use only one swap counterparty, Commerzbank AG. Currently no bidding process is applied when shopping for swaps. However independent price checks are performed.
Substitute BasketEach substitute basket (also referred to as the carrier basket by ComStage) is identical for all swap-based ComStage ETFs.

Page 29 of 60©2014 Morningstar. All rights reserved. This document includes proprietary material of Morningstar. Reproduction, transcription or other use, by any means, in whole or in part, without the prior written consent of Morningstar is prohibited. The Morningstar Investment Management group of Morningstar, Inc. includes Morningstar Associates, Ibbotson Associates, and Morningstar Investment Services, which are registered investment advisors and wholly owned subsidiaries of Morningstar, Inc. The Morningstar name and logo are registered marks of Morningstar.
3
3
3
The substitute basket is made up of European blue chip stocks (constituents of the DAX, EURO STOXX 50 or the STOXX Europe Large 200, except for Commerzbank shares). However, no Italian or French stocks are held due to the financial transaction tax, and only non-dividend-paying stocks are held in the carrier basket. Each constituent usually accounts for less than 5% of the basket’s total value in order to fulfil institutional clients’ diversification requirements (‘GroMiKV’).
Each ETF has a legally separate substitute basket held in a segregated account at the custodian BNP Paribas Securities Services and is monitored daily.
Securities lending is carried out within the substitute basket (see below for details on the practice).
How is Counterparty Risk Managed?Swaps are reset two to three times per year and whenever there is a creation/redemption within the fund. Between reset dates, the manager requests Commerzbank to post collateral equivalent to 105% of the positive swap marked-to-market value. The value of the swap is independently checked daily by Commerz Funds Solutions and BNP.
The collateral, which may consist of government bonds from Germany, the UK and France, is held by Commerzbank in a segregated account at Clearstream Banking, Luxembourg/Frankfurt. Currently, only German government bonds are used as collateral. Collateral value is adjusted daily.
In the event of a swap counterparty default, another counterparty would be selected. If no counter-party can be found, the ETF could use the collateral provided and may either switch to full replication or be closed and liquidated.
DisclosureFund holdings, swap values, collateral and counterparty risk exposure are published on ComStage’s website and updated on a weekly basis. The information is available on a more frequent basis upon request only.
Portfolio Management Process: Physical ETFsComStage’s physical ETFs use full replication.
TradingTrading activities are carried out in-house, while portfolio managers also trade securities. No cross-trading is allowed under German regulation.
Index-Related EventsIndex changes are implemented in the fund as of the effective index change. Portfolio managers

Page 30 of 60©2014 Morningstar. All rights reserved. This document includes proprietary material of Morningstar. Reproduction, transcription or other use, by any means, in whole or in part, without the prior written consent of Morningstar is prohibited. The Morningstar Investment Management group of Morningstar, Inc. includes Morningstar Associates, Ibbotson Associates, and Morningstar Investment Services, which are registered investment advisors and wholly owned subsidiaries of Morningstar, Inc. The Morningstar name and logo are registered marks of Morningstar.
3
3
3
don’t anticipate or trade ahead of index changes. Exemptions might apply if traded securities exceed average daily trading volume.
Cash and Dividend ManagementDividends paid by the underlying stocks are held as cash in the funds until distribution date. Managers may also use swaps to manage dividends in physical income funds for tax reasons. The level of the total-return swap rarely exceeds 1% of the fund volume.
Securities Lending All ComStage ETFs (physically- and synthetically-replicated) engage in securities lending activities.Portfolio managers may lend up to 100% of funds’ assets to parent company Commerzbank AG. Although the bank may on-lend the assets to third parties, counterparty risk lies directly with Commerzbank AG.
Lending operations are secured by UCITS compliant collateral, which may consist of equities, bonds or fund shares. Haircuts are applied accordingly. Collateral is equivalent to 100.5% of the loan value after appropriate haircuts are applied. No securities affiliated with Commerzbank are accepted as collateral.
Funds receive 100% of the income generated through securities lending, net of operational costs. These costs, however, are not disclosed.
Information including revenue earned from securities lending and maximum on-loan level is disclosed in the funds’ annual reports and to all investors upon request. ComStage also provides details about its risk management process and collateral upon request to institutional investors.
db X-trackersdb X-trackers is part of Deutsche Asset & Wealth Management (Deutsche AWM), the asset manage-ment division of Deutsche Bank. db X-trackers ETFs were launched in 2007 when the business was part of Deutsche Bank’s Corporate Banking & Securities division. db X-trackers became a part of Deutsche AWM’s passive business in 2012.
ETF OfferingThe db X-trackers ETF offering covers all main asset classes.
db X-trackers are available to investors via three platforms: Two, namely db x-trackers I and db x-trackers II, are domiciled in Luxembourg, while the Concept Fund Solutions platform is domiciled in Ireland. db x-trackers II offers only synthetic ETFs, while the other two platforms offer both synthetic and physical ETFs.

Page 31 of 60©2014 Morningstar. All rights reserved. This document includes proprietary material of Morningstar. Reproduction, transcription or other use, by any means, in whole or in part, without the prior written consent of Morningstar is prohibited. The Morningstar Investment Management group of Morningstar, Inc. includes Morningstar Associates, Ibbotson Associates, and Morningstar Investment Services, which are registered investment advisors and wholly owned subsidiaries of Morningstar, Inc. The Morningstar name and logo are registered marks of Morningstar.
3
3
3
db X-trackers started as a wholly synthetic ETF provider, but in 2010, the decision was taken to introduce physically-replicated ETFs. In 2014, db X-trackers switched a series of ETFs from synthetic to physical replication and announced it will continue to expand its physical range. The choice of replication method, however, will continue to be made on a case-by-case basis, depending on what is deemed more efficient.
All db X-trackers ETFs are UCITS compliant.
PeopleWhile all of the Irish-domiciled ETFs are managed in-house, the portfolio management of the Luxembourg-domiciled funds is currently outsourced to State Street Global Advisors (SSgA) in London. The db X-trackers Harvest CSI300 Index UCITS ETF (DR) is managed by Harvest Global Investments in Hong Kong. In both cases, the Management Company, DB Platinum Advisors (DBPA), provides oversight in Luxembourg.
db X-trackers’ team has grown considerably following the internal restructuring that moved db X-trackers into the newly-established Deutsche AWM in 2012.
Portfolio Management Process: Synthetic ETFsdb X-trackers refers to synthetic replication as ‘indirect replication’ and uses both the unfunded and the fully-funded swap models.
db X-trackers uses the unfunded swap model for all of its fixed-income ETFs and for certain equity ETFs. Under the unfunded swap model, each ETF buys and holds a basket of securities and simulta-neously enters into a swap agreement with a counterparty that commits to pay the index perfor-mance in exchange for the performance of the fund holdings.
The fully-funded swap model is used for all remaining equity ETFs and for db X-trackers currency, commodity and alternative investment ETFs. Under the fully-funded swap model, each ETF transfers investors’ cash to a swap counterparty in exchange for the index performance plus the principal at a future date. The counterparty posts collateral assets with a third party custodian.
db X-trackers has recently transitioned a number of ETFs from the fully-funded to the unfunded swap structure, a move prompted by client demand.
Swap CounterpartyFor its entire range of synthetic ETFs, db X-trackers uses its parent company, Deutsche Bank AG, as the sole swap counterparty. Swap pricings are reviewed on an ongoing basis to ensure they’re in line with the market.

Page 32 of 60©2014 Morningstar. All rights reserved. This document includes proprietary material of Morningstar. Reproduction, transcription or other use, by any means, in whole or in part, without the prior written consent of Morningstar is prohibited. The Morningstar Investment Management group of Morningstar, Inc. includes Morningstar Associates, Ibbotson Associates, and Morningstar Investment Services, which are registered investment advisors and wholly owned subsidiaries of Morningstar, Inc. The Morningstar name and logo are registered marks of Morningstar.
3
3
3
Substitute Basket / CollateralFor db X-trackers ETFs that use the unfunded swap model, the substitute basket consists of OECD equities (for equity ETFs) and typically investment grade government and corporate bonds (for fixed-income ETFs). The issuers of the bonds bought by government bond ETFs typically are the same issuers that are referenced by the relevant underlying indices.
Assets of the substitute basket are held in a ring-fenced segregated account by the custodian in the name of the ETF. State Street Custodial Services (Ireland) Limited serves as custodian of the funds on the Concept Fund Solutions platform while State Street Bank Luxembourg is the custodian of the db-x tracker I and db-x tracker II platforms.
db X-trackers ETFs that use the fully-funded swap model receive collateral consisting of OECD equities and/or bonds with a minimum of investment grade (government and corporate). Haircuts ranging from 7.5% to 20% are applied for equity collateral, 10% for corporate bond collateral and 0% for government bond collateral.
No securities lending is carried out within the substitute basket/collateral.
How is Counterparty Risk Managed?Portfolio managers reset swaps to zero whenever there is a creation or redemption in the fund or the maximum swap exposure exceeds 5% of the funds prevailing end of day NAV.
The investment management team at Deutsche International Corporate Services (Ireland) Limited (‘DICSIL’) is responsible for overseeing risk functions for the Irish-domiciled ETFs. SSgA and DB Platinum Advisors handles risk functions for the Luxembourg-domiciled ETFs. Both management teams rely on a number of checks as part of the investment decision-making process, trade execution and post-trade process and use various external risk management systems. The risk management tools are tailored to each fund’s risk profile. Deutsche Bank also conducts internal audits.
For db X-trackers ETFs employing the unfunded-swap structure, in the event of a default by Deutsche Bank AG, the assets would either be sold and the cash returned to investors or be kept within the custodian bank while another swap counterparty was found to meet the fund’s investment objec-tives. The ETF’s management company/board of directors (as applicable) would decide on which approach to take.
For those db X-trackers ETFs employing the fully funded-swap structure, in the case of swap counterparty default, the custodian and the fund could seize the assets pledged as collateral without requiring the approval of Deutsche Bank.

Page 33 of 60©2014 Morningstar. All rights reserved. This document includes proprietary material of Morningstar. Reproduction, transcription or other use, by any means, in whole or in part, without the prior written consent of Morningstar is prohibited. The Morningstar Investment Management group of Morningstar, Inc. includes Morningstar Associates, Ibbotson Associates, and Morningstar Investment Services, which are registered investment advisors and wholly owned subsidiaries of Morningstar, Inc. The Morningstar name and logo are registered marks of Morningstar.
3
3
3
DisclosureThe composition of substitute baskets/collateral, swap counterparty exposure, swap costs/swap enhancements as well as estimated tracking difference (as applicable) are available on db X-trackers’ website, updated on a daily basis.
Portfolio Management Process: Physical ETFsdb X-trackers refers to physical replication as ‘direct replication’ and all its physically replicated ETFs are explicitly identified by the acronym ‘(DR)’ at the end of the fund’s name.
For physical ETFs, portfolio managers use either full replication or optimised sampling. ETFs with optimised sampling use a risk model to minimise tracking error based on the stock’s size, valuation characteristics, historic momentum and historic volatility.
TradingTrading is done in-house by Deutsche AWM International GmbH for Irish-domiciled ETFs and is carried out by SSgA for Luxembourg-domiciled ETFs.
Index-Related EventsPortfolio managers use multiple sources to forecast and monitor upcoming index changes. They may engage in some pre- or post-trading related to index changes to minimise market impact and/or capture extra value that can offset portfolio management costs.
Portfolio managers may also use futures to minimise tracking error resulting from index changes. Futures typically do not exceed 3% of the portfolio’s value.
Cash and Dividend/Coupon ManagementDividends received from the underlying stocks are reinvested in line with the index methodology in order to minimise tracking error.
Regarding distributions offered by the ETF, the funds will generate required cash through rebalancing or by using existing cash accounts.
Securities LendingMost Luxembourg physically replicated and some Irish-domiciled physically-replicated db X-trackers ETFs engage in securities lending, with DB Agency Securities Lending (DBASL) acting as lending agent. The maximum the funds can lend out is 50% of their portfolio at any given time.
Lending transactions are fully collateralised by taking UCITS-approved high-quality collateral. The level of overcollateralisation varies in relation to the asset class lent out and the asset class

Page 34 of 60©2014 Morningstar. All rights reserved. This document includes proprietary material of Morningstar. Reproduction, transcription or other use, by any means, in whole or in part, without the prior written consent of Morningstar is prohibited. The Morningstar Investment Management group of Morningstar, Inc. includes Morningstar Associates, Ibbotson Associates, and Morningstar Investment Services, which are registered investment advisors and wholly owned subsidiaries of Morningstar, Inc. The Morningstar name and logo are registered marks of Morningstar.
3
3
3
accepted as collateral. However, it typically is 110% for equity and corporate bond collateral, 105% for government/supranational bonds, and 100% for cash.
Deutsche Bank’s Credit Risk Management department selects and monitors the list of counterparties. In the event of a borrower insolvency or default, Deutsche Bank AG will indemnify the ETFs for any shortfall between the proceeds of liquidation and the market value of the securities.
For the Irish-domiciled and Luxembourg-domiciled physically-replicated db X-trackers ETFs, 70% of gross securities lending revenues are passed on to the fund. For the db x-trackers DAX UCITS ETF (DR) and db x-trackers DAX UCITS ETF (DR) – Income, 90% of gross securities lending revenues are passed on to the fund.
Securities lending information such as lending revenues, amounts on loan, borrower information are available on db X-trackers’ website, updated on a daily basis.
Deka ETFsDeka Investment GmbH, known as ETFLab Investment GmbH prior to July 2013, is a subsidiary of DekaBank Deutsche Girozentrale. Deka Investment offers investment funds and structured products across all asset classes. Its first ETF was launched in 2008.
ETF OfferingDeka’s ETF offering gives exposure to the two main asset classes, equity and fixed income. All Deka ETFs, bar two, are physically replicated. Deka MSCI Emerging Markets UCITS ETF and Deka EURO STOXX 50 Daily Short UCITS ETF are synthetically replicated.
All Deka ETFs are UCITS compliant and domiciled in Germany.
PeopleThe portfolio management team, which is currently located in Munich, consists of three people and is headed by Marco Bacigalupo. Part of the team will move to Frankfurt by September 2015 as a result of the re-branding from ETFLab ETFs to Deka ETFs and the integration of the business into Deka.
Portfolio Management Process: Physical ETFsFull replication is the default replication choice for Deka ETFs. Currently, portfolio managers don’t make use of optimized sampling.
TradingThe trading of securities is outsourced to Commerzbank. No cross-trading is allowed under German regulation.

Page 35 of 60©2014 Morningstar. All rights reserved. This document includes proprietary material of Morningstar. Reproduction, transcription or other use, by any means, in whole or in part, without the prior written consent of Morningstar is prohibited. The Morningstar Investment Management group of Morningstar, Inc. includes Morningstar Associates, Ibbotson Associates, and Morningstar Investment Services, which are registered investment advisors and wholly owned subsidiaries of Morningstar, Inc. The Morningstar name and logo are registered marks of Morningstar.
3
3
3
Index-Related EventsPortfolio managers implement index changes according to the respective index rules and tend to wait until the index changes have occurred. However, if necessary trading volumes exceed the daily average trading volume, managers may implement a trading strategy with the help of brokers in order to minimize market impact.
Cash and Dividend/Coupon ManagementDividends and coupons are treated according to index rules. For accumulating equity ETFs, they are re-invested immediately in the index’s constituents, while for distributing equity ETFs, dividends are held in a cash account until they are subsequently paid out to investors. No futures are used for cash management purposes within the funds.
In the case of scrip dividends, portfolio managers carry out an analysis to ascertain the most financially favourable course of action (e.g. taking cash or stock).
Securities LendingA majority of Deka ETFs currently engage in securities lending.
Deka can lend up to 10% of an ETF’s assets to parent bank DekaBank on a principal basis, meaning DekaBank is the only eligible counterparty to the funds. The bank may then on-lend the securities to third parties. Additionally, Deka can lend up to 100% of a fund’s assets to Clearstream Banking Frankfurt (CBF), which is an international clearing and depositary house. Deka ETFs may also lend securities directly to third parties, subject to a limit of 10% of fund assets per counterparty. In all cases, DekaBank is the securities lending service provider.
Deka accepts equities and bonds as collateral from DekaBank and European Central Bank (ECB)-eligible baskets from CBF. In addition, CBF has direct access to the ECB accounts of all the borrowers. In the event of a borrower default, if the collateral and the borrower's ECB account don´t cover the whole claim, a banking consortium guarantees to cover the shortfall. All fixed income securities received as collateral must be eligible collateral for the ECB. Additionally, there is a concentration limit that restricts the weight of each bond to a maximum of 10% of the value of the fixed income portfolio. Eligible equities must be listed on a main European stock exchange. No stock is permitted to represent more than 3% of the value of the collateral portfolio. Margins applied to the collateral received are 3% for DekaBank, 5% for Clearstream and 10% for third party borrowers. All collateral is held in segregated accounts in the name of the ETF.
The fund receives 70% of the gross revenue generated through securities lending, while the remaining 30% is used to cover the associated operational costs.
Page 36 of 60©2014 Morningstar. All rights reserved. This document includes proprietary material of Morningstar. Reproduction, transcription or other use, by any means, in whole or in part, without the prior written consent of Morningstar is prohibited. The Morningstar Investment Management group of Morningstar, Inc. includes Morningstar Associates, Ibbotson Associates, and Morningstar Investment Services, which are registered investment advisors and wholly owned subsidiaries of Morningstar, Inc. The Morningstar name and logo are registered marks of Morningstar.
3
3
3
Deka discloses on-loan levels, lent securities, counterparties and collateral composition upon request. Securities on loan and collateralisation levels are disclosed in annual reports.
Portfolio Management Process: Synthetic ETFsDeka’s synthetically-replicated ETFs use the unfunded swap model. Each ETF buys a basket of securities and simultaneously enters into a swap agreement with a counterparty that commits to pay the index performance in exchange for the performance of the fund holdings.
Swap CounterpartyDeka contracts with one or multiple swap counterparties. Currently, Deka ETFs use a single counter-party, DekaBank.
No bidding process is implemented when shopping for swaps. However, independent price checks are performed.
Substitute BasketSubstitute baskets for Deka ETFs consist of European blue chip stocks (usually Eurozone Large Cap Equities that belong to the Deutsche Börse’s SWAXX Index). These assets are held in segregated accounts at the custodian DekaBank Deutsche Girozentrale and monitored daily by the portfolio manager and DekaBank.
Securities lending activity is carried out within the substitute baskets of Deka’s synthetic ETFs, using the same setup as Deka’s physical ETFs.
How is Counterparty Risk Managed?Swap exposure is monitored daily by the manager and the custodian.
Swaps are reset to zero whenever (i) there is a creation/redemption, (ii) the swap value reaches 3.5% of the fund’s NAV and (iii) at least once per quarter. Between reset dates, the manager requests the swap counterparty to post collateral to further mitigate counterparty risk. Collateral consists of German government bonds and is held by the custodian, DekaBank, in a pledged account in the name of the fund. Collateral is adjusted on a daily basis to ensure 130% collateralisation of the swap exposure.
In addition, the counterparty risk from direct securities lending is limited to 10% of the fund’s NAV and collateralisation has to amount to 103%.
DisclosureDeka publishes fund holdings daily on its website, along with sector aggregate exposure, country aggregate exposure and swaps’ value.

Page 37 of 60©2014 Morningstar. All rights reserved. This document includes proprietary material of Morningstar. Reproduction, transcription or other use, by any means, in whole or in part, without the prior written consent of Morningstar is prohibited. The Morningstar Investment Management group of Morningstar, Inc. includes Morningstar Associates, Ibbotson Associates, and Morningstar Investment Services, which are registered investment advisors and wholly owned subsidiaries of Morningstar, Inc. The Morningstar name and logo are registered marks of Morningstar.
3
3
3
iSharesiShares, a division of BlackRock since 2009, began operations in Europe in 2000. In 2013, Blackrock bought Credit Suisse’s ETF operations and merged them with iShares.
BlackRock, the world’s largest asset manager, was founded in 1988 and is headquartered in the US. It specialises in the provision of investment management services across all main asset classes and via a wide variety of vehicles, including actively-managed, structured investments and indexing solutions such as traditional index funds and iShares ETFs.
ETF OfferingiShares ETF large offering covers all main asset classes. iShares ETFs are incorporated into a variety of legal structures depending on domicile, namely Open Ended Investment Companies in Ireland (70% of funds) and Germany (25% of funds), and FCP (Fonds Commun de Placement) in Luxembourg and Switzerland (5% of funds, resulting from the acquisition of Credit Suisse’s ETF business).
All iShares ETFs, except those domiciled in Switzerland, are UCITS compliant.
iShares can be described as the key exponent of physical replication in the universe of ETF providers in Europe. Its foray into the development and subsequent launch of a small suite of swap-replicated ETFs—for exposures difficult or impossible to replicate in a physical ETF format—in 2011 proved short-lived. As of this review, bar the single exception of a swap-based German-domiciled commodity ETF, the entire suite of iShares products are physically replicated.
PeopleiShares equity and commodity ETFs in Europe are managed by BlackRock’s Beta Strategies EMEA group, headed by Eleanor De Freitas. Supported by 21 portfolio managers, this group focuses exclusively on the management of index products. The suite of iShares fixed-income ETFs are managed by BlackRock’s Model-Based Fixed Income Portfolio Management Group, headed by Michael Harper. This group, supported by around 15 portfolio managers, is responsible for the day-to-day management of both index-based and actively-managed fixed income funds and invest-ment solutions.
Portfolio Management Process The stated aim of the portfolio management group in charge of iShares equity ETFs is to pursue full replication whenever feasible and use an optimisation approach for ETFs tracking market indices subject to a fair degree of illiquidity and/or high transaction costs. In practice, some 85% of iShares equity ETFs are fully replicated, while the remaining 15% use optimisation. iShares ETFs’ factsheets define the methodology as ‘replicated’ for full replication or ‘optimised’ to indicate the use of an optimiser.

Page 38 of 60©2014 Morningstar. All rights reserved. This document includes proprietary material of Morningstar. Reproduction, transcription or other use, by any means, in whole or in part, without the prior written consent of Morningstar is prohibited. The Morningstar Investment Management group of Morningstar, Inc. includes Morningstar Associates, Ibbotson Associates, and Morningstar Investment Services, which are registered investment advisors and wholly owned subsidiaries of Morningstar, Inc. The Morningstar name and logo are registered marks of Morningstar.
3
3
3
In the case of fixed-income ETFs, the default replication methodology is stratified sampling, identified as ’sampled’ in the ETFs’ factsheets. In practice, according to our own research, the extent of sampling for a substantial number of these fixed-income ETFs tends to be minimal. As such, sampling in these cases can perhaps be best understood as providing the portfolio managers with leeway to apply slightly different weightings to those in the index and/or avoid purchasing the minority of index components which may suffer from special liquidity conditions.
The fund management process is highly automated. Managers rely on proprietary analytical and risk control systems to meet all aspects of management. The risk monitoring system is integrated with the portfolio building solution, issuing managers with daily reports.
TradingAll trading is done in-house, with all orders channelled through to BlackRock’s Trading and Liquidity Strategy Group. This group has global presence, with staff in Europe, the US and Asia, and has the ability to route orders from one region to another for local execution.
Cost savings in the trading of securities is seen as key to ensuring efficient management of iShares ETFs. This effectively means that any opportunity to cross-trade internally amongst the various Blackrock divisions will be actively pursued. Once the internal cross-trading avenue is exhausted, the trading desk will explore available external crossing opportunities with other institutional investors before engaging in direct market execution.
Index-Related EventsIn the event of index changes—driven by either rebalancings or corporate actions—portfolio managers carry out a series of analyses, mostly focusing on liquidity and pricing conditions. In an effort to minimise potential market impact, managers may trade ahead or after the actual index event.
Cash and Dividend/Coupon ManagementCash dividends for iShares equity ETFs, with the exception of Sharia-compliant ETFs, are routinely equitised from the ex-date using index futures, either like-for-like or best available proxy to the benchmark tracked by the ETF. The dividends accrue in a cash account until it reaches a certain threshold, when they are re-invested in the ETF. Simultaneously, the long positions in equity index futures are reduced so that the portfolio remains unleveraged. In the case of scrip dividends, the portfolio management team carries out an analysis to ascertain the most financially favourable course of action (e.g. taking cash or stock).
Bond coupon payments to fixed-income ETFs accrue in a cash account until re-investment in the ETF according to benchmark rules, typically at month-end.

Page 39 of 60©2014 Morningstar. All rights reserved. This document includes proprietary material of Morningstar. Reproduction, transcription or other use, by any means, in whole or in part, without the prior written consent of Morningstar is prohibited. The Morningstar Investment Management group of Morningstar, Inc. includes Morningstar Associates, Ibbotson Associates, and Morningstar Investment Services, which are registered investment advisors and wholly owned subsidiaries of Morningstar, Inc. The Morningstar name and logo are registered marks of Morningstar.
3
3
3
Securities LendingSecurities lending is a common practice across the entire range of European-domiciled iShares ETFs, with BlackRock acting as the lending agent. The amount of securities that can be lent is capped at 50% of AUM per ETF.
Lending operations are protected by taking UCITS-approved high-quality collateral—normally stocks and bonds, although cash and certificates of deposit (CDs) can also be accepted—in excess of the loan value. The level of overcollateralization varies in relation to the asset class lent out and the asset class accepted as collateral. However, it typically ranges between 110%–112% for equity collateral, 102.5%–105% for government bonds, 103.5%–108% for cash (in USD, EUR, GBP and JPY only) and 103.5%–108% for certificate of deposits.
Both loan and collateral values are marked-to-market daily. The collateral is held in a ring-fenced account in the name of the ETF separate from BlackRock’s balance sheet. The lending agent routinely monitors the quality of accepted borrowers and also provides full indemnification to the ETF. Should a borrower default, BlackRock promises to replace all the unreturned securities.
Gross lending revenue is split as follows: 62.5% to the ETF and 37.5% to the lending agent, with the latter covering all associated operational costs. This 62.5/37.5 split was improved in May 2014 from 60/40 previously.
For each ETF that takes part in the securities lending programme, iShares discloses quarterly on its website a summary of key statistics for the previous 12 months, including average and maximum on loan values, collateral value (% of loan) and list of holdings, including weights, plus lending return to the fund over the period.
LyxorLyxor Asset Management, a subsidiary of the Societe Generale Group, was founded in 1998. Lyxor specialises in the provision of investment products and solutions in four major areas: ETFs and indexing, structured investments; alternative investments and quantitative investments.
ETF OfferingLyxor ETF offering covers all main asset classes. Lyxor ETFs are incorporated in two types of structure, namely FCP (Fonds Commun de Placement) and SICAV ('Societe d’Investissement a Capital Variable), with legal domiciles in France and Luxembourg. The FCP structure is a historical legacy. As of now, Lyxor only launches ETFs through SICAV.
All Lyxor ETFs are UCITS compliant.

Page 40 of 60©2014 Morningstar. All rights reserved. This document includes proprietary material of Morningstar. Reproduction, transcription or other use, by any means, in whole or in part, without the prior written consent of Morningstar is prohibited. The Morningstar Investment Management group of Morningstar, Inc. includes Morningstar Associates, Ibbotson Associates, and Morningstar Investment Services, which are registered investment advisors and wholly owned subsidiaries of Morningstar, Inc. The Morningstar name and logo are registered marks of Morningstar.
3
3
3
Lyxor started off as a wholly synthetic ETF provider. In late 2012, the decision was made to transition to physical replication a number of ETFs for which synthetic replication did not result in a meaningful tracking comparative advantage. Further growth in Lyxor’s offering of physically replicated ETFs will be determined on the same basis.
PeopleAs of this review, Lyxor’s ETF and Index Fund Management team, headed by Raphael Dieterlen, is made up of 11 people, including five portfolio managers and four assistants.
Portfolio Management Process: Synthetic ETFsFor its entire range of synthetic ETFs, Lyxor uses the unfunded swap model. Under this model, each ETF buys and holds a basket of securities and simultaneously enters into a swap agreement with a counterparty that commits to pay the index performance in exchange for the performance of the fund holdings.
It must be noted that Lyxor denotes the replication methodology for its suite of synthetic ETFs as ‘Unfunded Swap Model (physical assets swap 0%)’ on its website and as ’Physical Plus Performance Swap’ in the ETF factsheets.
Swap CounterpartyFor its entire range of synthetic ETFs, Lyxor uses Societe Generale as the sole direct swap counter-party for the purposes of operational efficiency. Societe Generale works back-to-back with counter-parties selected by Lyxor in the frame of a request for pricing (RFP) process. Swap counterparties are selected and regularly monitored on a set of creditworthiness criteria. Any counterparty risk arising from these back-to-back operations lies exclusively with Societe Generale.
Portfolio managers are responsible for issuing RFPs for swap contracts. Portfolio managers launch an RFP for any ETF with AUM in excess of €200 million. The goal is to secure the best possible execu-tion for swap contracts, which would be agreed upon for one year. ETFs with AUM below €200 million are not subject to the RPF process. Nonetheless, swap prices for these ETFs are monitored for competitiveness and, if required, challenged.
Substitute Basket Substitute baskets for equity and commodity ETFs are generally made up of liquid stocks belonging to major indices and maintain a minimum average trading volume and market capitalisation. Meanwhile, for fixed income ETFs, they consist of bonds selected on three key criteria limits: maximum duration, minimum size and minimum rating. For all baskets, Lyxor seeks a high degree of consistency between the eligible securities and the nature of the ETF’s benchmark index.

Page 41 of 60©2014 Morningstar. All rights reserved. This document includes proprietary material of Morningstar. Reproduction, transcription or other use, by any means, in whole or in part, without the prior written consent of Morningstar is prohibited. The Morningstar Investment Management group of Morningstar, Inc. includes Morningstar Associates, Ibbotson Associates, and Morningstar Investment Services, which are registered investment advisors and wholly owned subsidiaries of Morningstar, Inc. The Morningstar name and logo are registered marks of Morningstar.
3
3
3
All substitute baskets comply with UCITS diversification rules and exclusions/limits on eligibility of Societe Generale bonds and stock.
All assets in the substitute basket are the property of the ETF and are kept segregated on a separate account in its name with the custodian bank; Societe Generale Securities Services for French-domiciled ETFs and European Fund Services SA for Luxembourg-domiciled ETFs.
For its suite of synthetic ETFs, Lyxor does not engage in securities lending with the constituents of substitute baskets.
How is Counterparty Risk Managed?Lyxor targets zero swap exposure (i.e. substitute basket value is equal to 100% of an ETF’s NAV) per individual ETF on a daily basis, meaning the manager would reset the swap when its level becomes positive (i.e. the fund owes the swap counterparty). In practice, the swap level could be negative up to -2% of NAV, thus effectively meaning the fund is overcollateralised.
Lyxor’s ETF portfolio management team is responsible for the daily monitoring of the swap value, along with a dedicated team set within Lyxor’s COO office, the Ratio Control team, who is respon-sible for the second level of control on D1. Lyxor’s Internal Control acts as the third and final level of control.
In the case of swap counterparty default, Lyxor would give first priority to selecting a new counter-party and arrange a new swap contract. If this were not possible, a change from synthetic to physical replication would be pursued. As a last resort, Lyxor would consider selling the basket of assets and fully redeem the fund, subject to regulatory approval.
DisclosureLyxor fully discloses ETF substitute basket contents and swap mark-to-market values on a daily basis on its website.
Portfolio Management Process: Physical ETFsLyxor uses the expression ‘direct replication’ to refer to physical replication techniques. All physi-cally-replicated Lyxor ETFs are explicitly identified by the acronym ‘(DR)’ at the end of the ETF’s name. In addition, factsheets for Lyxor physically-replicated ETFs define the replication method as “Physical only”.
Full replication is the default replication choice for Lyxor’s range of physical ETFs. However, in the case of fixed-income ETFs for which the underlying market displays special liquidity conditions, portfolio managers opt to follow a stratified sampling approach. The key objective of the ETF management process is to minimise tracking deviations by carefully managing daily cash-flows,
Page 42 of 60©2014 Morningstar. All rights reserved. This document includes proprietary material of Morningstar. Reproduction, transcription or other use, by any means, in whole or in part, without the prior written consent of Morningstar is prohibited. The Morningstar Investment Management group of Morningstar, Inc. includes Morningstar Associates, Ibbotson Associates, and Morningstar Investment Services, which are registered investment advisors and wholly owned subsidiaries of Morningstar, Inc. The Morningstar name and logo are registered marks of Morningstar.
3
3
3
index-related events (e.g. rebalancing, corporate actions, dividends) and ultimately ensuring the best possible execution in the trading of securities.
TradingAll trading is done in-house. Vanilla trades are directly routed to Lyxor’s execution desk, while large trades for both equity and fixed income or trades on illiquid instruments (e.g. ultra-long bonds, high yield bonds) are negotiated directly by ETF portfolio managers. Internal cross-trading is allowed, but happens rarely and only for limited sizes.
Index-Related EventsIn the event of index rebalancing, portfolio managers carry out an analysis of potential market impact. If market impact is deemed high, managers will generally smooth it through volume-weighted average price (VWAP) execution. In cases where market impact is limited, trading require-ments would be met via standard brokerage channels.
Cash and Dividend/Coupon ManagementRoutine cash stock dividends are re-invested according to index rules. Portfolio managers may use futures for cash equitisation purposes. However, its use rarely exceeds 1% of ETFs’ NAV. In the case of scrip dividends, portfolio managers follow a quantitative-driven approach to ascertain the most financially favourable course of action (e.g. taking cash or stock).
Bond coupon payments to fixed-income ETFs are re-invested to the fund directly in bonds in accor-dance with benchmark rules.
Securities Lending Securities lending is used for equity ETFs only, with Societe Generale Securities Services acting as the lending agent. The amount of securities that can be lent is capped at 25% of AUM per ETF.
Lending operations are hedged by taking UCITS-approved high-quality collateral (e.g. blue chip stocks and G7 government bonds) in excess of the loan value. The level of overcollateralisation is set at 105% for bonds and 110% for stocks. Cash is not accepted as collateral.
Both loan and collateral values are marked-to-market daily. The lending agent routinely monitors the quality of accepted borrowers and also provides full indemnification to the ETF in case of a borrower failure to return the securities.
Gross lending revenue is split as follows: Minimum 65% to the ETF, maximum 20% to Lyxor and 15% to the lending agent. This split enables Lyxor to cover its operational costs. Lyxor does not make any profit from securities lending activities.
Page 43 of 60©2014 Morningstar. All rights reserved. This document includes proprietary material of Morningstar. Reproduction, transcription or other use, by any means, in whole or in part, without the prior written consent of Morningstar is prohibited. The Morningstar Investment Management group of Morningstar, Inc. includes Morningstar Associates, Ibbotson Associates, and Morningstar Investment Services, which are registered investment advisors and wholly owned subsidiaries of Morningstar, Inc. The Morningstar name and logo are registered marks of Morningstar.
3
3
3
Lyxor discloses daily on its website all key information pertaining to its securities lending programme, including current loan levels (% of NAV) per ETF, one-year rolling average and maximum on-loan values, collateral value (% of loan) and list of holdings, including weights, plus returns since inception.
SourceSource is an asset manager and dedicated ETP provider with headquarters in London. It is owned by US-based private equity house Warburg Pincus and a consortium of investment banks, Bank of America Merrill Lynch, Goldman Sachs, J.P. Morgan, Morgan Stanley and Nomura. The company was founded in 2008 and the five banks sold a controlling stake (over 51%) to Warburg Pincus in 2014.
The first Source ETF was launched in 2009.
ETF OfferingSource’s ETF range covers all major asset classes and is predominantly synthetically replicated.Source's modus operandi differs from other ETF providers in that the firm pursues strategic partner-ships with asset managers and strategy providers in relation to the development and subsequent management of ETFs. Examples include partnerships with Legal & General, MAN Group and PIMCO.Source also offers a handful of actively managed ETFs, all providing exposure to fixed income. All Source ETFs are UCITS compliant and domiciled in Ireland.
PeopleThe majority of Source employees in Europe are engaged in investor-facing, marketing and finance roles. The day-to-day investment management of Source’s equity, alternative and commodity ETFs has been outsourced to Assenagon Asset Management, a third party financial asset and risk manager specialising in passive and structured investment solutions. Assenagon, who currently has 15 investment professionals working on Source ETF projects in Munich and Luxembourg, implements the processes developed by Source.
Source’s fixed-income ETFs are managed by PIMCO. Some PIMCO bond ETFs are managed from Europe, while others are managed from the US.
The investment manager for the CSOP Source FTSE China A50 UCITS ETF is CSOP Asset Management, based in Hong Kong.
Portfolio Management Process: Synthetic ETFsSource ETFs that track equity, alternative and commodity indices use the unfunded swap model. Source refers to this model as a ‘swap enhanced ETF structure’ on fund factsheets and as ‘physical with swap overlay’ on its website.

Page 44 of 60©2014 Morningstar. All rights reserved. This document includes proprietary material of Morningstar. Reproduction, transcription or other use, by any means, in whole or in part, without the prior written consent of Morningstar is prohibited. The Morningstar Investment Management group of Morningstar, Inc. includes Morningstar Associates, Ibbotson Associates, and Morningstar Investment Services, which are registered investment advisors and wholly owned subsidiaries of Morningstar, Inc. The Morningstar name and logo are registered marks of Morningstar.
3
3
3
Under this model, each ETF buys and holds a basket of securities and simultaneously enters into swap agreements with multiple counterparties that commit to pay the index performance in exchange for the performance of the fund holdings.
Swap CounterpartiesWhere possible, the ETF, via the investment manager Assenagon, deals with multiple swap counter-parties. The nine currently approved and active swap providers are: Bank of America Merrill Lynch, Goldman Sachs, J.P. Morgan, Morgan Stanley, Nomura, UBS, Citigroup, Barclays Capital and Deutsche Bank.
When selecting a swap counterparty, Source’s board of directors and credit committee consider several areas, including legal capacity, credit quality and operational capabilities. For equity, alternative and the commodity ETFs the minimum short-term credit rating for swap providers is Moody’s P-2, S&P A-2. The terms of the swap agreements are reviewed periodically by Source. There are no fixed renegotiation timelines.
Substitute BasketSource only accepts equity within the substitute basket (T-Bills or cash in the case of the Source commodity ETF).
The eligible securities are subject to pre- and post-trade screening. Equities must be listed on a market deemed acceptable by Source and each individual basket must comply with liquidity and UCITS diversification requirements. The target correlation of the basket with the index is 80%.
Assenagon does not engage in securities lending with the constituents of the substitute basket.
How is Counterparty Risk Managed?For Equity ETFs, the investment managers at Assenagon reset swaps under several different circumstances; when the end-of-day exposure to a single counterparty rises above 0.20% of the fund’s Net Asset Value (NAV) and €100,000; or when the mark-to-market value of the swap notional is greater than 4.5% (and the previous two conditions have not been met, for example due to a small fund size); or in the case of a redemption or creation; or monthly, irrespective of value.
For single broad-basket commodity ETFs, managers reset swaps weekly. Between resets, should counterparty exceeds the threshold of $100,000 at the end of a given day, the exposure will be fully collateralised with cash, US T-bills , UK Gilts or German Bunds.
Should it become necessary to reduce or eliminate exposure to a specific counterparty, their swap notional would be expected to be taken over by another swap provider. It should be noted that for

Page 45 of 60©2014 Morningstar. All rights reserved. This document includes proprietary material of Morningstar. Reproduction, transcription or other use, by any means, in whole or in part, without the prior written consent of Morningstar is prohibited. The Morningstar Investment Management group of Morningstar, Inc. includes Morningstar Associates, Ibbotson Associates, and Morningstar Investment Services, which are registered investment advisors and wholly owned subsidiaries of Morningstar, Inc. The Morningstar name and logo are registered marks of Morningstar.
3
3
3
ETFs that track proprietary indices, only a single swap counterparty may be available, meaning investors may bear single counterparty risk.
DisclosureThe composition of the substitute basket is disclosed on the company website and the information is updated daily. Additionally, the website discloses swap fees and graphs the daily swap mark-to-market value.
Portfolio Management Process: Physical ETFsDepending upon the fund in question, the investment manager employs full or sampled replication. Currently, only the CSOP Source FTSE China A50 UCITS ETF is fully replicated, while all the passive PIMCO fixed-income ETFs use risk factor matching, a form of sampling, to track their benchmarks. The use of derivatives is permitted for certain funds. These contracts usually take the form of OTC forwards, and are used primarily to hedge for currency and interest rate risk.
TradingAll trading for Source physical ETFs is undertaken by the appropriate external investment manager. The trading functions are covered by CSOP for the CSOP Source FTSE China A50 UCITS ETF and PIMCO for fixed-income ETFs.
Index-Related EventsPortfolio managers do not pre-emptively trade on potential index events (i.e. additions and deletions).
Cash and Coupon/Dividend ManagementCoupons and dividends are treated according to index rules. The use of derivatives for cash manage-ment purposes is not permitted on any physically-replicated funds.
Securities LendingNone of the Source ETFs are currently engaged in securities lending.
SPDR ETFsSPDR ETFs is the ETF business of US-based asset manager State Street Global Advisors (SSgA). SSgA has been offering ETFs since 1993 in the US and since 2001 in Europe.
ETF OfferingThe European SPDR range is all physically-replicated and gives exposure to the two main asset classes, equity and fixed income. At the time of writing, three-quarters of the funds are domiciled in Ireland, with the rest domiciled in France, but the group has proposed to re-domicile all those funds currently domiciled in France to Ireland.

Page 46 of 60©2014 Morningstar. All rights reserved. This document includes proprietary material of Morningstar. Reproduction, transcription or other use, by any means, in whole or in part, without the prior written consent of Morningstar is prohibited. The Morningstar Investment Management group of Morningstar, Inc. includes Morningstar Associates, Ibbotson Associates, and Morningstar Investment Services, which are registered investment advisors and wholly owned subsidiaries of Morningstar, Inc. The Morningstar name and logo are registered marks of Morningstar.
3
3
3
SSgA rebranded its European ETFs, previously known as StreetTRACKS, in 2010 to align with its global SPDR range.
All European SPDR ETFs are UCITS compliant.
PeopleSPDR ETFs are managed from a pool of 28 in-house portfolio managers who are also responsible for the management of other investment products. The equity ETFs are managed by members of the Global Equity Beta Solutions team based in London and Paris, while the fixed-income ETFs are managed by the London-based members of the Global Passive Fixed Income team.
The investment management of all SPDR ETF US equity funds are being transitioned to the portfolio management team in the US.
Portfolio Management ProcessSPDR ETFs employ full, sampled or optimised replication. When considering which methodology to use, portfolio managers take into account several factors including the size of the portfolio, liquidity of the benchmark, custody costs, tracking error tolerance, availability of data, and the maturity of the portfolio in question.
TradingAll trading is done in-house via an internal 24-hour trading desk, and only SSgA’s traders are authorised to trade. By aggregating trades from other parts of the group, SSgA can take advantage of economies of scale to minimise transactions costs. Cross-buying is undertaken for a large part of the equity funds’ trading activity. There are no broker fees charged for internal cross trades. Where internal crossing transactions are not available or permitted, transactions are executed via external crossing systems or in the open markets.
Index-Related EventsPortfolio managers may engage in some pre- or post-trading in connection with index events such as index rebalancing and corporate actions based on internal forecasts on a case-by-case basis. But in general, managers prefer to wait to execute trades until the changes have occurred so as not to incur unnecessary negative tracking if the change doesn’t materialise.
Cash and Dividend/Coupon ManagementTo remain fully invested in the equity market at all times and achieve close tracking, portfolio managers may use index futures contracts to equitise dividend receivables and other cash items while accommodating cash flows into and out of the portfolio. Futures exposure represents typically less than 5% of the portfolio’s value.

Page 47 of 60©2014 Morningstar. All rights reserved. This document includes proprietary material of Morningstar. Reproduction, transcription or other use, by any means, in whole or in part, without the prior written consent of Morningstar is prohibited. The Morningstar Investment Management group of Morningstar, Inc. includes Morningstar Associates, Ibbotson Associates, and Morningstar Investment Services, which are registered investment advisors and wholly owned subsidiaries of Morningstar, Inc. The Morningstar name and logo are registered marks of Morningstar.
3
3
3
In line with the index methodology, the cash from coupon payments is left un-invested until the end of the month at which time the portfolio managers invest across the portfolios. When the ETFs pay out dividends, securities are sold to meet those payments.
Securities LendingAll currently French-domiciled SPDR ETFs, with the exception of one (SPDR AEX Index), participate in securities lending. In the event that these funds become re-domiciled in Ireland, they will continue to participate in securities lending as before. Irish-domiciled funds currently do not engage in securities lending.
State Street Securities Finance (SSSF) group acts as the lending agent.
Acceptable collateral is limited to G10 government debt, excluding Japan, with a minimum ‘A’ rating and global equities listed on an exchange. Minimum additional margin requirements are between 2% and 5% depending on the assets being lent and the collateral type and quality. State Street does not re-lend collateral. Cash collateral is not accepted.
Lending agent SSSF offers indemnification against collateral insufficiency in the event of a borrower default, meaning SSSF will cover any shortfall between the value of the collateral and the replace-ment cost of the securities.
Gross securities lending revenue is split, with the ETF receiving 70% of the income and the lending agent receiving 30% (this 70/30 split was improved in January 2014 from 60/40 previously). The lending agent is responsible for all the operational costs associated with the practice. The cost of the borrower default indemnification is also covered out of State Street’s fee split.
The amount of securities that can be lent is capped at 70% of AUM per ETF.
All information relating to securities lending can be found on the SPDR ETFs website.
UBS ETFsUBS ETFs, founded in 2001 and domiciled in Switzerland, is a business of UBS Global Asset Management, which is part of UBS AG. UBS ETFs solely provides ETFs. All other exchange-traded products (e.g. ETNs) are sold through UBS Investment Bank.
ETF OfferingUBS ETFs’ offering is predominantly physical and covers all main asset classes.
UBS ETFs are built over four platforms, which are domiciled in Luxembourg, Ireland and Switzerland. All UBS ETFs, except those domiciled in Switzerland, are UCITS compliant.

Page 48 of 60©2014 Morningstar. All rights reserved. This document includes proprietary material of Morningstar. Reproduction, transcription or other use, by any means, in whole or in part, without the prior written consent of Morningstar is prohibited. The Morningstar Investment Management group of Morningstar, Inc. includes Morningstar Associates, Ibbotson Associates, and Morningstar Investment Services, which are registered investment advisors and wholly owned subsidiaries of Morningstar, Inc. The Morningstar name and logo are registered marks of Morningstar.
3
3
3
PeoplePortfolio management is undertaken by UBS Global Asset Management's investment management capability SB&I (Structured Beta and Indexing), who manage ETFs as well as segregated portfolios and a range of passive investment vehicles. SB&I, headed by Ian Ashment, is made up of 26 people located in London, Zurich and Sydney.
Portfolio Management Process: Physical ETFsUBS physical ETFs employ either full replication or sampling methods.
TradingTrading of the underlying constituents of UBS ETFs is done in-house. Equity and currency trades are handled by separate trading desks. Trades for UBS fixed-income ETFs are carried out by the portfolio managers.
Index-Related EventsPortfolio managers wait until index changes take place to carry out any associated trades in order to minimise tracking risk.
Cash and Dividend/Coupon ManagementRoutine cash stock dividends are re-invested according to index rules using an ‘overdraft’ facility available from the custodian, State Street Bank. Similar to a credit line, State Street Bank lends the ETF cash to reinvest any receivable dividends on the ex-date. Once the dividend is paid to the underlying stocks, the ETF returns the borrowed cash to State Street Bank. This practice helps reduce tracking error.
Securities Lending Securities lending is used only for a selection of equity ETFs, with State Street Bank acting as the lending agent. The amount of securities that can be lent by an ETF at any point in time is capped at 50% of its net asset value (NAV).
Lending operations are hedged by taking high-quality collateral (e.g. G10 government bonds and equities listed on globally-recognised indices) greater than the loan value. The level of overcollater-alisation is set at 105% for bonds and stocks. Cash is not accepted as collateral.
Both loan and collateral values are marked-to-marked daily. The lending agent provides full indemni-fication to the ETF in case of a borrower failure to return the securities.
Gross lending revenue is split as follows: 60% to the ETF, 40% to UBS/State Street Bank, with the latter covering all associated operational costs.

Page 49 of 60©2014 Morningstar. All rights reserved. This document includes proprietary material of Morningstar. Reproduction, transcription or other use, by any means, in whole or in part, without the prior written consent of Morningstar is prohibited. The Morningstar Investment Management group of Morningstar, Inc. includes Morningstar Associates, Ibbotson Associates, and Morningstar Investment Services, which are registered investment advisors and wholly owned subsidiaries of Morningstar, Inc. The Morningstar name and logo are registered marks of Morningstar.
3
3
3
UBS discloses daily on its website all key information pertaining to its securities lending programme, including current loan levels (% of NAV) per ETF, one-year rolling average, minimum and maximum on-loan values, net returns to the fund, and collateral value (% of loan).
Portfolio Management Process: Synthetic ETFsAll UBS synthetically-replicated ETFs are explicitly identified by the acronym ‘SF’ in the ETF’s name. With the exception of two, all use a model that combines an unfunded swap and a fully-funded swap. Two synthetic ETFs use the fully-funded swap model.
Under the combination model, a target 80–90% of the ETF’s assets consists of a basket of securities (‘asset portfolio’) which are selected and purchased by the portfolio manager of the ETF. The remaining roughly 10–20% of the fund’s assets is invested via a fully-funded swap. Under the unfunded swap agreement, the ETF receives the performance of the underlying index in exchange for the performance of the asset portfolio. Under the fully-funded swap agreement, the ETF transfers investor cash, via the swap counterparty, to a collateral account. In turn, the swap counterparty agrees to deliver the index performance.
Swap CounterpartyUBS ETFs uses UBS Investment Bank as its sole swap counterparty. Swap agreements are renegoti-ated annually and pricing is tested via a range of panel banks. When appropriate the portfolio manager will instruct UBS Investment Bank to source the index performance from a panel bank to ensure best execution.
Substitute Basket/CollateralThe substitute basket (or ‘asset portfolio’) is identical for all ETFs and consist of liquid stocks from OECD countries. The asset portfolio complies with UCITS diversification rules.
The securities are held in a segregated account in the name of the ETF at the ETF’s custodian bank, State Street Custodial Services (Ireland) Limited.
Only high quality collateral is accepted, including G10 government bonds and supranational debt, with a minimum AA/Aa2 rating. Collateral is held in a segregated account, with the ETF’s custodian bank, in the name of the fund (transfer of ownership).
UBS does not engage in securities lending within its synthetic ETFs.
How is Counterparty Risk Managed?Swaps are reset whenever there is a creation or redemption, or at least every three months.
Page 50 of 60©2014 Morningstar. All rights reserved. This document includes proprietary material of Morningstar. Reproduction, transcription or other use, by any means, in whole or in part, without the prior written consent of Morningstar is prohibited. The Morningstar Investment Management group of Morningstar, Inc. includes Morningstar Associates, Ibbotson Associates, and Morningstar Investment Services, which are registered investment advisors and wholly owned subsidiaries of Morningstar, Inc. The Morningstar name and logo are registered marks of Morningstar.
3
3
3
Counterparty exposure under both the fully funded swap and unfunded swap is collateralised to a target 105%, after haircuts.
The portfolio manager has absolute control over the exposure and risk within the asset portfolio and collateral. UBS uses an independent risk team to further monitor the quality of the securities held by the ETF and of those posted as collateral on a monthly basis.
In the event that the swap counterparty were to default on its obligations, a new swap counterparty would not be appointed. Instead, the ETF would be liquidated and the proceeds of the sale of the securities and collateral returned to investors.
DisclosureUBS fully discloses the composition of the asset portfolio and collateral as well as the collateralisa-tion level on a daily basis on its website. It also publishes a ‘drag level’, which is the sum of all the holding costs charged to the fund, including TER and swap cost. Drag levels are revised annually at the end of July and stay fixed for a year.
VanguardVanguard Asset Management Limited is the European asset management arm of The Vanguard Group, Inc., which was founded in the US in 1975. Vanguard has a unique mutual ownership structure, whereby it is owned by its investors. While Vanguard has been active in the US ETF market since 2001, it only launched its ETF business in Europe in 2012.
ETF Offering Vanguard’s ETF offering is exclusively physical and gives access to broad equity and fixed income market beta exposures.
All Vanguard ETFs are domiciled in Ireland and UCITS compliant.
PeopleThe Vanguard ETF and fund businesses are part of the same operation, with portfolio managers overseeing both ETFs and index funds.
Vanguard uses a global team approach to management and trading in which portfolio managers manage and trade assets locally. However, each portfolio manager is able to carry out other team members’ responsibilities. The European and Australian teams are entirely integrated with the US team, using the same processes and systems.

Page 51 of 60©2014 Morningstar. All rights reserved. This document includes proprietary material of Morningstar. Reproduction, transcription or other use, by any means, in whole or in part, without the prior written consent of Morningstar is prohibited. The Morningstar Investment Management group of Morningstar, Inc. includes Morningstar Associates, Ibbotson Associates, and Morningstar Investment Services, which are registered investment advisors and wholly owned subsidiaries of Morningstar, Inc. The Morningstar name and logo are registered marks of Morningstar.
3
3
3
Portfolio Management ProcessFor equity ETFs, portfolio managers use two techniques: full replication and optimisation. For the only Vanguard fixed-income ETF, they use stratified sampling.
TradingCross-trading is allowed though used minimally in practice. Trades are geographically carried out by portfolio managers on the basis of best execution (e.g. US securities are traded in the US, Asian securities are traded in Australia).
Vanguard ETFs also engage in cross-buying, crossing purchases against redemptions, which accounts for a majority of cash flow.
Index-Related EventsFor equity ETFs, portfolio managers analyse index events such as index rebalancing and corporate actions and, on a case-by-case basis, implement the appropriate trading strategy to implement the changes in order to limit market impact.
For fixed income funds, as indices rebalance on a monthly basis, at month-end, funds are also rebalanced on a monthly basis to account for changes in the index.
Cash and Dividend/Coupon ManagementDividends are reinvested into additional securities on the underlying stock’s ex-dividend date, in line with the fund’s index. Also, managers typically use futures contracts to reinvest dividend income until the dividend payment date, as well as to reinvest reclaimed tax. This helps reduce tracking error by allowing the ETFs to follow the index’s dividend methodology more closely. Futures positions are limited to 1% of the funds’ value.
Bond coupon payments to fixed income funds are reinvested directly in bonds in accordance with benchmark rules.
Securities Lending Vanguard ETFs currently do not engage in securities lending but this might change in the future.
If added, Vanguard would adopt consistent practices for the ETFs that exist for the index funds. Securities lending is completed on a select number of names. The stock loan program only accepts cash collateral, marked-to-market daily. Cash collateral is invested in overnight repurchases agreements only. The current securities lending revenue split is 90/10, with 90% of gross revenue returned to the fund and 10% paid to the lending agent.
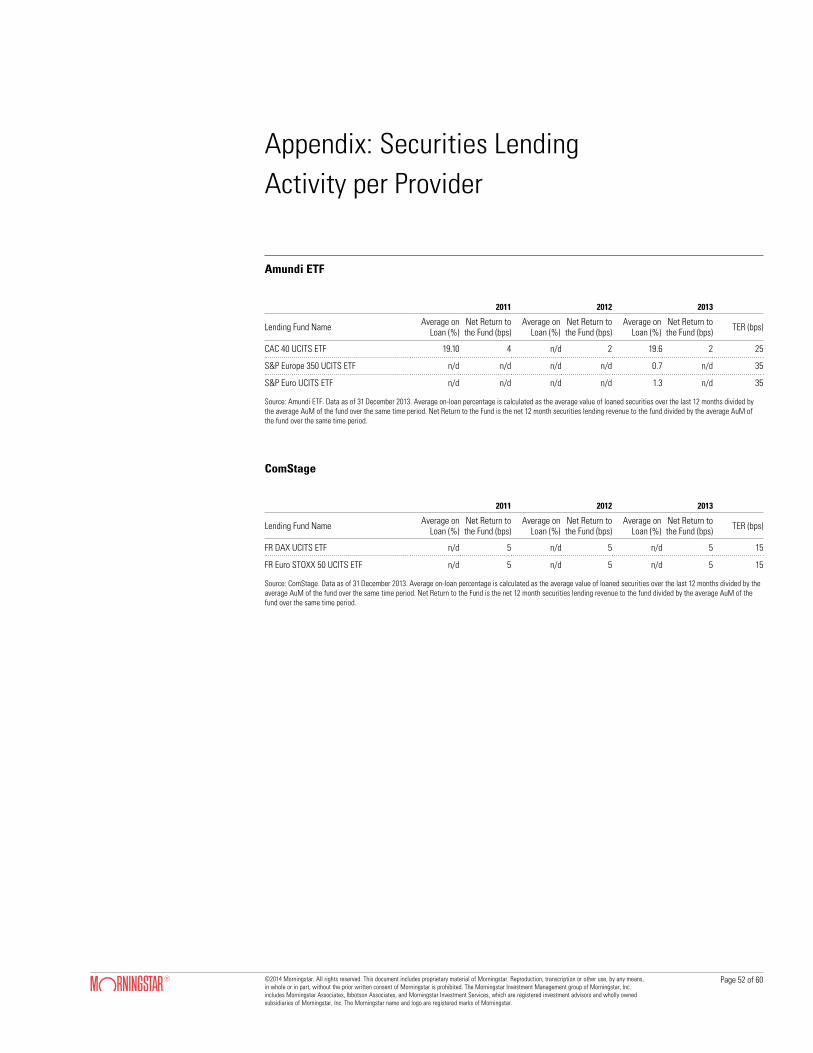
Page 52 of 60©2014 Morningstar. All rights reserved. This document includes proprietary material of Morningstar. Reproduction, transcription or other use, by any means, in whole or in part, without the prior written consent of Morningstar is prohibited. The Morningstar Investment Management group of Morningstar, Inc. includes Morningstar Associates, Ibbotson Associates, and Morningstar Investment Services, which are registered investment advisors and wholly owned subsidiaries of Morningstar, Inc. The Morningstar name and logo are registered marks of Morningstar.
Appendix: Securities Lending Activity per Provider
Amundi ETF
ComStage
2011 2012 2013
Lending Fund Name Average on Loan (%)
Net Return to the Fund (bps)
Average on Loan (%)
Net Return to the Fund (bps)
Average on Loan (%)
Net Return to the Fund (bps) TER (bps)
CAC 40 UCITS ETF 19.10 4 n/d 2 19.6 2 25
S&P Europe 350 UCITS ETF n/d n/d n/d n/d 0.7 n/d 35
S&P Euro UCITS ETF n/d n/d n/d n/d 1.3 n/d 35
Source: Amundi ETF. Data as of 31 December 2013. Average on-loan percentage is calculated as the average value of loaned securities over the last 12 months divided by the average AuM of the fund over the same time period. Net Return to the Fund is the net 12 month securities lending revenue to the fund divided by the average AuM of the fund over the same time period.
2011 2012 2013
Lending Fund Name Average on Loan (%)
Net Return to the Fund (bps)
Average on Loan (%)
Net Return to the Fund (bps)
Average on Loan (%)
Net Return to the Fund (bps) TER (bps)
FR DAX UCITS ETF n/d 5 n/d 5 n/d 5 15
FR Euro STOXX 50 UCITS ETF n/d 5 n/d 5 n/d 5 15
Source: ComStage. Data as of 31 December 2013. Average on-loan percentage is calculated as the average value of loaned securities over the last 12 months divided by the average AuM of the fund over the same time period. Net Return to the Fund is the net 12 month securities lending revenue to the fund divided by the average AuM of the fund over the same time period.
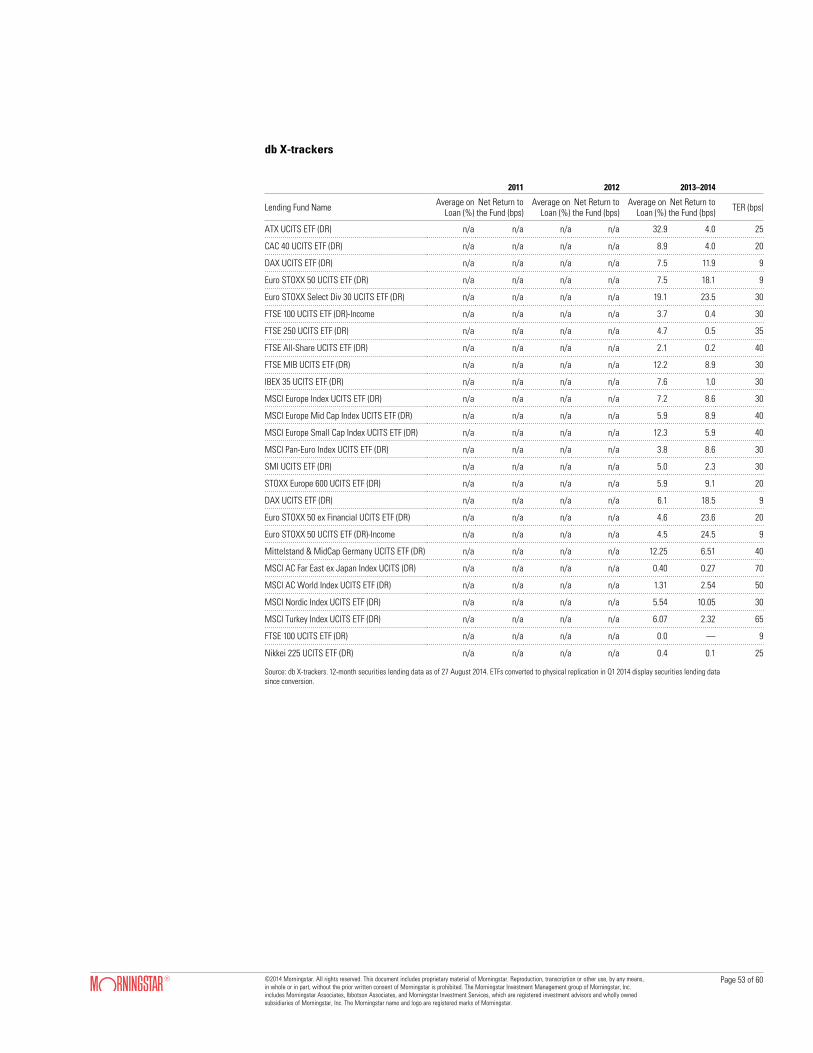
Page 53 of 60©2014 Morningstar. All rights reserved. This document includes proprietary material of Morningstar. Reproduction, transcription or other use, by any means, in whole or in part, without the prior written consent of Morningstar is prohibited. The Morningstar Investment Management group of Morningstar, Inc. includes Morningstar Associates, Ibbotson Associates, and Morningstar Investment Services, which are registered investment advisors and wholly owned subsidiaries of Morningstar, Inc. The Morningstar name and logo are registered marks of Morningstar.
3
3
3
db X-trackers
2011 2012 2013–2014
Lending Fund Name Average on Loan (%)
Net Return to the Fund (bps)
Average on Loan (%)
Net Return to the Fund (bps)
Average on Loan (%)
Net Return to the Fund (bps) TER (bps)
ATX UCITS ETF (DR) n/a n/a n/a n/a 32.9 4.0 25
CAC 40 UCITS ETF (DR) n/a n/a n/a n/a 8.9 4.0 20
DAX UCITS ETF (DR) n/a n/a n/a n/a 7.5 11.9 9
Euro STOXX 50 UCITS ETF (DR) n/a n/a n/a n/a 7.5 18.1 9
Euro STOXX Select Div 30 UCITS ETF (DR) n/a n/a n/a n/a 19.1 23.5 30
FTSE 100 UCITS ETF (DR)-Income n/a n/a n/a n/a 3.7 0.4 30
FTSE 250 UCITS ETF (DR) n/a n/a n/a n/a 4.7 0.5 35
FTSE All-Share UCITS ETF (DR) n/a n/a n/a n/a 2.1 0.2 40
FTSE MIB UCITS ETF (DR) n/a n/a n/a n/a 12.2 8.9 30
IBEX 35 UCITS ETF (DR) n/a n/a n/a n/a 7.6 1.0 30
MSCI Europe Index UCITS ETF (DR) n/a n/a n/a n/a 7.2 8.6 30
MSCI Europe Mid Cap Index UCITS ETF (DR) n/a n/a n/a n/a 5.9 8.9 40
MSCI Europe Small Cap Index UCITS ETF (DR) n/a n/a n/a n/a 12.3 5.9 40
MSCI Pan-Euro Index UCITS ETF (DR) n/a n/a n/a n/a 3.8 8.6 30
SMI UCITS ETF (DR) n/a n/a n/a n/a 5.0 2.3 30
STOXX Europe 600 UCITS ETF (DR) n/a n/a n/a n/a 5.9 9.1 20
DAX UCITS ETF (DR) n/a n/a n/a n/a 6.1 18.5 9
Euro STOXX 50 ex Financial UCITS ETF (DR) n/a n/a n/a n/a 4.6 23.6 20
Euro STOXX 50 UCITS ETF (DR)-Income n/a n/a n/a n/a 4.5 24.5 9
Mittelstand & MidCap Germany UCITS ETF (DR) n/a n/a n/a n/a 12.25 6.51 40
MSCI AC Far East ex Japan Index UCITS (DR) n/a n/a n/a n/a 0.40 0.27 70
MSCI AC World Index UCITS ETF (DR) n/a n/a n/a n/a 1.31 2.54 50
MSCI Nordic Index UCITS ETF (DR) n/a n/a n/a n/a 5.54 10.05 30
MSCI Turkey Index UCITS ETF (DR) n/a n/a n/a n/a 6.07 2.32 65
FTSE 100 UCITS ETF (DR) n/a n/a n/a n/a 0.0 — 9
Nikkei 225 UCITS ETF (DR) n/a n/a n/a n/a 0.4 0.1 25
Source: db X-trackers. 12-month securities lending data as of 27 August 2014. ETFs converted to physical replication in Q1 2014 display securities lending data since conversion.

Page 54 of 60©2014 Morningstar. All rights reserved. This document includes proprietary material of Morningstar. Reproduction, transcription or other use, by any means, in whole or in part, without the prior written consent of Morningstar is prohibited. The Morningstar Investment Management group of Morningstar, Inc. includes Morningstar Associates, Ibbotson Associates, and Morningstar Investment Services, which are registered investment advisors and wholly owned subsidiaries of Morningstar, Inc. The Morningstar name and logo are registered marks of Morningstar.
3
3
3
Deka ETFs
2011–2012 2012–2013 2013–2014
Lending Fund Name Average on Loan (%)
Net Return to the Fund
(bps)
Average on Loan (%)
Net Return to the Fund
(bps)
Average on Loan (%)
Net Return to the Fund
(bps)TER (bps)
EURO STOXX 50 Daily Short UCITS ETF 1.4 0.2 1.0 0.2 2.9 0.9 40
MSCI Emerging Markets UCITS ETF 2.9 0.6 1.9 0.2 5.8 2.5 65
DAX (ausschuettend) UCITS ETF 5.3 1.1 5.4 0.7 1.9 0.7 15
MSCI USA UCITS ETF 8.2 2.0 2.0 0.5 1.1 0.2 30
MSCI Europe UCITS ETF 8.2 2.5 3.0 0.8 4.2 1.1 30
MSCI Europe LC UCITS ETF 8.8 2.2 4.6 1.0 7.3 1.6 30
STOXX Europe 50 UCITS ETF 10.1 2.5 1.6 0.2 0.1 0.0 19
EURO STOXX Select Dividend 30 UCITS ETF 11.6 6.1 11.6 11.4 15.9 4.3 30
MSCI Japan UCITS ETF 12.6 3.3 10.6 2.3 10.8 3.0 50
DAXplus Maximum Dividend ETF 16.7 10.2 6.3 1.4 9.5 3.6 30
STOXX Europe Strong Growth 20 UCITS ETF 17.6 19.9 9.8 6.8 9.6 2.2 65
iBoxx EUR Liquid Non-Financials Diversified UCITS ETF 17.9 n/a 24.3 1.8 8.2 0.6 20
MSCI Europe MC UCITS ETF 20.0 7.6 15.8 4.8 12.7 3.7 30
EURO STOXX 50 UCITS ETF 20.6 19.5 7.1 9.8 2.0 1.2 15
STOXX Europe Strong Value 20 UCITS ETF 20.9 9.6 9.9 3.8 6.5 7.3 65
MSCI China UCITS ETF 21.3 8.3 1.2 1.5 0.3 0.6 65
iBoxx EUR Liquid Corporates Diversified UCITS ETF 25.3 2.2 24.4 1.8 11.9 0.8 20
MSCI USA LC UCITS ETF 26.3 7.2 1.0 0.2 1.7 0.3 30
MSCI Japan LC UCITS ETF 31.9 8.2 7.4 1.6 3.7 0.8 50
DAX UCITS ETF 33.7 7.5 10.0 1.5 4.0 1.0 15
MSCI Japan MC UCITS ETF 34.1 9.0 24.2 5.4 20.0 5.4 50
iBoxx EUR Liquid Ger. Covered Diversified UCITS ETF 38.6 3.4 54.6 3.9 38.4 2.7 9
MSCI USA MC UCITS ETF 39.6 11.0 2.7 0.6 3.2 0.5 30
STOXX Europe Strong Style Composite 40 UCITS ETF 43.1 22.5 10.8 7.1 4.7 2.3 65
iBoxx EUR Liquid Sovereign Diversified 10+ UCITS ETF 43.2 3.7 62.3 4.3 51.2 3.5 15
iBoxx EUR Liquid Sovereign Diversified 1–10 UCITS ETF 47.5 4.1 62.3 4.2 43.1 3.0 15
Deutsche Boerse EUROGOV France UCITS ETF 52.3 n/a 83.5 5.7 57.0 3.6 15
iBoxx EUR Liquid Sovereign Diversified 3-5 UCITS ETF 52.8 4.6 49.5 3.3 38.3 2.7 15
Deutsche Boerse EUROGOV France 1-3 UCITS ETF 56.7 n/a 89.4 6.0 68.3 4.5 15
iBoxx EUR Liquid Sovereign Diversified 1-3 UCITS ETF 57.3 5.0 66.8 4.4 56.5 3.8 15
Deutsche Boerse EUROGOV France 3-5 UCITS ETF 57.4 n/a 88.5 6.1 72.8 4.0 15
iBoxx EUR Liquid Sovereign Diversified 5-7 UCITS ETF 61.5 5.1 66.6 4.5 42.9 3.2 15
Deutsche Boerse EUROGOV France 5-10 UCITS ETF 69.9 n/a 83.6 5.7 68.7 4.4 15
iBoxx EUR Liquid Sovereign Diversified 7-10 UCITS ETF 77.0 6.7 70.9 4.9 50.4 3.5 15
DAX ex Financials 30 UCITS ETF n/a n/a n/a n/a 0.4 n/a 30
Source: Deka ETFs. Data as of 31 January. Average on-loan percentage is calculated as the average value of loaned securities over the last 12 months divided by the average AuM of the fund over the same time period. Net Return to the Fund is the net 12 month securities lending revenue to the fund divided by the average AuM of the fund over the same time period.
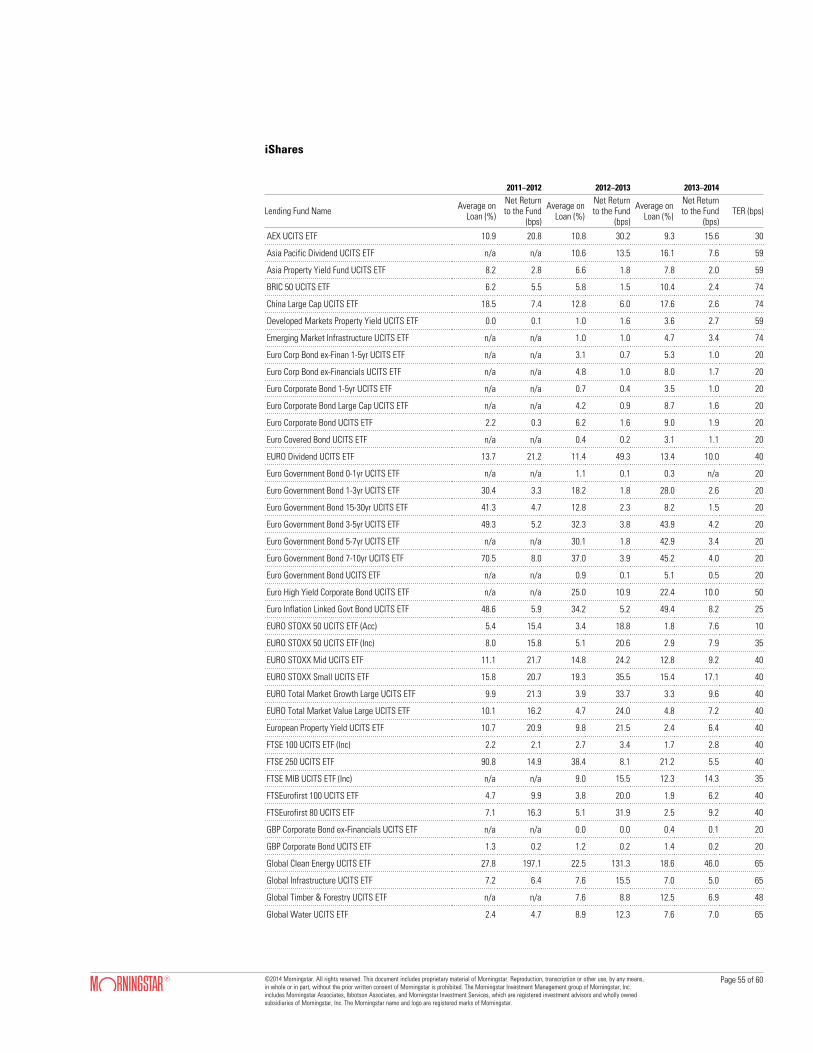
Page 55 of 60©2014 Morningstar. All rights reserved. This document includes proprietary material of Morningstar. Reproduction, transcription or other use, by any means, in whole or in part, without the prior written consent of Morningstar is prohibited. The Morningstar Investment Management group of Morningstar, Inc. includes Morningstar Associates, Ibbotson Associates, and Morningstar Investment Services, which are registered investment advisors and wholly owned subsidiaries of Morningstar, Inc. The Morningstar name and logo are registered marks of Morningstar.
3
3
3
iShares
2011–2012 2012–2013 2013–2014
Lending Fund Name Average on Loan (%)
Net Return to the Fund
(bps)
Average on Loan (%)
Net Return to the Fund
(bps)
Average on Loan (%)
Net Return to the Fund
(bps)TER (bps)
AEX UCITS ETF 10.9 20.8 10.8 30.2 9.3 15.6 30
Asia Pacific Dividend UCITS ETF n/a n/a 10.6 13.5 16.1 7.6 59
Asia Property Yield Fund UCITS ETF 8.2 2.8 6.6 1.8 7.8 2.0 59
BRIC 50 UCITS ETF 6.2 5.5 5.8 1.5 10.4 2.4 74
China Large Cap UCITS ETF 18.5 7.4 12.8 6.0 17.6 2.6 74
Developed Markets Property Yield UCITS ETF 0.0 0.1 1.0 1.6 3.6 2.7 59
Emerging Market Infrastructure UCITS ETF n/a n/a 1.0 1.0 4.7 3.4 74
Euro Corp Bond ex-Finan 1-5yr UCITS ETF n/a n/a 3.1 0.7 5.3 1.0 20
Euro Corp Bond ex-Financials UCITS ETF n/a n/a 4.8 1.0 8.0 1.7 20
Euro Corporate Bond 1-5yr UCITS ETF n/a n/a 0.7 0.4 3.5 1.0 20
Euro Corporate Bond Large Cap UCITS ETF n/a n/a 4.2 0.9 8.7 1.6 20
Euro Corporate Bond UCITS ETF 2.2 0.3 6.2 1.6 9.0 1.9 20
Euro Covered Bond UCITS ETF n/a n/a 0.4 0.2 3.1 1.1 20
EURO Dividend UCITS ETF 13.7 21.2 11.4 49.3 13.4 10.0 40
Euro Government Bond 0-1yr UCITS ETF n/a n/a 1.1 0.1 0.3 n/a 20
Euro Government Bond 1-3yr UCITS ETF 30.4 3.3 18.2 1.8 28.0 2.6 20
Euro Government Bond 15-30yr UCITS ETF 41.3 4.7 12.8 2.3 8.2 1.5 20
Euro Government Bond 3-5yr UCITS ETF 49.3 5.2 32.3 3.8 43.9 4.2 20
Euro Government Bond 5-7yr UCITS ETF n/a n/a 30.1 1.8 42.9 3.4 20
Euro Government Bond 7-10yr UCITS ETF 70.5 8.0 37.0 3.9 45.2 4.0 20
Euro Government Bond UCITS ETF n/a n/a 0.9 0.1 5.1 0.5 20
Euro High Yield Corporate Bond UCITS ETF n/a n/a 25.0 10.9 22.4 10.0 50
Euro Inflation Linked Govt Bond UCITS ETF 48.6 5.9 34.2 5.2 49.4 8.2 25
EURO STOXX 50 UCITS ETF (Acc) 5.4 15.4 3.4 18.8 1.8 7.6 10
EURO STOXX 50 UCITS ETF (Inc) 8.0 15.8 5.1 20.6 2.9 7.9 35
EURO STOXX Mid UCITS ETF 11.1 21.7 14.8 24.2 12.8 9.2 40
EURO STOXX Small UCITS ETF 15.8 20.7 19.3 35.5 15.4 17.1 40
EURO Total Market Growth Large UCITS ETF 9.9 21.3 3.9 33.7 3.3 9.6 40
EURO Total Market Value Large UCITS ETF 10.1 16.2 4.7 24.0 4.8 7.2 40
European Property Yield UCITS ETF 10.7 20.9 9.8 21.5 2.4 6.4 40
FTSE 100 UCITS ETF (Inc) 2.2 2.1 2.7 3.4 1.7 2.8 40
FTSE 250 UCITS ETF 90.8 14.9 38.4 8.1 21.2 5.5 40
FTSE MIB UCITS ETF (Inc) n/a n/a 9.0 15.5 12.3 14.3 35
FTSEurofirst 100 UCITS ETF 4.7 9.9 3.8 20.0 1.9 6.2 40
FTSEurofirst 80 UCITS ETF 7.1 16.3 5.1 31.9 2.5 9.2 40
GBP Corporate Bond ex-Financials UCITS ETF n/a n/a 0.0 0.0 0.4 0.1 20
GBP Corporate Bond UCITS ETF 1.3 0.2 1.2 0.2 1.4 0.2 20
Global Clean Energy UCITS ETF 27.8 197.1 22.5 131.3 18.6 46.0 65
Global Infrastructure UCITS ETF 7.2 6.4 7.6 15.5 7.0 5.0 65
Global Timber & Forestry UCITS ETF n/a n/a 7.6 8.8 12.5 6.9 48
Global Water UCITS ETF 2.4 4.7 8.9 12.3 7.6 7.0 65

Page 56 of 60©2014 Morningstar. All rights reserved. This document includes proprietary material of Morningstar. Reproduction, transcription or other use, by any means, in whole or in part, without the prior written consent of Morningstar is prohibited. The Morningstar Investment Management group of Morningstar, Inc. includes Morningstar Associates, Ibbotson Associates, and Morningstar Investment Services, which are registered investment advisors and wholly owned subsidiaries of Morningstar, Inc. The Morningstar name and logo are registered marks of Morningstar.
3
3
3
2011–2012 2012–2013 2013–2014
Lending Fund Name Average on Loan (%)
Net Return to the Fund
(bps)
Average on Loan (%)
Net Return to the Fund
(bps)
Average on Loan (%)
Net Return to the Fund
(bps)TER (bps)
JP Morgan $ Emerging Mkts Bond UCITS ETF n/a n/a 5.4 0.8 8.3 1.5 45
MSCI AC Far East ex-Japan UCITS ETF 9.0 5.6 8.9 7.0 9.7 5.4 74
MSCI AC FE ex-Japan Small Cap UCITS ETF n/a n/a 5.0 15.5 19.5 35.9 74
MSCI Australia UCITS ETF n/a n/a 0.0 0.0 0.6 0.2 50
MSCI Canada UCITS ETF n/a n/a 22.3 21.8 39.9 29.1 48
MSCI Eastern Europe Capped UCITS ETF 6.5 14.6 8.7 6.0 6.6 2.9 74
MSCI Emerging Markets SmallCap UCITS ETF n/a n/a 5.4 16.0 10.4 20.7 74
MSCI Emerging Markets UCITS ETF (Acc) n/a n/a 0.8 1.5 1.9 2.0 68
MSCI Emerging Markets UCITS ETF (Inc) 5.8 6.0 6.0 5.5 6.4 3.9 75
MSCI Europe ex-UK UCITS ETF 7.7 18.6 7.5 14.8 6.2 7.5 40
MSCI Europe UCITS ETF (Acc) n/a n/a 1.1 4.3 1.6 3.4 33
MSCI Europe UCITS ETF (Inc) 6.3 12.0 6.5 11.5 4.9 6.3 35
MSCI Japan EUR Hedged UCITS ETF n/a n/a 0.5 1.2 1.7 2.0 64
MSCI Japan SmallCap UCITS ETF (Inc) 64.4 19.8 49.7 14.4 39.7 11.4 58
MSCI Japan UCITS ETF (Acc) n/a n/a 0.1 0.5 0.9 1.7 48
MSCI Japan UCITS ETF (Inc) 4.9 1.8 7.5 3.5 13.6 4.1 59
MSCI Korea UCITS ETF (Inc) 4.7 5.4 5.8 8.9 6.1 5.8 74
MSCI North America UCITS ETF 3.8 2.9 4.1 3.1 4.1 2.7 40
MSCI Turkey UCITS ETF 25.2 19.2 14.5 17.5 24.1 11.4 74
MSCI World GBP Hedged UCITS ETF n/a n/a 0.0 0.1 0.6 1.3 55
MSCI World UCITS ETF (Inc) 4.5 5.1 4.9 4.8 5.4 3.7 50
S&P 500 UCITS ETF (Inc) 4.3 0.8 3.2 0.9 3.4 0.4 40
S&P SmallCap 600 UCITS ETF n/a n/a 0.1 1.1 4.0 3.8 40
STOXX Europe 50 UCITS ETF 6.3 12.8 5.2 12.3 3.4 6.7 35
UK Dividend UCITS ETF 4.7 1.6 4.7 1.4 6.7 1.0 40
UK Gilt UCITS ETF 2.7 0.3 7.5 1.2 24.2 3.1 20
UK Gilts 0-5yr UCITS ETF n/a n/a 1.4 0.1 25.3 1.6 20
UK Property UCITS ETF 0.0 0.0 1.8 0.5 2.7 0.7 40
$ Corporate Bond UCITS ETF 0.3 0.1 0.4 0.0 1.1 0.1 20
$ TIPS UCITS ETF n/a n/a 4.4 0.5 39.3 6.0 25
$ Treasury Bond 1-3yr UCITS ETF n/a n/a 14.6 2.0 45.9 6.4 20
$ Treasury Bond 7-10yr UCITS ETF n/a n/a 16.0 3.9 48.5 10.1 20
£ Index-Linked Gilts UCITS ETF 0.1 0.0 21.8 2.8 27.4 3.1 25
ATX (DE) 5.7 3.1 6.5 2.5 2.4 1.7 32
DAX (DE) 0.3 0.3 0.1 0.0 0.5 0.6 16
DivDAX (DE) 0.3 0.0 0.7 0.1 0.4 0.5 31
DJ Eurozone Sustainability Screened (DE) 0.2 0.0 0.7 0.6 0.2 0.3 41
eb.rexx Government Germany 10.5+ (DE) 24.8 1.7 n/a n/a n/a n/a 16
eb.rexx Government Germany 1.5-2.5 (DE) 15.0 0.7 n/a n/a n/a n/a 16
eb.rexx Government Germany 2.5-5.5 (DE) 27.4 1.6 n/a n/a n/a n/a 16
eb.rexx Government Germany 5.5-10.5 (DE) 29.6 1.8 n/a n/a n/a n/a 16
eb.rexx Government Germany (DE) 27.0 1.5 n/a n/a n/a n/a 16
eb.rexx Jumbo Pfandbriefe (DE) 5.2 0.4 n/a n/a n/a n/a 10
eb.rexx Money Market (DE) 31.0 2.0 n/a n/a n/a n/a 13

Page 57 of 60©2014 Morningstar. All rights reserved. This document includes proprietary material of Morningstar. Reproduction, transcription or other use, by any means, in whole or in part, without the prior written consent of Morningstar is prohibited. The Morningstar Investment Management group of Morningstar, Inc. includes Morningstar Associates, Ibbotson Associates, and Morningstar Investment Services, which are registered investment advisors and wholly owned subsidiaries of Morningstar, Inc. The Morningstar name and logo are registered marks of Morningstar.
3
3
3
Lyxor
2011–2012 2012–2013 2013–2014
Lending Fund Name Average on Loan (%)
Net Return to the Fund
(bps)
Average on Loan (%)
Net Return to the Fund
(bps)
Average on Loan (%)
Net Return to the Fund
(bps)TER (bps)
EURO STOXX 50 (DE) 0.4 0.0 0.6 0.4 0.5 0.6 16
EURO STOXX Banks (DE) 1.2 3.7 1.1 5.8 0.1 0.0 51
EURO STOXX (DE) 0.5 1.3 0.8 1.4 1.9 1.9 20
EURO STOXX Select Dividend 30 (DE) 1.4 1.9 1.2 4.3 7.0 2.4 31
Markit iBoxx Euro Liq Sov Cap 10.5+ (DE) 3.8 0.6 n/a n/a n/a n/a 16
Markit iBoxx Euro Liq Sov Cap 1.5-10.5 (DE) 7.4 0.5 n/a n/a n/a n/a 15
Markit iBoxx Euro Liq Sov Cap 1.5-2.5 (DE) 6.6 0.5 n/a n/a n/a n/a 16
Markit iBoxx Euro Liq Sov Cap 2.5-5.5 (DE) 7.1 0.5 n/a n/a n/a n/a 16
Markit iBoxx Euro Liq Sov Cap 5.5-10.5 (DE) 7.1 0.5 n/a n/a n/a n/a 16
MDAX (DE) 3.2 7.1 1.9 3.7 1.5 1.5 51
Nikkei 225 (DE) 0.0 0.0 0.0 0.0 0.1 0.1 51
STOXX EU Enlarged 15 (DE) 1.1 0.2 n/a n/a 1.8 0.6 52
STOXX Europe 50 (DE) 0.2 0.0 0.3 0.0 0.4 0.2 52
STOXX Europe 600 Banks (DE) 0.4 1.7 0.8 3.0 1.0 0.7 46
STOXX Europe 600 (DE) 0.3 0.8 0.4 0.7 0.8 0.5 20
STOXX Europe 600 Health Care (DE) 0.0 0.0 n/a n/a 0.0 0.1 46
STOXX Europe 600 Oil & Gas (DE) 0.1 0.0 n/a n/a 0.4 0.2 46
STOXX Europe 600 Real Estate (DE) 0.7 0.1 n/a n/a 0.5 0.1 47
STOXX Europe 600 Utilities (DE) 0.2 0.0 n/a n/a 1.1 0.4 46
STOXX Europe Mid 200 (DE) 0.9 1.7 1.0 2.1 1.8 0.7 20
STOXX Europe Select Dividend 30 (DE) 0.4 0.0 0.6 0.1 7.7 1.9 31
STOXX Europe Small 200 (DE) 1.9 6.6 1.6 4.5 3.0 4.0 20
TecDAX (DE) 6.2 52.3 4.8 13.7 1.9 1.9 51
Source: iShares. Data as of 30 April. Average on-loan percentage is calculated as the average value of loaned securities over the last 12 months divided by the average AuM of the fund over the same time period. Net Return to the Fund is the net 12 month securities lending revenue to the fund divided by the average AuM of the fund over the same time period.
2011 2012 2013–2014
Lending Fund Name Average on Loan (%)
Net Return to the Fund (bps)
Average on Loan (%)
Net Return to the Fund (bps)
Average on Loan (%)
Net Return to the Fund (bps) TER (bps)
UCITS ETF Euro Stoxx 300 n/a n/a n/a n/a 18.6 5.0 30
UCITS ETF Euro Stoxx 50 n/a n/a n/a n/a 8.4 3.5 20
UCITS ETF MSCI Europe n/a n/a n/a n/a 8.0 3.5 30
Source: Lyxor. Data as of 30 June. Average on-loan percentage is calculated as the average value of loaned securities over the last 12 months divided by the average AuM of the fund over the same time period. Net Return to the Fund is the net 12 month securities lending revenue to the fund divided by the average AuM of the fund over the same time period.
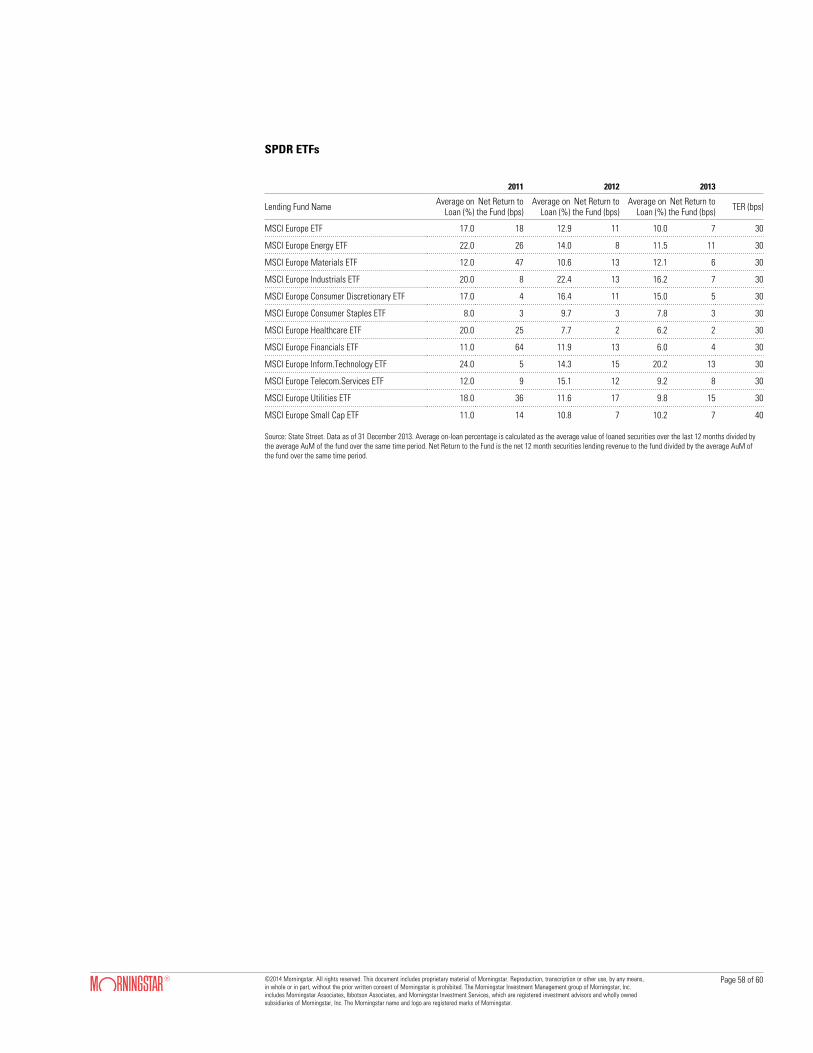
Page 58 of 60©2014 Morningstar. All rights reserved. This document includes proprietary material of Morningstar. Reproduction, transcription or other use, by any means, in whole or in part, without the prior written consent of Morningstar is prohibited. The Morningstar Investment Management group of Morningstar, Inc. includes Morningstar Associates, Ibbotson Associates, and Morningstar Investment Services, which are registered investment advisors and wholly owned subsidiaries of Morningstar, Inc. The Morningstar name and logo are registered marks of Morningstar.
3
3
3
SPDR ETFs
2011 2012 2013
Lending Fund Name Average on Loan (%)
Net Return to the Fund (bps)
Average on Loan (%)
Net Return to the Fund (bps)
Average on Loan (%)
Net Return to the Fund (bps) TER (bps)
MSCI Europe ETF 17.0 18 12.9 11 10.0 7 30
MSCI Europe Energy ETF 22.0 26 14.0 8 11.5 11 30
MSCI Europe Materials ETF 12.0 47 10.6 13 12.1 6 30
MSCI Europe Industrials ETF 20.0 8 22.4 13 16.2 7 30
MSCI Europe Consumer Discretionary ETF 17.0 4 16.4 11 15.0 5 30
MSCI Europe Consumer Staples ETF 8.0 3 9.7 3 7.8 3 30
MSCI Europe Healthcare ETF 20.0 25 7.7 2 6.2 2 30
MSCI Europe Financials ETF 11.0 64 11.9 13 6.0 4 30
MSCI Europe Inform.Technology ETF 24.0 5 14.3 15 20.2 13 30
MSCI Europe Telecom.Services ETF 12.0 9 15.1 12 9.2 8 30
MSCI Europe Utilities ETF 18.0 36 11.6 17 9.8 15 30
MSCI Europe Small Cap ETF 11.0 14 10.8 7 10.2 7 40
Source: State Street. Data as of 31 December 2013. Average on-loan percentage is calculated as the average value of loaned securities over the last 12 months divided by the average AuM of the fund over the same time period. Net Return to the Fund is the net 12 month securities lending revenue to the fund divided by the average AuM of the fund over the same time period.

Page 59 of 60©2014 Morningstar. All rights reserved. This document includes proprietary material of Morningstar. Reproduction, transcription or other use, by any means, in whole or in part, without the prior written consent of Morningstar is prohibited. The Morningstar Investment Management group of Morningstar, Inc. includes Morningstar Associates, Ibbotson Associates, and Morningstar Investment Services, which are registered investment advisors and wholly owned subsidiaries of Morningstar, Inc. The Morningstar name and logo are registered marks of Morningstar.
3
3
3
UBS ETFs
2011–2012 2012–2013 2013–2014
Lending Fund Name Average on Loan (%)
Net Return to the Fund
(bps)
Average on Loan (%)
Net Return to the Fund
(bps)
Average on Loan (%)
Net Return to the Fund
(bps)TER (bps)
MSCI Canada 100% hedged to CHF UCITS ETF n/a n/a n/a n/a 14 10.9 43
MSCI Canada 100% hedged to EUR UCITS ETF n/a n/a n/a n/a 15 12.6 43
MSCI Canada 100% hedged to GBP UCITS ETF n/a n/a n/a n/a 15 12.8 43
MSCI Canada 100% hedged to USD UCITS ETF n/a n/a n/a n/a 13 11.0 43
MSCI EMU 100% hedged to CHF UCITS ETF n/a n/a n/a n/a 5 10.8 33
MSCI EMU 100% hedged to GBP UCITS ETF n/a n/a n/a n/a 6 13.3 33
MSCI EMU 100% hedged to USD UCITS ETF n/a n/a n/a n/a 5 11.3 33
MSCI Japan 100% hedged to CHF UCITS ETF n/a n/a n/a n/a 3 2.0 45
MSCI Japan 100% hedged to EUR UCITS ETF n/a n/a n/a n/a 3 1.9 45
MSCI Japan 100% hedged to GBP UCITS ETF n/a n/a n/a n/a 3 1.8 45
MSCI Japan 100% hedged to USD UCITS ETF n/a n/a n/a n/a 3 1.9 45
MSCI Switzerland 20/35 100% hedged to EUR UCITS ETF n/a n/a n/a n/a 4 3.5 30
MSCI Switzerland 20/35 100% hedged to GBP UCITS ETF n/a n/a n/a n/a 1 2.4 30
MSCI Switzerland 20/35 100% hedged to USD UCITS ETF n/a n/a n/a n/a 2 3.5 30
MSCI Switzerland 20/35 UCITS ETF n/a n/a n/a n/a 4 6.5 30
MSCI United Kingdom 100% hedged to CHF UCITS ETF n/a n/a n/a n/a 0 0.1 30
MSCI United Kingdom 100% hedged to EUR UCITS ETF n/a n/a n/a n/a 0 0.1 30
MSCI United Kingdom 100% hedged to USD UCITS ETF n/a n/a n/a n/a 0 0.1 30
MSCI United Kingdom UCITS ETF n/d n/d n/d n/d 0 0.1 20
EMU SMALL CAP 2 0.8 n/d n/d 4 2.9 33
EURO STOXX 50 15 52 n/d n/d 14 5.1 15
FTSE 100 6 21 n/d n/d 8 0.6 20
MSCI ASIA EX JAPAN INFRASTRUCTURE n/d n/d n/d n/d 12 1.1 48
MSCI CANADA 23 47 n/d n/d 36 29.2 33
MSCI EMERGING MARKETS 17 29 n/d n/d 2 1.0 30
MSCI EMU 14 50 n/d n/d 22 8.6 23
MSCI EMU VALUE 14 42 n/d n/d 12 7.4 25
MSCI EUROPE 8 24 n/d n/d 12 5.6 20
MSCI EUROPE & MIDDLE EAST SOCIALLY RESPONSIBLE 6 14 n/d n/d 11 3.7 28
MSCI EUROPE INFRASTRUCTURE 1 12 n/d n/d 6 4.4 48
MSCI JAPAN 29 82 n/d n/d 7 2.7 35
MSCI JAPAN INFRASTRUCTURE 6 21 n/d n/d 7 1.4 48
MSCI NORTH AMERICA SOCIALLY RESPONSIBLE 6 18 n/d n/d 6 3.5 33
MSCI PACIFIC EX JAPAN 30 58 n/d n/d 6 0.9 30
MSCI PACIFIC SOCIALLY RESPONSIBLE 26 62 n/d n/d 19 2.1 53
MSCI TURKEY 2 13 n/d n/d 0 0.2 43
MSCI USA 4 13 n/d n/d 3 0.5 20
MSCI WORLD 14 22 n/d n/d 8 3.3 30
MSCI WORLD SOCIALLY RESPONSIBLE 11 22 n/d n/d 10 3.3 38
STOXX GLOBAL RARE EARTH 13 33 n/d n/d 20 96.7 45
Source: UBS. Data as of 31 March 2012 and 30 June 2014. Average on-loan percentage is calculated as the average value of loaned securities over the last 12 months divided by the average AuM of the fund over the same time period. Net Return to the Fund is the net 12 month securities lending revenue to the fund divided by the average AuM of the fund over the same time period.

Contact
Hortense Bioy, CFA Director of European Passive Strategies [email protected]
Jose Garcia-Zarate
Senior Fund Analyst, European Passive Strategies [email protected]
Caroline Gutman
Fund Analyst, European Passive Strategies [email protected]
Kenneth Lamont, CAIA
Fund Analyst, European Passive Strategies [email protected]