a guide to re-grading energy performance labels · a guide to re-grading energy performance labels...
TRANSCRIPT

A Guide to Re-grading Energy Performance Labels A report for the Vietnamese Government’s Energy Efficiency Program Produced by Australian Government Department of Resources, Energy and Tourism May 2013

Contents 1 Introduction .................................................................................................................. 1
2 Label Re-grading: Case studies from overseas ............................................................... 2 2.1 Australia ......................................................................................................................................... 2 2.2 European Union ............................................................................................................................. 8 2.3 USA ............................................................................................................................................... 11 2.4 Conclusions from overseas examples .......................................................................................... 12
3 International and Regional Alignment ......................................................................... 13 3.1 Opportunities for regional alignment .......................................................................................... 14 3.2 Global best practice ..................................................................................................................... 14
4 Transitional Issues ....................................................................................................... 14 4.1 Advanced notice .......................................................................................................................... 14 4.2 Replacement of old labels ............................................................................................................ 14 4.3 Ability to identify old and new labels .......................................................................................... 15 4.4 Grandfathering ............................................................................................................................. 16
5 Related considerations ................................................................................................ 16 5.1 Monitoring product performance ................................................................................................ 16 5.2 Relationship with MEPS and other energy efficiency policy measures ....................................... 17 5.3 The spacing of labelling bands ..................................................................................................... 17 5.4 Verification Tolerances ................................................................................................................ 18 5.5 Product categories ....................................................................................................................... 18
6 Recommendations ...................................................................................................... 19
7 References .................................................................................................................. 20
8 Bibliography ................................................................................................................ 21

Figures Figure 1: Distribution of Australian comparative labels for refrigerators 2007 ...................................... 2
Figure 2: Distribution of Australian comparative labels for refrigerators after re-grading .................... 3
Figure 3: Rating of single-phased non-ducted split system air conditioners (previous 2000 algorithm) – cooling EER ................................................................................................................................... 4
Figure 4: Rating of single-phase non-ducted split system air conditioners (previous 2000 algorithm) – heating COP .................................................................................................................................... 4
Figure 5: Rating of single-phase non-ducted split system air conditioners (new 2010 algorithm) – cooling EER ..................................................................................................................................... 5
Figure 6: Rating of single-phase non-ducted split system air conditioners (new 2010 algorithm) – heating COP .................................................................................................................................... 5
Figure 7: Distribution of certified gas water heater models by star rating, 1996-2002 ......................... 6
Figure 8: Distribution of certified gas ducted heater models by star rating, 1996-2002 ........................ 7
Figure 9: Distribution of cold appliances for sale in the EU, by energy-efficiency index ........................ 8
Figure 10: Sales-weighted distribution of energy label class for refrigerators in 1997 .......................... 9
Figure 11: Summary of distribution of registered models when re-grading considered, Australia ...... 10
Figure 12: Indicative label showing transitional wording ..................................................................... 15
Figure 13: Trends in key performance characteristics, refrigerators, 1993-2009, Australia ................ 17
Tables Table 1: Transitional arrangements for air conditioners, Australia, 2009 .............................................. 6
Table 2: Attributes of bands at the time of re-grading ........................................................................... 7
Table 3: Refrigeration sales-weighted distribution of energy label class in the EU by Member State, 1997 ................................................................................................................................................ 9

1 Introduction This paper has been produced by the Australian Government Department of Resources, Energy and Tourism as part of its support for the Vietnamese Government’s energy efficiency program.
In many economies, energy efficiency programs are at the heart of national policies designed to reduce energy consumption, tackle climate change and improve energy security. In particular, standards and labelling (S&L) programs for appliances and equipment have been proven to deliver the greatest energy savings at lowest cost.
Energy efficiency labels are designed to provide consumers with accurate and easily accessible information on the energy performance of individual product models. There are two generic types of energy efficiency labels, as follows:
Comparative labels: these provide a ranking of products, usually in the form of a limited number of stars or letters, which enables consumers to compare the energy performance of equivalent models.
Endorsement labels: these highlight the best performing models within a product category.
While these types of labels perform slightly different functions they both have the following impacts:
They help consumers to make informed choices and encourage selection of the most efficient and suitable products available.
They encourage manufacturers to improve the energy performance of their models by making energy efficiency transparent to the market place and by providing clear targets or thresholds to aim for in improving energy efficiency.
They encourage distributors and retailers to stock and display efficient products by offering a selling point for energy-saving models.
They can provide a basis for a wide range of other stakeholders—including other government programs; consumer or environmental groups; electric utilities; and other local, state, or regional organisations—to implement outreach and education, utility demand-side management (DSM), and tax rebates or other programs that provide incentives or otherwise encourage purchase of high-efficiency products.1
As more efficient models enter the market, the number of models achieving the highest rankings increases, or a larger proportion of models on the market meet the criteria for an endorsement label. It is therefore important to adjust the ranking and rating criteria periodically so that labels can continue to promote the most energy efficient models in the market.
The key issues relating to the periodic adjustment of labelling criteria, or re-grading, are the subject of this paper and include:
The potential for significant improvement in energy efficiency.
The opportunities for greater impact through international and regional alignment.
The development of indicators that can be used to show that energy efficiency labelling criteria should be reviewed.
Considerations in planning the re-grading of an energy efficiency label.
The use of transitional arrangements when implementing re-grading.
In considering these topics, the next section briefly outlines the experiences and lessons learnt by economies outside Vietnam during the process of re-grading energy efficiency labels for a range of products.
1 Energy Efficiency Labels and Standards: A Guidebook for Appliances Equipment and Lighting, 2nd Edition, CLASP, 2005. http://www.clasponline.org/ResourcesTools/Resources/StandardsLabelsGuidebook#SLGuidebookLinks
VEESL: A GUIDE TO RE-GRADING ENERGY PERFORMANCE LABELS 1

2 Label Re-grading: Case studies from overseas This section briefly describes experience with the re-grading of energy efficiency labels in Australia, Europe, and the USA.
2.1 Australia The Australian S&L program for appliances and equipment has been in operation since 1986, and now covers in excess of 20 product categories. Over this period, there have been substantial improvements in the energy efficiency of regulated products, and MEPS levels and labelling criteria have been required to keep pace with these advancements. The development of new technologies and the emergence of new product types have also necessitated adjustment of regulations periodically.
Australian laws require all regulated products to be registered before they can be sold on the Australian market, providing details on claimed product performance. This system enables authorities to track trends in product performance continuously, which is essential to predict when more stringent regulations will be required.
2.1.1 Refrigerators The energy label was introduced for refrigerators and freezers in 1986, and revised in 2000. New MEPS levels introduced in 2005 greatly reduced the number of models in the lower star bands and caused a bunching within the middle labelling bands, as shown in Figure 1 (E3, 2007). This bunching necessitated a re-grading of the energy efficiency label. It should be noted that there is a close correlation between the number of model registrations and sales volume in each band.
Figure 1: Distribution of Australian comparative labels for refrigerators 20072
Figure 2 shows the distribution of models after re-grading, which indicates a more evenly matched distribution of products amongst the 1 and 2 star bands, and an incentive for technological improvement in the higher star bands.
2 http://www.energyrating.gov.au/wp-content/uploads/Energy_Rating_Documents/Library/Refrigeration/Commercial_and_Domestic_Refrigeration/200709-rf-algorithm-revised.pdf
VEESL: A GUIDE TO RE-GRADING ENERGY PERFORMANCE LABELS 2

Figure 2: Distribution of Australian comparative labels for refrigerators after re-grading
Transitional Arrangements
The key dates announced for the transitional process were as follows:
The date of implementation of the new label was October 2009.
From October 2008, manufacturers were allowed to register models for the new energy label provided such products also had agreed transition wording displayed on the label.
From April 2009 products could be manufactured or imported with the new energy label affixed with no transition wording.
All products imported or manufactured after October 2009 had to have the new energy label affixed. Transition wording was not allowed to be affixed to products manufactured or imported after October 2009.
As with all transitions for energy labelling and MEPS, so called standard “grandfathering” provisions applied to all refrigerators and freezers across the transition period. This means that registrations to the previous energy label or where test reports have been used to previous versions of the test method were grandfathered on 30 September 2009. In other words, products which were imported or manufactured with an approved registration prior to that date could be sold indefinitely.
It was also recommended that suppliers should print the new energy label (or a stylised version) on the product packaging or change the packaging colour to indicate that the product inside had a new energy label attached, in order to assist retailers to clear older stock.
The Equipment Energy Efficiency Program (E3), the Government body responsible for appliance energy labelling in Australia, communicated with retailers to try to ensure a smooth transition so that all products on display carried a new label by October 2009. Both the old and new star ratings were available on the energy rating website site for several years.
2.1.2 Air conditioners Following a previous adjustment to energy labelling for air conditioners in 2000, the Government indicated in 2004 its desire to review the energy labelling algorithm for air conditioners leading up to a revision of MEPS in 2006/7. In response to a request from industry, this labelling review took place in 2008/9 for measures to be introduced in April 2010.
The review considered new MEPS levels, a new design for air conditioner comparison labels as well as re-grading of the performance levels for the comparison label.
VEESL: A GUIDE TO RE-GRADING ENERGY PERFORMANCE LABELS 3

Following a detailed review of the air conditioner market in 2008-2009, an E3 (2009) report noted:
“The continuing impact of the energy rating label as a driver of increasing energy efficiency for the air conditioner market depends on several factors, including:
A reasonable spread of star ratings on the market for all classes and capacities, so buyers are motivated to seek out more efficient options where available. With the rapid increase in average efficiency in 2004 and 2005 due to MEPS, most lower star rating products have been eliminated. The most common rating is now 4 stars. As consumers generally consider this a satisfactory rating, there is less motivation to seek out more efficient products. Paradoxically, the elimination of products with a lower star rating has also narrowed the range of technical efficiency for some product groups in the short term;
Sufficient space at the top of the energy rating scale so that suppliers can exploit the commercial value of introducing more efficient products (allowing them to strive for higher star ratings which will remain available for a long period);
A good match between energy consumption under test conditions and energy consumption under use conditions (at least in a comparative sense, if not absolutely in all cases); and
That both suppliers and consumers have continued confidence in the integrity of the program.”
As shown in Figure 3 and Figure 4, changes in MEPS levels over the years without corresponding adjustment to the labelling algorithms had caused the lower rating bands to become unused.
Figure 3: Rating of single-phased non-ducted split system air conditioners (previous 2000 algorithm) – cooling EER
Figure 4: Rating of single-phase non-ducted split system air conditioners (previous 2000 algorithm) – heating COP
The new energy label was trialled in focus groups and the final design details agreed with industry and other standards committee members. The new label, which is still in use today:
VEESL: A GUIDE TO RE-GRADING ENERGY PERFORMANCE LABELS 4

Is comprised of 1 to 6 stars, in half-star increments.
Includes a further 7 to 10 stars available for super-efficient models that have an SRI greater than 7. This will reduce the need for further re-grading of the label.
Includes criteria for reverse cycle models.
Is visibly different to the previous energy label.
The distributions of air conditioner performance under the 2010 label criteria are shown in Figure 5 and Figure 6. The new labelling algorithm was designed to achieve the following:
Provide the basis for good differentiation across different types, size ranges and within types.
All products to achieve a star rating of 1 star or better, except for those few products that use part load to achieve MEPS.
Most products to lie in the range 1 - 3 stars under the new system, but there are a significant number of models for both cooling and heating that already achieve 3 stars or above.
This algorithm to provide a sound basis for the development of future high efficiency criteria such as Energy Star.
Figure 5: Rating of single-phase non-ducted split system air conditioners (new 2010 algorithm) – cooling EER
Figure 6: Rating of single-phase non-ducted split system air conditioners (new 2010 algorithm) – heating COP
VEESL: A GUIDE TO RE-GRADING ENERGY PERFORMANCE LABELS 5

Transitional arrangements
Transitional arrangements were included within the published Australian Standard and in a Fact Sheet distributed to industry from October 2009 (E3, 2009b). The key deadlines are shown in Table 1.
Table 1: Transitional arrangements for air conditioners, Australia, 2009
Date Event
October 2009 Publication of new Australian standard AS/NZS 3823.2:2009
December 2009 All new registrations required to be according to new standard
April 2010 All products manufactured or imported must be registered using the new standard
Existing products in stock that no longer meets the requirements of a new standard are “grandfathered” and can legally be sold in the future without the need to have new labels attached. But any new products manufactured or imported after the specified date must meet the requirements of the new standard and they must hold a valid registration with regulators to confirm these requirements. The standard includes a requirement for determining the date of manufacture for each model registered which assists in enforcement of this requirement.
In addition, E3 budgeted up to $500,000 for retailer information and other targeted publicity for this ‘display transition’ program, the objective of which is that no labels should remain on showroom display after 1 April 2010.
2.1.3 Gas appliances Although gas appliances are not regulated in the same way as electrical products in Australia, they provide an interesting example on how to re-grade a performance label. Analyses in 2002-3 on the Australian market for gas water heaters and space heating appliances indicated that re-grading of labels was warranted (MEA, 2002; SEAV, 2003).
For waters heaters, over 60% of all models and 82% of instantaneous models achieved a rating of 4 stars or more in 2002. The distribution of labels across the total water heater market is shown in Figure 7, where High = 4 stars or more; Medium = 2 or 3 stars; and Low = 1 star.
Figure 7: Distribution of certified gas water heater models by star rating, 1996-2002
Figure 8, shows the equivalent data for gas ducted heater models, and also indicates that there is bunching into the medium and higher star rating bands.
VEESL: A GUIDE TO RE-GRADING ENERGY PERFORMANCE LABELS 6

Figure 8: Distribution of certified gas ducted heater models by star rating, 1996-2002
In considering the new distribution of labelling bands, the report identifies the ‘ideal’ attributes of each band at the point of re-grading, as shown in Table 2.
Table 2: Attributes of bands at the time of re-grading
VEESL: A GUIDE TO RE-GRADING ENERGY PERFORMANCE LABELS 7

2.1.4 When to re-grade Figure 9 summarises the distribution of labels for four products in Australia, at the time when the effectiveness of labels were considered too severely compromised and require re-grading.
Figure 9: Summary of distribution of registered models when re-grading considered, Australia
2.2 European Union Mandatory energy labelling in the EU (now representing 27 Member States (MS)) was introduced by a framework directive (92/75/EEC), which provided a mandate to label a series of products, beginning with refrigerators in 1995 (94/2/EC). The EU energy comparison label was designed to indicate product performance using an “A” to “G” scale, with “A” being the most efficient.
This first labelling directive did not suggest that the labelling scales should be revisited once new registrations of products started to dominate the top scales; only that the regulation itself should be evaluated after a couple of years. This was done for refrigerators in 1998 (e.g. by Winward et al, 1998) though it did not examine re-grading, as the market had not reached a stage of ‘bunching’. Two years later, a second study had proposed new label classifications, especially how to redefine the A-G requirements (Ademe, 2000).
For refrigeration products, energy labels were shown to be successful, and the ability to compare products on efficiency meant that increasingly consumers were able to use efficiency to differentiate models on the market. Manufacturers were also engaged in the labelling process and could match their production output and efficiency declarations to the threshold values. This is clearly shown by analysis by an EC project (Ademe, 2000) in Figure 10, with post-label distribution (1999) showing clear peaks at the label boundaries (energy efficiency index: “A”=55, “B”=75, “C”=90)
VEESL: A GUIDE TO RE-GRADING ENERGY PERFORMANCE LABELS 8

Figure 10: Distribution of cold appliances for sale in the EU, by energy-efficiency index
In September 1999, refrigeration MEPS were introduced which meant that all refrigeration products were required to meet or exceed the “C” band (the exception being “E” for chest freezers), leaving bands DEFG empty. In addition, various European Member States’ information and rebate programmes designed to promote the top categories had caused a bunching towards the top-end of the labelling scale, particularly in the Netherlands, Germany and Denmark.
An analysis of European data from 1997 also shows that most of the bottom categories were not being used. Though, there were some differences among Member States, for example there were still a significant number of products still available in category “G” in Italy and UK (Table 3).
Table 3: Refrigeration sales-weighted distribution of energy label class in the EU by Member State, 1997
A B C D E F G
Austria 13% 38% 35% 10% 3% 1% 1%
Belgium 6% 13% 30% 30% 15% 6% 2%
France 2% 26% 44% 19% 7% 2% 1%
Germany 17% 43% 30% 7% 3% 0% 1%
Italy 2% 22% 35% 11% 11% 9% 12%
Netherlands 14% 37% 28% 14% 4% 2% 1%
Spain 60% 19% 45% 15% 13% 4% 3%
Sweden 4% 18% 46% 17% 8% 7% 1%
UK 1% 9% 33% 32% 10% 6% 9%
All EU (1996) 6% 25% 34% 19% 8% 4% 5%
All EU (1997) 8% 28% 35% 16% 7% 3% 4%
These data can be more easily viewed graphically, to show the bunching that had occurred (Figure 11).
VEESL: A GUIDE TO RE-GRADING ENERGY PERFORMANCE LABELS 9

Figure 11: Sales-weighted distribution of energy label class for refrigerators in 1997
This efficiency distribution shifted more over the subsequent years in the EU, meaning a lack of differentiation of products at high efficiency. This lack of differentiation at the top end was not only an issue for consumers and European Member States who wanted to use the label as a basis to provide subsidies for the best products, but also for manufacturers who had invested in developing higher efficiency products and wanted to compete in the market on this aspect. The European appliance manufacturers’ trade association (CECED) initially developed a voluntary approach, to add two further energy classifications to the top of the label. This label change subsequently became a legal requirement under a Commission directive (EC, 2003). The EC Directive 2003/66/EC states:
“About 20 % of the cold appliances sold in 2000 were in the most efficient class A, and in some markets the proportion was more than 50 %. The market shares of A class appliances is rising rapidly. Consequently, there is a need to introduce two additional classes, to be designated as A+ and A++, as an interim arrangement until a comprehensive revision of the energy labelling classes takes place.”
A similar voluntary approach was implemented for washing machines by CECED.
Although this allowed further differentiation at the top-end, it was achieved at the expense of the integrity of the A-G labelling systems. As noted in research by Heinzle and Wüstenhagen (2010), the work to establish brand awareness of the A-G label was largely made redundant by the addition of scales A+, A++ and A+++:
“the well-known A-G closed scheme has a greater impact on consumer decisions than an A+++ style label. The results clearly show that introducing the new label with its additional categories [and altering the label names] weakens the effect of the label, resulting in lower awareness of consumers about energy efficiency as an important attribute.”
The EU framework labelling directive was re-cast in 2010 and this did make some provision for institutionalising the re-grading process (EC 2010). Directive 2010/30/EU states:
VEESL: A GUIDE TO RE-GRADING ENERGY PERFORMANCE LABELS 10
“The classification shall be reviewed in particular when a significant proportion of products on the internal market achieves the two highest energy efficiency classes and when additional savings may be achieved by further differentiating products. Detailed criteria for a possible reclassification of products are, where appropriate, to be determined on a case-by-case basis in the relevant delegated act;”
Although this does not make detailed recommendations on approach it does leave scope for the delegated regulations on the individual energy using products to include determinations. So far this has not been done in detail for any of the delegated regulations. For example the refrigerator delegated regulation (EU No 1060/2010) does not make any firm suggestion, but Article 7 of this regulation states:
“The Commission shall review this Regulation in the light of technological progress no later than four years after its entry into force. The review shall in particular assess the verification tolerances set out in Annex VII and the possibilities for removing or reducing the values of the correction factors set out in Annex VIII.”
The focus on review in this product has been on other aspects of labelling, specifically verification tolerances which will be mentioned later (Section 5.4).
2.3 USA The USA has two main labelling product regulations: mandatory energy labelling and an endorsement label (Energy Star).
The mandatory energy labelling scheme is based on a continuous scale and provides little useful insight on re-grading beyond the previous overseas examples, so it will not be considered further. The only useful point to make is that categorical labels (as used in these three countries and also Vietnam) seem to be more effective tools than continuous labels.
The Energy Star label, introduced in 1992, is voluntary in nature and is designed to endorse the best products, however it does provide some useful insights, especially in terms of its approach to re-grading.
2.3.1 Energy Star The intention of the Energy Star label is to endorse approximately the top 25% of the market. As the uptake of more efficient products happens, the criteria or specifications are upgraded.
“When ENERGY STAR qualified models represent a high percentage of the market for a given product category, it suggests there may be an opportunity for additional savings and further refinement in the specification. As a general rule, product specifications will be reviewed for possible revision at least once every three years or when the market share of qualified products reaches about 35%. For products that evolve rapidly in the market, such as displays, ENERGY STAR specifications are reviewed every 2 years.” (ES, 2012)
Furthermore, there are a series of other checks that can be used to trigger a revision of the criteria to qualify for Energy Star endorsement, including:
A change in Federal minimum energy performance standards.
Technological changes with advances in energy efficiency which allow a revised Energy Star specification to capture additional savings.
Product availability.
Significant issues with consumers realising expected energy savings.
Performance or quality issues.
Issues with test procedures.
The US Government now has rules that require Energy Star level of performance for any purchases it makes. Thus, for ICT equipment in particular, where Government are large procurers of these products, there has been a real drive by manufacturers to get their products Energy Star compliant. This drive has
VEESL: A GUIDE TO RE-GRADING ENERGY PERFORMANCE LABELS 11

meant that the requirements have had to be revised frequently: over 150 revisions for 60 product groups since 1992.
2.3.2 Energy Star Most Efficient Recently, the EPA introduced a more stringent endorsement label, Energy Star “Most Efficient”, which is to identify the best 5% of the market or so.
“Products that receive the “Most Efficient” designation demonstrate exceptional and cutting-edge efficiency performance that environmentally-minded consumers and early adopters value. The Most Efficient recognition will represent approximately the top five percent of models on the market in the following categories: clothes washers, heating and cooling equipment, televisions, and refrigerator-freezers.”3
2.4 Conclusions from overseas examples The main conclusions from the experiences on re-grading of energy efficiency labels in Australia, Europe and the USA include:
It is useful to include a requirement for label re-grading within energy efficiency regulations, specifying the need to monitor product performance and the conditions that should be met in order to initiate a review of labelling scales.
Adding new bands to an existing labelling scheme in order to accommodate technological improvement of products will damage the established brand awareness and is therefore likely to reduce the effectiveness of the label.
The addition of new bands may appear a cheaper option than re-grading, but requires considerably more expenditure on consumer education (and is not as effective as re-grading).
Triggers for a re-scaling of existing labelling criteria include:
o Increased stringency of MEPS levels, which is likely to remove models from the lowest labelling bands.
o Technology improvements which cause bunching of models, within the middle label bands, leading to a loss of differentiation between these models.
o Technology improvements which lead to significant numbers of models within the highest label bands, reducing the incentive for manufacturers to develop more efficient products.
o The emergence of models with efficiencies that exceed the highest band by a significant margin, so that the labelling scheme is no longer able to reflect this superior performance.
The distribution of model registrations by energy rating band appears a good proxy for the distribution of model sales.
It is sensible to begin the re-grading process before the labels become ineffective. The conditions that might suggest that a re-grading is necessary for comparitive labels are shown in Table 4. It should be noted that re-grading would be warranted when any one of these conditions are met.
3 http://www.energystar.gov/index.cfm?c=partners.most_efficient_criteria
VEESL: A GUIDE TO RE-GRADING ENERGY PERFORMANCE LABELS 12
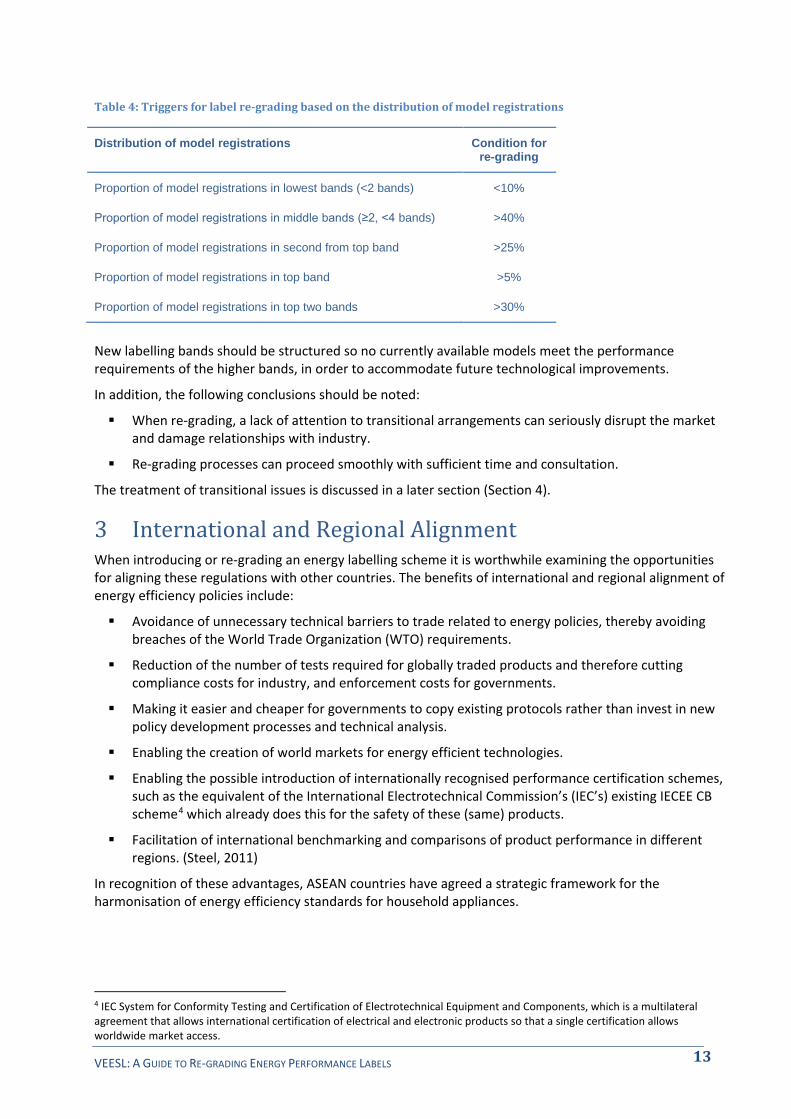
Table 4: Triggers for label re-grading based on the distribution of model registrations
Distribution of model registrations Condition for re-grading
Proportion of model registrations in lowest bands (<2 bands) <10%
Proportion of model registrations in middle bands (≥2, <4 bands) >40%
Proportion of model registrations in second from top band >25%
Proportion of model registrations in top band >5%
Proportion of model registrations in top two bands >30%
New labelling bands should be structured so no currently available models meet the performance requirements of the higher bands, in order to accommodate future technological improvements.
In addition, the following conclusions should be noted:
When re-grading, a lack of attention to transitional arrangements can seriously disrupt the market and damage relationships with industry.
Re-grading processes can proceed smoothly with sufficient time and consultation.
The treatment of transitional issues is discussed in a later section (Section 4).
3 International and Regional Alignment When introducing or re-grading an energy labelling scheme it is worthwhile examining the opportunities for aligning these regulations with other countries. The benefits of international and regional alignment of energy efficiency policies include:
Avoidance of unnecessary technical barriers to trade related to energy policies, thereby avoiding breaches of the World Trade Organization (WTO) requirements.
Reduction of the number of tests required for globally traded products and therefore cutting compliance costs for industry, and enforcement costs for governments.
Making it easier and cheaper for governments to copy existing protocols rather than invest in new policy development processes and technical analysis.
Enabling the creation of world markets for energy efficient technologies.
Enabling the possible introduction of internationally recognised performance certification schemes, such as the equivalent of the International Electrotechnical Commission’s (IEC’s) existing IECEE CB scheme4 which already does this for the safety of these (same) products.
Facilitation of international benchmarking and comparisons of product performance in different regions. (Steel, 2011)
In recognition of these advantages, ASEAN countries have agreed a strategic framework for the harmonisation of energy efficiency standards for household appliances.
4 IEC System for Conformity Testing and Certification of Electrotechnical Equipment and Components, which is a multilateral agreement that allows international certification of electrical and electronic products so that a single certification allows worldwide market access.
VEESL: A GUIDE TO RE-GRADING ENERGY PERFORMANCE LABELS 13

3.1 Opportunities for regional alignment In order to deliver and maintain close alignment of policies between ASEAN countries, it follows that a further potential trigger for the review of labelling requirements in Vietnam is when there is a change in labelling requirements within neighbouring economies.
Such amendments in energy labelling criteria within the region is likely to indicate that products with improved performance are available within the region, and is therefore cause for Vietnam to consider using the opportunity to align policies.
3.2 Global best practice Another potential trigger for a re-examination of labelling criteria is the emergence of information on the availability of significantly better performing products in other markets. Benchmarking information is now available through IEA 4E5 and CLASP6 amongst others to assist governments to compare product performance across markets.
While there may be technical, market or climatic reasons that may prohibit the transfer of product technologies between economies, the presence of products that can deliver equivalent services at greater levels of energy efficiency should initiate further investigation.
Where it is demonstrated that more efficient products are available elsewhere, the re-grading of labels to provide a marketing advantage to the best products may help to encourage the transfer of these technologies to the Vietnamese markets.
4 Transitional Issues 4.1 Advanced notice Most problems occur with re-grading because insufficient attention has been paid to communicating the requirements or not enough time has been allowed to enable industry and/or retailers to respond to the agreed changes.
As shown in Section 2, a successful transition involves a number of clearly defined steps, with associated timeframes. These steps usually comprise:
Announcement of intention to re-grade existing label.
Consultation, negotiation and agreement on the new label performance criteria, timelines and transitional arrangements.
Public announcement of these arrangements.
Start date for voluntary use of new label and registration.
Start date for mandatory use of new label and registration.
End of grandfathering provisions.
Based on experience, the time between the voluntary and mandatory use of the new label should be approximately 12 months in order to allow industry to adjust. This period should be adjusted to reflect the local conditions.
4.2 Replacement of old labels As part of the transition, new labels will need to be attached to products as they enter the market. In addition, depending on the arrangements agreed beforehand, some products that are in stores, or other retail outlets, may need to be re-labelled using the new labels.
5 The International Energy Agency implementing agreement for a co-operating programme on Efficient Electrical End-use Equipment. www.iea-4e.org 6 The international Collaborative Labeling & Appliance Standards Program. www.clasponline.org
VEESL: A GUIDE TO RE-GRADING ENERGY PERFORMANCE LABELS 14

Transitional arrangements therefore need to clearly establish who is responsible for any re-labelling (i.e. suppliers or retailers). The Government may need to reinforce this during a wider communication strategy that informs consumers and retailers of the changes.
Governments may also need to undertake surveys in a sample of stores during the transition period to ensure that the agreed actions are occurring.
4.3 Ability to identify old and new labels Allowing sufficient time for the transition, and good communication between governments, suppliers and retailers, will help to ensure that the change-over between the old and new labels occurs smoothly. To assist this process, it is very important to be able to differentiate between the old and new labels. The reasons for this include:
So that suppliers and retailers are able to easily check that existing and new stock are correctly labelled.
To avoid confusion by consumers who might observe stock in stores carrying both labels, i.e.;
o Models displaying both labels simultaneously, or
o Some models displaying the old label, and some displaying the new label both in the same store,
o Some consumers receiving a product with a different label to that in store, due to transition after packaging of the new label on display stock.
The simplest way to do differentiate between old and new labels is for the labels to carry the date when they come into force. Alternatively, wording may be added to the label during a transition period in order to provide consumers with a comparison with the old rating of the model, as shown in Figure 12.
Figure 12: Indicative label showing transitional wording
The time frame for this transition from the old label to the new label should be around 12 months, though this timing of transition will be dependent on issues surrounding the type of product being sold. To aid the judgement of timing, this aspect can be included within the consultation process.
VEESL: A GUIDE TO RE-GRADING ENERGY PERFORMANCE LABELS 15
4.4 Grandfathering Despite the best planning, it is usual for some stock to remain in the market that carries the old label beyond the final date when the new label comes into force. Generally the numbers left carrying the old label are small since the costs of stockpiling products in advance of the new label usually outweigh any commercial advantage.
The following process used in Australia to deal with this issue has been developed over many years and has proven to be acceptable to industry:
The transition arrangements allow stock carrying the old label to be sold for a specified period of time (e.g. one year), provided that it can be proved that it was manufactured or imported prior to a specified date.
This date is usually the date when transitional arrangements come into force.
In order to verify the date of manufacture or import, suppliers are required to disclose through the registration system that they will either:
o date stamp the product, or
o provide information on the how model serial numbers can be used to demonstrate the date of manufacture.
Typical wording used with respect to the requirements to verify the date of manufacture is as follows:
“The date of manufacture of each appliance shall be able to be determined from information legibly and durably marked on the appliance. The date of manufacture may be non-encrypted, encrypted or able to be determined from a serial number or other markings on the appliance and shall be visible when the appliance is in its position of normal use.
Information on how to determine the date of manufacture shall be provided on the registration form.
NOTES:
1 Regulators will use the date of manufacture as an indicator of when a product may have been available for sale. It is therefore preferable to be able to determine at least the month and year of manufacture from information on the appliance. This does not however preclude the use of other markings, for example serial numbers, which indicate those appliances manufactured within a period of time, where such details are provided with the registration.
2 Irrespective of the information marked on the appliance, local manufacturers or importers may be required to provide documentary evidence of the actual manufactured or imported date if requested by a regulator.” (AS/NZS 4474.2:2013)
5 Related considerations 5.1 Monitoring product performance In order to ensure that energy performance labels retain their ability to provide useful information to consumers, it is important to have the ability to track trends in product performance over time. A mandatory registration scheme, of the type used in Australia and Vietnam, provides the easiest way to monitor the performance of products in the market place.
An annual analysis of registrations will give a good picture of the distribution of star ratings for each product category, and indicate the rate of performance improvement and hence the approximate timeline for re-grading.
As an example, Australia publishes ‘Greening Whitegoods’ on a regular basis, which shows the output of such an analysis, in the form of indicators (E3, 2010). Not only does it show changes in the market for different aspects, this analysis can be used to spot the triggers for a process of re-grading (e.g. when
VEESL: A GUIDE TO RE-GRADING ENERGY PERFORMANCE LABELS 16

bunching occurs in the top classifications, or some very efficient products are being registered), and to evaluate the effectiveness of regulations. An example of typical outputs, after 17 years of collecting registration data, is shown in Figure 13.
Figure 13: Trends in key performance characteristics, refrigerators, 1993-2009, Australia
5.2 Relationship with MEPS and other energy efficiency policy measures Many S&L programs use a combination of the minimum energy performance standards (MEPS) and labels to achieve complimentary objectives. MEPS are designed to remove the worst performing products from the market, while the aim of energy labels is to increase the uptake of the most efficient models. In these cases, it is typical for the performance criteria for products covered by MEPS to be linked to the performance criteria for comparative labels, i.e. the lowest level of the comparative label is exactly equivalent to the performance criteria for MEPS. In other words, no product is allowed to be sold that performs worse than the lowest label grade. This suggests that any adjustment to MEPS criteria should trigger an adjustment to the labelling criteria and vice versa.
5.3 The spacing of labelling bands Energy efficiency labelling bands need to be broad enough to represent meaningful differences in energy consumption and to avoid any issues with allowed performance tolerances. The issue of tolerances is discussed in the following section.
Narrow rating bands depict only small changes in energy consumption between products, and this may annoy consumers and damage the credibility of the program. As a result, in Australia band sizes tend to be designed such that each additional band represents between a 15% and 25% reduction in consumption relative to the previous band. Similar sized bands are observed in the EU labelling scheme. Bands much larger than this are only warranted where there are very large differences between the least and most efficient products on the market.
In order to improve consumer understanding of what the bands represent, it is also typical to base each band on a geometric progression so that each band represents a constant percentage energy reduction star rating from the level of the lowest band.
VEESL: A GUIDE TO RE-GRADING ENERGY PERFORMANCE LABELS 17

5.4 Verification Tolerances When manufacturers make, and regulators check, the performance declarations on the energy label, they have to be aware of the following two factors that may cause individual models to have a different level of performance to that declared on the label:
The measurement equipment will not exactly measure energy and other features relevant for efficiency (e.g. volume). These measurement tolerances are usually small.
Manufacturing tolerances of the production lines. These tolerances can be more significant, and different manufacturers may be able to control these better than others.
There are different ways to account for these tolerances in efficiency regulations.
The first method is to include ‘verification tolerances’ in the regulations. These verification tolerances allow governments and compliance organisations to carry out market surveillance to ensure that the declared information is accurate within given parameters or tolerance levels. For example, refrigerator performance measured in the EU for labelling and Eco-design now allow a 10% allowance margin for energy consumption and 3% for volume.
However, there has been some concern raised by EU MSs (EC, 2013) that some manufacturers (who understand and can better control their manufacturing tolerances) are using the verification tolerances to declare values above those actually achieved. For example, there are instances of technical documentation showing performance values that are worse (i.e. using more energy) than the values declared on the energy label or requirements for eco-design, but which are within the prescribed tolerances. In this instance, the manufacturer is using the allowable tolerances to over-declare.
The EC is currently examining options to avoid this, and is likely to add specific conditions to existing implementing measures (EC, 2013).
An alternative approach to dealing with tolerances is to set the regulations such that all products that are placed on the market must reach the declared values (for labelling or MEPS). In other words, under this system, suppliers must take account of manufacturing and any other tolerances before making a performance claim.
This means that declarations are on the conservative side, which has the main advantage that Government regulators need only prove that one appliance is non-compliant, rather than test multiple appliances and use averages. In addition, manufacturers who can control their production processes closely can declare performance closer to actual values, while those who have wider variations in manufacturing (reflected in a range of energy consumption) will have to be more conservative.
This approach has been used in Australia, and in the case of refrigerators MEPS levels were made slightly less stringent in 2010 to take account of the removal of tolerance allowances.
It is suggested that where feasible, governments should not make allowances for production tolerances in energy efficiency regulations, requiring manufacturers to take account of these before they make a performance claim.
5.5 Product categories When re-grading a label, there is an opportunity to also re-examine some decisions made when the labelling scheme was first setup. At the point of re-grading or updating the labelling scheme the following can also be checked and revised if considered necessary:
5.5.1 Limiting the number of sub-product types When defining the scope of labelling and MEPS regulations it is common to specify sub-products with different performance requirements. However, sub-dividing usually means less stringent requirements for some sub-product types, with fewer savings ultimately being realised. Sub-dividing can also lead to administrative complexity.
VEESL: A GUIDE TO RE-GRADING ENERGY PERFORMANCE LABELS 18

Using refrigerators as an example: the US has over 40 different types of refrigerators and freezers included in its regulations, whilst the EU currently includes correction and adjustment factors for different features (e.g. built-in, frost-free, climate class). In the EU, these will be addressed at the next iteration of the label (see e.g. Lee et al, 2012, for a discussion on the use and misuse of such factors). In Australia, there are ten different types of refrigerator and freezer combinations plus correction and adjustment factors.
5.5.2 Technology-neutrality Technology neutral in this instance means applying the same labelling requirements to all technology types designed to provide the same service/function. If separate performance requirements are set for different technologies, it is not a ‘level playing field’ for the technology types and there may be potential loss of energy savings. For example, the EU used to have different requirements for condensing and air-vented dryers, even though they essentially performed the same service – this differentiation has now been removed. Such technology differentiation is sometime included to protect local industry.
6 Recommendations The main recommendations from this report are:
1) When drawing up product regulations, explicitly include how and when to consider re-grading the label within the regulation itself. Excluding this from the original regulation will likely introduce additional delays to re-grading.
2) Regularly monitor the market. Specifically, check for:
a) Bunching at the top end of label bands (using the annual analysis of the registration database, and coupling this with sales data where available).
b) More efficient technologies being available (e.g. by scanning other markets regionally and globally).
c) Changes in policy, especially in neighbouring countries.
3) The following represents a check-list for what should trigger consideration for a review of classification thresholds for comparative labels:
a) The top classification contains more than 5% of sales, and/or the second classification level contains more than 25% of the market sales.
b) The bottom classification or two have very few (<10% sales) or no products being registered, especially after a new round of minimum energy performance standards.
c) The most efficient products being registered in the top classification are significantly better (approximately 10-15% better) than the top threshold requirement.
d) Information from other markets demonstrates that significantly more efficient products are available, which could be introduced to the local market.
e) Other countries (especially neighbouring ones) are considering a review and change to their thresholds.
4) Adding new bands to an existing labelling scheme in order to accommodate technological improvement of products should be avoided, as it is likely to damage the established brand awareness of the label.
5) When planning the re-grading, consideration should be given to designing and communicating the transitional arrangements and timelines to ensure that regulators, suppliers and retailers are clear on process.
a) As an indicator, it is unlikely that a major adjustment to existing labelling criteria can be successfully managed without at least 12 months’ notice of the final arrangement to all stakeholders.
VEESL: A GUIDE TO RE-GRADING ENERGY PERFORMANCE LABELS 19

6) The steps in the revision process should include:
a) Undertake technical analysis for the proposed revision to labelling thresholds.
b) Design the policy for the transitional arrangements including proposed timelines.
c) Consult with stakeholders on proposal (especially the supply chain and Government departments that may use the label for other policy measures).
d) Communicate the final agreed policy including transitional arrangements to stakeholders.
e) Monitor the transition process and ensure it is working.
f) After the transition period, perform an evaluation to check that the process worked as intended and to learn lessons for future re-grades (including for other products).
7) In the process of undertaking a technical analysis for new energy efficiency rating criteria, the following should be noted:
a) New labelling bands should be structured so that no currently available products meet the performance requirements of the higher bands. This will accommodate future technological improvements, and provide recognition to suppliers who deliver these more efficient products.
b) Where feasible, new labelling bands should be designed to represent between a 15% and 25% reduction in consumption.
c) Verification tolerances should not be included, to enable easier verification. Manufacturers should take account of production tolerances before making a declaration of product performance.
7 References Ademe (2000), Cold-II: The revision of energy labelling and minimum energy efficiency standards for domestic refrigeration appliances. Funded by the European Commission Directorate-General for Transport and Energy, SAVE II Programme (contract No. VVII/4.1031/Z/98-269). December 2000.
EC (2003) COMMISSION DIRECTIVE 2003/66/EC of 3 July 2003 amending Directive 94/2/EC implementing Council Directive 92/75/EEC with regard to energy labelling of household electric refrigerators, freezers and their combinations.
E3 (2007), Refrigerator Star Rating Algorithms in Australia and New Zealand– Revised Proposal (2007/09), Equipment Energy Efficiency Committee Discussion Paper, September 2007. Available from: http://www.energyrating.gov.au/wp-content/uploads/Energy_Rating_Documents/Library/Refrigeration/Commercial_and_Domestic_Refrigeration/200709-rf-algorithm-revised.pdf
E3 (2008), Consultation Regulatory Impact Statement- Proposed revisions to the method of test and energy labelling algorithms for household refrigerators and freezers, 2008/04, Equipment Energy Efficiency Committee, June2008. Available at: http://www.energyrating.gov.au/wp-content/uploads/Energy_Rating_Documents/Library/Refrigeration/Refrigerators_&_Freezers/200804-ris-rf-fz-label.pdf
E3 (2009a), Decision Regulatory Impact Statement - Air Conditioner MEPS and Energy Labelling, Equipment Energy Efficiency Committee, April 2009. Available at: http://www.energyrating.gov.au/wp-content/uploads/Energy_Rating_Documents/Library/Cooling/Air_Conditioners/200921-ac-decision-ris.pdf
E3 (2009b), Transitional Arrangements Air Conditioners 2009-2011, Fact Sheet, October 2009. Available at: http://www.energyrating.gov.au/wp-content/uploads/Energy_Rating_Documents/Fact_Sheets/General/factsheet-trans-ac2.pdf
VEESL: A GUIDE TO RE-GRADING ENERGY PERFORMANCE LABELS 20

E3 (2010), GREENING WHITEGOODS - A report into the energy efficiency trends of whitegoods in Australia from 1993 to 2009, (2010/08), prepared by Energy efficient Strategies, October 2010. Available at: http://www.energyrating.gov.au/resources/program-publications/?viewPublicationID=2149
EC (2013), Working Document on tolerances used in Ecodesign and Energy Labelling Implementing Measures.
ES (2012), ENERGY STAR® Products Program Strategic Vision and Guiding Principles, May 2012. Available at: http://www.energystar.gov/ia/partners/prod_development/downloads/ENERGY_STAR_Strategic_Vision_and_Guiding_Principles.pdf?2758-38da
Heinzle, S. and Wüstenhagen, R. (2010), Disimproving the European Energy Label's value for consumers? Results from a consumer survey. University of St. Gallen, Institute for Economy and the Environment (IWÖ-HSG), Geneva. February 2010.
Lee, J.; King, N.; Leach, S.; Evans, J.; Foster, A. and Lane, K. (2012), Assessment of the applicability of current EC correction factors and tolerance levels for domestic refrigerating appliances. Published by Defra August 2012.
MEA (2002), Energy Labelling and Minimum Energy Performance Standards for Domestic Gas Alliances, Produced for the Sustainable Energy Authority Victoria by Mark Ellis & Associates, Energy Efficient Strategies and Wilkenfeld & Associates, November 2002.
SEAV (2003), Driving Energy Efficiency Improvements to Domestic Gas Appliances, Discussion Paper, July 2003.
Steele, R. (2010), Implementing the future WTO commitments on trade facilitation, International Standards, ISO and the WTO, Mr. Rob Steele, ISO Secretary-General, Geneva, 5 July 2010.
Waide, P. (2000), Monitoring of energy efficiency trends of refrigerators, freezers, washing machines and washer-dryers sold in the EU. Report for Ademe, on behalf of the European Commission, SAVE contract No XVII/4.1031/Z/98-251. Windward, J.; Schiellerup, P. and Boardman, B. (1998), Cool Labels: The first three years of the European Energy Label. Funded by the European Commission DGXVII under the SAVE Programme (contract No. 4.1031/E/97-001). Published by Environmental Change Unit, University of Oxford. September 1998.
8 Bibliography EES (2004), Energy Label Transition - The Australian Experience, prepared by Energy Efficient Strategies for E3. Report 2004/05. See http://www.energyrating.gov.au/library/details200405-labeltransition.html
CLASP (2005), Energy Efficiency Labels and Standards: A Guidebook for Appliances Equipment and Lighting, 2nd Edition. Available at: http://www.clasponline.org/ResourcesTools/Resources/StandardsLabelsGuidebook#SLGuidebookLinks
VEESL: A GUIDE TO RE-GRADING ENERGY PERFORMANCE LABELS 21