a guide to nucleic acid detection by single-molecule ... · a guide to nucleic acid detection by...
TRANSCRIPT
Contents lists available at ScienceDirect
Methods
journal homepage: www.elsevier.com/locate/ymeth
A guide to nucleic acid detection by single-molecule kinetic fingerprinting
Alexander Johnson-Bucka,b,c,1, Jieming Lib,1, Muneesh Tewaria,c,d,e,f,g, Nils G. Walterb,c,f,⁎
a Department of Internal Medicine, Division of Hematology/Oncology, University of Michigan, Ann Arbor, MI, USAb Single Molecule Analysis Group, Department of Chemistry, University of Michigan, Ann Arbor, MI, USAc Center for RNA Biomedicine, University of Michigan, Ann Arbor, MI, USAd Department of Internal Medicine, University of Michigan, Ann Arbor, MI, USAe Department of Biomedical Engineering, University of Michigan, Ann Arbor, MI, USAf Center for Computational Medicine and Bioinformatics, University of Michigan, Ann Arbor, MI, USAg Biointerfaces Institute, University of Michigan, Ann Arbor, MI, USA
A R T I C L E I N F O
Keywords:Single-molecule fluorescence microscopyKinetic fingerprintingAmplification-freeMicroRNADNAMutation
A B S T R A C T
Conventional methods for detecting small quantities of nucleic acids require amplification by the polymerasechain reaction (PCR), which necessitates prior purification and introduces copying errors. While amplification-free methods do not have these shortcomings, they are generally orders of magnitude less sensitive and specificthan PCR-based methods. In this review, we provide a practical guide to a novel amplification-free method,single-molecule recognition through equilibrium Poisson sampling (SiMREPS), that provides both single-mole-cule sensitivity and single-base selectivity by monitoring the repetitive interactions of fluorescent probes toimmobilized targets. We demonstrate how this kinetic fingerprinting filters out background arising from theinevitable nonspecific binding of probes, yielding virtually zero background signal. As practical applications ofthis digital detection methodology, we present the quantification of microRNA miR-16 and the detection of themutation EGFR L858R with an apparent single-base discrimination factor of over 3 million.
1. Introduction
1.1. Conventional high-sensitivity analysis of nucleic acids requiresamplification
The detection of nucleic acid sequences with high specificity playsan important role in both basic biological research and diagnostics dueto the fundamental roles of genetics, epigenetics, and gene expressionin both normal physiology and pathology. For instance, specific muta-tions [1] and aberrant methylation patterns of DNA [2] have beenlinked to various types of cancer, showing promise for early detection ofdisease, monitoring of treatment response and relapse, and indicatingwhether a cancer is likely to respond to a given course of treatment[3–6]. Expression levels of specific microRNAs (miRNAs) [7–10] andlong non-coding RNAs (lncRNAs) [11–13] are strongly correlated to celldifferentiation states and thus of interest as biomarkers of disease.
To ensure adequate sensitivity for most nucleic acid analyses,samples must be amplified by procedures such as the polymerase chainreaction (PCR) for adequate specificity, sometimes following generationof cDNA by reverse transcriptase and/or the ligation of adapter se-quences. However, such preparative procedures introduce severalchallenges for the quantitative analysis of nucleic acids. First, DNApolymerases and thermal cycling can both introduce artifactual se-quence changes such as base substitutions during the amplificationprocess [14,15], which may result in false positives when attempting todetect rare single-base mutations (e.g., for liquid biopsy of cancer).Second, reverse transcriptases and ligases exhibit significant sequencebiases, introducing significant artifacts [16] such as spurious differ-ences in expression levels and even the complete absence of certainsequences. Third, polymerases and ligases can be susceptible to in-hibition by contaminants such as heparin and heme [17,18], necessi-tating additional purification steps prior to amplification. Finally, many
https://doi.org/10.1016/j.ymeth.2018.08.002Received 12 June 2018; Received in revised form 4 August 2018; Accepted 6 August 2018
Abbreviations: SiMREPS, single-molecule recognition through equilibrium Poisson sampling; ROI, region of interest; FOV, field of view; CP, capture probe; FP,fluorescent probe; LNA, locked nucleic acid; PNA, peptide nucleic acid; MUT, mutant; WT, wild-type; APTES, (3-aminopropyl)triethoxysilane; OSS, oxygen scavengersystem; HMM, hidden Markov modeling; sulfo-DST, sulfo-disuccinimidyltartrate; Nb+d, number of binding and dissociation events; P-TIRF, prism-type total internalreflection fluorescence; O-TIRF, objective-type total internal reflection fluorescence; ICCD, intensified charge-coupled device; EMCCD, electron-multiplying charge-coupled device; sCMOS, scientific complementary metal oxide semiconductor⁎ Corresponding author.
1 These authors contributed equally to this work.E-mail address: [email protected] (N.G. Walter).
Methods 153 (2019) 3–12
Available online 10 August 20181046-2023/ © 2018 Elsevier Inc. All rights reserved.
T

classes of analytes are simply not amenable to direct amplification,including epigenetic modifications, short or fragmented nucleic acids,or non-nucleic acid analytes.
1.2. Advantages and shortcomings of amplification-free detection methods
Due to these challenges, several amplification-free methods [19–21]have been pursued for the analysis of nucleic acids and other biomo-lecules, in some cases permitting the direct capture and quantitation ofanalytes from biological matrices without prior purification. However,these amplification-free approaches typically suffer from a different setof challenges. First, since they lack the geometric amplification of PCR,these methods are generally limited by finite thermodynamic dis-crimination factors between closely related sequences [22]. This ther-modynamic specificity limit is embodied by the parameter
=−
Q emax thermGo
RT,ΔΔ
, where ΔΔGo is the difference in the Gibbs free en-ergy of hybridization of a detection probe to a target sequence and ofthe same probe to a related but spurious target sequence; in practice,this translates to Qmax,therm values ranging from about 20 to 20,000 forsingle-nucleotide variants [22]. In most cases, the actual single-basespecificity realized is only 90–99% [20,22]. Second, since many am-plification-free assays are surface-based, true single-molecule sensi-tivity becomes challenging due to the inability to completely suppressnonspecific binding of probes to the detection surfaces.
1.3. Single-molecule kinetic fingerprinting enables amplification-freedetection with arbitrarily high specificity
To realize amplification-free biomolecule detection without beingbound by thermodynamic limits of specificity, we developed an ap-proach based on time-resolved measurement of the interaction kineticsbetween fluorescent probes and single immobilized analyte molecules[23]. This approach, termed SiMREPS (single-molecule recognitionthrough equilibrium Poisson sampling), exploits repeated observationsof transient probe interactions with each surface-bound copy of theanalyte to create a “kinetic fingerprint” that is highly characteristic ofthat particular analyte molecule when detected at the single moleculelevel (Fig. 1A), and is significantly perturbed by even small alterationssuch as single-base substitutions. As a result, nonspecific binding ofprobes to the surface and to closely related sequences can be con-fidently screened out due to their distinct kinetics (Fig. 1B-C), yieldingessentially background-free detection of single analyte molecules afterapplying appropriate filters for signal-to-noise, intensity, and probebinding and dissociation kinetics (Fig. 1D). To facilitate the observationof repeated fluorescent probes binding to the same copy of analyte, theanalyte is typically immobilized to a biotin-functionalized surface via astreptavidin bridge and a biotin-labeled capture probe (Fig. 1A). WhileDNA oligonucleotides have been successfully employed as captureprobes for SiMREPS, several locked nucleic acid (LNA) modificationsare usually incorporated when the analyte is a short nucleic acid such asa miRNA to permit high-affinity capture while leaving several unpairednucleobases to interact with the fluorescent probe.
Because the binding of fluorescent probes to a single analyte mo-lecule can be modeled as a Poisson process, the number of probebinding and dissociation events observed for each analyte molecule(Nb+d) will increase linearly over time, with a coefficient of variation(C.V.) that decreases as ∼
+N1b d
[23]. This decrease in C.V. with in-creasing observation time permits the kinetic fingerprint resulting froma single analyte molecule to be separated from the signals resultingfrom nonspecific binding to an arbitrarily high degree. Similarly, thelifetimes of the analyte in the probe-bound (τbound) and probe-unbound(τunbound) states become better separated from the background bindingas an increasing number of probe-binding events to each analyte isobserved. This increased confidence in the source of a given kineticfingerprint is the core feature of SiMREPS, and means that probes with
finite thermodynamic discrimination can be used to detect an analytewith arbitrarily high specificity, given an adequate number of bindingevents. In other words, the specific time evolution of the detectionsignal becomes a heretofore untapped observation parameter thatserves to enhance the accuracy of analyte identification, in conceptsimilar to the revolution conventional fluorescence microscopy ex-perienced upon introduction of super-resolution approaches that ob-serve a time series of sparse signals from single molecules to determinetheir cellular localization more accurately [24].
As a proof of concept, we show that miRNAs such as miR-16 [23]can be detected using SiMREPS with essentially zero background signalfrom surface binding of fluorescent probes if kinetic fingerprints fromsingle molecules are filtered by Nb+d and τbound (Fig. 1D). In this article,we discuss practical considerations for the use of SiMREPS to detectshort nucleic acids such as miRNAs and DNA fragments, includingguidelines for instrumentation and assay design. In addition, we de-monstrate the high specificity of the technique through proof-of-con-cept measurement of the cancer point mutation EGFR L858R with anapparent discrimination factor of> 1,000,000.
2. Materials and methods
2.1. Instrumentation and sample cell design
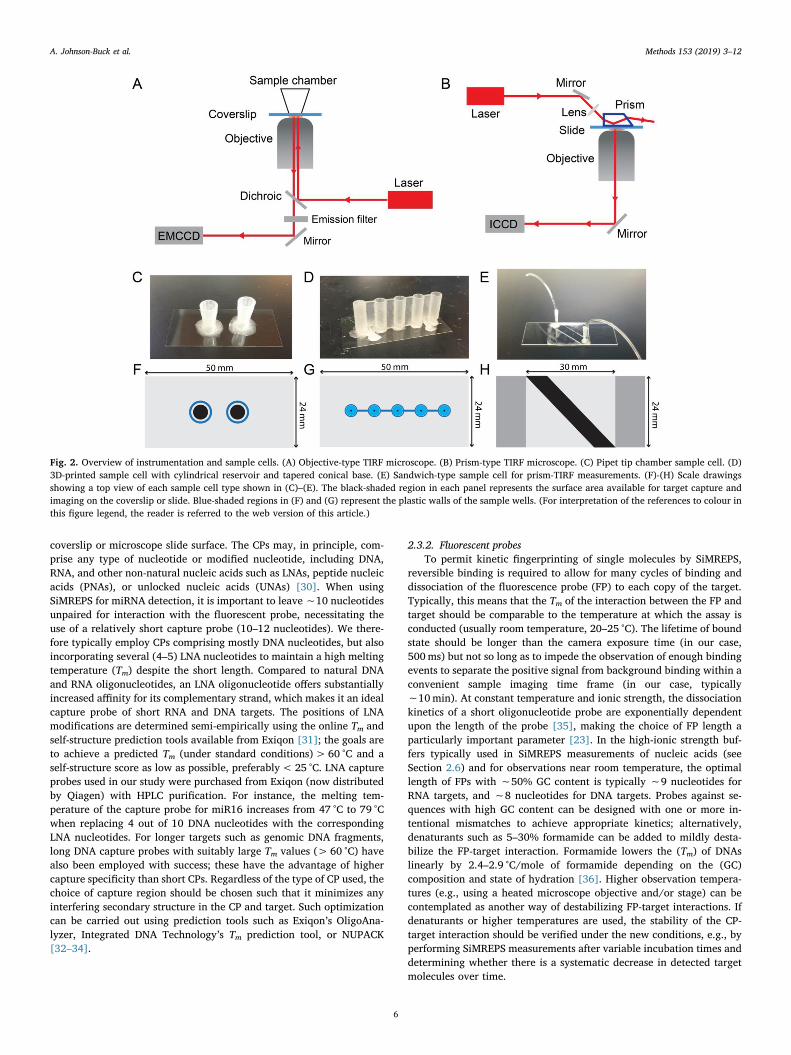
Since SiMREPS in its current implementation requires the presenceof an excess of fluorescent probe in binding equilibrium with the sur-face-immobilized analyte, a microscope capable of total internal re-flection fluorescence (TIRF) illumination is required to reject back-ground signal from the majority of freely diffusing (non-surface-bound)fluorescent probes. Most commonly, TIRF measurements are carried outusing either a prism-type (P-TIRF) or objective-type (O-TIRF) illumi-nation geometry (Fig. 2A-B). Excitation light is provided by a laser ofappropriate wavelength (e.g., 640 nm for probes labeled with Cy5) andoutput power (typically 10–100mW) and undergoes total internal re-flection at the interface between the coverslip and the aqueous solutioncontaining the fluorescent probe. To reliably detect single fluorescentprobes with satisfactory signal-to-noise, an illumination intensity of∼50W/cm2 is typically used, and the TIRF angle adjusted to achieve acalculated penetration depth of ∼80–110 nm of the evanescent field.Emission light from surface- or analyte-bound fluorescent probes iscollected through a microscope objective lens, passed through dichroicmirrors and/or chromatic filters to remove the majority of the excita-tion light, and detected by a high-sensitivity camera such as an ICCD,EMCCD, or sCMOS. In our study, an EMCCD camera is used in O-TIRFand an ICCD camera is used in P-TIRF. In SiMREPS imaging, the signalintegration time (exposure time) per frame is typically 500ms, andtypically 1200 movie frames are acquired per field of view (FOV).
SiMREPS is compatible with a variety of sample cell types(Fig. 2C–H). Because the sample cell must be positioned between theprism and objective, P-TIRF requires thin flow cells that are typicallyconstructed by sandwiching two pieces of double-sided tape between acoverslip and a biotin-functionalized microscope slide, with optionalplastic tubing added for ease of sample injection (Fig. 2E). However,with O-TIRF taller sample cells constructed from cut pipet tips (Fig. 2C)or 3D-printed plastic parts (Fig. 2D) attached to a biotinylated coverslipmay also be used. These taller sample cells permit the immobilization ofanalyte on the imaging surface at higher densities, providing greatersensitivity than thin flow cells. Thus, for high-sensitivity measurements(LOD < 1 pM) O-TIRF is preferred over P-TIRF for SiMREPS. However,due to their open-top geometry, measurements that take a long time(> 1h) or using fluorescent probes with slow-off rates (< 2min−1) maybenefit from filling the sample chamber to the top with imaging solu-tion and sealing it with parafilm to slow the influx of atmosphericoxygen. All the data presented here were collected by O-TIRF usingsample cells constructed from cut pipet tips. Recently, other in-strumentation has been introduced for super-resolution studies,
A. Johnson-Buck et al. Methods 153 (2019) 3–12
4

including spinning disk confocal microscopes (CSU-W1, YokogawaElectric) [25] and the Oxford Nanoimager [26]; these may provideother options for SiMREPS measurements in the future.
2.2. Analyte scope
Since it does not require any nucleic acid-specific enzymes such asligases or polymerases, SiMREPS is in principle capable of detecting anyanalyte that can (1) be immobilized at a surface, preferably via a spe-cific interaction, and (2) remain free to transiently recruit fluorescentprobes from solution while bound to the surface. It thus has a muchbroader scope than amplification-based approaches. To date, SiMREPShas been successfully applied to the identification and counting of shortnucleic acids such as miRNAs (miR-16, miR-21, let-7a, let-7c, miR-141,cel-miR-139) [23] and ∼22–160 bp fragments of single-stranded ordouble-stranded DNA [27–29] such as cancer-related EGFR mutations(see Results). Since the assay is typically performed at ambient room
temperature, to ensure maximal sensitivity for double-stranded orhighly structured analytes, care must be taken to fully denature andsequester any interfering secondary structure that might interfere withsurface capture or fluorescent probe binding, e.g., by brief heating in anexcess (e.g., 1–2 µM) of a carrier oligonucleotide or sequence-specificoligonucleotides that prevent the formation of interfering secondarystructure. In contrast, short nucleic acids that are difficult to detect withamplification-based approaches are readily detected by SiMREPS andare thus particularly strong candidates for the technique. Finally, owingto its high specificity, SiMREPS is capable of discriminating single-nu-cleotide variants such as let-7a and let-7c [23].
2.3. Probe design
2.3.1. Capture probesFor sequence-specific capture of analytes, terminally biotin-labeled
capture probes (CPs) are immobilized on a streptavidin-coated
Fig. 1. Overview of the SiMREPS technique for low-background, high-specificity detection of single molecules. (A) Schematic illustrating the experimental principlesof SiMREPS. A target analyte is captured at the surface of a coverslip via a biotinylated capture probe. Then, using TIRF microscopy, each copy of surface-boundanalyte is detecting by monitoring the repeated transient binding of a fluorescent probe, which yields a distinctive kinetic fingerprint. (B) Single movie frame from arepresentative field of view from SiMREPS using objective-type TIRF microscopy. Red squares indicate positions of binding events that were rejected as likelybackground binding by kinetic fingerprinting, and the cyan circles indicate positions of repeated binding events with kinetics that suggest the presence of the analyte(C) Representative fluorescence-versus-time traces observed in the presence and absence of a miRNA target, hsa-miR-16. The kinetics of transitions between FP-boundand FP-unbound states are analyzed to distinguish between true and false positives at the single-molecule level. (D) Number of spots counted in positive and negativecontrol experiments for miR-16 before (‘total counts’) and after (‘accepted counts’) kinetic filtering. While filtering based on intensity and signal-to-noise (S/N) alonedoes not yield a significant difference between positive and negative controls (due to background binding of the probe), the application of kinetic filtering criteria(see Section 2.7.4) reduces accepted counts in the negative control to essentially zero. (For interpretation of the references to colour in this figure legend, the reader isreferred to the web version of this article.)
A. Johnson-Buck et al. Methods 153 (2019) 3–12
5
coverslip or microscope slide surface. The CPs may, in principle, com-prise any type of nucleotide or modified nucleotide, including DNA,RNA, and other non-natural nucleic acids such as LNAs, peptide nucleicacids (PNAs), or unlocked nucleic acids (UNAs) [30]. When usingSiMREPS for miRNA detection, it is important to leave ∼10 nucleotidesunpaired for interaction with the fluorescent probe, necessitating theuse of a relatively short capture probe (10–12 nucleotides). We there-fore typically employ CPs comprising mostly DNA nucleotides, but alsoincorporating several (4–5) LNA nucleotides to maintain a high meltingtemperature (Tm) despite the short length. Compared to natural DNAand RNA oligonucleotides, an LNA oligonucleotide offers substantiallyincreased affinity for its complementary strand, which makes it an idealcapture probe of short RNA and DNA targets. The positions of LNAmodifications are determined semi-empirically using the online Tm andself-structure prediction tools available from Exiqon [31]; the goals areto achieve a predicted Tm (under standard conditions)> 60 °C and aself-structure score as low as possible, preferably< 25 °C. LNA captureprobes used in our study were purchased from Exiqon (now distributedby Qiagen) with HPLC purification. For instance, the melting tem-perature of the capture probe for miR16 increases from 47 °C to 79 °Cwhen replacing 4 out of 10 DNA nucleotides with the correspondingLNA nucleotides. For longer targets such as genomic DNA fragments,long DNA capture probes with suitably large Tm values (> 60 °C) havealso been employed with success; these have the advantage of highercapture specificity than short CPs. Regardless of the type of CP used, thechoice of capture region should be chosen such that it minimizes anyinterfering secondary structure in the CP and target. Such optimizationcan be carried out using prediction tools such as Exiqon’s OligoAna-lyzer, Integrated DNA Technology’s Tm prediction tool, or NUPACK[32–34].
2.3.2. Fluorescent probesTo permit kinetic fingerprinting of single molecules by SiMREPS,
reversible binding is required to allow for many cycles of binding anddissociation of the fluorescence probe (FP) to each copy of the target.Typically, this means that the Tm of the interaction between the FP andtarget should be comparable to the temperature at which the assay isconducted (usually room temperature, 20–25 °C). The lifetime of boundstate should be longer than the camera exposure time (in our case,500ms) but not so long as to impede the observation of enough bindingevents to separate the positive signal from background binding within aconvenient sample imaging time frame (in our case, typically∼10min). At constant temperature and ionic strength, the dissociationkinetics of a short oligonucleotide probe are exponentially dependentupon the length of the probe [35], making the choice of FP length aparticularly important parameter [23]. In the high-ionic strength buf-fers typically used in SiMREPS measurements of nucleic acids (seeSection 2.6) and for observations near room temperature, the optimallength of FPs with ∼50% GC content is typically ∼9 nucleotides forRNA targets, and ∼8 nucleotides for DNA targets. Probes against se-quences with high GC content can be designed with one or more in-tentional mismatches to achieve appropriate kinetics; alternatively,denaturants such as 5–30% formamide can be added to mildly desta-bilize the FP-target interaction. Formamide lowers the (Tm) of DNAslinearly by 2.4–2.9 °C/mole of formamide depending on the (GC)composition and state of hydration [36]. Higher observation tempera-tures (e.g., using a heated microscope objective and/or stage) can becontemplated as another way of destabilizing FP-target interactions. Ifdenaturants or higher temperatures are used, the stability of the CP-target interaction should be verified under the new conditions, e.g., byperforming SiMREPS measurements after variable incubation times anddetermining whether there is a systematic decrease in detected targetmolecules over time.
Fig. 2. Overview of instrumentation and sample cells. (A) Objective-type TIRF microscope. (B) Prism-type TIRF microscope. (C) Pipet tip chamber sample cell. (D)3D-printed sample cell with cylindrical reservoir and tapered conical base. (E) Sandwich-type sample cell for prism-TIRF measurements. (F)-(H) Scale drawingsshowing a top view of each sample cell type shown in (C)–(E). The black-shaded region in each panel represents the surface area available for target capture andimaging on the coverslip or slide. Blue-shaded regions in (F) and (G) represent the plastic walls of the sample wells. (For interpretation of the references to colour inthis figure legend, the reader is referred to the web version of this article.)
A. Johnson-Buck et al. Methods 153 (2019) 3–12
6
When choosing the binding register of the FP on the target se-quence, the following criteria should be observed for optimal perfor-mance:
1. GC content of the FP-target interaction should be ≤50%, if possible,to ensure rapid binding and dissociation kinetics;
2. There should be at least 1–2 unpaired nucleotides between thebinding sites of the CP and FP on the target in order to avoidstacking interactions between adjacently binding probes that willtend to lengthen the bound-state lifetime of the FP;
3. It is preferable to position the fluorophore distally on the FP relativeto the CP, to reduce the likelihood of stacking interactions betweenthe fluorophore and the CP; alternatively, an additional 1–2 un-paired bases between the FP and CP can accommodate a proximallypositioned fluorophore;
4. If single-base discrimination is desired, note that the selectivity ishigher when the mismatched nucleotide is near the middle of the FPthan it is when positioned near the 3′- or 5′-end of the probe-targetduplex [37–39]. While mismatches near the end of the duplex canalso provide adequate discrimination by SiMREPS [23], longer ob-servation times may be necessary to achieve perfect kinetic dis-crimination.
Notably, the use of fluorescent probes with only 8-9 nucleotides willnot provide sufficient specificity to uniquely identify a sequence againsta background of genomic DNA or RNA. Additional specificity is pro-vided by the capture probe (∼10 nucleotides), which can be engineeredto be as specific as needed, for example, by lengthening it upon removalof LNA moieties or increase of the assay temperature or formamideconcentration, and the slide surface should be well passivated againstnonspecific binding of nucleic acids. Furthermore, addition of a secondfluorescent probe to create a FRET pair has been employed in super-resolution imaging with DNA-PAINT [40] and could provide additionalspecificity by requiring the proximity of two short (e.g., 8–10 nucleo-tide) sequences to observe a positive kinetic fingerprint. The addition ofa second fluorescent probe will slightly increase the footprint of theassay (from ∼20 to ∼30 nucleotides), but this footprint will still becomparable to, or shorter than, that required by the majority of othernucleic acid assays based on PCR or thermodynamic binding, while alsoproviding extremely high single-base discrimination power without anypurification or enzymatic processing. Since SiMREPS has notably fewerrequired components than enzymatic assays, the choice of both probesand buffer conditions is particularly flexible and can be adjusted tomatch most specificity requirements imposed by a particular samplematrix.
2.3.3. Auxiliary oligonucleotidesWhile SiMREPS can often be performed using only the CP and FP,
other oligonucleotides may be helpful in preventing re-hybridization ofdouble-stranded targets, in preventing secondary structures in thetarget that could interfere with FP binding, or in reducing off-targetbinding of the FP to the CP or spurious target sequences.
1. Carrier oligonucleotide: 1–5 µM of a polythymidine oligonucleotidesuch as (dT)10 can reduce sample loss due to adsorption as well asprevent re-hybridization of double-stranded DNA targets after de-naturation.
2. CP blocker: some combinations of CP and FP sequences will result ina large amount of transient FP binding to the CP, which can lead tofalse positives or false negatives; in such cases, a short oligonu-cleotide probe complementary to the CP can be added to the ima-ging solution at a sufficient concentration (e.g., > 10 nM) to satu-rate any non-target-bound CPs at the imaging surface.
3. Competitor oligonucleotides: to block transient binding to closelyrelated sequences, short unlabeled oligonucleotides may be includedin the imaging solution. For instance, in the detection of EGFR
L858R presented in this work, an 8-nucleotide probe com-plementary to the wild-type (WT) sequence – a so-called WT com-petitor – is used to reduce binding of the FP to the WT EGFR se-quence.
4. Secondary structure blockers: short (10–14 nucleotide) oligonu-cleotide probes complementary to the regions of the target that aredirectly adjacent to the CP and/or FP binding region can be useful inimproving both capture efficiency and accessibility of the target tothe FP. These may be added either prior to surface capture or in theimaging buffer.
2.4. Slide and sample cell preparation
2.4.1. Surface functionalizationThe objectives of surface functionalization are twofold: first, to
passivate the imaging surface against excessive nonspecific binding ofthe FP and other components; and second, to provide an affinity tag,usually biotin, that can be used for subsequent immobilization of theCP. Whether glass coverslips or microscope slides are used as theimaging surface, a typical surface functionalization is performed asfollows, based on a published protocol [41].
First, the slides or coverslips (hereafter referred to as “slides”) areplaced in a slide staining jar (Coplin-type) and sonicated for 10min in1M KOH. The KOH is removed, and the slides are washed at least threetimes with deionized water. Next, the slides are immersed for 20min inan aqueous “base piranha” solution consisting of 14.3% v/v ammoniumhydroxide and 14.3% v/v hydrogen peroxide that is heated to 60–70 °C.The slides are rinsed at least three times with deionized water (op-tionally, if fused silica slides are being re-used, they may be heated for∼1min with a propane torch at this step to burn off any residual mi-croscopic contaminants). The slides are then rinsed once with acetone(HPLC purity or higher).
Next, the slides are immersed in a 2% v/v solution of (3-amino-propyl)triethoxysilane (ATPES) in acetone for 10min, sonicated for1min, and incubated for another 10min. The APTES/acetone solutionis discarded and the slides are immediately rinsed 3–5 times withdeionized water, then dried completely under nitrogen flow. The slidesare now functionalized with surface amines for further reaction with N-hydroxysuccinimidyl esters of polyethylene glycol (PEG) and biotin-PEG.
To functionalize the slides with biotin-PEG and PEG, a 1:10 mixtureof biotin-PEG-succinimidyl valerate (biotin-PEG-SVA, MW ∼5000,Laysan Bio, Inc.) and methoxy-PEG-succinimidylvalerate (mPEG-SVA,MW ∼5000, Laysan Bio, Inc.) is dissolved in freshly prepared 0.1MNaHCO3 to a final total PEG concentration of 21.6% w/v. The mixtureis briefly centrifuged (1min at 10,000 rpm in a benchtop Eppendorfmicrocentrifuge) to remove any suspended air bubbles, and 70–80 µL ofthe PEG solution is immediately sandwiched between two slides,making sure to exclude air bubbles. The slide sandwiches are kept in ahumidified environment in the dark at room temperature for 2–3 h. Theslides are then carefully disassembled, placed in a slide staining jar(keeping track of the orientation of the coated side) and rinsed at leastthree times with deionized water, then dried completely under nitrogenflow.
Remaining surface amines are quenched with dis-ulfosuccinimidyltartrate (sulfo-DST, Soltec Ventures) to reduce non-specific binding of nucleic acids to the surface, as follows. A 10-mgportion of sulfo-DST is dissolved in 350 µL of 1M aqueous NaHCO3,briefly centrifuged (1min at 10,000 rpm in a benchtop Eppendorf mi-crocentrifuge), and 70–80 µL of the solution is immediately sandwichedbetween two slides with the PEG-functionalized surfaces pointing in-ward towards the sulfo-DST solution. The slide sandwiches are in-cubated in a humidified chamber for 30min at room temperature, thenrinsed thoroughly with deionized water and dried completely with ni-trogen. The slides are stored in the dark under air for up to 2 weeks, orin a desiccator (preferably under inert gas or vacuum) for several
A. Johnson-Buck et al. Methods 153 (2019) 3–12
7
weeks.
2.4.2. Sample cellsFor prism-type TIRF microscopy experiments, fluidic sample cells
are constructed using two pieces of double-sided tape sandwiched be-tween a quartz slide and glass coverslip as previously described [42](Fig. 2E). Optional drilling of holes in the backing slide and attachmentof Tygon tubing permits convenient buffer exchange, while use ofquartz microscope slides permits them to be cleaned with detergent andre-used [42], though cheaper borosilicate glass slides may also be used.After use, these slides can be disassembled and re-cleaned as follows:immerse in boiling water for 30min; carefully peel off any tape andadhesive with a razor blade; rub slide thoroughly with a thick paste ofan abrasive detergent such as Alconox; then rinse thoroughly withdeionized water and subject to the cleaning protocol in Section 2.4.1.Note that no visible residue of adhesive should remain on the slide priorto beginning the protocol of Section 2.4.1.
For objective-type TIRF microscopy measurements, sample cells areconstructed by fixing a cut 1-cm length of a pipet tip (e.g., Eppendorfbrand) to a coverslip using epoxy adhesive (Double Bubble, HardmanAdhesives; Fig. 2C). We have also successfully employed 3D-printedsample cells (Fig. 2D) that have a smaller area of contact with thecoverslip (∼0.2mm2) and a tapered base that permits the use of as littleas 5–10 µL of analyte solution without sacrificing sensitivity. Thecustom design was prepared in Autodesk Fusion 360 and printed on aProJet 3500 using the M3 Crystal resin at the highest print resolution of16 µm per layer. As with the pipet tip sample cells, the 3D-printedsample cells are attached to coverslips with epoxy adhesive, but in thiscase the attachment is performed with the aid of an electronics vise(e.g., PanaVise) to firmly hold the 3D-printed wells against the cover-slip during the application of epoxy to prevent the adhesive fromseeping in and clogging the small aperture between the interior of thesample well and the coverslip. While the sandwich-type flow cell can beused on objective TIRF as well, the sample cells constructed from pipettips or tall 3D-printed wells provide higher sensitivity because of ahigher ratio between the volume of analyte solution and the contactarea with the coverslip; that is, a larger fraction of the analyte may becaptured in a small region of the imaging surface, yielding more de-tectable molecules per field of view. One drawback of the sample cellsconstructed from pipet tips and 3D-printed wells is they are both forone-time use only. Regardless of type, the completed sample cells maybe stored in a dry, inert, dark environment for several weeks prior touse in SiMREPS.
2.5. Surface capture of the target analyte
The following protocol applies to all sample cell types with biotin-PEG-functionalized surfaces, but for the sake of clarity all solution vo-lumes apply specifically to sample wells constructed from cut pipet tips,which were used to collect all data presented in this study. Beforeimaging, the slide surface is briefly washed with 100 μL T50 buffer(10mM Tris-HCl, 50mM NaCl, pH 8.0) followed by the addition of40 µL of 1mg/ml streptavidin to the sample well. After 10min, thestreptavidin solution is removed and the surface is washed three timeswith 100 µL of 1× PBS. The surface is then incubated with 40 µL of asolution containing 100 nM of the appropriate biotinylated LNA captureprobe in 1× PBS buffer for 10min. The solution is removed and thenthe sample cell is washed three times with 100 µL of 1× PBS. Finally, a100-μl portion of sample containing the target RNA or DNA and 2 µMcarrier oligonucleotide is introduced into the sample chamber and in-cubated for 1 h to capture the analyte at the imaging surface. Note thatdouble-stranded DNA samples must first be denatured by, for example,heating to 95 °C in the presence of 2 µM carrier oligonucleotide, thencooling to room temperature in a water bath for 5min before adding tothe sample cell. For direct capture of analytes from crude biofluids suchas cell extract or serum, a pre-incubation step in ∼2% (w/v) sodium
dodecyl sulfate (SDS) and 0.16 U/µL of proteinase K (New EnglandBioLabs, Inc.) is used to liberate nucleic acids from any protein bindingpartners as well as to inactivate any nucleases present in the sample[23]. After the 1-h capture incubation, the sample solution is removed,and 1× PBS buffer is added to the sample cell until the imaging buffer(see Section 2.6) is added. Note that, while analytes can be capturedfrom crude biofluids [23], the imaging should still be performed in astandard imaging buffer to ensure reproducible probe binding anddissociation kinetics.
2.6. Imaging
All data discussed in this paper were collected using an Olympus IX-81 objective-type TIRF microscope equipped with a 60× oil-immersionobjective (APON 60×OTIRF, 1.49 NA) with both Cell^TIRF and z-driftcontrol (ZDC2) modules, and an EMCCD camera (IXon 897, Andor, EMgain 300). Cy5 excitation was provided by a 640-nm red laser (CoherentCUBE 640-100C, 100mW) and Cy3 excitation by a 532-nm green laser(CrystaLaser CL532-150mW-L). To delay the photobleaching of fluor-ophores and thus obtain more accurate measurements of the bound-state lifetime of the FP, a 25 nM solution of the FP is prepared in animaging buffer containing 4× PBS, 2.5mM 3,4-dihydroxybenzoate,25 nM protocatechuate dioxygenase, 1 mM Trolox (oxygen scavengersystem, OSS [43]), and added to the sample chamber for SiMREPSimaging. The imaging solution for EGFR L858R mutant and wild-typediscrimination in this study also includes 100 nM of a WT competitorsequence to block FP binding to the WT EGFR sequence. Usually3–5min are allowed for the OSS to achieve a low steady-state oxygenconcentration before imaging. The transient binding of FP to capturedtarget molecules is monitored for 10min under TIRF illumination, witha movie acquisition rate of 2 Hz and an EM gain setting of 150. Allimaging is performed at a darkened room at an environmentally con-trolled temperature of 20 ± 3 °C.
The high ionic strength of the imaging buffer promotes rapidbinding of the FP to the target [35], allowing for many cycles of FPbinding and dissociation within the 10-min observation period for well-optimized FP sequences. The concentration of FP in the imaging buffermay be adjusted, but typically is optimal in the range of 25–50 nM;lower concentrations will reduce the frequency of FP binding, whilemuch higher concentrations will result in prohibitively high levels ofbackground fluorescence from freely diffusing probes during imaging. Ifdissociation kinetics of the FP are relatively slow, for instance due to alonger or more GC-rich FP sequence, denaturants such as 10–30%formamide can be used to decrease the duration of the bound state,albeit at greater risk of target dissociating from the CP during the ex-periment.
The length of the observation period for each field of view is aparticularly important parameter, since enough time must be allowedfor multiple (e.g., > 10) cycles of binding and dissociation to eachsurface-bound analyte molecule, thus permitting adequate separationbetween specific and nonspecific binding signatures for zero-back-ground measurements. The exact imaging time required is dependenton the kinetics of specific and nonspecific binding, as well as the degreeof separation between signal and background peaks that is desired. Auseful guideline for selecting a minimum observation time is embodiedin the following relationship [23]:
≥′ +
′
+
−t s
k kk k
ff
2(1 )
(1 ),bind diss
bind diss
22
2 (1)
where t is the observation time, s is the desired number of standarddeviations separating the signal and background peaks, ′kbind is thepseudo-first order binding rate constant for the query probe to thetarget, kdiss is the first-order dissociation rate constant of the queryprobe from the target, and =
⟨ ⟩
⟨ ⟩
+
+f
NNb d nonspecific
b d specificis the ratio between the
average number of nonspecific binding and dissociation events
A. Johnson-Buck et al. Methods 153 (2019) 3–12
8

observed per trace ⟨ ⟩+N( )b d nonspecific and the average number of specificbinding and dissociation events observed per trace ⟨ ⟩+N( )b d specific . Forexample, if a separation of s=3 standard deviations is desired betweensignal and background, and with ′kbind =5min−1, =kdiss =5min−1, and
=⟨ ⟩
⟨ ⟩
+
+f
NNb d nonspecific
b d specific=0.1, the minimum observation time is 3.9min. The
sampling interval (exposure time per frame) should be significantly lessthan the smaller of τbound and τunbound; in the above example, sig-nificantly less than 0.2 min, e.g.,∼1 s per frame (sampling frequency of∼1 Hz).
2.7. Data analysis for kinetic fingerprinting
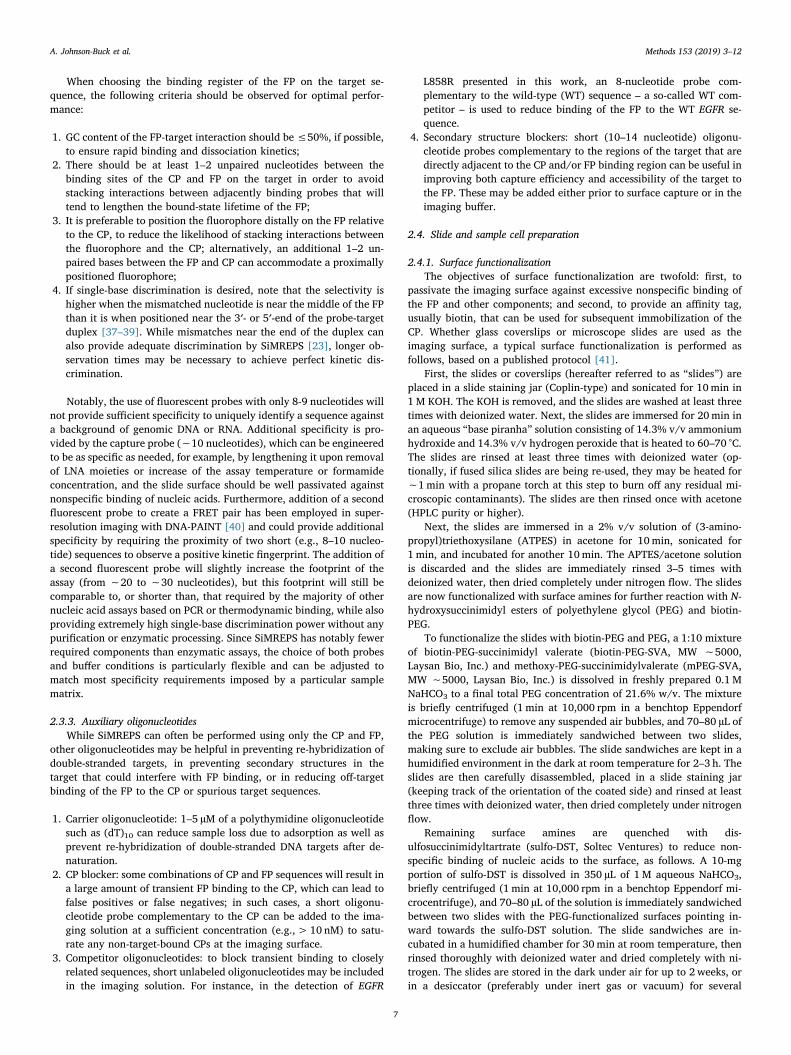
Software for SiMREPS data analysis is available for non-commercial,academic use from the University of Michigan Office of TechnologyTransfer (http://inventions.umich.edu/technologies/6250-1_simreps-analysis-software-v-1-0), along with a user guide and links to exampleinput and output files. A typical analysis of movies from SiMREPS ex-periments consists of the following steps: 1) identification of “candi-date” regions of interest (ROIs) within the image exhibiting greaterframe-to-frame intensity fluctuations than their surrounding pixels(Fig. 3A-B); 2) calculating the frame-by-frame fluorescence intensity ofeach ROI (Fig. 3C), 3) hidden Markov modelling (HMM) to calculate FPbinding and dissociation kinetics for single-molecule kinetic finger-printing (Fig. 3D); and 4) application of filters to distinguish nonspecificfrom specific binding based on signal-to-noise, intensity, and FP ki-netics (Fig. 3E). Prior to step 1), a software-based drift correction maybe applied to compensate for lateral stage drift during the experiment,though this is often not necessary if the microscope system is
sufficiently stable (e.g., < 3 pixels of drift during the 10-min movie).candidate region. Upon request, MATLAB scripts for all the necessaryprocessing steps below can be provided.
2.7.1. Identifying candidate ROIsFor optional drift correction, a custom routine written in Matlab
(available upon request) based on the subpixel correlation betweenconsecutive recorded images can be used to compensate for any x-ystage drift that would interfere with subsequent intensity-versus-timeanalysis of candidate ROIs. After this optional step, candidateROIs—generally 5-pixel× 5-pixel regions with significant frame-to-frame intensity fluctuations—are identified as follows. Each of the Nmovie frames is subtracted from the previous frame and the absolutevalue taken to generate a new image of the same dimensions as theoriginal, but in which each pixel value represents the absolute value ofthe intensity change from the previous frame to the current frame. Thisis repeated for all movie frames, resulting in a new image stack with (N-1) frames. Finally, the value of each pixel in this image stack is aver-aged, resulting in a single image called a “fluctuation map” containingthe average frame-to-frame change in intensity for each pixel. Pixelsrepresenting local maxima within this image are selected to serve as thecenter pixel of each candidate ROI for further processing.
2.7.2. Calculation of intensity-versus-time tracesThe intensity-versus-time trace for each candidate ROI identified
from the fluctuation map is generated as follows. Within the first frameof the originalmovie file, the intensity of all 25 pixels within the 5-pixel-×5-pixel ROI is summed to create a single fluorescence value, and the
Fig. 3. Data analysis pipeline. (A) Single-frame images of representative fields of view from TIRF microscopy. (B) Intensity fluctuation maps of the fields of viewshown in (A). Grey circles indicate positions of local maxima in the fluctuation map, from which candidate ROIs are identified for further analysis by generation ofintensity vs. time traces. (C) Representative intensity vs. time traces generated from the ROIs identified in (B), circled in yellow. (D) HMM idealization (red lines) foreach intensity vs. time trace. Bound and unbound-state dwell times (τbound and τunbound, respectively) are indicated by the orange and blue horizontal line segmentsabove the idealization. (E) Candidates in the positive (orange circles) and negative (blue squares) controls for miR-16 are well separated by thresholds of Nb+d > 20and τbound > 2.5 s (black dashed lines), permitting discrimination of specific and nonspecific binding at the single-molecule level. Data are pre-filtered for signal-to-noise > 2.5 and intensity > 1000. (F) miR-16 standard curve. n=3 replicates for blank, 2 replicates for other measurements. Error bars represent 1 standarddeviation. (For interpretation of the references to colour in this figure legend, the reader is referred to the web version of this article.)
A. Johnson-Buck et al. Methods 153 (2019) 3–12
9
median intensity value of the 2-pixel-wide region surrounding the ROIis subtracted to find the background-subtracted intensity of this ROIwithin the first frame. This process is repeated for each frame of themovie, and the list of intensity values combined to create an intensity-versus-time trajectory for this ROI. The process is repeated for each ROIidentified from the fluctuation map, and the intensity-versus-time tra-jectories are exported as an ASCII file for import into the HMM softwareQuB [44].
2.7.3. Hidden Markov modelingThe traces are imported into the HMM software QuB and fit using a
two-state model. Proper parametrization is essential for convergence ofHMM fitting; that is, the amplitudes, standard deviations, and kineticsshould be as close as possible to the expected behavior of the FP bindingto the target, and ideally within ∼1 order of magnitude. It is importantto use the same model to fit all datasets that are to be compared. TheHMM fitting results table from QuB is exported for further analysis ofthe intensity and kinetics in MATLAB.
2.7.4. Filtering specific from nonspecific bindingA binary classification is performed on each candidate ROI based on
whether its intensity-versus-time trace satisfies certain criteria. Thecriteria are established by an empirical evaluation of traces collected innegative and positive control experiments—e.g., in the absence andpresence of 500 fM synthetic target nucleic acid—and chosen so as toreject essentially all traces in the negative controls while accepting asmany traces as possible in the positive controls. Since nonspecificbinding of the probe to the surface can vary somewhat between cov-erslip or slide preparations, it is generally advisable to establish thesecriteria based on several independent technical replicates, preferably ondifferent days. While the specific criteria will vary depending on factorssuch as the target, FP sequence and concentration, imaging buffer, andacquisition temperature, in this study a candidate ROI is considered tocontain a true positive signature of the analyte if it satisfies the fol-lowing criteria:
• Intensity difference between bound state and unbound state(ΔI) > 1000 counts for detection of miR-16,> 500 counts for de-tection of EGFR L858R
• Signal-to-noise (ΔI/σ, where σ is the standard deviation of the in-tensity in the FP-unbound state)> 2.5 for miR-16,> 2 for EGFRL858R
• Number of FP binding and dissociation events per observationperiod, Nb+d≥ 20
• Median lifetime in the FP-bound state, τbound,median > 4 s for miR-16,> 5 s and< 20 s for EGFR L858R
• Median lifetime in the FP-unbound state, τunbound,median > 0 for miR-16,> 20 s and< 50 s for EGFR L858R
All traces satisfying these criteria are counted as true positives, andthose that do not are considered to show insufficient evidence to becounted as true positives. Of the above criteria, the most critical forrejecting false positives (as determined from negative control mea-surements) tend to be Nb+d and τbound,median.
3. Results and discussion
In negative control measurements with imaging buffer containingthe FP, but in the absence of the target analyte, a considerable numberof FP binding events were always observed—typically numbering in thehundreds—suggesting that transient or long-lasting interactions be-tween the FP and the imaging surface were difficult to suppress entirely(Fig. 1D). In a conventional analysis without kinetic fingerprinting, itwould be necessary to subtract these counts from all measurements asbackground; however, the large standard deviation of this background(Fig. 1D) would impose a limit of detection (LOD) of hundreds of
captured target molecules per FOV.In contrast, by applying the kinetic filtering criteria as outlined in
Section 2.7, essentially all of these background counts were filtered outin the negative control experiments (Fig. 1D), permitting the confidentidentification and counting of even single-digit numbers of target mo-lecules per FOV. This is because, through repeated sampling of the samesurface-immobilized target molecules through multiple cycles of FPbinding, a progressively better estimate of kinetic parameters such asNb+d, τbound,median, and τunbound,median was obtained for each candidateROI, and it became easier to resolve true and false positives by a binaryclassification based on the kinetic criteria outlined in Section 2.7(Fig. 3E). The number of accepted counts (candidate ROIs that passkinetic filtering) was linear within the range of approximately 1–800molecules per FOV, as shown by the standard curve for miR-16(Fig. 3F). Due to the essentially zero background, even 0.5 fM miR-16yielded significant counts above the negative control, resulting in anLOD that was mainly limited by the capture efficiency of analyte on theimaging surface rather than on background binding of the FP or auto-fluorescence of the imaging surface. In terms of absolute concentration[45], the calculated limit of blank (LOB) of this assay is 0 (since noblank counts were detected), and the estimated LOD is 0.4 fM.
If more than ∼500 molecules are present in a FOV, the diffraction-limited analysis presented here will result in a sub-linear increase andeventually a decrease in the accepted counts due to the inability toresolve closely spaced molecules. If it is desired to extend the dynamicrange beyond this ∼2.5 orders of magnitude into the range of thou-sands of molecules per FOV or more, it will likely be necessary to switchto a more conventional quantification scheme based on fluorescenceintensity, or to implement super-resolution methods to analyze the ki-netics of FP binding with sub-pixel accuracy [29]. Indeed, one recentpaper describes the use of super-resolution imaging and kinetic analysisof dissociation kinetics to discriminate single-nucleotide variants inDNA with 95% accuracy [46].
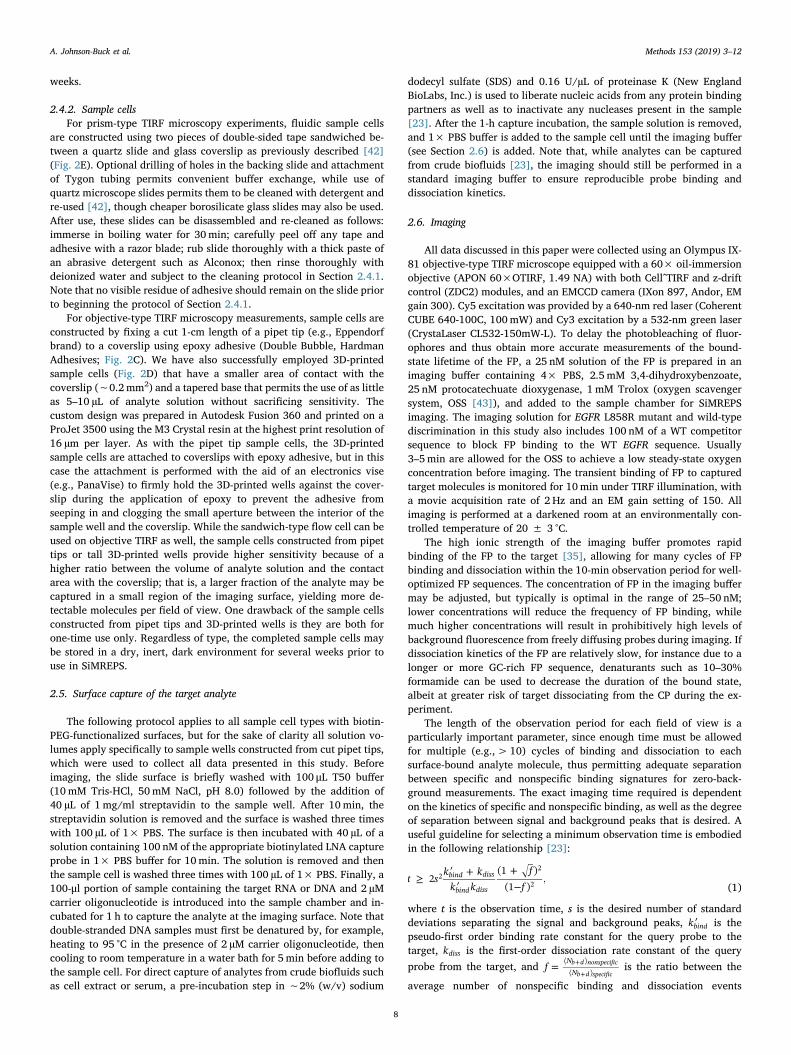
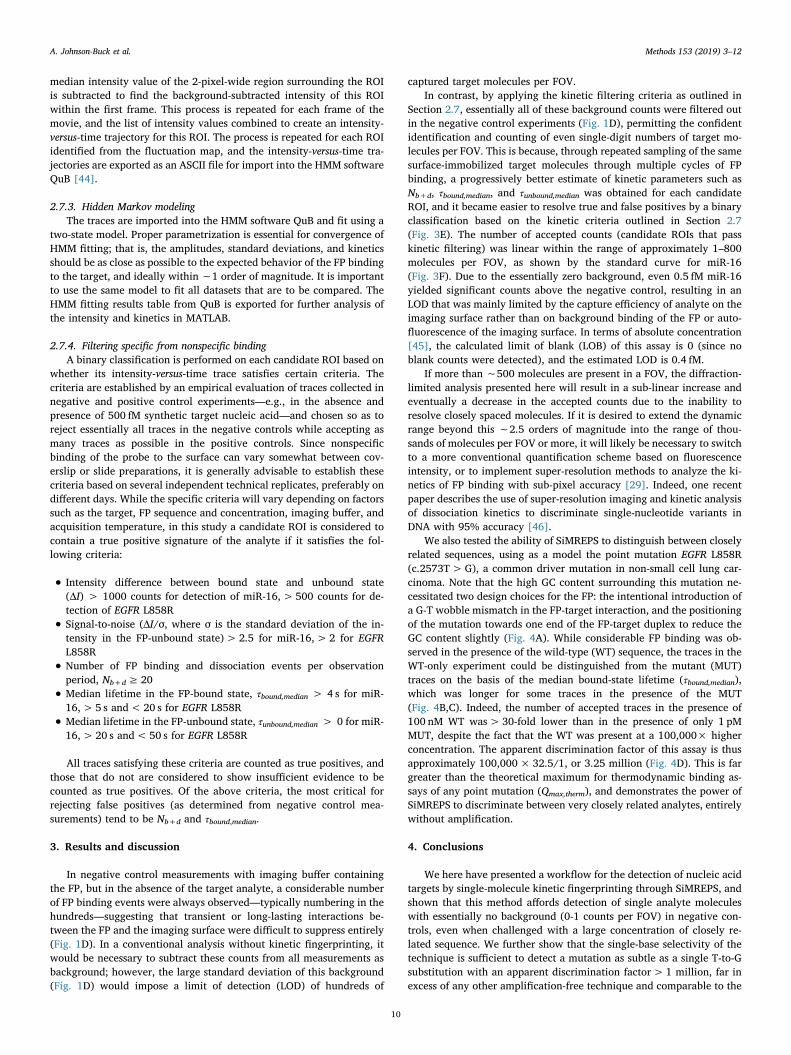
We also tested the ability of SiMREPS to distinguish between closelyrelated sequences, using as a model the point mutation EGFR L858R(c.2573T>G), a common driver mutation in non-small cell lung car-cinoma. Note that the high GC content surrounding this mutation ne-cessitated two design choices for the FP: the intentional introduction ofa G-T wobble mismatch in the FP-target interaction, and the positioningof the mutation towards one end of the FP-target duplex to reduce theGC content slightly (Fig. 4A). While considerable FP binding was ob-served in the presence of the wild-type (WT) sequence, the traces in theWT-only experiment could be distinguished from the mutant (MUT)traces on the basis of the median bound-state lifetime (τbound,median),which was longer for some traces in the presence of the MUT(Fig. 4B,C). Indeed, the number of accepted traces in the presence of100 nM WT was> 30-fold lower than in the presence of only 1 pMMUT, despite the fact that the WT was present at a 100,000× higherconcentration. The apparent discrimination factor of this assay is thusapproximately 100,000×32.5/1, or 3.25 million (Fig. 4D). This is fargreater than the theoretical maximum for thermodynamic binding as-says of any point mutation (Qmax,therm), and demonstrates the power ofSiMREPS to discriminate between very closely related analytes, entirelywithout amplification.
4. Conclusions
We here have presented a workflow for the detection of nucleic acidtargets by single-molecule kinetic fingerprinting through SiMREPS, andshown that this method affords detection of single analyte moleculeswith essentially no background (0-1 counts per FOV) in negative con-trols, even when challenged with a large concentration of closely re-lated sequence. We further show that the single-base selectivity of thetechnique is sufficient to detect a mutation as subtle as a single T-to-Gsubstitution with an apparent discrimination factor> 1 million, far inexcess of any other amplification-free technique and comparable to the
A. Johnson-Buck et al. Methods 153 (2019) 3–12
10
best available methods (i.e., droplet digital PCR). The ability ofSiMREPS to accommodate very short (< 25 nt) analyte sequences, andthose captured from crude biofluids with minimal processing, are un-ique advantages relative to most amplification-based methods. To makethe technique more widely applicable and convenient, future im-provements may include the use of techniques to improve mass transferof analytes to the surface in order to increase the density of capturedanalyte, thus increasing sensitivity; modified probe or assay designs topermit more rapid cycling between bound and unbound states toshorten the imaging time needed to reach any desired level of specifi-city; and/or automated signal detection and counting algorithms. Forinstance, while published data here and elsewhere [23] indicate typicallimits of detection of ∼1 fM for passive analyte capture in our standardpipet-tip sample cells (Fig. 2c), further exploratory work suggests thatattomolar detection limits may be achievable in the near future (datanot shown); furthermore, in theory, even single-digit copy numberscould be detected with sufficiently high capture efficiency. Further-more, there is no fundamental limit to the type of analyte that canaccurately be detected and quantified using SiMREPS, making it auniversal platform that – with further refinements – may transformbiomarker detection just as super-resolution has conventional fluores-cence microscopy.
Acknowledgements
The authors acknowledge support from a Michigan EconomicDevelopment Corporation MTRAC for Life Sciences grant to M.T.,N.G.W., and A.J-B.; pilot grants from the University of the MichiganMCubed 2.0 program, the James Selleck Bower Permanently EndowedInnovative Promise Funds for Cancer Research of the University ofMichigan Rogel Cancer Center, and the Fast Forward GI InnovationFund to N.G.W. and M.T.; and NIH grant R21 CA204560 to N.G.W. andM.T. The authors also wish to thank X. Su for acquisition of the miR-16data used in Fig. 3; S.L. Hayward and P.A. Lund for technical discus-sions regarding DNA detection as well as contributions to SiMREPSanalysis code; and the Single Molecule Analysis in Real-Time (SMART)
Center of the University of Michigan, seeded by NSF MRI-R2-ID awardDBI-0959823 to N.G.W., as well as J.D. Hoff for training, technicaladvice and use of the objective-type TIRF microscope.
Declaration of interest
The University of Michigan has filed patent applications related tothe single-molecule kinetic fingerprinting approach described herein,on which A.J.B, M.T. and N.G.W. are co-inventors. A.J.B., M.T., andN.G.W. are co-founders of a startup company, aLight Sciences LLC,which seeks to commercialize this technology.
Appendix A. Supplementary data
Supplementary data associated with this article can be found, in theonline version, at https://doi.org/10.1016/j.ymeth.2018.08.002.
References
[1] L.B. Alexandrov, S. Nik-Zainal, D.C. Wedge, S.A.J.R. Aparicio, S. Behjati,A.V. Biankin, G.R. Bignell, N. Bolli, A. Borg, A.-L. Børresen-Dale, S. Boyault,B. Burkhardt, A.P. Butler, C. Caldas, H.R. Davies, C. Desmedt, R. Eils, J.E. Eyfjörd,J.A. Foekens, M. Greaves, F. Hosoda, B. Hutter, T. Ilicic, S. Imbeaud, M. Imielinski,N. Jäger, D.T.W. Jones, D. Jones, S. Knappskog, M. Kool, S.R. Lakhani, C. López-Otín, S. Martin, N.C. Munshi, H. Nakamura, P.A. Northcott, M. Pajic,E. Papaemmanuil, A. Paradiso, J.V. Pearson, X.S. Puente, K. Raine, M. Ramakrishna,A.L. Richardson, J. Richter, P. Rosenstiel, M. Schlesner, T.N. Schumacher,P.N. Span, J.W. Teague, Y. Totoki, A.N.J. Tutt, R. Valdés-Mas, M.M. van Buuren,L. van ’t Veer, A. Vincent-Salomon, N. Waddell, L.R. Yates, A.P.C.G. Initiative, I.B.C.Consortium, I.M.-S. Consortium, I. PedBrain, J. Zucman-Rossi, P.A. Futreal,U. McDermott, P. Lichter, M. Meyerson, S.M. Grimmond, R. Siebert, E. Campo,T. Shibata, S.M. Pfister, P.J. Campbell, M.R. Stratton, Signatures of mutationalprocesses in human cancer, Nature 500 (2013) 415–421.
[2] M. Li, W. Chen, N. Papadopoulos, S.N. Goodman, N.C. Bjerregaard, S. Laurberg,B. Levin, H. Juhl, N. Arber, H. Moinova, K. Durkee, K. Schmidt, Y. He, F. Diehl,V.E. Velculescu, S. Zhou, L.A.D. Jr, K.W. Kinzler, S.D. Markowitz, B. Vogelstein,Sensitive digital quantification of DNA methylation in clinical samples, Nat.Biotechnol. 27 (2009) 858–863.
[3] M. Murtaza, S.-J. Dawson, D.W.Y. Tsui, D. Gale, T. Forshew, A.M. Piskorz,C. Parkinson, S.-F. Chin, Z. Kingsbury, A.S.C. Wong, F. Marass, S. Humphray,J. Hadfield, D. Bentley, T.M. Chin, J.D. Brenton, C. Caldas, N. Rosenfeld, Non-
Fig. 4. Single-base selectivity of SiMREPS. (A) Sequences of WT and L858R MUT targets, as well as the capture probe (CP), MUT fluorescent probe (FP) and WTcompetitor. (B) Representative intensity vs. time trace from MUT-only positive control. (C) Representative intensity vs. time trace from WT-only control. (D) Theaccepted counts after kinetic filtering of traces collected in the presence of 100 nM EGFR WT or 1 pM L858R MUT. The apparent discrimination factor between MUTand WT is 3.25 million.
A. Johnson-Buck et al. Methods 153 (2019) 3–12
11

invasive analysis of acquired resistance to cancer therapy by sequencing of plasmaDNA, Nature 497 (2013) 108–112.
[4] E. Crowley, F.D. Nicolantonio, F. Loupakis, A. Bardelli, Liquid biopsy: monitoringcancer-genetics in the blood, Nat. Rev. Clin. Oncol. 10 (2013) 472–484.
[5] J. Ansari, J.W. Yun, A.R. Kompelli, Y.E. Moufarrej, J.S. Alexander, G.A. Herrera,R.E. Shackelford, The liquid biopsy in lung cancer, Genes Cancer 7 (2016) 355–367.
[6] A.F. Gazdar, Activating and resistance mutations of EGFR in non-small-cell lungcancer: role in clinical response to EGFR tyrosine kinase inhibitors, Oncogene 28(2009) S24–S31.
[7] M. Lu, Q. Zhang, M. Deng, J. Miao, Y. Guo, W. Gao, Q. Cui, An analysis of humanmicroRNA and disease associations, PLOS ONE 3 (2008) e3420.
[8] H. Schwarzenbach, D.S.B. Hoon, K. Pantel, Cell-free nucleic acids as biomarkers incancer patients, Nat. Rev. Cancer 11 (2011) 426–437.
[9] P.S. Mitchell, R.K. Parkin, E.M. Kroh, B.R. Fritz, S.K. Wyman, E.L. Pogosova-Agadjanyan, A. Peterson, J. Noteboom, K.C. O’Briant, A. Allen, D.W. Lin, N. Urban,C.W. Drescher, B.S. Knudsen, D.L. Stirewalt, R. Gentleman, R.L. Vessella,P.S. Nelson, D.B. Martin, M. Tewari, Circulating microRNAs as stable blood-basedmarkers for cancer detection, Proc. Natl. Acad. Sci. 105 (2008) 10513–10518.
[10] M.V. Iorio, C.M. Croce, MicroRNA dysregulation in cancer: diagnostics, monitoringand therapeutics. A comprehensive review, EMBO Mol. Med. 4 (2012) 143–159.
[11] A. Necsulea, M. Soumillon, M. Warnefors, A. Liechti, T. Daish, U. Zeller, J.C. Baker,F. Grützner, H. Kaessmann, The evolution of lncRNA repertoires and expressionpatterns in tetrapods, Nature 505 (2014) 635–640.
[12] J.R. Prensner, A.M. Chinnaiyan, The emergence of lncRNAs in cancer biology,Cancer Discov. 1 (2011) 391–407.
[13] J.T. Lee, Epigenetic regulation by long noncoding RNAs, Science 338 (2012)1435–1439.
[14] V. Potapov, J.L. Ong, Examining sources of error in PCR by single-molecule se-quencing, PLoS ONE 12 (2017).
[15] G. Chen, S. Mosier, C.D. Gocke, M.-T. Lin, J.R. Eshleman, Cytosine deamination is amajor cause of baseline noise in next-generation sequencing, Mol. Diagn. Ther. 18(2014) 587–593.
[16] M.G. Ross, C. Russ, M. Costello, A. Hollinger, N.J. Lennon, R. Hegarty, C. Nusbaum,D.B. Jaffe, Characterizing and measuring bias in sequence data, Genome Biol. 14(2013) R51.
[17] A. Akane, K. Matsubara, H. Nakamura, S. Takahashi, K. Kimura, Identification ofthe heme compound copurified with deoxyribonucleic acid (DNA) from bloodstains,a major inhibitor of polymerase chain reaction (PCR) amplification, J. Forensic Sci.39 (1994) 13607J.
[18] J. Satsangi, D.P. Jewell, K. Welsh, M. Bunce, J.I. Bell, Effect of heparin on poly-merase chain reaction, Lancet 343 (1994) 1509–1510.
[19] Z. Jin, D. Geißler, X. Qiu, K.D. Wegner, N. Hildebrandt, A. Rapid, Amplification-free, and sensitive diagnostic assay for single-step multiplexed fluorescence detec-tion of microRNA, Angew. Chem. Int. Ed. 54 (2015) 10024–10029.
[20] K. Kim, J.-W. Oh, Y.K. Lee, J. Son, J.-M. Nam, Associating and dissociating nano-dimer analysis for quantifying ultrasmall amounts of DNA, Angew. Chem. Int. Ed.56 (2017) 9877–9880.
[21] L. Cohen, M.R. Hartman, A. Amardey-Wellington, D.R. Walt, Digital direct detec-tion of microRNAs using single molecule arrays, Nucleic Acids Res. 45 (2017) e137.
[22] D.Y. Zhang, S.X. Chen, P. Yin, Optimizing the specificity of nucleic acid hy-bridization, Nat. Chem. 4 (2012) 208–214.
[23] A. Johnson-Buck, X. Su, M.D. Giraldez, M. Zhao, M. Tewari, N.G. Walter, Kineticfingerprinting to identify and count single nucleic acids, Nat. Biotechnol. 33 (2015)730–732.
[24] S.J. Sahl, S.W. Hell, S. Jakobs, Fluorescence nanoscopy in cell biology, Nat. Rev.Mol. Cell Biol. 18 (2017) 685–701.
[25] Wide Field of View | Yokogawa Electric Corporation. https://www.yokogawa.com/solutions/products-platforms/life-science/spinning-disk-confocal/csu-w1-confocal-scanner-unit/, 2018 (accessed: 16 May 2018).
[26] Home - Oxford Nanoimaging. https://www.oxfordni.com/, 2018 (accessed: 16 May2018).
[27] X. Su, Z. Li, X. Yan, L. Wang, X. Zhou, L. Wei, L. Xiao, C. Yu, Telomerase activitydetection with amplification-free single molecule stochastic binding assay, Anal.Chem. 89 (2017) 3576–3582.
[28] X. Su, L. Li, S. Wang, D. Hao, L. Wang, C. Yu, Single-molecule counting of pointmutations by transient DNA binding, Sci. Rep. 7 (2017) 43824.
[29] S.L. Hayward, P.E. Lund, Q. Kang, A. Johnson-Buck, M. Tewari, N.G. Walter, Ultra-specific and amplification-free quantification of mutant DNA by single-moleculekinetic fingerprinting, under review.
[30] Nucleic acid analogues. https://www.atdbio.com/content/12/Nucleic-acid-analo-gues, 2018 (accessed: 16 May 2018).
[31] TM Prediction Tool. https://www.exiqon.com/ls/Pages/ExiqonTMPredictionTool.aspx, 2018 (accessed: 16 May 2018).
[32] NUPACK: Analysis input. http://www.nupack.org/partition/new, 2018 (accessed:16 May 2018).
[33] OligoAnalyzer 3.1 | IDT. https://www.idtdna.com/calc/analyzer, 2018 (accessed:16 May 2018).
[34] Oligo Optimizer Tool. https://www.exiqon.com/ls/Pages/ExiqonOligoOptimizerTool.aspx, 2018 (accessed: 16 May 2018).
[35] N.F. Dupuis, E.D. Holmstrom, D.J. Nesbitt, Single-molecule kinetics reveal cation-promoted DNA duplex formation through ordering of single-stranded helices,Biophys. J. 105 (2013) 756–766.
[36] R.D. Blake, S.G. Delcourt, Thermodynamic effects of formamide on DNA stability,Nucleic Acids Res. 24 (1996) 2095–2103.
[37] I.I. Cisse, H. Kim, T. Ha, A rule of seven in Watson-Crick base-pairing of mismatchedsequences, Nat. Struct. Mol. Biol. 19 (2012) 623–627.
[38] R. Dahse, A. Berndt, H. Kosmehl, PCR-based testing for therapy-related EGFR mu-tations in patients with non-small cell lung cancer, Anticancer Res. 28 (2008)2265–2270.
[39] M. Sanromán-Iglesias, C.H. Lawrie, L.M. Liz-Marzán, M. Grzelczak, Nanoparticle-based discrimination of single-nucleotide polymorphism in long DNA sequences,Bioconjug. Chem. 28 (2017) 903–906.
[40] A. Auer, M.T. Strauss, T. Schlichthaerle, R. Jungmann, Fast, Background-free DNA-PAINT imaging using FRET-based probes, Nano Lett. 17 (2017) 6428–6434.
[41] J. Abelson, M. Blanco, M.A. Ditzler, F. Fuller, P. Aravamudhan, M. Wood, T. Villa,D.E. Ryan, J.A. Pleiss, C. Maeder, C. Guthrie, N.G. Walter, Conformational dynamicsof single pre–mRNA molecules during in vitro splicing, Nat. Struct. Mol. Biol. 17(2010) 504–512.
[42] N. Michelotti, C. de Silva, A.E. Johnson-Buck, A.J. Manzo, N.G. Walter, Chapter six– A bird’s eye view: tracking slow nanometer-scale movements of single molecularnano-assemblies, in: N.G. Walter (Ed.), Methods in Enzymology, Academic Press,2010, pp. 121–148.
[43] C.E. Aitken, R.A. Marshall, J.D. Puglisi, An oxygen scavenging system for im-provement of dye stability in single-molecule fluorescence experiments, Biophys. J.94 (2008) 1826–1835.
[44] QUB – Markov Analysis. https://qub.mandelics.com/, 2018 (accessed: 16 May2018).
[45] D.A. Armbruster, T. Pry, Limit of blank, limit of detection and limit of quantitation,Clin. Biochem. Rev. 29 (2008) S49–S52.
[46] E.M. Peterson, J.M. Harris, Identification of individual immobilized DNA moleculesby their hybridization kinetics using single-molecule fluorescence imaging, Anal.Chem. 90 (2018) 5007–5014.
A. Johnson-Buck et al. Methods 153 (2019) 3–12
12