a guide to non-linear finite element modelling of shear and torsion in
TRANSCRIPT

A guide to non-linear finite element modelling of shear and torsion in concrete bridges
HELÉN BROO, KARIN LUNDGREN, MARIO PLOS Department of Civil and Environmental Engineering Division of Structural Engineering, Concrete Structures CHALMERS UNIVERSITY OF TECHNOLOGY Göteborg, Sweden 2008 Report 2008:18


REPORT 2008:18
A guide to non-linear finite element modelling of shear and torsion
in concrete bridges
HELÉN BROO, KARIN LUNDGREN, MARIO PLOS
Department of Civil and Environmental Engineering Division of Structural Engineering, Concrete Structures
CHALMERS UNIVERSITY OF TECHNOLOGY
Göteborg, Sweden 2008

A guide to non-linear finite element modelling of shear and torsion in concrete bridges HELÉN BROO, KARIN LUNDGREN, MARIO PLOS
© HELÉN BROO, KARIN LUNDGREN, MARIO PLOS 2008
ISSN 1652-9162 Report 2008:18 Department of Civil and Environmental Engineering Division of Structural Engineering, Concrete Structures Chalmers University of Technology SE-412 96 Göteborg Sweden Telephone: + 46 (0)31-772 1000 Chalmers reproservice Göteborg, Sweden 2008

A guide to non-linear finite element modelling of shear and torsion in concrete bridges HELÉN BROO, KARIN LUNDGREN, MARIO PLOS Department of Civil and Environmental Engineering Division of Structural Engineering, Concrete Structures Chalmers University of Technology
ABSTRACT
Non-linear finite element (FE) analysis has become an important tool for structural design and assessment of reinforced concrete structures. When shear and torsion are limiting the capacity of a structure, three dimensional non-linear finite element methods often show higher load-carrying capacity compared to conventional analyses; therefore there is much to gain by using these methods, especially at assessment of existing structures. The reason for the higher capacities evaluated are mainly a more favourable load distribution when the structure is analysed in three dimensions and that the fracture energy associated with concrete cracking is included. In order to be able to use these higher capacities in reality, it is important that the modelling method is verified and to be aware of possible limitations. Recommendations are given concerning analysis methods and how a verification can be done, both concerning the capability of the program and concerning the actual FE model.
Most important comments and recommendations are:
• It is important to note that in FE programs commercially available today, beam elements cannot describe shear cracking and shear failure or reduced torsional stiffness due to cracking. The same applies for the out-of-plane shear in shell elements.
• Most often in analysis of bridges, it is enough to assume full interaction between the reinforcement and the concrete. One exception is if the slip is important for the global response or the final failure, as if a shear failure takes place in a region where prestressing is anchored. Then the modelling should include slip between the steel and the concrete.
• It is recommended that only the fracture energy of plain concrete is taken into account when defining the softening response of concrete, i.e. when the stress-strain relationship of the concrete is defined. This will yield results on the safe side; i.e. underestimation of the capacity and overestimation of deformations and crack widths.
• It is often more stable to perform analyses using deformation control than load control. A method to enable deformation-controlled loading for several point loads by using a separate statically determined arrangement of stiff beams is described.
Comments and recommendations are also given concerning how to model important details such as supports and connections, how different loading types can be considered, how to perform the analyses, how to evaluate the results through post-processing, and how to use the results in a safety format context.
Key words: shear, torsion, concrete, bridges, non-linear, finite element modelling
I

II
En handbok för ickelinjär finit elementmodellering av skjuvning och vridning i betongbroar HELÉN BROO, KARIN LUNDGREN, MARIO PLOS Institutionen för bygg- och miljöteknik Avdelningen för konstruktionsteknik, Betongbyggnad Chalmers tekniska högskola
SAMMANFATTNING
Ickelinjär finit elementmodellering (FE) har blivit ett viktigt verktyg för dimensionering och utvärdering av bärförmåga hos armerade betongkonstruktioner. När skjuvning och vridning begränsar kapaciteten, visar tredimensionella finita elementanalyser ofta högre bärförmåga än konventionella analyser. Det finns därför mycket att vinna på att använda dessa metoder, särskilt vid utvärdering av befintliga konstruktioner. Orsaken till de högre kapaciteterna är främst en mer fördelaktig lastfördelning när konstruktionen analyseras i tre dimensioner och att betongens brottenergi inkluderas. För att kunna använda dessa högre kapaciteter i praktiken är det viktigt att modelleringsmetoderna verifieras och att man är medveten om eventuella begränsningar. Rekommendationer ges angående analysmetoder och för hur verifikationer kan göras, både vad gäller förmåga och tillförlitlighet hos programmen och den aktuella FE-modellen.
De viktigaste kommentarerna och rekommendationerna är:
• Det är viktigt att notera att i de FE-program som finns kommersiellt tillgängliga idag, så kan inte balkelement beskriva skjuvsprickor, skjuvbrott eller reducerad vridstyvhet. Detsamma gäller för skjuvning ut ur planet hos skalelement.
• Vi analys av broar räcker det oftast att anta full samverkan mellan armering och betong. Ett undantag är om glidningen till spännstål eller armering är viktig för det globala beteendet, som till exempel då ett skjuvbrott sker i ett område där förspänning förankras. Då bör modelleringen inkludera glidning mellan stål och betong.
• Det rekommenderas att enbart inkludera betongens brottenergi då betongens mjuknandekurva i drag definieras. Detta leder till resultat på säker sida, det vill säga bärförmågan underskattas och sprickvidder överskattas.
• Det är ofta mer stabilt att utföra analyser med deformationsstyrning än med laststyrning. En metod som möjliggör deformationsstyrning då flera punktlaster verkar genom att använda ett separat statiskt bestämt balksystem beskrivs.
Kommentarer och rekommendationer ges också om hur viktiga detaljer såsom stöd och anslutningar kan modelleras, hur olika lasttyper kan inkluderas, hur analyserna kan utföras, hur resultaten kan utvärderas genom postprocessering och hur resultaten kan användas i ett säkerhetsformat.
Nyckelord: skjuvning, tvärkraft, vridning, betong, broar, ickelinjär finit elementmodellering

Contents
1 INTRODUCTION 1
1.1 Background 1
1.2 Aim 1
2 THE NON-LINEAR RESPONSE IN SHEAR 2
3 BASIC CONDITIONS 3
3.1 Safety format 3
3.2 Bridge specific conditions 6
4 FE MODELLING 8
4.1 What should the model be capable of describing? 9
4.2 Size of the model and boundaries 9
4.3 Element types 10
4.4 Interaction between steel and concrete 11
4.5 Modelling of important details 13 4.5.1 Modelling of supports and boundary conditions 13 4.5.2 Connections between parts of the structure 14 4.5.3 Connections between structural finite elements 14 4.5.4 Connections between more and less detailed parts 14
4.6 Material input 15 4.6.1 Material models for concrete 15 4.6.2 Stress-strain relationships 16
4.7 Modelling of loads 19 4.7.1 General 19 4.7.2 Load distribution for deformation controlled loading 20
4.8 Mesh density 21
5 FE ANALYSIS 22
6 EVALUATION OF RESULTS 23
6.1 Verification 23
6.2 Post-processing 24
7 REFERENCES 25
III

Preface This report is a guideline for non-linear analysis of concrete bridges subjected to shear and torsion and concludes the outcome of a research project “Shear and torsion in prestressed concrete bridges”. The project was conducted at the Division of Structural Engineering, Concrete Structures, Chalmers University of Technology, Sweden, from August 2005 to June 2008. The Swedish Road Administration (Vägverket) and the Swedish Rail Administration (Banverket) financed the project.
Göteborg October 2008
Helén Broo, Karin Lundgren and Mario Plos
IV

Notations Roman letters
ctf Concrete tensile strength [Pa]
FG Fracture energy [N/m] h Crack band width [m] QT Axle or bogie load R Resistance Rm Mean resistance RTm Mean net resistance (typically axle or bogie load that a bridge can carry in
addition to the other loads) RTk Characteristic net resistance S Load action V Coefficient of variation (COV) VCR Coefficient of variation for model uncertainty VR Coefficient of variation for resistance VRf Coefficient of variation for analysis result VRT Coefficient of variation for net resistance VS Coefficient of variation for load action w Crack opening [m]
Greek letters
Rα Sensitivity factor for resistance
Tβ Target value for safety index ε Strain
1ε Principal tensile strain
ctε Concrete tensile strain
φc Factor for the actual condition state of the member and its influence on the resistance
φR Partial safety factor for the resistance λSi Part of the critical load effect at failure from load action Si γRg Partial safety factor for the load γs Partial safety factor for the load σ Stress [Pa]
ctσ Concrete tensile stress [Pa] γ Shear strain
V


1 Introduction 1.1 Background For structural design and assessment of reinforced concrete members, the non-linear finite element (FE) analysis has become an important tool. Simulations of the shear behaviour and shear failure of reinforced concrete structures, using three-dimensional non-linear finite element methods, have shown higher load-carrying capacity compared to conventional analyses. This can be explained by a more favourable load distribution when the structure is analysed in three dimensions and due to that the fracture energy associated with concrete cracking is included.
The FE method makes it possible to take into account non-linear response. The method can be used to study the behaviour of reinforced and prestressed concrete structures including both force and stress redistribution. Various modelling methods can be used depending on the response or failure to be simulated. However, it is always important to validate the modelling method by test results and to be aware of the limitations of the model. The combination of element types, level of detailing and material models used is important when defining a modelling method. A verified modelling method can be used to study the behaviour of concrete members with geometries, material properties, reinforcement amounts, and load combinations other than those tested.
1.2 Aim The primary aim with this guideline is to improve the application of non-linear finite element analysis in design and assessment of concrete bridges subjected to shear and torsion. Another aim is to introduce modelling methods and give guidance for the evaluation of response and load-carrying capacity of concrete bridges using non-linear finite element analysis. Both the load-carrying capacity in the ultimate limit state and the response in the serviceability limit state are treated.
CHALMERS, Department of Civil and Environmental Engineering, Report 2008:18
1

2 The non-linear response in shear Both shear forces and torsional moments cause shear stresses that can crack a concrete member. Cracks due to shear stresses are usually inclined relative to the direction of the structural member. To satisfy the new equilibrium after shear cracking, longitudinal reinforcement and transverse reinforcement or friction in the crack is required. After cracking, the shear force is transmitted by compression in the concrete between the inclined cracks, tension in the transverse reinforcement crossing the inclined cracks, tension in the longitudinal reinforcement, compression and shear in the compressive zone, and stresses transferred over the crack e.g. through aggregate interlocking along the crack. The visual shear cracks are preceded by the formation of micro-cracks. The micro-cracking and the following crack formation change the stiffness relations in the member, and a redistribution of stresses can occur resulting in strut inclinations smaller than 45°; see Hegger et al. (2004). Due to the rotation of the struts, more transverse reinforcement can be activated. This behaviour becomes more pronounced when the transverse reinforcement starts to yield. The rotation of the compressive struts can continue until failure. Possible failure modes in shear are (1) sliding along a shear crack, (2) crushing of the concrete between two shear cracks, or (3) crushing of the concrete in the compressive zone. In the case of transverse reinforcement, shear sliding cannot take place before the transverse reinforcement yields. It is well known that the shear capacity is larger than what can be explained by the reinforcement contribution determined from a truss model. This increase in shear capacity is due to compression and shear in the compressive zone and stresses transferred over the crack – e.g. tension softening, dowel action, and aggregate interlocking. This increase is also known as the concrete contribution.
After cracking, concrete can transmit tensile stresses due to tension softening, and for reinforced concrete also due to tension stiffening. Tension softening is the capability of plain concrete to transfer tensile stresses after crack initiation. In a reinforced concrete member subjected to tensile forces, tensile stresses are transferred by bond from the reinforcement to the concrete in between the cracks, which contributes to the stiffness of the member. This is known as the tension stiffening. The tension stiffening effect increases the overall stiffness of the reinforced concrete member in tension compared to that of the bare reinforcement. Due to both tension stiffening and tension softening, there are still significant transverse tensile stresses in the compressive struts. Cracked concrete subjected to tensile strains in the direction transverse to the compression is softer and weaker in compression than concrete in a standard cylinder test; see e.g. Vecchio and Collins (1986) and Belarbi and Hsu (1995).
The complex behaviour of reinforced concrete after shear crack initiation has been explained in several papers, for example ASCE-ACI Committe 445 on Shear and Torsion (1998), Vecchio and Collins (1986), Pang and Hsu (1995), Prisco and Gambarova (1995), Walraven and Stroband (1999), Zararis (1996), Soltani et al. (2003). The equilibrium conditions can be expressed in average stresses for a region containing several cracks, or in local stresses at a crack. The local stresses normal to the crack plane are carried by the reinforcement and by the bridging stresses of plain concrete (tension softening). Along the crack plane, the shear stresses are carried by aggregate interlocking and dowel action. The stresses will depend on the shear slip, the crack width, the concrete composition (strength, grading curve and maximum aggregate size) and of course the reinforcement (type, diameter and spacing); see fib (1999).
CHALMERS, Department of Civil and Environmental Engineering, Report 2008:18
2

3 Basic conditions Design and assessment of a concrete bridge have many similarities, but in design the uncertainties of overall behaviour, material properties and loads are large and a conservative design can often be done without large costs. In an assessment, the uncertainties can be reduced by measurements, testing and monitoring. A too conservative assessment can show unfulfilled requirements even if the bridge in reality has sufficient capacity, which may lead to unnecessary but costly strengthening or demolition. Therefore, especially at assessment it is important to predict the load-carrying capacity as appropriate as possible using more enhanced methods. This guideline is therefore focused on assessment.
An assessment can be carried out using different levels of accuracy and complexity. In a conventional assessment, an analysis of the structural system assuming linear response of the bridge is made to determine cross-sectional forces and moments. In this analysis all possible load combinations, type vehicles and traffic load positions are evaluated. For each cross-section the maximum cross-sectional forces and moments are presented and required reinforcement amounts are calculated using conventional design methods for concrete structures. The assessment can be refined by more accurate structural analysis methods, additional input data and by using more appropriate safety formats.
In a non-linear analysis the response is expressed in terms of stresses and strains and the capacity is determined by failure occurring in the overall structural analysis. This means that intermediate results in terms of cross-sectional forces and moments are avoided. Furthermore, the inconsistency of combining linear analysis on the system level for determination of the stress distribution in the structure and non-linear local analysis for determination of the load-carrying capacity is avoided.
Non-linear FE analyses are used in a more enhanced level of assessment. On this level testing and monitoring can provide relevant input data concerning actual loads, in-situ material properties and actual behaviour of the bridge. Plos et al. (2004) present an assessment strategy for enhanced evaluation of load-carrying capacity of existing bridges. The use of probabilistic analysis, finite element analysis, alternative design methods and combinations of these were presented and applied for two prestressed box-girder bridges. In Sustainable Bridges (2007b), the assessment strategy was further developed. The non-linear FEM is maybe the most appropriate structural analysis method for assessment. It gives the possibility to take into account non-linear material responses. The method can be used to study the behaviour including response, stress redistribution, failure mode and maximum load. It can be used for all types of bridges and for service limit state SLS as well as for ultimate limit state ULS. In Sustainable Bridges (2007b) it is stated that non-linear analysis is the analysis method that has the greatest potential for discovering any additional sources for load carrying capacity in concrete bridges.
3.1 Safety format A general problem when using non-linear FE analysis for structural assessment is how to determine the safety level for the load-carrying capacity.
CHALMERS, Department of Civil and Environmental Engineering, Report 2008:18
3

The assessment is usually carried out on basis of loads in design codes. These loads are often conservative due to the fact that they should cover a wide range of bridge types and traffic conditions. Hence, it could be fruitful to perform the assessment based on bridge specific loads. The traffic load models most appropriate for enhanced assessment are the models based on real traffic records, e. g. obtained by weigh in motion (WIM) system in combination with fully probabilistic models.
The safety format could be deterministic, semi-probabilistic or probabilistic. An enhanced assessment using non-linear finite element analysis should generally be performed using probabilistic safety formats, e.g. semi-probabilistic format or fully probabilistic format.
Based on the Eurocodes, a general way to express the safety format of existing bridges was presented in Sustainable Bridges (2007b):
nnsnnsnsnRc SSSR ⋅++⋅+⋅≥⋅⋅ γγγφφ ...2211 (1)
where R is the resistance, S is the load action, φc is a factor for the actual condition state of the member and its influence on the resistance φR is the partial safety factor for the resistance, and γs are the partial safety factors for the loads.
The left hand side of equation (1) is the design resistance Rd, i.e. the load-carrying capacity with sufficient reliability, which can be estimated according to various safety formats; see Sustainable Bridges (2007b).
The most appropriate way to determine the design resistance for an existing bridge would be to perform a fully probabilistic non-linear analysis. This requires several deterministic non-linear analyses for random sets of input variables such as material properties, geometry, support conditions and loading. A less demanding way is to use a semi-probabilistic format. How this should best be done is still a pending research subject. Nevertheless, we recommend the use of a semi-probabilistic format based on a global safety factor acting on the mean resistance, see below. Here, the global safety factor is based on an estimated coefficient of variation, determined from two non-linear analyses with mean and characteristic material parameters.
A simplified semi-probabilistic format is proposed in EN1992-2 (2005). However, as was shown in Sustainable Bridges (2007b), that method is limited to cases where the tensile strength of concrete is not a major parameter influencing the limit state; therefore we don’t recommend that method to be used for structures dominated by shear and torsion loading.
A commonly used method to estimate the design resistance is to use safety formats presented in codes, based on the partial safety factor method. It is generally developed for sectional analysis with the sectional forces often determined through linear analysis, and is not directly applicable to non-linear FE analysis. If design values are used as indata in a non-linear analysis, they represent a degenerated or imaginary material, and the structural response in the analysis can deviate sufficiently from the real response. For example, the analysis may result in an incorrect failure mode. This means that the use of design values in the analysis will not guarantee that the prescribed safety level is fulfilled. Furthermore, different analyses are required for different limit states, since they require different partial safety factors. Finally, the
CHALMERS, Department of Civil and Environmental Engineering, Report 2008:18
4

non-linear analysis is typically describing the load history, with one particular load increased up to failure in the final stage of the analysis. The rules for load combinations, defined for the partial safety factor method, can not be uniquely interpreted for this situation. This method is therefore not recommended.
Global safety factor based on estimated coefficient of variation We recommend that the design resistance is determined based on a non-linear analysis with mean values on material and other resistance parameters. With mean values in the analysis, the response of the structure is reflected as realistic as possible. Furthermore, the material models and FE programs used for non-linear analysis are validated and calibrated against experimental results on mean value level. The safety verification is made using a global safety factor, γRg, acting on the mean resistance, Rm:
nnsnnsnsRg
m SSSR
⋅++⋅+⋅≥ γγγγ
...2211 (2)
This method is based on one of the safety formats given in Sustainable Bridges (2007b) for system/structural level assessment and was presented by Cervenka et al. (2007) as the ECOV (estimated coefficient of variation) method. The method given below is based on Carlsson et al. (2008), in which the ECOV method was further developed to be better applicable to practical bridge assessment.
Normally, in a non-linear FE analysis for assessment of a bridge, the analysis simulates the loading sequence on the bridge. This means that the permanent loads are applied first, followed by the variable loads up to their design values, and finally the traffic point loads are increased up to failure to determine the load carrying capacity. Consequently, the mean resistance that is obtained is a net resistance, RTm, expressed as the axle or bogie load that the bridge can carry in addition to the other loads on the bridge. The safety verification for the axle or bogie load, QT, can then be expressed as:
TQRTg
Tm QR
⋅≥ γγ
(3)
The global safety factor for the net resistance, γRTg, must then be determined with respect to the simultaneous loads in addition to QT. It is calculated from the corresponding estimated coefficient of variation (COV), VRT:
RTTRRTg V⋅⋅+= βαγ 1 (4) Where βT is the target value for the safety index, given by the governing code, and αR is the sensitivity factor for the resistance. The latter is problem dependent, but can be approximated conservatively to αR = 0.8.
Based on the assumption that the resistance RT has a log-normal distribution, the COV for the analysis result, VRf, can be estimated based on the resistance from two non-linear analyses: the one with mean values, giving RTm, and one additional with characteristic values on the material parameters, giving a resistance RTk
⎟⎟⎠
⎞⎜⎜⎝
⎛=
Tk
TmRf R
RV ln
65.11 (5)
CHALMERS, Department of Civil and Environmental Engineering, Report 2008:18
5

In the estimation of the final COV, the model uncertainty expressed by the model COV, VCR, needs to be taken into account. It includes the uncertainties related to the identification and variation of geometry and material properties in the structure. For conventional analysis methods, it may typically vary in the range from 5 to 15 %, but in case of non-linear FE analysis no such recommendations was found. The COV including the model uncertainty can be calculated as
22CRRfR VVV += (6)
Finally, the COV for the net resistance, RTm, needs to account for that the net resistance also depend on the magnitude and uncertainties of the other loads acting together with the traffic point loads. If the load effect of each of the other loads, Si, in relation to the net resistance is estimated as
Tm
iS R
S=λ (7)
and the COV for each load, VSi, is given, the COV for the net resistance can be calculated as
( ) ( )∑∑ ⋅++= 2222 1 SiSisiRRT VVV λλ (8)
The method described above still involves a number of uncertainties, e.g. regarding the determination of model uncertainties (VCR) and the estimation of the part of the different loads on the load effect at failure (λS). However some guidance on how to estimate these can be found in Carlsson et al. (2008).
3.2 Bridge specific conditions For an enhanced assessment of an existing concrete bridge the following aspects are important to incorporate:
• Actual bridge geometry, including reinforcement and tendon positions • In-situ material properties • Actual bridge condition • Boundary conditions • Sequences of construction and of loading • Actual loads
In Sustainable Bridges (2007b), the information needed for assessment of a bridge is treated comprehensively. In the following, some aspects of particular importance for non-linear FE analysis are treated.
The actual bridge geometry is of particular importance for critical details and if second order effects are important. Methods for determination of e.g. reinforcement and tendon positions are given in Sustainable Bridges (2007a).
For non-linear FE analysis, material parameters for the non-linear response of the materials are needed. Material models available in the FE programs are used to describe these responses, see Section 4.5.1. In addition to the common material parameters for concrete such as tensile strength, compressive strength and Young’s modulus, the most important material parameter needed is the fracture energy.
CHALMERS, Department of Civil and Environmental Engineering, Report 2008:18
6

Characteristics like the shape of the stress-strain relation and the three-dimensional response can be assumed to depend on the specified parameters, and verified and calibrated relations for normal strength concrete are often available in the material models of the FE programs.
For concrete, the needed in-situ material parameters can be evaluated from the documentation, or more accurately by tests on samples, as described in Sustainable Bridges (2007b). The other material parameters can also be determined from the characteristic compressive strength, fck, according to CEB-FIP Model Code, CEB (1993). The mean fracture energy can be evaluated by assuming an aggregate size in addition to the compressive strength. Rules for determination of characteristic and design values for the fracture energy are not given in codes, but can be estimated by assuming the same relation to the mean value as for the tensile strength.
For the reinforcement, it is often important to include the strain hardening in the stress-strain relation used, see Section 4.6.2.5. Consequently, in addition to Young’s modulus and the yield strength, the ultimate strength and the deformation capability of the reinforcement is needed.
For existing bridges it is important to include the actual bridge condition, especially if the material is getting deteriorated due to e.g. corrosion or frost damage. Some advices regarding how to include this in the model is given in Hanjari (2008).
In many cases, the construction process with successive prestressing, changes of the support and boundary conditions and adding of self weight can have a substantial influence on the stress distribution in the structure, and has to be included in the analysis. An example of how this can be made in a simplified way is found in Broo et al. (2008) for a prestressed box girder bridge constructed with the balancing cantilevering method. In such a modelling of sequential events, it is sometimes also possible to approximately account for long-terms effects like creep. In Broo et al. (2008), the redistribution of forces and moments due to creep was approximated by giving support translations based on actual measured support reactions.
The assessment is often done for loads given in codes or load regulations. An alternative can be to use measurements of the actual load; this is common especially for railway bridges.
CHALMERS, Department of Civil and Environmental Engineering, Report 2008:18
7

4 FE modelling Generally, when using FE modelling, you need to make a lot of choices. Below is a list which can be good to use to pay attention to the choices that are done:
Model: • What should the model be capable of describing? • Size of the model • Boundaries • Element type(s) • Interaction between different parts or materials • Modelling of important details, such as supports, connections
and stiffened areas • Material models and input • Loading • Mesh density
Analysis: • Construction and loading history • Increments • Iteration method, convergence criteria
Evaluation: • Post-processing; what results to look at • Verification • Safety format
Several of these choices influence each other, for example is it wise to consider where it is possible to define boundaries when choosing the size of the model. It is recommended to document not only the choices that are done, but also the motivations for these choices. In the following of this chapter, choices regarding the model are discussed. The analysis is discussed in Chapter 5, and evaluation of the results in Chapter 6. The safety format for non-linear analysis is treated in Section 3.1.
To give an overview of how the modelling choices described in the following sections result in models on different levels of detailing, with different capabilities to describe the structural response, a generalised description of typical detailing levels are given. The detailing levels for non-linear analysis of reinforced concrete structures can roughly be subdivided into detail, component or structural level. These levels are particularly related to the type of finite elements used, Section 4.3, and to how the reinforcement and its interaction with the concrete are modelled, Section 4.4.
In models on detail level, the model has such a high resolution that the local response is rather accurately reflected. Here, continuum elements are normally used and the interaction between reinforcement and concrete is modelled in three dimensions to be able to study phenomena like spalling of concrete in anchorage zones. In practice, only a small part of the structure can be included in the model, e.g. a connection or support region.
On component level, the response of an entire member like a beam can be studied. The concrete is usually modelled with two- or three-dimensional continuum elements. The reinforcement may be modelled with separate truss or beam elements and the interaction to the concrete modelled through simplified interface elements. The
CHALMERS, Department of Civil and Environmental Engineering, Report 2008:18
8

element mesh is often dense enough so that individual cracks can be identified and the slip of reinforcement in anchorage zones can be reflected.
To be able to model entire structures, like a whole bridge, the FE models are generally on structural level. Typically, structural type finite elements are used, like beam, shell and truss elements. The reinforcement is typically modelled as embedded elements with no slip to the concrete. The possibility to model shear and torsion failures with structural elements are limited to in plane shear in shell elements, see Section 4.2, and it is important to realise that influence from e.g. anchorage failure interacting with shear or torsion failures cannot be reflected on this level.
It is important to realise that the level of detailing governs which failure modes that can be reflected in the analysis. Failure modes that are not reflected in an analysis must be checked by simplified methods or analysed using more detailed models.
4.1 What should the model be capable of describing? The level of detailing in the model depends on what phenomena the model should be capable of describing. Is it sufficient to catch the overall stress distribution and deformations for service conditions? What failure phenomena need to be reflected? Is it important to be able to follow the post-failure response?
These kind of questions need to be clarified so that the analysis made really can meet its requirements. The choices that are made in the modelling must be in consequence with the purpose of the analysis.
Here, we will focus on response for shear and torsion, which will be governing for the level of detailing required.
4.2 Size of the model and boundaries When choosing the size of the model it is important to consider how much of the structure that needs to be modelled to reflect the problem:
• The whole structure? • Single components or critical regions only? • Does the foundation need to be included?
Other important considerations determining the model size are where it is possible to define boundaries, and if symmetry can be used.
When a refined level of detailing is required for a critical part or a critical detail in a larger reinforced concrete structure, it can be efficient to combine structural parts modelled with different levels of detailing. For example, a more detailed modelling can be made for a part of the structure where shear failure may occur, and combined with beam elements for the rest of it, Plos (2004), Lundgren et al. (2004) and Broo et al. (2008), see Figure 1.
CHALMERS, Department of Civil and Environmental Engineering, Report 2008:18
9

Figure 1 A non-linear finite element model of a complete bridge, where a part of
the bridge is modelled more detailed than the rest, Plos (2004).
123
4.3 Element types A general continuum model is formulated in a three-dimensional setting. In a three-dimensional setting the stress and strain components are:
, (9)
⎪⎪⎪⎪
⎭
⎪⎪⎪⎪
⎬
⎫
⎪⎪⎪⎪
⎩
⎪⎪⎪⎪
⎨
⎧
=
⎪⎪⎪⎪
⎭
⎪⎪⎪⎪
⎬
⎫
⎪⎪⎪⎪
⎩
⎪⎪⎪⎪
⎨
⎧
=
12
31
23
33
22
11
σσσσσσ
τττσσσ
σ
xy
zx
yz
z
y
x
⎪⎪⎪⎪
⎭
⎪⎪⎪⎪
⎬
⎫
⎪⎪⎪⎪
⎩
⎪⎪⎪⎪
⎨
⎧
=
⎪⎪⎪⎪
⎭
⎪⎪⎪⎪
⎬
⎫
⎪⎪⎪⎪
⎩
⎪⎪⎪⎪
⎨
⎧
=
12
31
23
33
22
11
222
εεεεεε
γγγεεε
ε
xy
zx
yz
z
y
x
By introducing additional assumptions, the general setting can be reduced to models for plain strain, plain stress or axi-symmetry. If rotational variables are added and the stresses and strains are generalised to cross-sectional variables, plate, shell or beam elements are obtained. To connect different parts or materials, special elements like spring elements, contact elements or interface elements can be used, see Figure 2. The element type to use depends on what type of response and failure the model should describe. Especially worth to note here is that in FE programs commercially available today, beam elements cannot describe shear cracking and shear failure or reduced torsional stiffness due to cracking. Some research exist on how to introduce this, see Kettil et al. (2007). Plane stress elements, sometimes also called membrane elements, can be used to describe the shear response for walls or beams where the loading acts in the plane of the element. If bending out of the plane needs to be taken into account, shell elements are needed instead of plain stress elements. However, it is important to note that, just like beam elements, shell elements cannot describe shear cracking or shear failure for the out-of-plane shear. However, cracking and failure for in-plane shear can be described.
CHALMERS, Department of Civil and Environmental Engineering, Report 2008:18
10

(a)
(b)
(c)
Figure 2 (a) Continuum elements in two or three dimensions. (b) Structural elements e.g. beam elements and shell elements. (c) Special elements e.g. springs and dampers.
In order to reflect bending in reinforced concrete after cracking properly, it is generally necessary to increase the number of integration points over the thickness substantially in beam elements and, for the out of plane bending, in shell elements. It is recommended to use integration schemes that provide integration points more densely towards the surface of the element, such as the Simpson or Newton-Cotes integration schemes rather than the Gauss scheme (which may be default).
Different FE programs have different formulations for the same type of elements, e.g. shell element types. Not all types are able to reflect shear type cracking and shear failure in the plane of the element. In Plos (2004) four different shell element types in the program ABAQUS were evaluated and it was shown that only the 9-node thin shell element was able to reflect the shear type cracking. With another FE program, DIANA, all available curved shell elements could describe the shear response, even the 4-node, Broo et al. (2007). It is therefore important to verify that the used element can describe the response and failure for which it is used to simulate, see also Section 6.1.
4.4 Interaction between steel and concrete The interaction between the reinforcement and the concrete can be described in more or less detail. The response or failure to be simulated determines the level of detailing which must be chosen.
Detailed models suitable for the modelling of reinforced concrete members include not only separate constitutive models for plain concrete and steel, but also models for their interaction; i.e. the bond mechanism between the reinforcement and the concrete. If both the concrete and the reinforcement are modelled with continuum three-
CHALMERS, Department of Civil and Environmental Engineering, Report 2008:18
11

dimensional elements, surface interface elements describing the interaction between the concrete and the reinforcement can be used. For the interface elements a special bond model, for example that of Lundgren (1999), can be used, which includes not only the bond stresses but also the splitting stresses activated when the reinforcement slips in the concrete. This is a very detailed modelling method which is not suitable for complete concrete members, but rather for analyses of reinforced concrete details. Even more detailed models, which are separating the concrete into aggregate and mortar, i.e. not treating the concrete as a continuum, are not suitable for reinforced concrete structures and therefore not treated here.
A less detailed way of modelling reinforced concrete is to model the reinforcement with truss or beam elements, see Figure 3. The interaction between the concrete and the reinforcement can then be modelled with a two-dimensional interface element or spring elements describing the bond stress-slip relationship. The bond stress-slip relationship used is predefined and the interaction is not influenced by yielding of the reinforcement or high support pressure. This modelling method is suitable for modelling on component level, for smaller concrete members or parts of concrete members. This level of detailing is needed if the slip of prestressing strands or reinforcement is important for the global response or the final failure. One example is if a shear failure takes place in the region where prestressing is anchored.
Slip
Reinforcement bar Bond stress
Figure 3 The reinforcing steel can be modelled with truss elements with
interface elements using a predefined bond stress-slip relationship to describe the interaction between the concrete and the steel.
A modelling method more suitable for large reinforced concrete members or entire structures is to assume full interaction between the reinforcement and the surrounding concrete, ‘embedded reinforcement’, i.e. the reinforcement has no degree of freedom of its own; it just adds stiffness to the concrete element, Figure 4. This can be used in combination with all types of elements, continuum or structural, suitable for describing the concrete. In beam elements, the embedded reinforcement acts in the longitudinal direction of the element and is normally defined as individual bars with specified eccentricities in the cross-section. In shell elements, the reinforcement acts as reinforcement layers in the plane of the element and is defined through their reinforcement content, eccentricity and bar direction.
CHALMERS, Department of Civil and Environmental Engineering, Report 2008:18
12

Figure 4 The reinforcing steel is modelled with ‘embedded reinforcement’, i.e.
full interaction is assumed between the steel and the concrete.
4.5 Modelling of important details Important details that may have considerable influence on the analysis results, and that need to be paid special attention to in the modelling are:
• Supports and model boundaries • Connections between parts of the structure • Connections between structural finite elements • Connections between more and less detailed parts
4.5.1 Modelling of supports and boundary conditions It is important to model the boundary conditions at their correct positions. This should be observed particularly for models with structural finite element types, for example when modeling the abutments of a bridge girder, see Figure 5. For this purpose stiff links, i.e. beam elements with high stiffness and no density can be used.
Beam element representing the bridge girder
Beam elements acting as stiff links
Supports at abutment
Figure 5 Stiff links, i.e. beam elements with high stiffness and no density can be
used to model the boundary conditions at the correct positions.
In more detailed models, for example with continuum elements, the distribution of the reaction forces need to be considered in the modelling. For example, a roller bearing with a load-distributing support plate can be modelled in the following ways, Figure 6. The node in the centre of the support is fixed in the vertical direction. The load-distributing bearing or support plate could either be modelled with FE elements or not. If the support plate is not modelled with FE elements the nodes on each side of the supported node can instead be forced to have the same vertical displacement but in opposite directions, enabling a rotation and simulating a free support with a distribution length equal to the support plate.
CHALMERS, Department of Civil and Environmental Engineering, Report 2008:18
13

-δδ
a) b)
Figure 6 Modelling of a roller bearing with a load-distributing support plate. (a) The support plate is modelled with FE elements. (b) The support plate is modelled by forcing the nodes on each side of the support plate to have the same vertical displacement but in the opposite direction.
4.5.2 Connections between parts of the structure When modelling connections between parts of the structure, such as e.g. hinges, it is often important to model the actual geometry and the correct positions for e.g. rotational degrees of freeedom, in analogy with what is described for supports. Also the extension of connections can be important to include, in a similar way as is shown for supports in Figure 6.
4.5.3 Connections between structural finite elements When structural finite elements, like beams and shells, are used to represent the geometry of the structure, the elements are connected at the intersections of their system lines or planes. When modelling frame types of structures, the elements are connected in the middle of the frame joints or frame corners. It can here be necessary to increase the cross-sections of the structural elements within the joint region in order not to obtain extensive cracking and eventually failure in a region where this cannot occur in reality. Observe that the self weight of the elements with increased cross-sections will be overestimated if the density is not reduced to compensate for this.
Another example is beams with box cross-sections, that commonly have thick transversal walls over supports, where concentrated forces will act. If the box cross-section in the analysis is built up of shell elements, this stiffening effect needs to be taken into account. One way of doing this is to model also the transversal wall with shell elements, or to tie all nodes in each cross-section of the stiffened areas to keep the cross-section plane. Additionally, the thickness of the shell elements for the box wall and flanges in the area of the stiffeners may need to be increased compared to the elements outside these parts to avoid that cracking and failure of the cross-sections in these parts appear in the analyses; this would not correspond to reality as the transversal walls strengthen these parts. Note that the density of the concrete might need to be adjusted to maintain the correct self-weight of the box-beam.
4.5.4 Connections between more and less detailed parts If parts of a structure are modelled in detail and connected to parts that are modelled in a simplified way, the different parts need to be connected in a kinematically correct
CHALMERS, Department of Civil and Environmental Engineering, Report 2008:18
14

way. If structural finite elements are used for the less detailed part, the degrees of freedom of the element(s) at the connection need to be coupled to the corresponding degrees of freedom of the adjacent cross-section built up by a number of elements in the detailed part. Stiff links, i.e. beam elements with high stiffness and no density, can be used to constrain the displacements and rotations between the parts modelled with different levels of detail, see Figure 7.
Figure 7 Stiff links, i.e. beam elements with high stiffness and no density,
connecting a more detailed modelled part (shell elements) with less detailed modelled part (beam elements).
4.6 Material input 4.6.1 Material models for concrete Concrete as a material has a non-linear behaviour both in compression and in tension, Figure 8. To predict the behaviour of concrete structures, it is important to take this non-linear material response into account. Using non-linear material models in finite element analysis is one way of doing this.
Figure 8 Typical non-linear uniaxial stress-strain relations for concrete,
compared to elastic response.
CHALMERS, Department of Civil and Environmental Engineering, Report 2008:18
15
The purpose of the material model is to describe the link between the deformations of the finite elements and the forces transmitted by them. For the modelling of fracture and damage there are, according to Jirásek (2004), mainly three classes of constitutive models: continuum models, discrete models, and mixed models. Most of the commercial finite element programmes are based on continuum models, therefore this is the only types of models treated in this report. In continuum models the material behaviour is described with a stress-strain relationship. This relationship is commonly based on elasticity, plasticity, damage or the smeared crack concept.
The material models used for concrete are often based on several theories describing different phases of the material response. The response is often modelled as linear elastic until cracking occurs on the tensile side and to about 60% of the compression strength on the compression side, see Figure 8. A plasticity model often describes the non-linear behaviour in compression. On the tensile side a plasticity model, a damage model or a smeared crack model is often used to describe the crack opening behaviour.
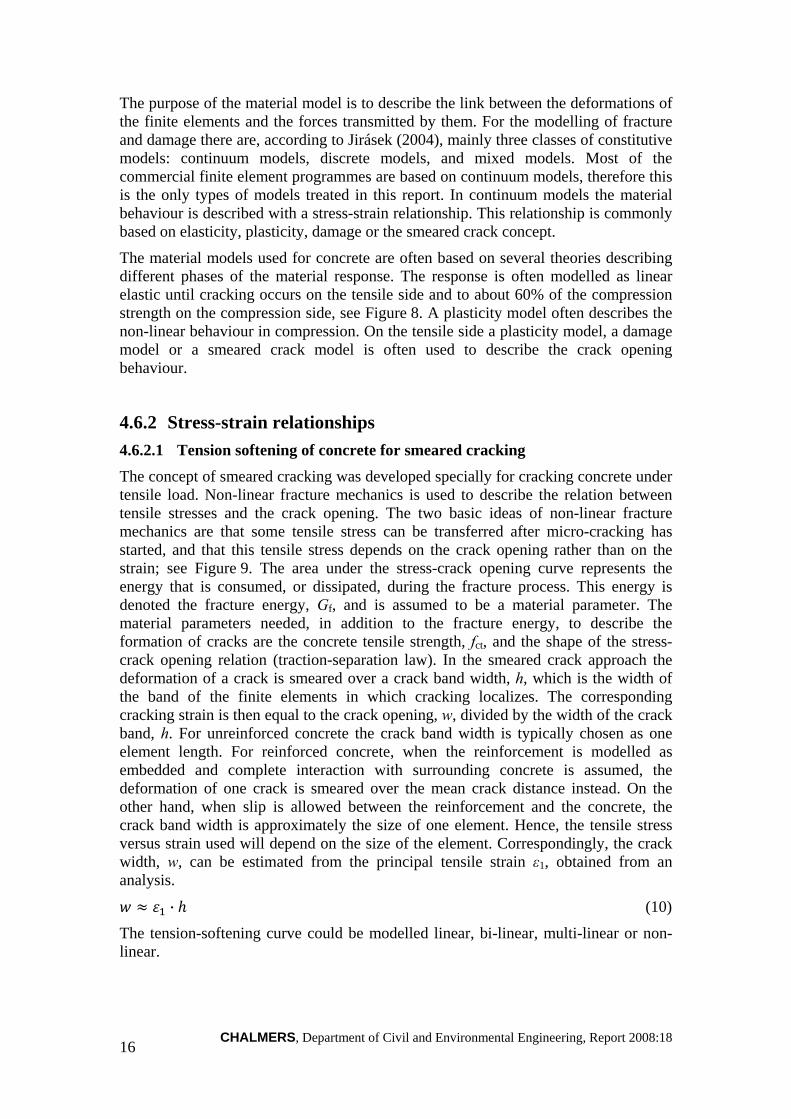
4.6.2 Stress-strain relationships 4.6.2.1 Tension softening of concrete for smeared cracking
The concept of smeared cracking was developed specially for cracking concrete under tensile load. Non-linear fracture mechanics is used to describe the relation between tensile stresses and the crack opening. The two basic ideas of non-linear fracture mechanics are that some tensile stress can be transferred after micro-cracking has started, and that this tensile stress depends on the crack opening rather than on the strain; see Figure 9. The area under the stress-crack opening curve represents the energy that is consumed, or dissipated, during the fracture process. This energy is denoted the fracture energy, Gf, and is assumed to be a material parameter. The material parameters needed, in addition to the fracture energy, to describe the formation of cracks are the concrete tensile strength, fct, and the shape of the stress-crack opening relation (traction-separation law). In the smeared crack approach the deformation of a crack is smeared over a crack band width, h, which is the width of the band of the finite elements in which cracking localizes. The corresponding cracking strain is then equal to the crack opening, w, divided by the width of the crack band, h. For unreinforced concrete the crack band width is typically chosen as one element length. For reinforced concrete, when the reinforcement is modelled as embedded and complete interaction with surrounding concrete is assumed, the deformation of one crack is smeared over the mean crack distance instead. On the other hand, when slip is allowed between the reinforcement and the concrete, the crack band width is approximately the size of one element. Hence, the tensile stress versus strain used will depend on the size of the element. Correspondingly, the crack
w an be estimated from the principal tensile strain ε1, obtained from an width, , canalysis.
·
(10)
The tension-softening curve could be modelled linear, bi-linear, multi-linear or non-linear.
CHALMERS, Department of Civil and Environmental Engineering, Report 2008:18
16

Figure 9 Mean stress-displacement relation for a uniaxial tensile test specimen,
subdivided into a general stress-strain relation and a stress-displacement relation for the additional localised deformations.
4.6.2.2 Tension-stiffening of reinforced concrete The presence of steel bars in reinforced concrete results in a distributed stabilized crack pattern if the load is sufficiently high. Geometric properties and material properties influence the average distance between two cracks. Due to bond, the local stresses in the concrete and in the reinforcement between two cracks will vary along the bar axis. The concrete stress reaches the maximum value in the middle between two cracks and decreases to zero at the crack locations. In a reinforced concrete member subjected to tensile forces, the concrete between the cracks carries tensile stresses which are transferred by the bond, thus contributing to the stiffness of the member. This is known as tension-stiffening. The tension-stiffening effect increases the overall stiffness of a reinforced concrete member in tension in comparison with that of a bare reinforcing bar. When modelling the average tensile behaviour after cracking, the effect of this local stress distribution must be included in the material response if it is to be taken into account.
If a modelling level that describes the interaction between the reinforcement and the concrete is used, tension-stiffening does not need to be considered separately; it will be taken into account by the model. On the other hand, if full interaction between the reinforcement and the concrete is assumed, tension-stiffening can be taken into account in an approximate way through the constitutive relationship describing the materials, e.g. for the concrete in tension. Ways of doing this have been proposed by Lackner and Mang (2003).
w
σ
ε
ε
σ
ε
f ct
w . L
L Δ
Unloading responseat maximum load
L+εL+w
σ
σ = f(w) + GF
w
w
CHALMERS, Department of Civil and Environmental Engineering, Report 2008:18
17

4.6.2.3 Concrete contribution to shear capacity In the same way as for the tension-stiffening effect, if a reinforced concrete member subjected to shear is modelled by assuming full interaction between the reinforcement and the concrete, the concrete contribution (Chapter 2) can be taken into account in an approximate way with the constitutive relationship describing the materials, e.g. for the concrete in tension.
Such relationships, that link average tensile stresses to average tensile strains for orthogonally reinforced cracked concrete, have been established trough shear panel tests. Several suggested relationships exist, e.g. Collins & Mitchell (1991), Pang and Hsu (1995), and Bentz (2005). Broo et al. (2007) compared the suggestions of Collins & Mitchell (1991) with the curve by Hordijk (see TNO (2004)), where only the fracture energy of plain concrete is taken into account. It was shown that with the Hordijk curve, the capacity was underestimated and the average strains, i.e. the crack widths, were overestimated. On the other hand, if the concrete contribution to the shear capacity was taken into account with the expression from Collins & Mitchell (1991), the capacity was often overestimated and the average strains underestimated. Furthermore, it was concluded that a tension-softening relationship modified to account for the concrete contribution should not be used if shear is not a problem, i.e. this choice of material input is not general. We therefore recommend that only the fracture energy of plain concrete is taken into account when defining the softening response of concrete. This will yield results on the safe side; i.e. underestimation of the capacity and overestimation of deformations and crack widths.
4.6.2.4 Compression-softening of cracked concrete Cracked concrete subjected to tensile strains in the direction perpendicular to that of the compression is softer and weaker than concrete in a standard compression cylinder test, Vecchio and Collins (1993) and Belarbi and Hsu (1995). Consequently, the compressive strength in the constitutive relationship used to describe the concrete in compression needs to be reduced, for example according to Vecchio and Collins as described in TNO (2004).
If a concrete compressive failure is localised within a small region, the size of which does not correspond to the size of the specimens used to calibrate the compression relationship used, the model cannot predict the response correctly. A compressive curve with the softening branch influenced by the size of the compression zone may solve this problem.
In commercial programs available today, it may not always be possible to combine a compressive-softening curve, adjusted for the size of the compression zone, with the reduction of compressive strength due to lateral tensile strains. If the effect of reduced compressive strength is more important than the need to capture a concrete compression failure in order to simulate the failure response, an incorrect localization can be avoided by modelling the concrete in compression with an elastic-ideal plastic relationship instead.
CHALMERS, Department of Civil and Environmental Engineering, Report 2008:18
18

4.6.2.5 Tension hardening of reinforcing steel Steel generally has a higher ultimate strength than yield strength; i.e. after yielding, tension hardening takes place. This effect is substantially more marked in old types of reinforcement than for modern reinforcement types. Thus, the reinforcement used in old bridges has in general substantially higher ultimate strength than yield strength. It can be of importance to include this tension hardening in the modeling, as it influences e.g. the possibility for redistribution of bending moment in a positive way. It can also be noted that the tension hardening of the reinforcement will influence the size of plastic regions and thereby the ductility of reinforced concrete structures. However, to be able to model that in a detailed way, also the bond loss at yielding and the localization of compressive failure of concrete need to be described in a proper way; this is with the models and methods available in commercial programs today very difficult to achieve.
4.7 Modelling of loads 4.7.1 General Below is a list of loads that can be modelled, together with short comments on how that can be done.
• Prestressing. There are different possibilities in different program packages to model prestressing. Often, there exist possibilities to define initial stress or strain in elements; the program then needs to iterate to find equilibrium which means this option will much resemble pre-tensioning. Another option is to apply the prestressing as an external force. Some programs have special commands to treat post-tensioning, e.g. in Abaqus the command “prestress hold” can be used.
• Self weight. The self weight of the load-carrying parts can easily be included since they are part of the model. However, it is important to include also the self weight of other parts of the bridge, such as paving and rails; since they are usually not a part of the model, they need to be defined as external loading.
• Distributed loads. Most often, distributed loads can be defined as surface or edge loads on elements. If this is not possible, the distributed load can be divided on several nodes.
• Concentrated loads. Concentrated loads can be applied in single nodes. However, in more detailed models it can be important to distribute them on a loaded area in a similar way as is shown for supports in Figure 6; sometimes loading on only a single node can cause local problems like crushing.
• Pre-described deformations. Generally, it is more stable to apply loads as pre-described deformations, rather than as loads, see Section 4.6.2.
• Thermal effects. In most finite element packages, it is possible to model thermal effects using thermal expansion coefficients for the materials and by defining temperature loads.
CHALMERS, Department of Civil and Environmental Engineering, Report 2008:18
19

• Creep. Many program packages include the possibility to use models describing creep, sometimes using rather advanced models. However, in commercial finite element codes today, it is to the authors’ knowledge not possible to combine creep and cracking. Sometimes it can be possible to model the effects of creep in a simplified way, e.g. by modelling the redistribution of forces in the structure by applying prescribed deformations to the supports to reflect measured support reactions , as is done in Broo (2008).
• Shrinkage. In most finite element programs, it is possible to model shrinkage. If there is no direct way to define a shrinkage strain, another possibility is to use fictive temperature loads.
4.7.2 Load distribution for deformation controlled loading Often, it is more stable to perform analyses using deformation control than load control. To enable deformation-controlled loading for several point loads, a separate statically determined arrangement of stiff beams can be modelled, see Figure 10. The nodes, where the vertical point loads are applied on the bridge, are tied to have the same vertical displacements as the corresponding bottom end nodes of the loading arrangement. The number of levels in the beam system depends on the number of point loads applied on the bridge. All beams in the beam system are supported for translation in the horizontal direction and rotation around its own axel at one end, see Figure 11. The vertical point loads are applied by increasing the vertical displacement of one node at the top beam element in the loading structure. Before applying the loads on the bridge model it is wise to check the loading structure to ensure that the reaction forces at the ends of the beams in the lowest level are the ones supposed.
XY
Z
X Y
Z
Figure 10 In this example, the point loads of the vertical traffic load were applied
in 32 points (on 32 nodes) on the top flange, using a statically determined arrangement of stiff beams.
CHALMERS, Department of Civil and Environmental Engineering, Report 2008:18
20

Figure 11 Supports and tyings within the loading structure.
4.8 Mesh density To get correct results from the analysis, the FE mesh must be sufficiently dense. Thumb rules given in manuals and handbooks on FEM can give advice on the mesh density required. It can be beneficial to be aware of that stress concentrations occurring in linear analysis, and that may require a very dense mesh in sharp corners and other irregularities, often becomes considerably less pronounced when the non-linear response is reflected in the analysis.
It is recommended to verify the chosen FE mesh by comparison to a corresponding model with e.g. a doubled mesh density. The comparison should be made for the kind of analysis that the model is intended for and typical results of interest for the problem studied should be compared. It is important to adjust the material parameters for the refined model with respect to the element size dependency of the stress-strain relationship for concrete, if applicable, see Section 4.6.2.
CHALMERS, Department of Civil and Environmental Engineering, Report 2008:18
21

5 FE analysis In the previous section, it was described what defines a FE model, e.g. element types, boundaries and material input. To actually perform the analysis, the user has to define also the “history”, or series of events described by the analysis and some parameters that control the analysis procedure. A non-linear analysis is typically a simulation of the response of the structure when subjected to increased loading. The analysis is subdivided in increments and equilibrium is found for each increment using iteration methods.
Below are some comments regarding the analysis performance:
• The construction history. The way to specify the series of events defining the construction history, like adding and removing of structural parts and changes of boundary conditions, are made differently in different FE programmes. Generally, the analysis history is divided in several steps or phases, in which changes to the model and the loads are applied. Each such step or phase may be subdivided in increments for which equilibrium is found. Normally, a non-linear phase or step starts with the state of equilibrium obtained at the end of the previous step, including the stresses and deformations etc. of the structure.
• Loading history. Just like the construction history, the loading history can be defined in subsequent steps. Within each step, the increase of the different loads can be specified in relation to each other to reflect the loading history. Load control and deformation control can not be combined in the same step. When modelling increased traffic point loads on an already loaded bridge, using a load distribution system according to Section 4.6.2, special measures need to be taken in order to be able to introduce the deformation control. In some programs it is possible to introduce the boundary condition needed for the deformation control in the deformed system, without introducing any reaction forces. In other cases, a non-linear spring can be used to transfer forces from a node used for deformation, see e.g. Plos et al. (2007).
• Increments. It is important that the increments are small enough to capture e.g. localization.
• Iteration method and convergence criteria. Often, analyses of reinforced concrete structures exhibit some problems to converge, e.g. during first cracking phase and close to ultimate load. It can therefore sometimes be beneficial to let an analysis continue even if the intended convergence criteria are not met. It is of course then very important to check how many of the criterions that deviated from the intended tolerance and how much, and in that way judge whether the results can be trusted. This can be a way to get valuable information concerning what causes failure.
CHALMERS, Department of Civil and Environmental Engineering, Report 2008:18
22

6 Evaluation of results 6.1 Verification The analyses should be verified in various aspects; i.e. both the capability of the program to describe the behaviour, and that the actual FE model is correct should be verified.
The FE program, element types and material models should be documented and verified by the program developer. However, in addition to that, their capability to simulate the shear response, shear-type cracking and the shear failure should be verified; this needs in most cases be done by the user. The modelling method used, made up of a specific combination of elements, material models, modelling of reinforcement etc. on a chosen level of detailing need to be verified by comparison to experiments. For example, modelling of shear in box girder sections or slender beam webs can be verified by analysing shear panel tests using small simple models. Results from shear panel tests can be found in Vecchio et al. (2001) and Pang (1991). For examples of how such analyses can be done, see Broo (2008).
The verification of the actual FE model can be done in three steps:
• The model can be graphically examined before any analysis needs to be done. The following are examples of what is recommended to be checked:
o Mesh o Boundary conditions o Applied loads o Reinforcement (location, orientation, amount) o Material properties o Geometrical properties (thickness, cross-section) o Global and local orientations
• Simplified cases can be analysed, in order to ease comparisons to hand calculations, e.g.:
o Linear analysis o Applying only the self weight o Applying concentrated load
• Finally, when the actual analysis is performed, it can be verified in different ways, for example by checking if the following results appear to be reasonable; if possible compare with results from hand calculations or measurements:
o Deformed shape o Crack pattern o Distribution of stresses, moments etc. o Support reactions o Cracking load o Ultimate capacity o Stiffnesses
CHALMERS, Department of Civil and Environmental Engineering, Report 2008:18
23

6.2 Post-processing When choosing what results to look at, it is important that the whole response of the structure is studied, from initial loading and cracking to failure. By comparing different results, such as the load versus deformation response with crack pattern and stress in the reinforcement, the structural behavior can be understood. Sometimes, this can provide necessary information to make it possible to use analytical methods more correctly. For the ultimate limit state, both the load-carrying capacity and the failure mode are important. For the serviceability limit state, the following items are examples of what can be of interest:
• Deformation • Crack width • Concrete compressive strain • Steel stress and steel strain
For evaluation of the design load-carrying capacity, methods for safety evaluation are given in Section 3.1.
CHALMERS, Department of Civil and Environmental Engineering, Report 2008:18
24

7 References ASCE-ACI Committe 445 on Shear and Torsion (1998): Recent approches to shear
design of structural concrete. Journal of Structural Engineering 124(12), 1375-1417.
Belarbi A. and Hsu T. T. C. (1995): Constitutive laws of softened concrete in biaxial tension-compression. ACI Structural Journal 92(5), 562-573.
Broo H. (2008): Shear and Torsion in Concrete Structures Non-linear Finte Element Analysis in Design and Assessment. Ph. D. Thesis, Department of Civil and Environmental Engineering, Structural Engineering, Concrete Structures, Chalmers University of Technology, Göteborg.
Broo H., Plos M., Lundgren K. and Engström B. (2007): Simulation of shear-type cracking and failure with non-linear finite element method. Magazine of Concrete Research 59(9), 673-687.
Broo H., Plos M., Lundgren K. and Engström B. (2008): Non-linear finite element analysis of the shear response in prestressed concrete bridges. Submitted to Magazine of Concrete Research in February 2008.
Carlsson F., Plos M., Norlin B. and Thelandersson S. (2008): Säkerhetsprinciper för bärighetsanalys av broar med icke-linjära metoder (Safety principles for structural assessment of bridges with non-linear methods. In Swedish.). Report TVBK - 3056, Lund University of Technology, Lund, Sweden.
CEB (1993): CEB-FIP Model Code 1990, Bulletin d'Information 213/214, Lausanne, Switzerland, 1993.
Cervenka V., Cervenka J. and Pukl R. (2007): Safety assessment in fracture analysis of concrete structures. The 6th International Conference on Fracture Mechanics of Concrete and Concrete Stuctures, Catania, Italy, 2007, 1043-1049.
EN1992-2 C. T. S. (2005): Eurocode 2: Design of concrete structures Part 2: Concrete bridges Design and detailing rules, European Committee for Standardization, Brussels, 2005.
fib (1999): Structural concrete. Textbook on Behaviour, Design and Performance Updated knowledge of the CEB/FIP Model Code 1990, International Federation for Structural Concrete (fib), Lausanne, Switzerland, 1999.
Hanjari K. Z. (2008): Load-Carrying Capacity of Damaged Concrete Structures. Licentiate Thesis, Civil and Environmental Engineering, Structural Engineering, Chalmers University of Technology, Göteborg.
Hegger J., Sherif A. and Görtz S. (2004): Investigation of Pre- and Postcracking Shear Behavior of Prestressed Concrete Beams Using Innovative Measuring Techniques. ACI Structural Journal 101(2), 183-192.
Jirásek M. (2004): Modeling of localized inelastic deformation - Lecture notes, Czech Technical University, Prague, 2004.
Kettil P., Rodenas J. J., Torres C. A. and Wiberg N. E. (2007): Strength and deformation of arbitrary beam sections using adaptive FEM. Computers & Structures 85(1-2), 15-29.
CHALMERS, Department of Civil and Environmental Engineering, Report 2008:18
25

Lackner R. and Mang H. A. (2003): Scale transition in steel-concrete interaction. I:Model. Journal of Engineering Mechanics 129(4), 393-402.
Lundgren K. (1999): Three-dimensional modelling of bond in reinforced concrete: Theoretical model, experiments and applications. PhD Thesis, Department of Structural Engineering/Concrete Structures, Chalmers University of Technology, Göteborg, Sweden.
Lundgren K., Broo H. and Engström B. (2004): Analyses of hollow core floors subjected to shear and torsion. Structural Concrete 5(4), 1464-4177.
Maekawa K., Pinmanmas A. and Okmura H. (2003): Nonlinear mechanics of reinforced concrete, Spon Press, London, 2003.
Pang X.-B. D. (1991): Constitutive laws of reinforced concrete in shear. Dissertation, The Faculty of the Department of Civil and Environmental Engineering, University of Houston, Houston, TX.
Pang X.-B. D. and Hsu T. T. C. (1995): Behavior of reinforced concrete membrane elements in shear. ACI Structural Journal 92(6), 665-679.
Plos M. (2004): Structural Assessment of the Källösund Bridge using Finite Element Analysis - Evaluation of the load carrying capacity for ULS. Rapport 04:1, Concrete Structures, Department of Structural and Mechanical Engineering, Chalmers University of Technology, Göteborg, Sweden.
Plos M., Gylltoft K., Jeppson J., Carlsson F., Thelandersson S., Enochsson O. and Elfgren L. (2004): Evaluering av bärförmåga hos broar med hjälp av förfinade analysmetoder Ett samarbetsprojekt mellan LTH, LTU och Chalmers, (In Swedish). Rapport 04:3, Institutionen för konstruktion och mekanik, Betongbyggnad, Göteborg, Sweden.
Plos M., Lundgren K., Rempling R., Gylltoft K., Cervenka J., Thelandersson S., Elfgren L., Herwig A., Brühwiler E., Rosell E. and Gillesén C. (2007): Non-Linear Analysis and Remaining Fatigue Life. Background document D4.5, Prepared by Sustainable Bridges - a project within EU FP6. Available from www.sustainablebridges.com
Prisco M. d. and Gambarova P. G. (1995): Comprehensive Model for Study of Shear in Thin-Webbed RC and PC Beams. Journal of Structural Engineering 121(12), 1822-1831.
Soltani M., An X. and Maekawa K. (2003): Computational model for post cracking analysis of RC membrane elements based on local stress-strain characteristics. Engineering Structures 25), 993-1007.
Sustainable Bridges (2007a): Guideline for Inspection and Condition Assessment of Existing European Railway Bridges: Including advices on the use of non-destructive testing, Sustainable Bridges - Assessment for Future Traffic Demands and Longer Lives: a project within EU:s 6th framework programme, 2007a. Available from www.sustainablebridges.net
Sustainable Bridges (2007b): Guideline for Load and Resistance Assessment of Existing European Railway Bridges: Advices on the use of advanced methods, Sustainable Bridges - Assessment for Future Traffic Demands and Longer
CHALMERS, Department of Civil and Environmental Engineering, Report 2008:18
26

CHALMERS, Department of Civil and Environmental Engineering, Report 2008:18
27
Lives: a project within EU:s 6th framework programme, 2007b. Available from www.sustainablebridges.net
TNO (2004): DIANA Finite Element Analysis User's Manual release 9, TNO DIANA BV, Delft, the Netherlands, 2004.
Walraven J. and Stroband J. (1999): Shear capacity of high strength concrete beams with shear reinforcement. 5th International Symposium on Utilization of High Strength/ High Performance Concrete, Rica Park Hotel Sandefjord, Norway, 1999, 693-700.
Vecchio F. J. and Collins M. P. (1986): The modified compression-field theory for reinforced concrete elements subjected to shear. Journal of the American Concrete Institute 83(2), 219-231.
Vecchio F. J. and Collins M. P. (1993): Compression response of cracked reinforced concrete. Journal of Structural Engineering 119(12), 3590-3610.
Vecchio F. J., Lai D., Shim W. and Ng J. (2001): Disturbed Stress Field model for Reinforced Concrete: Validation. Journal of Structural Engineering 127(4), 350-358.
Zararis P. D. (1996): Concrete Shear Failure in Reinforced-Concrete Elements. Journal of Structural Engineering 122(9), 1006-1015.