a guide to market research for colleges and universities
TRANSCRIPT

A Guide to Market Research for Colleges and UniversitiesThree key data types fordeveloping relevant programs

SummaryTwo common scenarios drive the need for data about new academic programs:
1) The need to justify the feasibility of a program that an institution already has in mind
2) A strategic question about what new opportunities may exist in a particular market
Data can facilitate both of these processes by helping your institution assess the need for a particular program, gauge student interest, learn how to differentiate course offerings from competitor programs, evaluate economic sustainability, and prepare a credible argument for the allocation of resources.
Topics & Questions1) Competitive Analysis with Degree Completion Data
What are the strengths and weaknesses of degree completion data, and how can you use it to find opportunities or verify the potential of a program idea?
2) Program Viability with Labor Market Data
How can you use labor market data (both industry and occupation data) to further verify the viability, timeliness, and relevance of potential programs?
2) Curriculum Planning with Employer & Job Postings Data
How can you use business and job postings data to construct programs that align with workforce needs and prospective student markets?
A GUIDE TO MARKET RESEARCH FOR COLLEGES AND UNIVERSITIES 1

A GUIDE TO MARKET RESEARCH FOR COLLEGES AND UNIVERSITIES 2
Introduction & PurposeNew academic programs yield innovation. They keep institutions relevant and competitive. They enliven campus culture, offer fresh perspectives and expertise, and push beyond the limits of your current course catalog to include what students really want to know and what employers need.
So it’s exciting to start a new academic program—especially for those involved with qualifying a new idea or exploring options in a particular market.
But new programs are inherently risky. Even an online program requires additional investment in personnel and marketing and outreach resources, among other costs. If the program is unlikely to produce enough revenue to cover those budgetary costs, the program is probably not sustainable.
That’s why it’s a good idea to have market research processes in place prior to seeking approval for new programs. This guide will help those tasked with innovating or validating programs by outlining the key data to look for and exactly where you can find it.
What Do You Need To Know?To conduct thorough market research, there are several questions you need to answer.
Is there a need for more graduates with the skills and knowledge that will be learned in this program? Is that need concentrated in your state or region? Would this program be more successful online or on campus? How can you gauge prospective student interest? How can your institution differentiate its course offerings and stand out from competitors? How should you market your program?
The answers to these questions (informed by labor market and education data) will help you stay competitive, drive enrollment, and prepare the best-possible program rationale.

Competitive Analysis with Degree Completion Data1
A GUIDE TO MARKET RESEARCH FOR COLLEGES AND UNIVERSITIES 3
Education DataThe Integrated Postsecondary Education Data System (IPEDS) is one of the most useful data sources available to universities and colleges when evaluating new program potential.
Developed by the US Department of Education’s National Center for Education Statistics, IPEDS collects data from every college, university, and technical and vocational institution that participates in federal student financial aid programs.
IPEDS data is organized into a taxonomy called the Classification of Instructional Programs (CIP) system. The CIP system tracks and reports on fields of study and completions activity.
This data has a variety of uses for market research, primarily in terms of assessing the competitor landscape:
• View nearby, competitor, and online program completion data to determine whether or not there is a strong demand for a specific program
• Identify competitor programs, for further research to determine how you can differentiate your program
• Learn how you might tweak your program name and course offerings, if a similar program or emphasis is popular
This information is extraordinarily valuable. In order to measure potential interest, improve upon your marketing strategies, and differentiate your program offerings, you have to know your competition.

A GUIDE TO MARKET RESEARCH FOR COLLEGES AND UNIVERSITIES 4
But because IPEDS is so comprehensive, it can be bewildering and difficult to navigate. CIP classifications do not necessarily match up with the exact names of majors, so even finding your institution’s own completers might be difficult. How can you make sense of it?
One method is to try different levels of detail. If you can’t find what you’re looking for at a more detailed level, you’ll often be able to find it with a broader view—and vice versa. The CIP tax-onomy is organized on three levels:
1) The two-digit series: general groupings of related programs
2) The four-digit series: intermediate groupings of programs that have comparable content and objectives
3) The six-digit series: specific instructional programs
IPEDS can also tell you if a specific institution offers a similar program. You can compare prices, enrollment, financial aid, student success, and finances. You can even see if it offers an online option for that program (this is one way to estimate online program popularity).
Unfortunately, if you are interested in further investigating online programs, IPEDS data only goes so far. While it distinguishes between online and residential program counts, information on the degree completion level is reported in aggregate by institution. But there is a trick for getting a sense of how many students are graduating with online degrees in a certain discipline. To do this, analyze completions data for traditionally online universities (such as Southern New Hampshire University, Western Governors University, Capella University, etc.). By viewing these schools’ degrees and completions, you can estimate interest, popularity, and need.
How else can IPEDS data be used for market research? With this information, you can easily see whether or not your institution can compete with other programs in terms of tuition rates, scholarship offerings, etc. For example, if the degree program you want to start is popular but the average price of the program is higher than your institution would charge, the program may still be a worthwhile opportunity for you.
A GUIDE TO MARKET RESEARCH FOR COLLEGES AND UNIVERSITIES 5
• Because the Higher Education Act of 1965, as amended, requires that institutions that participate in federal student aid programs report data to IPEDS, the data is a very comprehensive source.
• IPEDS data has several uses, including providing the market research information necessary for universities and colleges to evaluate new and existing programs.
• IPEDS allows you to view information for an individual institution, compare institutions side-by-side, or view trends for certain variables.
• Institutions self-report their information to IPEDS, so the possibility of error exists, particularly in regard to the reported programs of study.
• There is about a year lag between when IPEDS collects its data and when it is released.
• IPEDS is not comprehensive of all education and training programs (e.g. General Assembly and other non-traditional education and training programs are not included in this data).
• Programs that are offered online are flagged as such, but their enrollments and completions cannot be split out to show number of brick-and-mortar completions vs. number of online completions.
• The CIP taxonomy is not intuitively organized; its classifications do not necessarily match up with the exact names of majors, and similar programs may not be found within the same six-, four-, or even two-digit series.
STRENGTHS OF IPEDS DATA
WEAKNESSES OF IPEDS DATA
ExampleLet’s say that a university in Washington State is interested in starting an online bachelor’s program for graphic design. Program evaluators may want to start their analysis with a broad CIP category, such as the four-digit CIP code design and applied arts (50.04) and then dive deeper into detail with graphic design (50.0409).
A GUIDE TO MARKET RESEARCH FOR COLLEGES AND UNIVERSITIES 6
But it’s also common for there to be additional, related CIP codes that may inform your analysis, especially at the greatest detail levels. For example, you might want to also check out design and visual communications, general (50.0501), which would have been captured by your four-digit analysis. However, there may be relevant programs that aren’t immediately visible even at a broader view, such as web page, digital/multimedia, and information resources design (11.0801). Finding these pertinent CIP codes that are not included in the same broad category is one of the greatest difficulties of using IPEDS data.
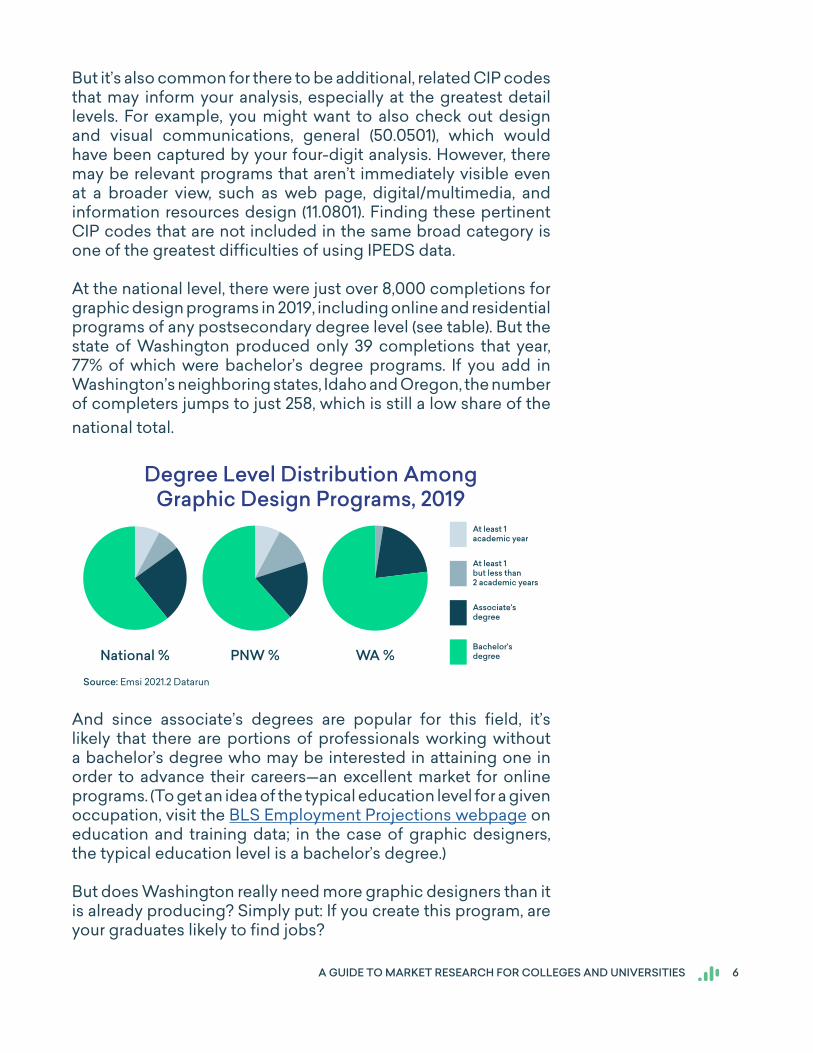
At the national level, there were just over 8,000 completions for graphic design programs in 2019, including online and residential programs of any postsecondary degree level (see table). But the state of Washington produced only 39 completions that year, 77% of which were bachelor’s degree programs. If you add in Washington’s neighboring states, Idaho and Oregon, the number of completers jumps to just 258, which is still a low share of the national total.
Bachelor's degree
Associate's degree
At least 1 but less than2 academic years
At least 1academic year
WA %PNW %National %
Degree Level Distribution AmongGraphic Design Programs, 2019
Source: Emsi 2021.2 Datarun
And since associate’s degrees are popular for this field, it’s likely that there are portions of professionals working without a bachelor’s degree who may be interested in attaining one in order to advance their careers—an excellent market for online programs. (To get an idea of the typical education level for a given occupation, visit the BLS Employment Projections webpage on education and training data; in the case of graphic designers, the typical education level is a bachelor’s degree.)
But does Washington really need more graphic designers than it is already producing? Simply put: If you create this program, are your graduates likely to find jobs?

Program Viability withLabor Market Data2
A GUIDE TO MARKET RESEARCH FOR COLLEGES AND UNIVERSITIES 7
Occupation DataOnce you’ve determined that similar programs are producing enough completers to indicate student interest, it’s important to look at labor market data to evaluate whether or not those programs are producing more completers than there are jobs.
If that’s the case, then interest in the program could very well decline. (This is especially true for fields in science, technology, engineering, mathematics, and health care, which are more closely aligned with career pathways than the humanities and social sciences.) If the program trains for a specific occupation or set of occupations, you’ll want to analyze those occupations for wage potential, job counts, and growth.
This information can be largely accessed via Occupational Em-ployment and Wage Statistics (OEWS; commonly referred to as OES), a program managed by the Bureau of Labor Statistics (BLS) that produces employment and wage estimates annually for over 800 occupations. Similar to IPEDS, OES data is available at different detail levels, ranging from two-digit to six digit and organized in a taxonomy called the Standard Occupation Clas-sification (SOC). These estimates are available for the nation as a whole, for individual states, and for metropolitan and nonmet-ropolitan areas.
You can adapt your search criteria based on the target audience for the particular online program, but the national, regional, and state level might be the best places to start—unless your pool of prospective students is largely local. However, you’ll find that it is much easier to search an individual dataset than to capture historical trends (which is unfortunate because trends provide valuable context that could inform whether or not your new
A GUIDE TO MARKET RESEARCH FOR COLLEGES AND UNIVERSITIES 8
program will be sustainable over time).
National occupational estimates for specific industries (also known as staffing patterns) are also available, although the “Create Customized Tables” function (which you have to use to build a full staffing pattern list) is difficult to use, largely because you have to scroll through hundreds of occupations to find the one you are looking for. Nonetheless, this information is important to your research; it will help you better analyze industry data, which is covered in the next section.
• OES is merely a survey and is not based on administrative records; because of this, OES’s figures aren’t as comprehensive as most industry data.
• Not all metropolitan and nonmetropolitan areas have information for all occupations.
• Only 57% of employment is covered in the OES survey, which excludes all industries under NAICS 11 (agriculture, forestry, fishing, and hunting) except for logging, support activities for crop production, and support activities for animal production.
• The OES survey takes up to three years to complete, so the BLS states that it is less useful for measuring change in job counts or wages over time.
OES has estimates for:
• Specific industries, including national industry-specific occupational employment and wage estimates.
• Individual states, including cross-industry occupational employment and wage estimates for individual states.
• Metropolitan and nonmetropolitan areas, which together cover the entire United States.
STRENGTHS OF OES DATA
WEAKNESSES OF OES DATA

A GUIDE TO MARKET RESEARCH FOR COLLEGES AND UNIVERSITIES 9
ExampleFor a potential graphic design program, occupation analysis (see table) is much easier than it would be for a more open-ended program, such as English literature or history. That’s because the degree directly corresponds to an occupation, such as graphic designers (27-1024).
Graphic DesignOccupation Analysis
Source: Emsi 2021.2 Datarun
Growth at the state and regional level is great news for an online program in graphic design, although a slight national decline indicates there may be more to the story. This data suggests that there will be a pool of prospective students with interest in a career in graphic design. Your program could help them reach their goals.
Industry DataIndustry data is another great source that can deepen your understanding of labor market opportunities. Instead of looking at an individual occupation, you can view how a variety of occupations are captured within an industry—everything from facilities personnel to senior executives—and assess job counts, growth, average annual earnings, and regional industry concentration (also known as location quotient).
What can this data tell you? It can offer not only an idea of the entry-level occupations available to your graduates but also a broader picture of how the industry is doing overall, which can indicate ongoing opportunities available throughout your graduates’ careers.
A GUIDE TO MARKET RESEARCH FOR COLLEGES AND UNIVERSITIES 10
Also, as discussed earlier, the target occupation for your gradu-ates is likely employed by a variety of industries. Knowing which of those industries are doing well versus which are doing poorly can help you strategically plan your course offerings so that your students receive an education that gives them an advantage in the healthier fields.
Much of this data is available from the Quarterly Census of Employment and Wages (QCEW) program, which is also managed by the BLS and organized in a taxonomy called the North American Industry Classification System (NAICS).
The QCEW program publishes a quarterly count of employment and wages reported by employers, covering 98% of US wage and salary jobs—available at the county, metropolitan statistical area (MSA), state, and national levels by industry. Unfortunately, there is a five- to six-month lag time between when the BLS collects the data and when it is reported, and the county-level data, which is the greatest level of geographic detail available, is largely suppressed to help protect the privacy of local businesses. So although this data is a great resource, there are significant challenges for using it to conduct a comprehensive analysis.
• Because QCEW is based on official government documentation (via state and federal unemployment agencies), the data is highly reliable and is considered the “gold standard” of industry data and of employment counts in the United States.
• QCEW is comprehensive, capturing 95% of US wage-and-salary jobs.
• QCEW can be viewed at a variety of detail levels, both geographically (by county, MSA, state, or national levels) and by industry level (available at 2-, 3-, 4-, 5-, and 6-digit levels).
STRENGTHS OF QCEW DATA

A GUIDE TO MARKET RESEARCH FOR COLLEGES AND UNIVERSITIES 11
ExampleAs demonstrated in the chart, industry data provides insight into how you might structure a program. (It may be valuable to conduct the following analysis for your region and state as well —not just the nation.
Designers in Industry, 2014 Designers in Industry, 2019
2014-2019 Change (%)
Graphic DesignServices
Interior DesignServices
CommercialPrinting
AdvertisingAgencies
CorporateOffices
Other SpecializedDesign Services
NewspaperPublishers
Source: Emsi 2021.2 Datarun
Top Industries EmployingGraphic Designers, 2014-2019
• There is about a five- to six-month lag between when the initial data is collected and when it is released. The releases occur quarterly.
• Much of QCEW’s private-sector county level data (approximately 60%) is suppressed to protect the confidentiality of certain local businesses.
• QCEW does not report on self-employed, military, railroad, and certain farm, domestic, and non-profit workers, among others.
WEAKNESSES OF QCEW DATA

A GUIDE TO MARKET RESEARCH FOR COLLEGES AND UNIVERSITIES 12
For example, the newspaper industry is still a top employer of graphic designers, but the industry is shrinking. The number of graphic designers employed in the industry fell 27% between 2014 and 2019. So it might be a good idea to de-emphasize newspaper design in your curriculum.
Conversely, the Interior Design Services industry is employing a growing number of graphic designers (and the industry has risen dramatically in these rankings since the initial edition of this guide was published). This shift could indicate an opportunity to investigate industry crossover (people who completed a degree in graphic design but who are instead finding jobs in interior design), or to develop or add courses that could provide skills and insights in an adjacent industry that is booming for graphic designers.

A GUIDE TO MARKET RESEARCH FOR COLLEGES AND UNIVERSITIES 13
Curriculum Planning withEmployer & Job Postings Data3
When it comes to information about potential interest and course planning, who better to look to than the businesses most likely to hire your graduates? Provided by a variety of vendors, business data allows you to research a given geography (local, statewide, regional, or national) down to specific business names for a particular industry or set of industries. Or, if you already know which business you’d like to speak with, you can search for their contact information on your own. Utilizing business data may be as simple as collecting contact information for the top businesses in a certain field and geographic location, or you may prefer to analyze job postings for insights into skills and curriculum planning.
General Business DataGeneral business data helps you determine who might be a good resource as you develop your program, allowing you to initiate valuable conversations and collect expert feedback. In the initial stages of program qualification, these conversations can help you decide whether or not your program will be in demand, or if it should be tweaked slightly in order to be more aligned with workforce needs and, therefore, non-traditional student interests. Unfortunately, this process can be quite time-consuming.
But there’s an upside. By collaborating with businesses for program planning, your institution can also cultivate partnerships that may ultimately help you secure internships or job placement opportunities for students, further strengthening your new program’s appeal and reputation.

A GUIDE TO MARKET RESEARCH FOR COLLEGES AND UNIVERSITIES 14
In addition, occupation comparisons and skills transferability information, largely accessed via conversations with businesses, can offer valuable analysis into prospective student markets. Countless prospective students may be working in lower-level yet similar jobs to what your program trains for, but it may be difficult to identify those markets without speaking to businesses directly.
Business data is often sourced from new business filings, utility connections, press releases, corporate websites, annual reports, user-generated feedback, and yellow pages. While exact data points will vary based on vendor (and/or the thoroughness of a web search), you can expect to learn:
• Geographic area, type of business, NAICS code, sales volume, employee size, etc.
• Contact information to facilitate relationship building.
Business data tends to be:
• Self-reported, collected by vendors primarily through surveys, which means that some of the information is unreliable.
• Frequently out of date and the quality varies from vendor to vendor.
• Quite expensive.
STRENGTHS OF BUSINESS DATA
WEAKNESSES OF BUSINESS DATA
Job Posting AnalyticsJob postings analytics (JPA) can help you conduct in-depth analysis without having to interview businesses one by one. By using job postings to familiarize yourself with the skills and knowledge that businesses look for in an ideal candidate, you can structure your new program to lead students to success. Especially when job postings are viewed in context with hires, you gain perspective on potential skills gaps and surpluses, which can inform curriculum planning. This process will help your program prepare students for the current job market,

A GUIDE TO MARKET RESEARCH FOR COLLEGES AND UNIVERSITIES 15
thereby appealing to first-time degree seekers and returning learners alike.
But JPA does have some limitations. Most notably, this data only captures jobs that are posted online. While online postings are more and more common, some businesses still use other methods to advertise their openings, or simply fill positions via world-of-mouth referrals and personal networks. If the industry or occupation you’re researching mostly relies on these alternative methods, it would be important to supplement JPA by talking directly to business owners or checking the offline places where they do post.
It’s also important to note that job postings are not a perfect measure of overall hiring demand because one posting does not necessarily equal one opening. In fact, we’ve seen that posting behavior varies by industry. Companies may over-post or under-post, depending on their needs and how their HR team plans to attract and vet candidates.
• Provide insight into skills and requirements desired by employers.
• Allow for analysis of the market across multiple businesses, industries, or regions, rather than speaking directly with individual businesses.
• Virtually no time lag, since job postings are live.
• Help measure the demand for talent in a given region.
• May provide limited insight, depending on the field that your new program will train for.
• Imperfect measure of hiring demand.
• Job postings describe the ideal candidate and are sometimes not grounded in reality, which means your graduates may not need all of the skills listed to be successful.
• Many companies post duplicate ads for the same job (indicating they are aggressively seeking talent), which can be cumbersome to sort through.
STRENGTHS OF JOB POSTINGS DATA
WEAKNESSES OF JOB POSTINGS DATA

A GUIDE TO MARKET RESEARCH FOR COLLEGES AND UNIVERSITIES 16
ExampleTo get an idea of who might hire the graduates of our graphic design program in Washington, we’ll take a look at which companies in the area are hiring graphic designers. There are a variety of vendors and websites, such as Indeed.com, where you can access job postings data like this. To start, we’ll look at companies that posted the most ads for graphic designers in Washington between May 2020 and April 2021 (see table).
Source: Emsi 2021.2 Datarun
By analyzing posting intensity (the number of duplicate postings per unique posting), you can see which companies are searching most vigorously for new hires. You could contact those businesses for professional insight into program development, or simply peruse job postings for information about necessary skills, cities with the most hiring activity (which could inform marketing strategies for your potential program), and level of required certification.
Next, we’ll examine the skills commonly requested in these job postings.
A GUIDE TO MARKET RESEARCH FOR COLLEGES AND UNIVERSITIES 17
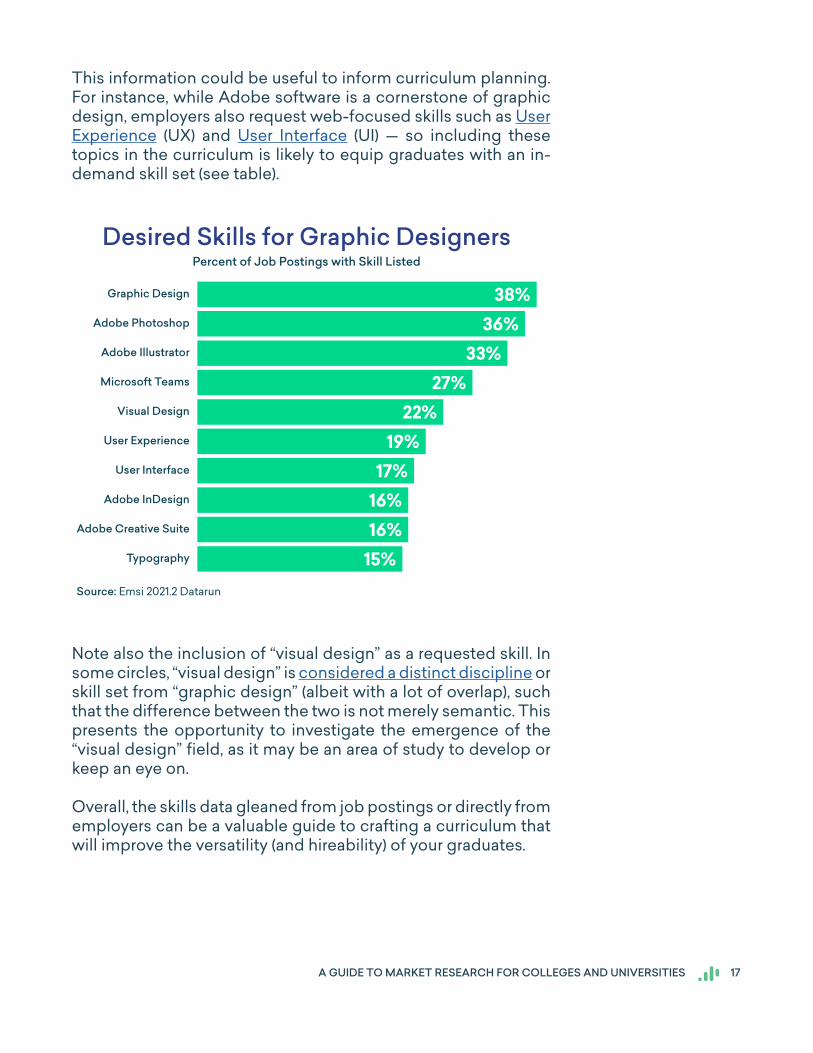
This information could be useful to inform curriculum planning. For instance, while Adobe software is a cornerstone of graphic design, employers also request web-focused skills such as User Experience (UX) and User Interface (UI) — so including these topics in the curriculum is likely to equip graduates with an in-demand skill set (see table).
Typography
Adobe Creative Suite
Adobe InDesign
User Interface
User Experience
Visual Design
Microsoft Teams
Adobe Illustrator
Adobe Photoshop
Graphic Design
Desired Skills for Graphic Designers
Source: Emsi 2021.2 Datarun
Percent of Job Postings with Skill Listed
Note also the inclusion of “visual design” as a requested skill. In some circles, “visual design” is considered a distinct discipline or skill set from “graphic design” (albeit with a lot of overlap), such that the difference between the two is not merely semantic. This presents the opportunity to investigate the emergence of the “visual design” field, as it may be an area of study to develop or keep an eye on.
Overall, the skills data gleaned from job postings or directly from employers can be a valuable guide to crafting a curriculum that will improve the versatility (and hireability) of your graduates.
A GUIDE TO MARKET RESEARCH FOR COLLEGES AND UNIVERSITIES 18
ConclusionFaculty and staff who are tasked with researching new program opportunities are in a unique position to strengthen proposals as much as possible by including valid, external data about the economic and labor market context of these programs. But the best news? This process of gathering and analyzing data does not have to be time-consuming or difficult; when the data is packaged well, you can do it in an afternoon.
With quality data, you can quickly quantify the demand for and viability of a new program, size up the competition, pinpoint new markets for prospective nontraditional and traditional students alike, and identify course offerings that would make your program (and potential graduates) more competitive.
Coupled with insights from students and alumni, faculty and institutional strengths, consensus-building conversations or other elements of program development, data provides a vital real-world basis against which to calibrate strategic program decisions. Ultimately, for programs that make the cut and move forward, this data will also provide trustworthy documentation that can justify allocation of resources, making your research well worth the effort.
Current, Complete, and Ready to UseAs we’ve detailed in this report, education and labor market data is not the easiest to work with; it can be scattered, full of holes, and frequently obsolete. But Emsi addresses these weaknesses to deliver a level of data quality that is greater than the sum of its sources. We collect labor market data from more than 90 different sources, patch the holes using proprietary algorithms, bring it up to date, and deliver it via intuitive software so that you can use it effectively. With Emsi, finding, analyzing, and sharing this data is easy.
Our composite dataset gives you valuable insight on the following (and much more):
• Education institution data, including degree completions • Occupation growth, decline, and projections • Industry trends and projections • Business contact information • Job posting analytics • Occupation comparisons and skills transferability• Skills from job postings, resumes, and online profiles
DetailedTypical labor market data ignores much of the economy, suppressing 60% of county level data about wage-and-salary workers. Government data also generally excludes proprietors, understating the total number of workers by an average of 17%. In contrast, Emsi data removes suppressions and includes proprietors, painting a more complete picture of the workforce.
Comprehensive Job Posting AnalyticsEmsi collects its job postings data from hundreds of millions of online job postings created by employers, then removes duplicates to present an estimate of total unique postings. Emsi is also able to provide the following insights about job postings so that you can extract key information at a glance:
• Occupation (O*NET and SOC) • Location (nation, state, MSA, county, and census tract) • Top Skills • Unique Skills• Certifications • Posting Intensity • Top Companies Posting (+ intensity/trend) • Top Cities Posting (+ intensity/trend)
Intuitive NavigationWith Emsi, you can explore the data you need to conduct new program analysis—presented in a way that people understand. Our education and labor market data software contains linked data tables, featuring staffing patterns and occupation-to-pro-gram mappings that allow you to easily jump from information about educational institutions to occupations, to industry trends, and then to business data, all within a few clicks. We also feature many of these mappings in presentation-ready reports—includ-ing program, occupation, and industry overviews.
Focused WorkflowsIn addition to open-ended reporting capability, our software contains offerings specific to program development and review. This structured workflow guides you through the main steps of program development: defining a program, analyzing the competitive landscape, assessing labor market demand, and exploring relevant skills. Along the way, it’ll provide suggestions for related programs, occupations, or skills based on your inputs, so you don’t have to navigate CIP or SOC taxonomies on your own. Once again, the data is easy to use and can be exported as presentation-ready reports.
Search, Customize, Export, Share In Emsi’s education and labor market data software, you can effortlessly find what you are looking for by searching for programs, job titles, and industry names. When you find the information you need, you can quickly customize the results by adding or removing columns. Then export and share in a matter of seconds.
About EmsiEmsi is a leading provider of labor market data to professionals in higher education, economic development, workforce development, talent acquisition, and site selection. Emsi data is used to solve a variety of problems: align programs with regional needs, equip students with career visions, understand regional economic and workforce activity, and find and hire the right talent. Emsi serves clients across the US, UK, and Canada.
Want More Information?Contact us to learn more about how Emsi data can benefit you and your institution.
https://www.economicmodeling.com/higher-education/