a grey wolf optimizer for modular granular neural networks...
TRANSCRIPT

Research ArticleA Grey Wolf Optimizer for Modular Granular Neural Networksfor Human Recognition
Daniela Saacutenchez Patricia Melin and Oscar Castillo
Tijuana Institute of Technology Tijuana BC Mexico
Correspondence should be addressed to Oscar Castillo ocastillotectijuanamx
Received 25 February 2017 Revised 17 June 2017 Accepted 10 July 2017 Published 14 August 2017
Academic Editor Jose Alfredo Hernandez-Perez
Copyright copy 2017 Daniela Sanchez et alThis is an open access article distributed under theCreativeCommonsAttributionLicensewhich permits unrestricted use distribution and reproduction in any medium provided the original work is properly cited
A grey wolf optimizer for modular neural network (MNN) with a granular approach is proposed The proposed method performsoptimal granulation of data and design of modular neural networks architectures to perform human recognition and to proveits effectiveness benchmark databases of ear iris and face biometric measures are used to perform tests and comparisons againstother works The design of a modular granular neural network (MGNN) consists in finding optimal parameters of its architecturethese parameters are the number of subgranules percentage of data for the training phase learning algorithm goal error numberof hidden layers and their number of neurons Nowadays there is a great variety of approaches and new techniques within theevolutionary computing area and these approaches and techniques have emerged to help find optimal solutions to problems ormodels and bioinspired algorithms are part of this area In this work a grey wolf optimizer is proposed for the design of modulargranular neural networks and the results are compared against a genetic algorithm and a firefly algorithm in order to know whichof these techniques provides better results when applied to human recognition
1 Introduction
In this paper a grey wolf optimizer for modular granularneural networks (MGNN) is proposed The main goal ofthis optimizer is the design of modular neural networksarchitectures using a granular approach and to evaluate itseffectiveness these modular granular neural networks areapplied to one of the most important pattern recognitionproblems human recognition For a long time human recog-nition has been a widely studied area where its study mainlylies in finding those techniques and biometric measures thatallowhaving a trustworthy identification of persons to protectinformation or areas [1 2] Some of the most used biometricmeasures are face [3 4] iris [5] ear [6 7] voice [8] veinpattern [9] hand geometry [10] signature [11] and gait [12]among others
On the other hand within the most used techniques arethose that belong to the soft computing category such as arti-ficial neural networks [13 14] fuzzy logic [15] computationalvision [16] granular computing [17 18] datamining [19] andevolutionary computation [20 21] Within the evolutionarycomputation area bioinspired algorithms are found to be
one of type of method The already well-known geneticalgorithm (GA) [22 23] ant colony system (ACO) [24]particle swarm optimization (PSO) [25] bat algorithm (BA)[26] grey wolf optimizer (GWO) [27] harmony search (HS)[28] gravitational search algorithm (GSA) [29] and fireflyalgorithm (FA) [30 31] just to mention a few belong to thiscategory
It is important to mention that some soft computingtechniques such as neural networks and fuzzy logic combinedwith a bioinspired algorithm can allow achieving betterperformance when they are individually used When twoor more techniques are combined the resulting system iscalled hybrid intelligent system [7 32] In this paper ahybrid intelligent system is proposed using modular neuralnetworks (MNN) granular computing (GrC) and a greywolf optimizer (GWO) The optimization of artificial neuralnetwork (ANN) using a grey wolf optimizer was alreadyproposed in [33ndash36] These works applied their methodsto classification and function-approximation where optimalinitials weights of a neural network are sought using the greywolf optimizer
HindawiComputational Intelligence and NeuroscienceVolume 2017 Article ID 4180510 26 pageshttpsdoiorg10115520174180510
2 Computational Intelligence and Neuroscience
Submodule 1
Submodule 2
Submodule 3
Input
Hidden layersfrom
to h1
Output
Grey wolf optimizer
Final answer
Granule or database
Subgranule 1
Subgranule 2
Subgranule 3
Subgranule m
Figure 1 The general architecture of proposed method
A modular neural network is an improvement of theconventional artificial neural network where a task is dividedinto subtasks and an expert module learns some of thesesubtasks without communication with other modules thistechnique allows having systems resistant to failures andworks with a large amount of information Usually this kindof networks has been used for human recognition based onbiometric measures classification problems and time seriesprediction [40] On the other hand granular computingdefines granules as classes or subsets used for complexapplications to build computational models where a largeamounts of data and information are used [19 41 42] In thiswork granular computing is applied to performgranulation ofinformation into subsets that also define number of modulesof a modular neural network the combination of modu-lar neural networks and granular computing was alreadyproposed in [7 37 38] where the advantages of modulargranular neural networks over conventional neural networksand modular neural networks were widely demonstratedIn [7] the modular granular neural network architectureswere designed using an improvement of a genetic algorithma hierarchical genetic algorithm (HGA) where the maindifferences between them are the control genes in the HGAthat allow activating and deactivating genes allowing solvingcomplex problems That design consisted in optimizationof number of modules (subgranules) percentage of datafor the training phase learning algorithm goal error andnumber of hidden layers with their respective number ofneurons In [38] a firefly algorithmwas proposed forMGNNoptimization using an experts submodules for each divisionof image In [37] also modular granular neural networkarchitectures were designed but using a firefly algorithm and
without an expert submodule for each division of image Inthis work the design of MGNN architecture is performedand applied to human recognition based on ear face and irisbut using a grey wolf optimizer statistical comparisons areperformed to define which of these optimization techniquesis better to perform optimization of MGNNs
This paper is organized as follows In Section 2 theproposed method is described The results achieved by theproposed method are explained in Section 3 In Section 4statistical comparisons of results are presented Finally con-clusions are given in Section 5
2 Proposed Method
The proposed hybrid intelligence method is described in thissection this method uses modular neural networks with agranular approach and their architectures are designed by agrey wolf optimizer
21 General Architecture of the Proposed Method The pro-posed method uses modular granular neural networks thiskind of artificial neural networkwas proposed in [7] and [37]and their optimization were performed using respectivelya hierarchical genetic algorithm and a firefly algorithm Inthis work the optimization is performed using a grey wolfoptimizer and a comparison among HGA FA and GWO isperformed to know which of these techniques is better forMGNN optimization As a main task the optimization tech-niques have to find the number of subgranules (modules)and as a preprocessing process each image is divided into3 regions of interest these regions will be described laterIn Figure 1 the granulation process used in this work and
Computational Intelligence and Neuroscience 3
Figure 2 Hierarchy of grey wolf
proposed in [7] is illustrated where a database representsa whole granule This granule can be divided into ldquomrdquosubgranules (modules) this parameter (m) can have up toa certain limit set depending on the application each ofthese subgranules can have different size for example whenthis granulation is applied to human recognition and eachgranule can have different number of persons that the cor-responding submodules will learn The grey wolf optimizerin this work performs optimization of the granulation andhidden layers and other parameters described later
211 Description of the Grey Wolf Optimizer This algorithmis based on the hunting behavior of grey wolf and wasproposed in [27] A group of wolves has been between 5 and12wolves and eachwolf pack has a dominant hierarchywherethe leaders are called alphas and this type of wolves makesthemost important decisions of the packThe complete socialdominant hierarchy is illustrated in Figure 2
This algorithm is based on 5 points social hierarchyencircling prey hunting attacking prey and search for preyThese points are explained as follows
Social Hierarchy The best solution is alpha (120572) the secondbest solution is beta (120573) the third best solution is delta(120575) and the rest of the population are considered as omega(120596) where the omega solutions follow alpha beta and deltawolves
Encircling Prey During the hunt process grey wolves encircletheir prey Mathematically model encircling behavior can berepresented using the equations
997888rarr119863 = 100381610038161003816100381610038161003816997888rarr119862 sdot 997888997888rarr119883119901 (119905) minus 997888rarr119883 (119905)100381610038161003816100381610038161003816 997888rarr119883 (119905 + 1) = 997888997888rarr119883119901 (119905) minus 997888rarr119860 sdot 997888rarr119863 (1)
where997888rarr119860 and997888rarr119862 are coefficient vectors997888997888rarr119883119901 is the prey positionvector 997888rarr119883 is the position vector of a grey wolf and 119905 is thecurrent iteration Vectors 997888rarr119860 and 997888rarr119862 are calculate by
997888rarr119860 = 2997888rarr119886 sdot 997888rarr1199031 minus 997888rarr119886 997888rarr119862 = 2 sdot 997888rarr1199032 (2)
where997888rarr1199031 and997888rarr1199032 are random vectors with values in 0 and 1 and997888rarr119886 is a vector with components that linearly decreased from 2to 0 during iterations
Hunting It is assumed that alpha beta and delta are the bestsolutions therefore they have knowledge about location ofprey as these solutions are saved the position of the othersearch agents is updated according to the position of the bestsearch agent This part is mathematically represented by997888rarr119863120572 = 100381610038161003816100381610038161003816997888rarr1198621 sdot 997888rarr119883120572 minus 997888rarr119883100381610038161003816100381610038161003816 997888rarr119863120573 = 100381610038161003816100381610038161003816997888rarr1198622 sdot 997888rarr119883120573 minus 997888rarr119883100381610038161003816100381610038161003816 997888rarr119863120575 = 100381610038161003816100381610038161003816997888rarr1198623 sdot 997888rarr119883120575 minus 997888rarr119883100381610038161003816100381610038161003816 997888rarr1198831 = 997888rarr119883120572 minus 997888rarr1198601 sdot (997888rarr119863120572)
997888rarr1198832 = 997888rarr119883120573 minus 997888rarr1198602 sdot (997888rarr119863120573) 997888rarr1198833 = 997888rarr119883120575 minus 997888rarr1198603 sdot (997888rarr119863120575)
997888rarr119883 (119905 + 1) = 997888rarr1198831 + 997888rarr1198832 + 997888rarr11988333
(3)
Attacking Prey (Exploitation) 997888rarr119886 decreases from 2 to 0 duringiterations and 997888rarr119860 has random numbers in an interval [minus119886 119886]so the next position of a search agent will be any positionbetween its current position and the prey
Search for Prey (Exploration) There are different componentsthat allow having divergence and a good exploration Thedivergence is mathematically modeled using 997888rarr119860 this partobliges solutions to diverge and to have a global searchmean-while 997888rarr119862 contains values in an interval [0 2] and provides tothe prey random weights to favor exploration and avoid alocal optima problem In Pseudocode 1 the pseudo code ofthe grey wolf optimizer is shown
212 Description of the Grey Wolf Optimizer for MGNNThe grey wolf optimizer seeks to optimize modular granularneural networks architectures The optimized parameters areas follows
(1) Number of subgranules (modules)(2) Percentage of data for the training phase(3) Learning algorithm (backpropagation algorithm for
training the MGNN)(4) Goal error(5) Number of hidden layers(6) Number of neurons of each hidden layerEach parameter is represented by a dimension in each
solution (search agent) and to determine the total numberof dimensions for each solution the next equation is used
Dimensions = 2 + (3 lowast 119898) + (119898 lowast ℎ) (4)
4 Computational Intelligence and Neuroscience
Initialize the grey wolf population119883119894 (119894 = 1 2 119899)Initialize a A and CCalculate the fitness of each search agent119883120572 = the best search agent119883120573 = the second best search agent119883120575 = the third best search agent
while (t ltMax number of iterations)for each search agent
Update the position of the current search agent by above equationsend forUpdate a A and CCalculate the fitness of all search agentsUpdate119883120572119883120573 and119883120575119905 = 119905 + 1
end whilereturn119883120572
Pseudocode 1 Pseudocode of the grey wolf optimizer
where 119898 is the maximum number of subgranules that thegrey wolf optimizer can use and ℎ is maximum of numberof hidden layers per module that the optimizer can use toperform the optimizationThevariablesmentioned above canbe established depending of the application or the databaseand the values used for this work are mentioned in the nextsection In Figure 3 the structure of each search agent isshown
This optimizer aims to minimize the recognition errorand the objective function is given by the equation
119891 = 119898sum119894=1
((sum119899119898119895=1119883119895)119899119898 ) (5)
where119898 is the total number of subgranules (modules) 119883119895 is0 if themodule provides the correct result and 1 if not and 119899119898is total number of dataimages used for testing phase in thecorresponding module
22 Proposed Method Applied to Human Recognition Oneof the most important parameters of the architecture is itslearning algorithm backpropagation algorithms are used inthe training phase to perform the learning and 3 variationsof this algorithm can be selected by the proposed optimizergradient descent with scaled conjugate gradient (SCG)gradient descent with adaptive learning and momentum(GDX) and gradient descent with adaptive learning (GDA)These 3 algorithms were selected because they have betweendemonstrated to be the fastest algorithms and with thembetter performances and results have been obtained [6 7 37ndash39]
Themain comparisons with the proposedmethod are theoptimizations proposed in [7 37 38] In the first one a hierar-chical genetic algorithm is developed in the second and thirdwork a firefly algorithm is developed to perform the MGNNoptimization and to have a fair comparison the numberof individualsfireflies and number of generationsiterationsused in [7 37 38] are the same used by the proposed method
in this work obviously for the GWO these values are numberof search agents and iterations In Table 1 the values ofthe parameters used for each optimization algorithm arepresented
As it was mentioned the number of dimensions isestablished using (4) where values such as ℎ and 119898 areestablished depending on the application For this work asin [7 37 38] the minimum and maximum values used forthe search space of each optimizer are shown in Table 2 Theoptimization techniques also have two stopping conditionswhen the maximum number of iterationsgenerations isachieved and when the best solution has error value equalto zero In Figure 4 the diagram of the proposed method isshown
23 Data Selection Databases and Preprocessing Thedescription of the databases data selection for each phase(training and testing) and the applied preprocessing arepresented below
231 Data Selection To understand the data selection it isimportant to mention that the MGNNs as the MNNs and theconventional ANNs have two important phases
(i) First phase neural network learns information orpatterns
(ii) Second phase neural network simulates other piecesof information not given for learning
As it was observed data selection is an important partof the neural network and for this reason in [7] a newmethod to select information or images was proposed In theproposed data selection depending of a percentage of data(a value between 20 and 80) for the training phase thispercentage is converted to a number of images (dependingof the number of images per person in the database) andrandomly images for each phase are selected In Figure 5 anexample is illustrated when a person has 4 images (as eardatabase) and 2 of them are for training phase
Computational Intelligence and Neuroscience 5
Table 1 Table of parameters
HGA [7] FA [37 38] GWOParameter Value Parameter Value Parameter ValueIndividuals (119899) 10 Fireflies 10 Search agents (119899) 10Maximum number ofgenerations (119905) 30 Maximum number of
iterations (119905) 30 Maximum number ofiterations (119905) 30
Number of modules
Percentage of data for training
Error goalmodule 1
Learning algorithms module 1
Number of hidden layersmodule 1
Neurons(hidden layer 1)
Neurons(hidden layer 2)
Neurons(hiddenlayer 3)
Neurons(hidden
Error goalmodule 3
Learning algorithms module 3
Number of hidden layersmodule 3
Neurons(hidden layer 1)
Neurons(hidden layer 2)
Neurons(hiddenlayer 3)
Neurons(hidden
Error goalmodule 2
Learning algorithms module 2
Number of hidden layersmodule 2
Neurons(hidden layer 1)
Neurons(hidden layer 2)
Neurons(hiddenlayer 3)
Neurons(hidden
Error goalmodule m module m module m
Learning algorithms
Number of hidden layers
Neurons(hidden layer 1)
Neurons(hidden layer 2)
Neurons(hiddenlayer 3)
Neurons(hidden
layer H1)
layer H2)
layer H3)
layer Hm)
middot middot middot
middot middot middot
middot middot middot
middot middot middot
middot middot middot
middot middot middot
middot middot middot
Figure 3 Structure of each search agent
Table 2 Table of values for search space
Parameters of MNNs Minimum MaximumModules (m) 1 10Percentage of data for training 20 80Error goal 0000001 0001Learning algorithm 1 3Hidden layers (h) 1 10Neurons for each hidden layers 20 400
232 Database of Ear The ear database is from the EarRecognition Laboratory of the University of Science amp Tech-nology Beijing (USTB) The database contains 77 personswhere each person has 4 images of one ear The image
dimensions are 300 times 400 with BMP format [47] A sampleof the images is shown in Figure 6
233 Database of Face (ORL) The ORL database contains40 persons and each person has 10 images This database isfrom the ATampT Laboratories Cambridge where each imagehas a dimension of 92 times 112 pixels with PGM format Figure 7shows a sample of the images of this database [48]
234 Database of Face (FERET) The FERET database [49]contains 11338 images from 994 persons and each image hasa dimension of 512 times 768 pixels with PGM format Figure 8shows a sample of the images of this database
235 Database of Iris The iris database [50] contains 77persons each person has 14 images The image dimensions
6 Computational Intelligence and Neuroscience
Initialize grey wolf population a A and C
Update the position of the current search agent
Max iterationsorerror == 0
Yes
No
End
Start
Determine values of
Calculate the fitness of each search agent
Updatea A and C
From i = 1 to n
Calculate the fitness of all search agents
Update
Submodule 1Submodule 2Submodule 3
Input
Hidden layersfrom
to h1
Output
Final answer
Granule or database
Subgranule 1
Subgranule 2
Subgranule 3
Subgranule m
X X and X
X X and X
Figure 4 Diagram of the proposed method
Computational Intelligence and Neuroscience 7
Images per person 4
Percentage for training phase 55 = 220 images = 2 images
Testing set Training set
Randomly
1 2 3 4
Figure 5 Example of selection of data for training and testing phase
Figure 6 Sample of the Ear Recognition Laboratory database from the University of Science amp Technology Beijing (USTB)
are 320 times 280 pixels with JPEG format Figure 9 shows asample of the images of this database
236 Preprocessing The preprocessing applied to thesedatabases is simple because the focus of the proposedmethodis the optimization of the granulation For the ear databasethe ear image is manually cut a resizing of the new image to132 times 91 pixels is performed and automatically the image isdivided into three regions of interest (helix shell and lobe)this preprocessing was already performed in [7] For the
FERET database the Viola-Jones algorithm [51 52] was usedto detect the face in each image and a resizing of 100 times 100pixels is performed to each image converted to grayscale andautomatically the image is divided into three regions (fronteyes and mouth) For iris database the method developedby Masek and Kovesi [53] is used to obtain the coordinatesand radius of the iris and pupil to perform a cut in theiris a resizing of 21 times 21 pixels is performed to each imageand finally each image is automatically divided into threeparts For the ORL database each image is automatically
8 Computational Intelligence and Neuroscience
Figure 7 Sample of the ORL database from the ATampT Laboratories Cambridge
Figure 8 Sample of the FERET database
divided into three regions of interest (front eyes andmouth)The preprocessing process for these databases is shown inFigure 10
3 Experimental Results
The proposed method is applied to human recognition andthe results achieved are shown in this sectionThemain com-parisons of the proposed method are against a hierarchical
genetic algorithm proposed in [7] and a firefly algorithmproposed in [37 38] where in [7 38] the ear database is usedmeanwhile in [37] the iris database is used and architecturesof MGNNs are optimized In [7 38] two optimized tests forthe MGNNs were performed these tests in this work arereplicated (30 trialsruns for each test) and to summarizeonly the 5 best results are shown In [37] two optimized testsfor the MGNNs were performed the second test in this workis replicated (20 trialsruns) and to summarize also only the
Computational Intelligence and Neuroscience 9
Figure 9 Sample of the iris database
Original imageCut Resize
Original image Division
Division
Original image
Face detection(the Viola-Jones
algorithm)Resize Grayscale
Eyes
Mouth
Front
Division
Resize
Method developed by Masek and
Kovesi
Original image
Division21 times 21
(100 times 100 pixels)
132 times 91
Figure 10 Sample preprocessing for the databases
10 Computational Intelligence and Neuroscience
Table 3 The best 10 results (test 1 ear)
Trial Images Number of hidden layersand number of neurons Persons per module Rec
rate ErrorTraining Testing
1 80(1 2 and 3)
20(4)
5 (126 96 179 239 37)4 (188 196 93 171)
5 (109 107 110 168 29)
Module 1 (1 to 12)Module 2 (13 to 40)Module 3 (41 to 77)
100(7777) 0
2 69(2 3 and 4)
31(1)
5 (222 238 113 27 75)4 (151 53 99 79)
2 (209 31)2 (144 71)
4 (30 218 194 199)4 (25 81 239 20)
5 (237 43 83 102 128)
Module 1 (1 to 5)Module 2 (6 to 21)Module 3 (22 to 31)Module 4 (32 to 46)Module 5 (47 to 63)Module 6 (64 to 73)Module 7 (74 to 77)
100(7777) 0
3 66(2 3 and 4)
34(1)
5 (141 70 120 158 242)4 (124 55 23 243)3 (96 186 213)4 (28 62 51 42)
1 (223)
Module 1 (1 to 34)Module 2 (35 to 40)Module 3 (41 to 44)Module 4 (45 to 75)Module 5 (76 to 77)
100(7777) 0
4 74(2 3 and 4)
26(1)
5 (139 97 200 121 231)5 (204 114 164 216 138)5 (195 137 124 71 86)5 (144 70 92 220 63)5 (119 176 154 167 161)4 (199 162 96 65)
Module 1 (1 to 6)Module 2 (7 to 29)Module 3 (30 to 50)Module 4 (51 to 58)Module 5 (59 to 71)Module 6 (72 to 77)
100(7777) 0
5 63(2 3 and 4)
37(1) 5 (136 183 149 193 161)
5 (181 132 175 140 155)Module 1 (1 to 68)Module 2 (69 to 77)
100(7777) 0
5 best results are shown For the ORL and FERET databases5 and 4 trialsruns were respectively performed to comparewith other works
31 Ear Results The results achieved using the ear databaseare presented in this section Each test is described as follows
(i) Test 1 the search space for the percentage of datafor the training phase is limited up to 80 thatis the optimization technique can select up to thispercentage of images of the total number of imagesper person
(ii) Test 2 in this test the search space for the percentageof data for the training phase is limited up to 50
311 Test 1 Results for the Ear In this test the proposed greywolf optimizer can use up to 80 of data for the trainingphase to design the MGNN architectures In Table 3 the best5 results using the proposed method in this work are shown
The behavior of trial 4 is shown in Figure 11 where thebest the average and the worst results of each iteration areshown In Figure 12 alpha (first best solution) beta (secondbest solution) and delta (third best solution) behavior of trial4 are shown This trial was one of the fastest trials to obtainan error value equal to zero
In Figure 13 the recognition errors obtained by theproposed grey wolf optimizer the HGA proposed in [7] andthe FA proposed in [38] are shown
In all the trials performed by the grey wolf optimizer anerror equal to zero is obtained In Table 4 a comparison of
1 12 14 16 18 2 22 24 26 28 3Iteration
0
005
01
015
02
025
03
035
Erro
r
Best error = 0
WorstAverageBest
Figure 11 Convergence of trial 4
results between the proposed method and the work in [7 38]is shown
An average of convergence of the 30 trialsruns of eachoptimization technique is shown in Figure 14 where it can beobserved that the GWO always found an error equal to zeroin the first 5 iterations meanwhile the HGA and the FA insome runs did not obtain this value
Computational Intelligence and Neuroscience 11
0
002
004
006
008
01
012
014
016
1 12 14 16 18 2 22 24 26 28 3
Erro
r
Iteration
AlphaBetaDelta
Figure 12 Alpha beta and delta behavior of trial 4
0
001
002
003
004
005
006
007
1 3 5 7 9 11 13 15 17 19 21 23 25 27 29
Erro
r of r
ecog
nitio
n
Evolutiontrial
HGAFAProposed GWO
Figure 13 Obtained errors of recognition (up to 80 ear)
312 Test 2 Results for Ear In this test the proposed greywolf optimizer can use up to 50 of data for the trainingphase to design the MGNNs architectures In Table 5 fivearchitectures with the best results are shown
The behavior of trial 2 is shown in Figure 15 wherethe best the average and the worst results of each iterationare shown In Figure 16 the alpha (first best solution)beta (second best solution) and delta (third best solution)behaviors of trial 2 are shown This trial was one of the besttrials where an error of recognition equal to 0325 is obtained
In Figure 17 the errors of recognition obtained by theproposed grey wolf optimizer the HGA proposed in [7] andthe FA proposed in [38] for test 2 are shown It can bevisually seen that the results obtained by grey wolf optimizerand firefly algorithm are more stable than the HGA
In Table 6 a comparison of results between the proposedmethod and [7 38] is shown The best result is obtained bythe HGA but the average is slightly improved by the firefly
Table 4 Comparison of results (test 1 ear)
Method Best Average Worst
HGA [7] 100 9970 93500 000303 00649
FA [38] 100 9989 98050 00011 00195
Proposed GWO 100 100 1000 0 0
5 10 15 20 25 30
Iterationgeneration
0
0005
001
0015
002
0025
003
0035
004
Erro
r
HGAFAGWO
Figure 14 Average of convergence (test 1 ear)
algorithm meanwhile the worst errors are improved by theproposed method and the firefly algorithm
An average of convergence of the 30 trialsruns of eachoptimization technique is shown in Figure 18 where theHGAtends in a general behavior to stagnate more than the GWOand the FA
32 Face Results (ORL) The results achieved using the ORLdatabase are presented in this section For this database 2tests were also performed but to compare with other worksthe percentage of data for the training phase is set fixed Eachtest is described as follows
(i) Test 1 the percentage of data for the training phase isset to 80
(ii) Test 2 the percentage of data for the training phaseis set to 50
321 Test 1 Results for Face In this test the proposed greywolf optimizer uses 80 of data for the training phase todesign the MGNNs architectures In Table 7 five architec-tures with the best results are shown
The behavior of trial 5 is shown in Figure 19 wherethe best the average and the worst results of each iteration
12 Computational Intelligence and Neuroscience
Table 5 The best 10 results (test 2 ear)
Trial Images Number of hidden layersand number of neurons Persons per module Rec
rate ErrorTraining Testing
2 43(2 and 3)
57(1 and 4)
5 (115 49 187 122 194)5 (182 139 50 217 54)5 (132 182 56 187 159)5 (167 132 121 123 219)4 (116 195 54 174)
5 (157 108 166 95 88)5 (116 119 76 121 94)5 (102 58 69 111 42)
Module 1 (1 to 9)Module 2 (10 to 22)Module 3 (23 to 33)Module 4 (34 to 36)Module 5 (37 to 51)Module 6 (52 to 63)Module 7 (64 to 75)Module 8 (76 to 77)
9675(149154) 00325
4 48(2 and 3)
52(1 and 4)
4 (98 136 165 141)3 (176 104 215)
4 (142 222 65 28)5 (97 139 129 99 28)4 (225 83 188 34)
Module 1 (1 to 26)Module 2 (27 to 39)Module 3 (40 to 55)Module 4 (56 to 65)Module 5 (66 to 77)
9675(149154) 00325
7 49(2 and 3)
51(1 and 4)
5 (201 84 169 113 131)5 (199 189 62 159 151)5 (104 129 88 166 66)5 (123 96 52 26 67)5 (125 141 86 77 105)5 (121 145 87 122 31)5 (36 126 146 143 145)5 (126 140 88 173 206)
Module 1 (1 to 5)Module 2 (6 to 17)Module 3 (18 to 32)Module 4 (33 to 34)Module 5 (35 to 40)Module 6 (41 to 51)Module 7 (52 to 63)Module 8 (64 to 77)
9675(149154) 00325
8 39(2 and 3)
61(1 and 4)
5 (125 75 69 114 140)5 (138 157 101 164 98)5 (76 78 86 135 70)4 (74 53 57 73)
5 (123 55 75 125 143)5 (99 118 149 224 67)5 (130 184 156 180 153)
Module 1 (1 to 11)Module 2 (12 to 14)Module 3 (15 to 27)Module 4 (28 to 33)Module 5 (34 to 43)Module 6 (44 to 57)Module 7 (58 to 77)
9675(149154) 00325
14 40(2 and 3)
60(1 and 4)
5 (58 26 159 123 106)5 (157 156 197 22 112)4 (215 78 97 220)
5 (120 68 219 194 58)5 (142 185 141 33 187)5 (108 160 61 100 54)
Module 1 (1 to 12)Module 2 (13 to 20)Module 3 (21 to 40)Module 4 (41 to 52)Module 5 (53 to 66)Module 6 (67 to 77)
9675(149154) 00325
5 10 15 20 25 30Iteration
0
01
02
03
04
05
Erro
r
Best error = 00325
WorstAverageBest
Figure 15 Convergence of trial 2
Table 6 Comparison of results (test 2 ear)
Method Best Average Worst
HGA [7] 9805 9482 7965001948 00518 020346
FA [38] 9740 9682 954500260 00318 004545
Proposed GWO 9675 9615 9545003247 003853 004545
are shown In Figure 20 the alpha (first best solution)beta (second best solution) and delta (third best solution)behaviors of trial 5 are shownThis trial was one of the fastesttrials to obtain an error value equal to zero
In Figure 21 the recognition rates obtained by [4 3839] and the proposed grey wolf optimizer are shown Theproposed method and the firefly proposed in [38] allowobtaining a recognition rate of 100
Computational Intelligence and Neuroscience 13
5 10 15 20 25 30Iteration
0
005
01
015
02
025
03
Erro
r
AlphaBetaDelta
Figure 16 Convergence of trial 2
0
005
01
015
02
025
1 3 5 7 9 11 13 15 17 19 21 23 25 27 29
Erro
r of r
ecog
nitio
n
Evolutiontrial
HGAFAProposed GWO
Figure 17 Obtained errors of recognition (up to 50 ear)
In Table 8 a comparison of results is presented The bestresult is obtained by the work in [38 39] and the proposedmethod but the average and the worst error are improved bythe proposed method and the firefly algorithm
322 Test 2 Results for Face In this test the proposed greywolf optimizer uses 50 of data for the training phase todesign theMGNNs architectures In Table 9 the best 5 resultsusing the proposed method in this work are shown
The behavior of trial 1 is shown in Figure 22 wherethe best the average and the worst results of each iterationare shown In Figure 23 the alpha (first best solution)beta (second best solution) and delta (third best solution)behaviors of trial 1 are shown This trial was one of thebest trials where an error of recognition equal to 00100 isobtained
In Figure 24 the recognition rates obtained by [3 38 3943] and the proposed method are shown
5 10 15 20 25 30Iterationgeneration
0
002
004
006
008
01
012
014
016
Erro
r
HGAFAGWO
Figure 18 Average of convergence (test 2 ear)
1 15 2 25 3 35 4 45 5Iteration
0
002
004
006
008
01
012
014
016
018
Erro
r
Best error = 0
WorstAverageBest
Figure 19 Convergence of trial 5
In Table 10 a comparison of results between the proposedmethod and the other works is shownThe best and the worsterror are improved by the proposed method and the fireflyalgorithm but the average of recognition is slightly improvedby the proposed method
33 Iris Results In this test the proposed grey wolf optimizeruses up to 80 of data for the training phase to designthe MGNNs architectures as in [37 44] In Table 11 fivearchitectures with the best results are shown
The behavior of trial 2 is shown in Figure 25 wherethe best the average and the worst results of each iterationare shown In Figure 26 the alpha (first best solution)beta (second best solution) and delta (third best solution)
14 Computational Intelligence and Neuroscience
Table 7 The results for face database (test 1 ORL)
TrialImages Number of hidden
layers and number ofneurons
Personsper module
Recrate Error
Training Testing
180
(1 2 3 4 7 8 9and 10)
20(5 and 6)
5 (109 109 69 74 210)5 (175 32 170 214 86)4 (117 52 134 197)4 (190 162 99 81)
5 (111 130 247 160 64)4 (111 250 116 127)
Module 1 (1 to 4)Module 2 (5 to 12)Module 3 (13 to 15)Module 4 (16 to 24)Module 5 (25 to 33)Module 6 (34 to 40)
100(8080) 0
280
(1 3 4 5 6 7 8and 10)
20(2 and 9)
5 (52 188 138 154 71)5 (216 183 74 142 112)5 (73 204 139 94 114)5 (101 124 144 207 133)4 (96 205 157 238)
5 (46 160 86 119 105)5 (138 169 152 146 48)5 (32 65 173 156 56)
Module 1 (1 to 5)Module 2 (6 to 15)Module 3 (16 to 17)Module 4 (18 to 19)Module 5 (20 to 29)Module 6 (30 to 32)Module 7 (33 to 38)Module 8 (39 to 40)
100(8080) 0
380
(1 2 4 5 7 8 9and 10)
20(3 and 6)
5 (158 67 80 49 124)5 (138 72 51 87 218)5 (138 176 108 21 139)5 (136 46 66 41 68)5 (182 40 246 104 45)5 (126 202 171 45 228)5 (228 153 133 199 85)4 (98 140 72 188)
Module 1 (1 to 3)Module 2 (4 to 5)Module 3 (6 to 13)Module 4 (14 to 18)Module 5 (19 to 23)Module 6 (24 to 25)Module 7 (26 to 30)Module 8 (31 to 40)
100(8080) 0
480
(1 3 4 5 7 8 9and 10)
20(2 and 6)
5 (39 55 21 84 210)1 (224)
3 (98 204 243)5 (61 86 237 49)
2 (199 62)1 (180)
5 (206 29 240 215 105)
Module 1 (1 to 7)Module 2 (8 to 9)Module 3 (10 to 12)Module 4 (13 to 17)Module 5 (18 to 26)Module 6 (27 to 34)Module 7 (35 to 40)
100(8080) 0
580
(1 2 3 5 6 7 8and 10)
20(4 and 9)
5 (75 156 197 128 233)5 (225 87 193 58 182)5 (161 240 36 157 151)5 (228 222 64 102 132)5 (161 50 80 175 105)5 (150 105 194 122 80)5 (121 116 122 88 42)5 (66 210 92 48 179)
Module 1 (1 to 4)Module 2 (5 to 13)Module 3 (14 to 16)Module 4 (17 to 23)Module 5 (24 to 26)Module 6 (27 to 29)Module 7 (30 to 31)Module 8 (32 to 40)
100(8080) 0
Table 8 Comparison of results (test 1 ORL)
Method Best Average WorstMendoza et al [4] 9750 9469 915Sanchez et al [38] 100 100 100Sanchez et al [39] 100 9927 9861Proposed GWO 100 100 100
behaviors of trial 2 are shown This trial was one of the besttrials where an error of recognition equal to 0 is obtained
In Figure 27 the errors of recognition obtained by [37 44]and the proposed method are presented
In Table 12 a comparison of results is presented Thebest the average and the worst errors are improved by theproposed method
An average of convergence of the 20 trialsruns ofeach optimization technique is shown in Figure 28 wherealthough these techniques does not tend to stagnate for along time the GWO tends to convergence faster with betterresults
34 Summary Results Summary of results and comparisonwith other works using the same databases and neuralnetworks are shown in this section The testing time ofa set of images depends on the number of images andtheir size but the training time also depends on the neuralnetwork architecture (number of hidden layers neurons ineach hidden layers and number of modules) and learningfactors (initial weights and error goal among others) Anapproximation of the training and testing times for eachsearch agent is respectively shown in Figures 29 and 30
Computational Intelligence and Neuroscience 15
Table 9 The results for face database (test 2 ORL)
TrialImages Number of hidden
layers and number ofneurons
Personsper module
Recrate Error
Training Testing
1 50(2 3 4 7 and 9)
50(1 5 6 8 and 10)
5 (139 149 64 49 69)5 (112 89 137 112 203)5 (109 141 115 142 206)5 (69 183 84 33 233)5 (43 127 176 236 39)5 (124 192 92 92 193)5 (70 188 227 165 98)5 (75 79 128 171 159)
Module 1 (1 to 5)Module 2 (6 to 12)Module 3 (13 to 17)Module 4 (18 to 22)Module 5 (23 to 30)Module 6 (31 to 34)Module 7 (35 to 36)Module 8 (37 to 40)
99(198200) 00100
2 50(1 2 4 5 and 7)
50(3 6 8 9 and 10)
5 (141 99 172 88 81)4 (198 101 244 148)
5 (159 31 175 125 168)5 (31 90 125 116 111)5 (102 107 110 87 21)5 (113 78 55 184 209)5 (248 108 150 88 40)4 (119 136 90 126)3 (213 71 127)
4 (207 131 182 48)
Module 1 (1 to 7)Module 2 (8 to 12)Module 3 (13 to 15)Module 4 (16 to 18)Module 5 (19 to 21)Module 6 (22 to 23)Module 7 (24 to 30)Module 8 (31 to 33)Module 9 (34 to 38)Module 10 (39 to 40)
9850(197200) 00150
3 50(3 5 7 8 and 10)
50(1 2 4 6 and 9)
4 (60 37 220 169)5 (84 106 155 187 182)5 (33 222 144 23 123)5 (199 85 38 78 103)5 (63 143 89 191 93)5 (122 189 135 95 181)5 (91 194 227 119 130)
3 (188 124 238)5 (44 105 217 102 199)5 (114 129 24 140 208)
Module 1 (1 to 2)Module 2 (3 to 7)Module 3 (8 to 10)Module 4 (11 to 16)Module 5 (17 to 21)Module 6 (22 to 23)Module 7 (24 to 27)Module 8 (28 to 31)Module 9 (32 to 35)Module 10 (36 to 40)
98(196200) 00200
4 50(3 4 7 9 and 10)
50(1 2 5 6 and 8)
5 (52 173 68 176 133)5 (143 202 54 67 55)5 (82 142 191 47 183)5 (205 115 95 143 218)5 (95 142 73 47 117)5 (182 86 87 113 102)5 (40 115 98 95 120)5 (196 181 82 69 154)5 (97 117 142 216 65)5 (153 155 91 48 124)
Module 1 (1 to 3)Module 2 (4 to 6)Module 3 (7 to 9)Module 4 (10 to 13)Module 5 (14 to 15)Module 6 (16 to 22)Module 7 (23 to 27)Module 8 (28 to 31)Module 9 (32 to 35)Module 10 (36 to 40)
99(198200) 00100
5 50(2 3 5 8 and 9)
50(1 4 6 7 and 10)
5 (128 150 50 26 73)5 (145 149 49 69 58)5 (129 58 124 86 70)5 (127 69 126 139 69)5 (33 174 146 137 218)5 (137 95 232 187 97)5 (101 104 158 66 95)5 (142 207 48 140 51)5 (79 157 191 129 222)5 (199 102 148 103 49)
Module 1 (1 to 2)Module 2 (3 to 4)Module 3 (5 to 13)Module 4 (14 to 18)Module 5 (19 to 20)Module 6 (21 to 25)Module 7 (26 to 30)Module 8 (31 to 33)Module 9 (34 to 35)Module 10 (36 to 40)
98(196200) 00200
In Table 13 a summary of each database setup is shownIt can be noticed that the Iris database has more images ineach test but images size is smaller than the other databasesfor this reason the training and testing times for this databaseare the smallest ones In the case of ear database the numberof images is smaller than the other databases but the size ofits images is bigger so the training and testing times tend toincrease
In Table 14 the summary of results obtained using theGWO applied to the ear face and iris database is shown
In [7] modular granular neural networks are proposedand are compared with conventional neural networks usinga hierarchical genetic algorithm to design neural networksarchitectures In [38] the design of modular granular neuralnetworks architectures is proposed using a firefly algorithmIn [45] the architectures of modular neural networks are
16 Computational Intelligence and Neuroscience
Table 10 Comparison of results (test 2 ORL)
Method Best Average WorstAzami et al [43] 9650 9591 9537ChrsquoNg et al [3] 965 9475 94Sanchez et al [38] 99 9830 98Sanchez et al [39] 9843 9759 9455Proposed GWO 99 9850 98
1 15 2 25 3 35 4 45 5Iteration
0
001
002
003
004
005
006
007
008
Erro
r
AlphaBetaDelta
Figure 20 Convergence of trial 5
90
92
94
96
98
100
1 2 3 4 5
Perc
enta
ge o
f rec
ogni
tion
Evolutiontrial
Mendoza et al [4]Saacutenchez et al [38]
Saacutenchez et al [39]Proposed GWO
Figure 21 Obtained recognition rates (test 1 ORL databasecomparison 1)
designed using a hierarchical genetic algorithm but withouta granular approach that is the number of modules andthe number of persons learned by each modules alwayswere left fixed In Table 15 the comparisons among theoptimized results obtained using the proposed method andother optimized works are presented where the average wasimproved for the ear database by the proposed method (test1 using 3 images) and the firefly algorithm (test 2 using 2images)
5 10 15 20 25 30Iteration
0
005
01
015
02
025
03
035
Erro
r
Best error = 00100
WorstAverageBestFigure 22 Convergence of trial 1
5 10 15 20 25 30Iteration
0
002
004
006
008
01
012
014Er
ror
AlphaBetaDeltaFigure 23 Convergence of trial 1
90
92
94
96
98
100
1 2 3 4 5
Perc
enta
ge o
f rec
ogni
tion
Evolutiontrial
Azami et al [43]ChrsquoNg et al [3]Saacutenchez et al [38]
Saacutenchez et al [39]Proposed GWO
Figure 24 Obtained recognition rates (test 2 ORL databasecomparison 2)
Computational Intelligence and Neuroscience 17
Table 11 The results for iris database
Trial Images Number of hidden layersand number of neurons Persons per module Rec
rate ErrorTraining Testing
1
79(1 2 3 5 6 8 10
1112 13 and 14)
21(4 7 and 9)
5 (133 205 93 203 184)4 (112 198 134 97)5 (39 159 68 76 119)
2 (158 148)5 (183 139 135 51 72)4 (224 168 148 195)5 (152 170 65 47 55)5 (114 218 162 85 107)
3 (86 205 172)
Module 1 (1 to 15)Module 2 (16 to 22)Module 3 (23 to 34)Module 4 (35 to 45)Module 5 (46 to 47)Module 6 (48 to 49)Module 7 (50 to 64)Module 8 (65 to 74)Module 9 (75 to 77)
9957(230231) 00043
275
(2 3 4 5 6 8 910 12 13 and 14)
25(1 7 and 11)
5 (97 66 149 117 144)5 (69 210 77 70 203)4 (159 102 153 152)
5 (35 171 134 124 101)3 (167 166 169)
5 (198 64 80 176 131)3 (81 80 227)
4 (106 114 89 148)
Module 1 (1 to 4)Module 2 (5 to 15)Module 3 (16 to 23)Module 4 (24 to 31)Module 5 (32 to 46)Module 6 (47 to 58)Module 7 (59 to 62)Module 8 (63 to 77)
100(231231) 0
676
(1 2 3 4 5 6 89 12 13 and 14)
24(7 10 and 11)
4 (73 210 138 49)5 (119 161 63 96 112)
3 (180 135 77)5 (124 164 177 216 94)5 (129 123 215 88 100)5 (65 89 69 144 80)5 (67 110 112 200 134)
3 (86 72 160)
Module 1 (1 to 3)Module 2 (4 to 13)Module 3 (14 to 30)Module 4 (31 to 40)Module 5 (41 to 51)Module 6 (52 to 60)Module 7 (61 to 65)Module 8 (66 to 77)
9957(230231) 00043
778
(1 2 3 4 5 6 7 810 11 and 13)
22(9 12 and 14)
5 (168 99 94 156 175)4 (90 122 124 122)
5 (129 32 159 174 50)4 (218 93 237 71)
5 (117 36 167 143 52)5 (135 60 226 140 112)5 (169 117 95 36 96)5 (97 71 225 147 176)
3 (162 170 139)
Module 1 (1 to 4)Module 2 (5 to 16)Module 3 (17 to 20)Module 4 (21 to 37)Module 5 (38 to 46)Module 6 (47 to 51)Module 7 (52 to 71)Module 8 (72 to 73)Module 9 (74 to 77)
9957(230231) 00043
1178
(1 2 3 4 5 6 7 810 13 and 14)
22(9 11 and 12)
5 (86 162 217 168 168)4 (167 189 62 193)
5 (115 53 154 105 79)3 (62 89 134 87)
4 (119 142 105 204)3 (128 115 175 127)
5 (147 197 61 110 217)3 (142 164 96 141)
5 (140 104 57 108 122)
Module 1 (1 to 4)Module 2 (5 to 8)Module 3 (9 to 16)Module 4 (17 to 32)Module 5 (33 to 39)Module 6 (40 to 46)Module 7 (47 to 57)Module 8 (58 to 68)Module 9 (69 to 77)
100(231231) 0
In Table 16 the 4-fold cross-validation results for the eardatabase are shown where for each training set 3 images foreach person were used
In [43] a neural network is proposed based on a conjugategradient algorithm (CGA) and a principal component anal-ysis In [3] the principal components analysis (PCA) and alinear discriminant analysis (LDA) are used In [38] a fireflyalgorithm is developed to design modular granular neuralnetworks architectures In [39] modular neural network witha granular approach is used but in that work the granula-tion is performed using nonoptimized training to assign acomplexity level to each person and to form subgranules with
persons that have the same complexity levelThatmethodwasrecommended for databases with a large numbers of peopleIn [4] a comparison of fuzzy edge detectors based on theimage recognition rate as performance index calculated withneural networks is proposed In Table 17 the comparisonsamong the optimized results obtained using the proposedmethod and other optimized works for the face database arepresented where the best average and worst values wereimproved for this database by the proposed method andthe firefly algorithm for test 1 (using 8 images) and in test2 (using 5 images) the average is only improved by theproposed method
18 Computational Intelligence and Neuroscience
2 4 6 8 10 12 14 16 18 20 22 24Iteration
0
005
01
015
02
025
Erro
r
Best error = 0
WorstAverageBest
Figure 25 Convergence of trial 2
2 4 6 8 10 12 14 16 18 20 22 24Iteration
0
001
002
003
004
005
Erro
r
AlphaBetaDelta
Figure 26 Convergence of trial 2
00005
0010015
0020025
0030035
1 3 5 7 9 11 13 15 17 19
Erro
r of r
ecog
nitio
n
Evolutiontrial
HGAFAProposed GWO
Figure 27 Obtained recognition rates (iris database)
Table 12 Comparison of results (iris)
Method Best Average Worst
Sanchez and Melin [44]9968 9868 974000032 00132 00260
Sanchez et al [37]9913 9822 965900087 00178 00341
Proposed GWO 100 9931 98700 00069 00130
5 10 15 20 25 30Iterationgeneration
0
0005
001
0015
002
0025
003
0035
004
Erro
r
HGAFAGWO
Figure 28 Average of convergence (iris)
000000
000017
000035
000052
000109
000126
000144
000201
000218
1 2 3 4 5 6 7 8 9 10 11 12 13
Tim
e of t
rain
ing
Number of images (training)
EarORL
FERETIris
Figure 29 Average of training time
In Table 18 the 5-fold cross-validation results are shownwhere for each training set 4 images for each person wereused
In [46] a scale invariant feature transform (SIFT) isproposed In Table 19 the comparisons among the resultsobtained using the proposed method and the other work forthe FERET database are presented
Computational Intelligence and Neuroscience 19
Table 13 Databases setup
Database Number of persons Max number of images per person Image size(pixels)Training Testing
Ear 77 3 3 132 times 91ORL 40 9 9 92 times 112FERET 200 6 6 100 times 100Iris 77 13 13 21 times 21
Table 14 The summary of results (proposed method)
Method Number of imagesfor training
Recognition rateBest Average Worst
Proposed method(ear database)
3(up to 80) 100 100 100
Proposed method(ear database)
2(up to 50) 9675 9615 9545
Proposed method(ORL database)
8(up to 80) 100 100 100
Proposed method(ORL database)
5(up to 50) 99 9850 9850
Proposed method(FERET database) (up to 80) 98 9263 8817
Proposed method(iris database) (up to 80) 100 9931 9870
Table 15 Table of comparison of optimized results (ear database)
Method Number of imagesfor training
Recognition rateBest () Average () Worst ()
Sanchez and Melin [7](ANN) 3 100 9675 mdash
Melin et al [45](MNN) 3 100 9382 8311
Sanchez and Melin [7](MGNN) 3 100 9969 935
Sanchez et al [38](FA) 3 100 9989 9805
Proposed method(MGNN) 3 100 100 100
Sanchez and Melin [7](ANN) 2 9610 8853 mdash
Sanchez and Melin [7](MGNN) 2 9805 9481 7965
Sanchez et al [38](FA) 2 9740 9682 9545
Proposed method(MGNN) 2 9675 9615 9545
Table 16 Table of cross-validation results (ear database)
Experiment 1 Experiment 2 Experiment 3 Experiment 4 Average100 100 9481 9351 9707
20 Computational Intelligence and Neuroscience
Table 17 Table of comparison of optimized results (ORL database)
Method Images for training Recognition rateBest () Average () Worst ()
Mendoza et al [4](FIS) 8 9750 9469 9150
Sanchez et al [38](FA) 8 100 100 100
Sanchez et al [39](MGNNs + complexity) 8 100 9927 9861
Proposed method 8 100 100 100Azami et al [43](CGA + PCA) 5 965 9591 9537
ChrsquoNg et al [3](PCA + LDA) 5 965 9475 94
Sanchez et al [38](FA) 5 99 9830 98
Sanchez et al [39](MGNNs + complexity) 5 9843 9759 9455
Proposed method 5 99 985 98
Table 18 Table of cross-validation results (ORL database)
Experiment 1 Experiment 2 Experiment 3 Experiment 4 Experiment 5 Average9542 9458 9667 9792 9792 9650
Table 19 Table of comparison of optimized results (FERET database)
Method Number of persons Number of images Recognition rateWang et al [46](SIFT) 50 7 86
Proposed method 50 7 98Wang et al [46](SIFT) 100 7 797
Proposed method 100 7 9233Wang et al [46](SIFT) 150 7 791
Proposed method 150 7 92Wang et al [46](SIFT) 200 7 757
Proposed method 200 7 8817
Table 20 Table of cross-validation results (FERET database)
Number of persons Experiment 1 Experiment 2 Experiment 3 Experiment 4 Experiment 5 Average50 9333 9533 9400 9467 9467 9440100 8367 8833 8900 9133 9200 8887150 7978 8644 8778 9022 8933 8671200 7617 8300 8283 8450 8583 8247
In Table 20 the 5-fold cross-validation results are shownwhere for each training set 4 images for each person wereused
In [44] and [37] a hierarchical genetic algorithm anda firefly algorithm are respectively proposed to optimizemodular granular neural networks using iris as biometric
measure The main difference between these works is thatin the first and the second one there is no a subdivision ofeach image as in the proposed method where submodulesare experts in parts of the image In Table 21 the comparisonbetween the optimized results obtained using the proposedmethod and the other optimized works is presented
Computational Intelligence and Neuroscience 21
Table 21 Table of comparison of optimized results (iris database)
Method Images for training Recognition rateBest () Average () Worst ()
Sanchez and Melin [44](HGA) Up to 80 9968 9868 9740
Sanchez et al [37](FA) Up to 80 9913 9822 9659
Proposed method Up to 80 100 9931 9870
Table 22 Table of cross-validation results (iris database)
Experiment 1 Experiment 2 Experiment 3 Experiment 4 Experiment 5 Experiment 6 Average9827 9913 9827 9697 9784 9697 9791
Table 23 Values of ear database (test 1)
Method 119873 Mean Standarddeviation
Error standarddeviation ofthe mean
Estimateddifference 119905-value 119875 value Degree of
freedom
Sanchez andMelin [7](MGNN)
30 00030 00121 00022 0003 138 01769 29
Proposed method 30 0 0 0Sanchez et al [38](MGNN) 30 000108 000421 000077 0001082 141 0169 29Proposed method 30 0 0 0
000000
000004
000009
000013
000017
000022
000026
000030
000035
000039
1 2 3 4 5 6 7 8 9 10 11 12 13
Tim
e of t
estin
g
Number of images (testing)
EarORL
FERETIris
Figure 30 Average of training time
In Table 22 the 5-fold cross-validation results are shownwhere for each training set 11 images for each person wereused
4 Statistical Comparison of Results
The results obtained by the proposedmethod are visually bet-ter than the other works now statistical 119905-tests are performed
in order to verify if there is enough evidence to say that theresults of the proposed method are better In these 119905-tests therecognition rates and errors previously presented were used
41 Statistical Comparison for Test 1 In Table 23 the valuesobtained in the 119905-test between [7] and [38] and the proposedmethod are shown where the 119905-values were respectively 138and 141 this means that there is no sufficient evidence to saythat ear results for test 1 were improved with the proposedmethod
In Figure 31 the distribution of the samples is shownwhere it can be observed that the samples are very close toeach other
For the ORL database in test 1 the different valuesobtained in the 119905-test between the proposed method and[4 39] are shown in Table 24 The 119905-values were 412 and242 this means that there is sufficient evidence to say thatthe results were improved using the proposed method InFigure 32 the distribution of the samples is shown It can beobserved that samples of [39] are very separated from eachother
For the FERET database the different values obtained inthe 119905-test between the proposed method and [46] are shownin Table 25 The 119905-value was 424 this means that there issufficient evidence to say that the results were improved usingthe proposed method In Figure 33 the distribution of thesamples is shown
For the iris database the different values obtained in the119905-test between the proposed method and [44] and [37] are
22 Computational Intelligence and Neuroscience
Table 24 Values of ORL database (test 1)
Method 119873 Mean Standarddeviation
Error standarddeviation ofthe mean
Estimateddifference 119905-value 119875 value Degree
of freedom
Mendoza et al [4](MG + FIS2) 4 9469 258 13 minus531 minus412 0026 3Proposed method 4 100 0 0Sanchez et al [39](MGNNs +complexity)
5 9927 0676 030 minus073 minus242 0072 4
Proposed method 5 100 0 0
007
006
005
004
003
002
001
000
Dat
a
Dat
a
Proposed methodSaacutenchez et al [38]Proposed methodSaacutenchez and Melin [7]
0020
0015
0010
0005
0000
Figure 31 Sample distribution (test 1 ear database)
Mendoza et al [4]
100
98
96
94
92
90
10000
9975
9950
9925
9900
9875
9850Proposed methodProposed method Saacutenchez et al [39]
Dat
a
Dat
a
Figure 32 Sample distribution (test 1 ORL database)
Proposed methodWang et al [46]
100
95
90
85
80
75
Dat
a
Figure 33 Sample distribution (FERET database)
shown in Table 26 The 119905-values were respectively 318 and562 this means that there is sufficient evidence to say thatthe results were improved using the proposed method
In Figure 34 the distribution of the samples is shown Itcan be observed that samples of [44] aremore separated fromeach other than in [37]
42 Statistical Comparison for Test 2 In Table 27 the valuesobtained in the 119905-test between [7] and [38] and the proposedmethod for ear database are shown where the 119905-values wererespectively 209 and minus570 this means that there is sufficientevidence to say that face results were improved with theproposed method only versus [7]
Computational Intelligence and Neuroscience 23
Table 25 Values of FERET database
Method 119873 Mean Standarddeviation
Error standarddeviation ofthe mean
Estimateddifference 119905-value 119875 value Degree of
freedom
Wang et al [46](SIFT) 4 8013 429 21 minus1250 minus424 000547 6Proposed method 4 9263 405 20
Table 26 Values of iris database
Method 119873 Mean Standarddeviation
Error standarddeviation ofthe mean
Estimateddifference 119905-value 119875 value Degree of
freedom
Sanchez andMelin [44] 20 9868 0779 017 minus0624 minus318 00035 29Proposed method 20 9930 0407 0091Sanchez et al [37] 20 9822 0758 017 minus1083 minus562 18623119864 minus 06 38Proposed method 20 9930 0407 0091
1000
995
990
985
980
975
1000
995
990
985
980
975
970
965Saacutenchez and Melin [44] Proposed method Saacutenchez et al [37] Proposed method
Dat
a
Dat
a
Figure 34 Sample distribution (iris database)
In Figure 35 the distribution of the samples is shownwhere it can be observed that the samples for [7] and theproposed method are closer than the proposed method and[38]The distribution of the proposedmethod and [38] seemsto be uniform
The different values obtained in the 119905-test for the facedatabase between the proposed method and [43] [3] [38]and [39] are shown in Table 28 The 119905-values were respec-tively 896 590 067 and 115 thismeans that only comparedwith [3 43] there is sufficient evidence to say that the faceresults were improved using the proposed method
In Figure 36 the distribution of the samples is shownwhere it can be observed that the samples are very closebetween the proposed method and [38 39]
5 Conclusions
In this paper the design of modular granular neural networkarchitectures using a grey wolf optimizer is proposed Thedesign of these architectures consists in the number ofmodules percentage of data for the training phase error
goal learning algorithm number of hidden layers and theirrespective number of neurons As objective function thisoptimizer seeks to minimize the recognition error applyingthe proposed method to human recognition where bench-mark databases of ear and face biometric measures wereused to prove the effectiveness of the proposed methodStatistical comparisons were performed to know if thereis sufficient evidence of improvements using the proposedmethod mainly with previous works where a hierarchicalgenetic algorithm and a firefly algorithm were developedand also use MGNNs but more comparisons with otherworks were also performed As a conclusion the proposedmethod has been shown which improves recognition ratesin most of the comparisons especially when the granularapproach is not used An improvement provided by the greywolf optimizer over the genetic algorithm and the fireflyalgorithm lies in the fact that the first one allows havingthe first three best solutions (alpha beta and delta) andtheir others search agents will update their position basedon them otherwise the genetic algorithm only has a bestsolution in each iteration and the firefly algorithm updates
24 Computational Intelligence and Neuroscience
Table 27 Values of ear database (test 2)
Method 119873 Mean Standarddeviation
Error standarddeviation ofthe mean
Estimateddifference 119905-value 119875 value Degrees of
freedom
Sanchez andMelin [7](MGNN)
30 00518 00345 00063 001328 209 0045 29
Proposed method 30 003853 000449 000082Sanchez et al [38](FA) 30 003182 000462 000084 minus000671 minus570 41926119864 minus 07 57Proposed method 30 003853 000449 000082
Saacutenchez and Melin [7]
020
015
010
005
000Saacutenchez et al [38]
0045
0040
0035
0030
0025Proposed methodProposed method
Dat
a
Dat
a
Figure 35 Sample distribution (test 2 ear database)
Azami et al [43]
99
98
97
96
95ChrsquoNg et al [3]
99
98
97
96
95
94
Saacutenchez et al [38]
990
988
986
984
982
980
Saacutenchez et al [39]
99
98
97
96
95
94
Proposed method
Proposed method Proposed method
Proposed method
Dat
aD
ata
Dat
aD
ata
Figure 36 Sample database (test 2 ORL database)
Computational Intelligence and Neuroscience 25
Table 28 Values of ORL database (test 2)
Method 119873 Mean Standarddeviation
Error standarddeviation ofthe mean
Estimateddifference 119905-value 119875 value Degrees of
freedom
Azami et al [43](CGA + PCA) 5 9591 0409 018 minus2590 minus896 19091119864 minus 05 8Proposed method 5 9850 0500 022ChrsquoNg et al [3](PCA + LDA) 4 9475 119 060 minus3750 minus590 0004 3Proposed method 5 9850 0500 022Sanchez et al [38](FA) 5 9830 0447 020 minus020 minus067 0523 8Proposed method 5 9850 0500 022Sanchez et al [39](MGNNs +complexity)
5 9759 171 076 minus094 minus115 0314 4
Proposed method 5 9850 0500 022
the position of the fireflies by evaluating couples of fireflieswhere if one firefly is not better than the other their movewill be randomThis allows the GWO to have greater stabilityin its trials and in its results It is important to mention thatthe results shown in this work were performed using differentdatabases this prove that the proposed method was designedto be easily adaptable depending of the number of personsand the number of images independently of the biometricmeasure used In futureworks the proposedmethodwill seekto reduce the complexity of the MGNNs architectures and tominimize the percentage of information and subgranules todesign MGNNs
Conflicts of Interest
The authors declare that there are no conflicts of interestregarding the publication of this paper
References
[1] A K Jain K Nandakumar and A Ross ldquo50 years of biomet-ric research accomplishments challenges and opportunitiesrdquoPattern Recognition Letters vol 79 pp 80ndash105 2016
[2] A Ross and A K Jain ldquoHuman recognition using biometricsan overviewrdquoAppeared inAnnals of Telecommunications vol 62pp 11ndash35 2007
[3] S I ChrsquoNg K P Seng and L-M Ang ldquoModular dynamic RBFneural network for face recognitionrdquo in Proceedings of the 2012IEEE Conference on Open Systems ICOS 2012 mys October2012
[4] OMendoza PMelinO Castillo and J R Castro ldquoComparisonof fuzzy edge detectors based on the image recognition rate asperformance index calculated with neural networksrdquo Studies inComputational Intelligence vol 312 pp 389ndash399 2010
[5] A M Patil D S Patil and P Patil ldquoIris recognition usinggray level co-occurrence matrix and hausdorff dimensionrdquoInternational Journal of Computer Applications vol 133 no 8pp 29ndash34 2016
[6] L Gutierrez P Melin and M Lopez ldquoModular neural networkintegrator for human recognition from ear imagesrdquo in Proceed-ings of the International Joint Conference on Neural NetworksIJCNN 2010 Barcelona Spain July 2010
[7] D Sanchez and P Melin ldquoOptimization of modular granu-lar neural networks using hierarchical genetic algorithms forhuman recognition using the ear biometric measurerdquo Engineer-ing Applications of Artificial Intelligence vol 27 pp 41ndash56 2014
[8] M Agrawal and T Raikwar ldquoSpeech recognition using signalprocessing techniquesrdquo International Journal of Engineering andInnovative Technology vol 5 no 8 pp 65ndash68 2016
[9] M Soni S Gupta M S Rao and P Gupta ldquoVein pattern-basedverification systemrdquo International Journal of Computer Scienceand Information Security vol 8 no 1 pp 58ndash63 2010
[10] R C Bakshe and A M Patil ldquoHand geometry as a biometricfor human identificationrdquo International Journal of Science andResearch vol 4 no 1 pp 2744ndash2748 2015
[11] G A Khuwaja and M S Laghari ldquoOffline handwritten signa-ture recognitionrdquo World Academy of Science Engineering andTechnology vol 59 pp 1300ndash1303 2011
[12] M Jhapate andM Dixit ldquoAn Efficient Human Identification onthe Biometric Gait Recognition System using the Inner Angleof the Trianglerdquo International Journal of Computer Applicationsvol 136 no 13 pp 19ndash22 2016
[13] J Heaton Deep Learning and Neural Networks vol 3 DeepLearning and Neural Networks Create Space IndependentPublishing Platform 2015
[14] J Iovine Understanding Neural Networks The ExperimenterrsquosGuide Images 2nd edition 2012
[15] L A Zadeh and J Kacprzyk Fuzzy Logic for the Management ofUncertainty Wiley-Interscience 1992
[16] M Pietikainen A Hadid G Zhao and T Ahonen ComputerVision Using Local Binary Patterns vol 40 Springer 2011
[17] W Pedrycz and S-M Chen ldquoGranular computing and intel-ligent systems Design with Information Granules of HigherOrder and Higher Typerdquo Intelligent Systems Reference Libraryvol 13 2011
[18] Y Yao ldquoPerspectives of granular computingrdquo in Proceedings ofthe 2005 IEEE International Conference onGranular Computingpp 85ndash90 Beijing China July 2005
26 Computational Intelligence and Neuroscience
[19] T Y Lin Y Y Yao and L A Zadeh ldquoData Mining Rough Setsand Granular Computingrdquo Physica 2002
[20] D Ashlock Evolutionary Computation for Modeling and Opti-mization Springer 2006
[21] D Simon Evolutionary Optimization Algorithms JohnWiley ampSons 2013
[22] J H Holland Adaptation in Natural and Artificial Systems AnIntroductory Analysis with Applications to Biology Control andArtificial Intelligence University ofMichigan Press Oxford UK1975
[23] K F Man K S Tang and S Kwong Genetic AlgorithmsConcepts and Designs Springer London UK 1999
[24] M Dorigo Optimization learning and natural algorithms Politecnico di [PhD thesis] Milano Italy 1992
[25] L D Mech ldquoAlpha status dominance and division of labor inwolf packsrdquoCanadian Journal of Zoology vol 77 no 8 pp 1196ndash1203 1999
[26] Y Xin-She and H Xingshi ldquoBat algorithm literature reviewand applicationsrdquo International Journal of Bio-Inspired Compu-tation vol 5 no 3 pp 141ndash149 2013
[27] S Mirjalili S M Mirjalili and A Lewis ldquoGrey wolf optimizerrdquoAdvances in Engineering Software vol 69 pp 46ndash61 2014
[28] Z W Geem X-S Yang and C-L Tseng ldquoHarmony searchand nature-inspired algorithms for engineering optimizationrdquoJournal of Applied Mathematics vol 2013 Article ID 438158 2pages 2013
[29] E Rashedi H Nezamabadi-pour and S Saryazdi ldquoGSA agravitational search algorithmrdquo Information Sciences vol 213pp 267ndash289 2010
[30] X-S Yang ldquoFirefly algorithms for multimodal optimizationrdquoin Proceedings of the 5th Symposium on Stochastic AlgorithmsFoundations and Applications vol 5792 pp 169ndash178 2009
[31] X-S Yang and X He ldquoFirefly algorithm recent advances andapplicationsrdquo International Journal of Swarm Intelligence vol 1no 1 pp 36ndash50 2013
[32] M Farooq ldquoGenetic AlgorithmTechnique inHybrid IntelligentSystems for Pattern Recognitionrdquo International Journal of Inno-vative Research in Science Engineering and Technology vol 04no 04 pp 1891ndash1898 2015
[33] M F Hassanin A M Shoeb and A E Hassanien ldquoGrey wolfoptimizer-based back-propagation neural network algorithmrdquoin Proceedings of the 2016 12th International Computer Engineer-ing Conference (ICENCO) pp 213ndash218 Cairo Egypt December2016
[34] S Mirjalili ldquoHow effective is the Grey Wolf optimizer intraining multi-layer perceptronsrdquo Applied Intelligence vol 43no 1 pp 150ndash161 2015
[35] M Mosavi M Khishe and A Ghamgosar ldquoClassification ofsonar data set using neural network trained by Gray WolfOptimizationrdquo Neural Network World vol 26 no 4 pp 393ndash415 2016
[36] A Parsian M Ramezani and N Ghadimi ldquoA hybrid neuralnetwork-graywolf optimization algorithm formelanomadetec-tionrdquo Biomedical Research vol 28 no 8 pp 3408ndash3411 2017
[37] D Sanchez PMelin J Carpio andH Puga ldquoA firefly algorithmfor modular granular neural networks optimization appliedto iris recognitionrdquo in Proceedings of the 2016 InternationalJoint Conference on Neural Networks IJCNN 2016 pp 139ndash144Vancouver Canada July 2016
[38] D Sanchez PMelin andO Castillo ldquoOptimization of modulargranular neural networks using a firefly algorithm for human
recognitionrdquo Engineering Applications of Artificial Intelligencevol 64 pp 172ndash186 2017
[39] D Sanchez PMelin andO Castillo ldquoOptimization of modulargranular neural networks using a hierarchical genetic algorithmbased on the database complexity applied to human recogni-tionrdquo Information Sciences vol 309 pp 73ndash101 2015
[40] B L M Happel and J M J Murre ldquoDesign and evolution ofmodular neural network architecturesrdquo Neural Networks vol 7no 6-7 pp 985ndash1004 1994
[41] D Li and Y Du Artificial Intelligence with Uncertainty Chap-man amp Hall Boca Raton Fla USA 2007
[42] L A Zadeh ldquoSome reflections on soft computing granularcomputing and their roles in the conception design andutilization of informationintelligent systemsrdquo Soft Computing- A Fusion of Foundations Methodologies and Applications vol2 no 1 pp 23ndash25 1998
[43] H Azami MMalekzadeh and S Sanei ldquoA new neural networkapproach for face recognition based on conjugate gradientalgorithms and principal component analysisrdquo Journal of math-ematics and computer Science vol 6 pp 166ndash175 2013
[44] D Sanchez and P Melin Hierarchical modular granular neuralnetworks with fuzzy aggregation Springer 1st edition 2016
[45] P Melin D Sanchez and O Castillo ldquoGenetic optimizationof modular neural networks with fuzzy response integrationfor human recognitionrdquo Information Sciences vol 197 pp 1ndash192012
[46] Y Y Wang Z M Li L Wang and M Wang ldquoA scale invariantfeature transform basedmethodrdquo Journal of Information Hidingand Multimedia Signal Processing vol 4 no 2 pp 73ndash89 2013
[47] Database Ear Recognition Laboratory from the University ofScience Technology Beijing (USTB httpwwwustbeducnresbenindexhtm
[48] ATampT Laboratories Cambridge the ORL database of facesFound on the Web page httpswwwclcamacukresearchdtgattarchivefacedatabasehtml
[49] P J Phillips H Moon S A Rizvi and P J Rauss ldquoThe FERETevaluation methodology for face-recognition algorithmsrdquo IEEETransactions on Pattern Analysis and Machine Intelligence vol22 no 10 pp 1090ndash1104 2000
[50] Database of Human Iris Institute of Automation of ChineseAcademy of Sciences (CASIA) Found on the Web pagehttpwwwcbsriaaccnenglishIrisDatabaseasp
[51] P Viola and M Jones ldquoRapid object detection using a boostedcascade of simple featuresrdquo in Proceedings of the IEEE ComputerSociety Conference on Computer Vision and Pattern Recognitionvol 1 pp I511ndashI518 December 2001
[52] P Viola and M J Jones ldquoRobust real-time face detectionrdquoInternational Journal of Computer Vision vol 57 no 2 pp 137ndash154 2004
[53] L Masek and P Kovesi MATLAB Source Code for a BiometricIdentification System Based on Iris Patterns The School ofComputer Science and Software EngineeringTheUniversity ofWestern Australia 2003
Submit your manuscripts athttpswwwhindawicom
Computer Games Technology
International Journal of
Hindawi Publishing Corporationhttpwwwhindawicom Volume 2014
Hindawi Publishing Corporationhttpwwwhindawicom Volume 2014
Distributed Sensor Networks
International Journal of
Advances in
FuzzySystems
Hindawi Publishing Corporationhttpwwwhindawicom
Volume 2014
International Journal of
ReconfigurableComputing
Hindawi Publishing Corporation httpwwwhindawicom Volume 2014
Hindawi Publishing Corporationhttpwwwhindawicom Volume 201
Applied Computational Intelligence and Soft Computing
thinspAdvancesthinspinthinsp
Artificial Intelligence
HindawithinspPublishingthinspCorporationhttpwwwhindawicom Volumethinsp2014
Advances inSoftware EngineeringHindawi Publishing Corporationhttpwwwhindawicom Volume 2014
Hindawi Publishing Corporationhttpwwwhindawicom Volume 2014
Electrical and Computer Engineering
Journal of
Hindawi Publishing Corporation
httpwwwhindawicom Volume 2014
Advances in
Multimedia
International Journal of
Biomedical Imaging
Hindawi Publishing Corporationhttpwwwhindawicom Volume 2014
Advances in
Hindawi Publishing Corporationhttpwwwhindawicom Volume 201
RoboticsJournal of
Hindawi Publishing Corporationhttpwwwhindawicom Volume 2014
Hindawi Publishing Corporationhttpwwwhindawicom Volume 2014
Computational Intelligence and Neuroscience
Industrial EngineeringJournal of
Hindawi Publishing Corporationhttpwwwhindawicom Volume 2014
Modelling amp Simulation in EngineeringHindawi Publishing Corporation httpwwwhindawicom Volume 2014
The Scientific World JournalHindawi Publishing Corporation httpwwwhindawicom Volume 2014
Hindawi Publishing Corporationhttpwwwhindawicom Volume 2014
Human-ComputerInteraction
Advances in
Computer EngineeringAdvances in
Hindawi Publishing Corporationhttpwwwhindawicom Volume 2014
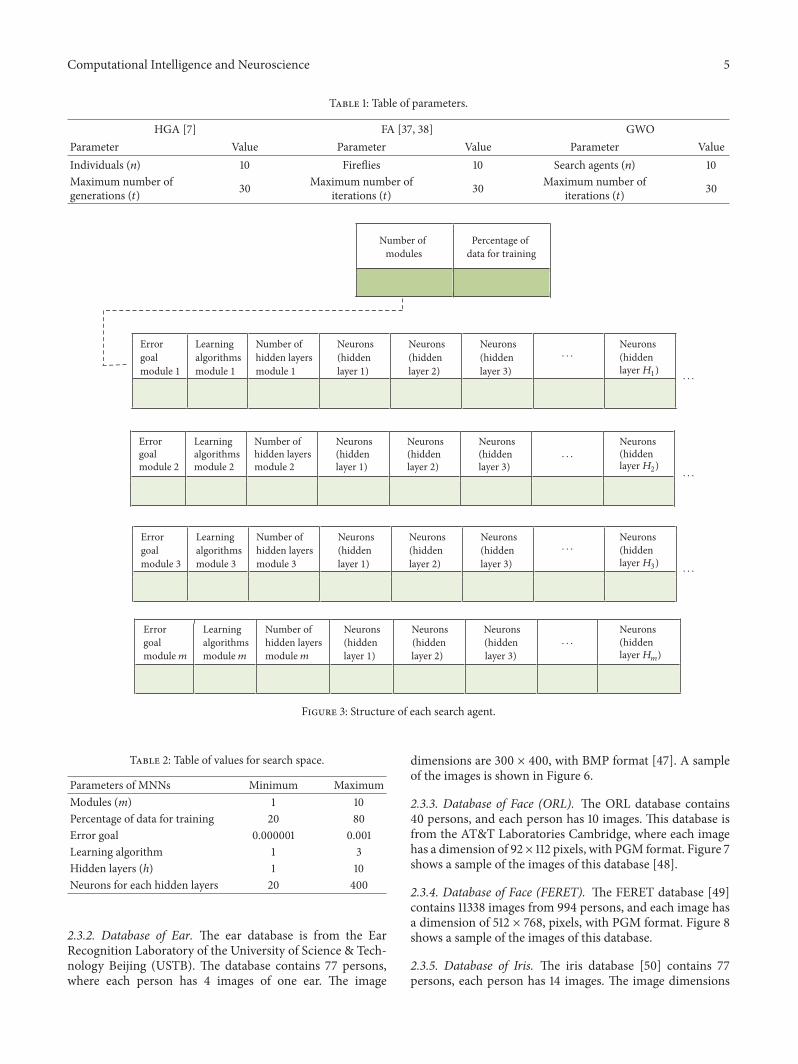
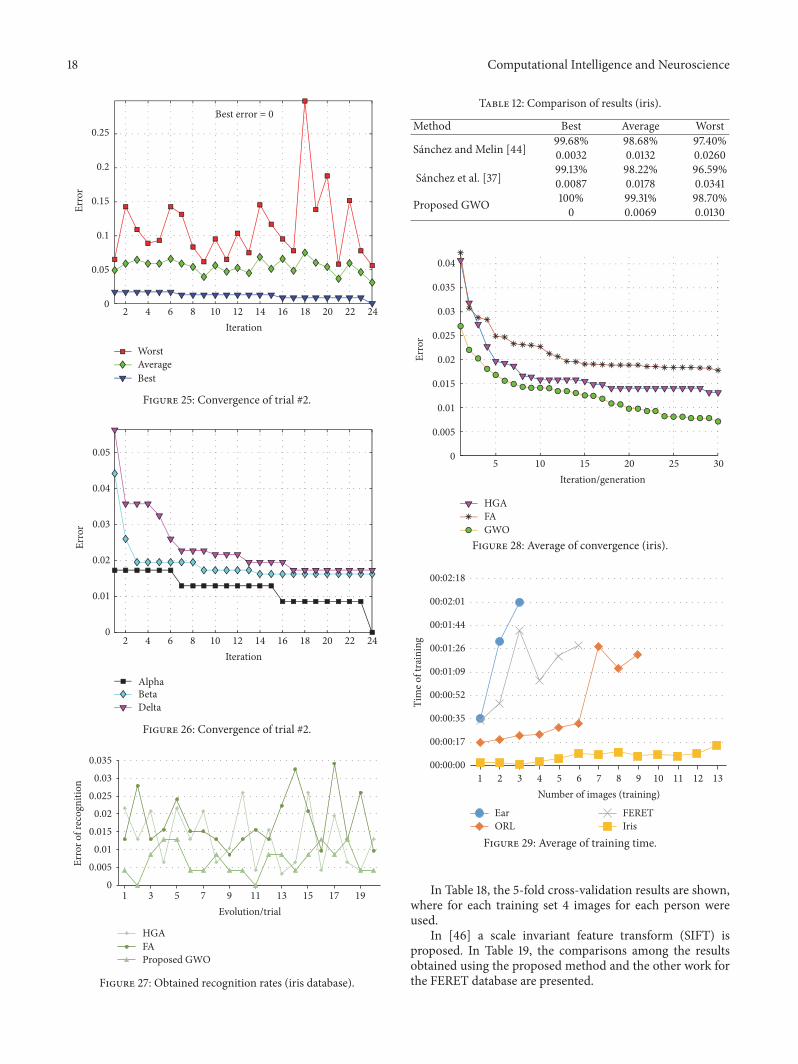
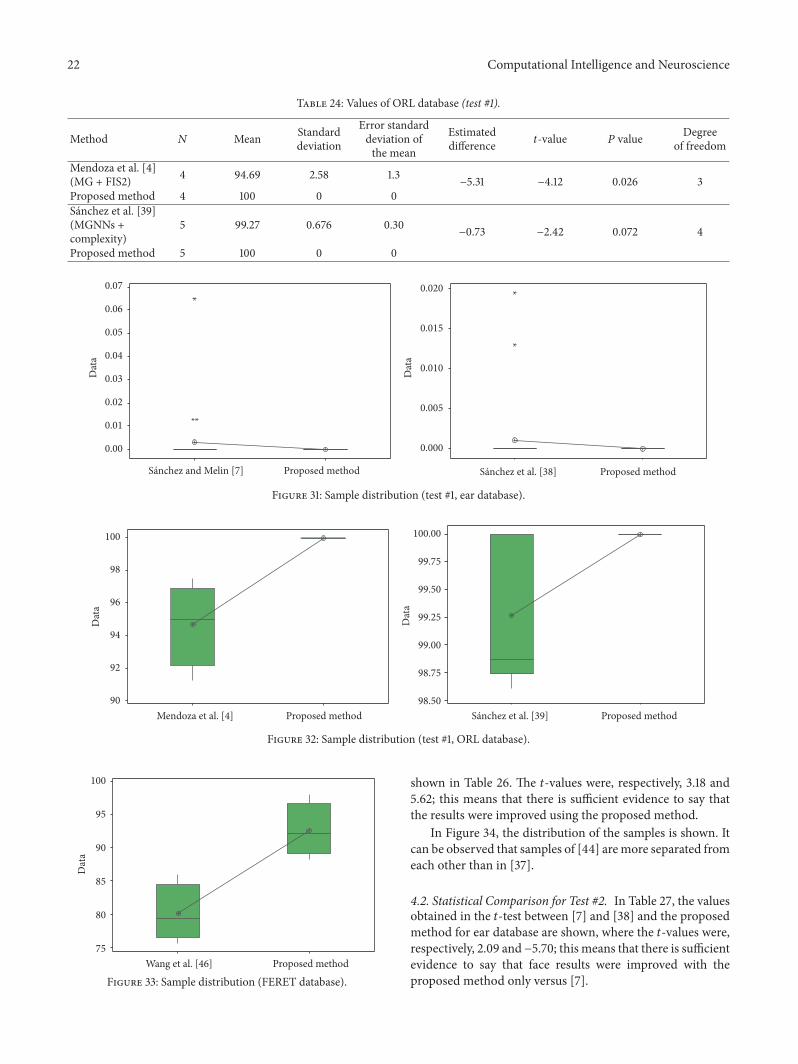