a graphical method for evaluating the effect of blocking in response surface designs
TRANSCRIPT

This article was downloaded by: [Joh Gutenberg Universitaet]On: 24 October 2014, At: 15:33Publisher: Taylor & FrancisInforma Ltd Registered in England and Wales Registered Number: 1072954 Registered office: MortimerHouse, 37-41 Mortimer Street, London W1T 3JH, UK
Communications in Statistics - Simulation andComputationPublication details, including instructions for authors and subscription information:http://www.tandfonline.com/loi/lssp20
A graphical method for evaluating the effect ofblocking in response surface designsPark Sang ‐ Hyun a & Jang Dac ‐ Heung a
a Division of Mathematical Sciences , Pukyong Kational University , Pusan, 608-737,Republic of Korea www.dekker.comPublished online: 27 Jun 2007.
To cite this article: Park Sang ‐ Hyun & Jang Dac ‐ Heung (1999) A graphical method for evaluating the effect ofblocking in response surface designs, Communications in Statistics - Simulation and Computation, 28:2, 369-380, DOI:10.1080/03610919908813554
To link to this article: http://dx.doi.org/10.1080/03610919908813554
PLEASE SCROLL DOWN FOR ARTICLE
Taylor & Francis makes every effort to ensure the accuracy of all the information (the “Content”) containedin the publications on our platform. However, Taylor & Francis, our agents, and our licensors make norepresentations or warranties whatsoever as to the accuracy, completeness, or suitability for any purposeof the Content. Any opinions and views expressed in this publication are the opinions and views of theauthors, and are not the views of or endorsed by Taylor & Francis. The accuracy of the Content should notbe relied upon and should be independently verified with primary sources of information. Taylor and Francisshall not be liable for any losses, actions, claims, proceedings, demands, costs, expenses, damages, andother liabilities whatsoever or howsoever caused arising directly or indirectly in connection with, in relationto or arising out of the use of the Content.
This article may be used for research, teaching, and private study purposes. Any substantial or systematicreproduction, redistribution, reselling, loan, sub-licensing, systematic supply, or distribution in anyform to anyone is expressly forbidden. Terms & Conditions of access and use can be found at http://www.tandfonline.com/page/terms-and-conditions

COMMUN. STATIST.-SIMULA., 28(2), 369-380 (1999)
A Graphical Method for Evaluating the Effect of Blocking in Response Surface Designs
Sang-Hyun Park and Dac-IIeung Jang
Division of Mathematical Sciences Pukyong Kational University. Pusan, 6 0 8 - i 3 7 Republic of Korea
Key Words : response surface design; orthogonal blocking; fixed block effect: random block effect; blocking effect variance plot; total blocking variance; total unblocking variance.
ABSTRACT
When fitting a response surface model, the least squares estimates of the model's parameters will generally depend on how the response surface design is blocked. Then, the choice of a blocking arrangement for a response surface design can have a considerable effect on estimating the mean response, on the size of the prediction variance and on the variance of the least squares estimator of the model's parameters. These are all shown t o be affected by the sizes of the blocks and the allocation of experimental runs t o the blocks. In this paper, we propose a graphical method for evaluating the effect of blocking in response surface designs. This graphical method can be used to examine how blocking influences the variance of the least squares estimator of the model's parameters. and to compare the effect of blocking in the cases of the orthogonal and nonorthogonal block designs, respectively.
1. INTRODUCTION
The conditions under which experimental trials are performed in a response sur- face design may not, in general, be homogeneous. In this case, blocking may be often carried out for homogeneity. In the statistical literature on response surface methodology, whenever a block design is used, the block effect is often considered to be fixed - that is, represented by a constant parameter in the assumed model. This effect can affect the estimation of the mean response and prediction variance over a certain region of interest. If the polynomial effects can be estimated inde-
Copyr~ght '0 1999 by Marcel Dekker, Inc.
Dow
nloa
ded
by [
Joh
Gut
enbe
rg U
nive
rsita
et]
at 1
5:33
24
Oct
ober
201
4

370 PARK AND JANG
pendently of the block effects, then the design used is said to block orthogonally. In this special case. the least squares estimates are invariant to the block effect, and hence the standard techniques of response surface methodology can be applied as if the block effect did not exist. The conditions for a response surface design t o block orthogonally were given by Box and Hunter(l957) for a second-order model and by Khuri(l992) for the general case of a model of order d(> 1).
In many experimental situations. a response surface design may not block orthog- onally. In all such cases, the least squares fit of the assumed model and prediction variance can be affected by the blocking arrangement. Therefore, i t is important that the block effect be accounted for before any exploration of the response surface is carried out. Dey and Das(1970) and Adhikary and Panda(1990) introduced the concept of nonorthogonal blocking for the special case of second-order models. More recently, Khuri(1994) demonstrated the effects of the blocks on estimating the mean response, on the prediction variance and on the optimum of the response surface model in the presence of a fixed block effect. In the presence of a fixed block effect, Park and Jang(1997a) proposed measures for evaluating the effect of blocking in response surface designs in terms of prediction variance.
There are, however, experimental situations in which i t is more appropriate to consider the block effect as random. The use of such a model in a response surface environment was first considered by Khuri(1992), and Khuri(1996) extended his work by the addition of interaction terms between the fixed polynomial effects and the random block effect. Park and Jang(1997b) proposed a measure and a graphical method for evaluating the effect of blocking in response surface designs with random block effects.
In this paper, we propose a graphical method for evaluating the effect of block- ing in response surface designs. This graphical method can be used to investigate how blocking influences the variance of the least squares estimator of the model's parameters, and to compare the effect of blocking in the cases of the orthogonal and nonorthogonal block designs, respectively.
2. EFFECT OF BLOCKING IN RESPONSE SURFACE DESIGNS
2.1 Case of a fixed block effect
Let us consider a response surface model of order d(> I ) in k input variables, X I , 2 2 , . . . , xk. Let us assume that the experimental units used are not homogeneous, but that they can be divided into b blocks, where the units within a block are somewhat homogeneous. Let n, denote the size of the ~ t h block(j = 1 , 2 , . . . , b) such that n = ~ , b = ~ n,. The response vector - y which consists of the n observations, can then be represented by the model
Y = P o l , + X P + Z & + E - (1) where 1, is a vector of ones of order n x 1, X is an n x p model matrix except I,, the elements of the vector /3 = (B1,P2.. . . ; P p ) ' and Po are unknown constant parameters, 6 = (6,? 62,. . . , &b)ywhere 63 denotes the effect of the j t h block, Z is a block-diagonal matrix of form Z = diag( ln l , l n 2 , . . . ,I,,), and g is the n x 1 vector of random errors which is assumed to have a zero mean and a variance-covariance matrix u~I , , where I, is the identity matrix of order n x n. Since 1, = Z&,, model (1) can be written as
Dow
nloa
ded
by [
Joh
Gut
enbe
rg U
nive
rsita
et]
at 1
5:33
24
Oct
ober
201
4

EVALUATING EFFECT OF BLOCKING 37 1
y = W B t g . - (2) where W = [X : Z ] , @ = ( P 1 , ~ ' ) ' and .r = P o l b + 4. If the block effects are
constrained to sum to zero, that is, ~ j b = , = 0 , then can be expressed as
where r1 is the 3th element of L(J = 1,2. . . . . b) . If W is of full column rank, then I
the least-squares estimator of @ is given by = (13 . ? ' ) I = (W'W)-'W'LJ. The - - var iance-co~ar ianc matrix of H is hence given as
and the least-squares estimate & of ,!& and the variance of 8 0 are respectively given b
by jo = = ilb'f and
Though there are block effects. the ordinary least-squares estimator obtained b) ignoring the block effects is P* = ( U I T i ) - ' l i ' y and the variance-covariance matrix - -
of 2 is
2.2 Case of a random block effect
Let us rewrite model ( 1 ) as
where CT = [I, : X] defined in formula (5) is an n x (p + 1) model mat,rix, 3' = (Po ,P1 ,P2 , . . . ;&)' is the vector of unknown constant parameters, Z and are defined in the model (1). This case deals with situations in which the block effect in model (6) is random so that 6 is distributed as ( 0 , c ; Ib ) independently of g. Model (6) is therefore a mixed model, since P_* is a fixed parameter vector. The mean response vector and the variance-covariance matrix of 2 in this model are then given by E ( y ) = lip' and = oarn + u i Z Z 1 = azr , where r = d i a g ( r l , T z , . . . , rb) . where r j = rnT+ CJn,, ( j = 1 , 2 , . . . , b ) , where JnJ is an nj x n, matrix of ones and
In general, C is unknown and should therefore be estimated by finding suitable estimates of the variance components, and 0:. However, since our concerns is merely in the performance of an experimental design, we consider a fixed ratio C .
Dow
nloa
ded
by [
Joh
Gut
enbe
rg U
nive
rsita
et]
at 1
5:33
24
Oct
ober
201
4

372 PARK AND JANG
Khuri(1992) demonstrated that if the ratio ( is known, then the BLUE of is the
generalized least squares estimator pi given by P* = (GII'-'U)-'U'T-'y and the -9 -
variance-covariance matrix of p* is -9
It is meaningful t o compare the variances of least squares estimator of a blocked design and an unblocked design when there are block effects, that is, 026 > 0. Though there are block effects, the ordinary least-squares estimator of - P* obtained by
ignoring the block effects is used as 3: = (UIU)-'U'y and the variance-covariance
matrix of p: is
3. A GRAPHICAL METHOD FOR EVALUATING THE EFFECT OF BLOCKING IN RESPONSE SURFACE DESIGNS
In the presence of a fixed block effect, Park and Jang(1997a) proposed measures for evaluating the effect of blocking in response surface designs and as the extension of their works, Park and Jang(1997b) proposed a measure and a graphical method for evaluating the effect of blocking in response surface designs with random block effects. But these papers are based on the maximum, the minimum and the spherical average of the prediction variance on spheres of varying radii inside a region of interest.
Thus, so as to investigate in detail the variation in the variance of the least squares estimator due to blocking, we propose a graphical method that evaluates the effect of blocking in response surface designs in the presence of a fixed effect and a random effect, respectively. In the case of a fixed effect, from formula (3) , let us consider
where v(&) = Var(,!&)/u: is expressed from formula (4), ~ ( 4 , ) is the variance(apart from 02) of the i th least squares estirnate after blocking and the i th diagonal element of (WIW)-' . Also: from formula ( 5 ) , let us consider
where ~ ( b : ) is the variance(apart from 02) of the zth least squares estimate before blocking and the i t h diagonal element of ( U ' U ) - ' .
Similarly, in the case of a random effect, from formula (8), let us consider
Dow
nloa
ded
by [
Joh
Gut
enbe
rg U
nive
rsita
et]
at 1
5:33
24
Oct
ober
201
4

EVALUATING EFFECT OF BLOCKING 373
where ~ ( 3 ; ~ ) is the variance(apart from u?) of the zth least squares estimate after blocking and the zth diagonal element of (LT-'C)- ' . Also, from formula (9). let us consider
where ~ ( b , ' , ) is the variance(apart from 0 2 ) of the ath least squares estimate obtained by ignoring the block effects and the zth diagonal element of (UIU)-' LT'I'U(UIU)-'. Then, from formulas ( 1 0 ) ~ ( 1 3 ) , we can draw a vertical line from v(,!?;) to ~ ( 6 % ) for each 2, along each blocking arrangement in the presence of a fixed block ef- fect and we can also draw a vertical line from ~ ( b , ' , ) to v(!?,*,) for each z, along each blocking arrangement in the presence of a random block effect. We call these graphs the blocking effect variance plot(BEVP). In the special case of an orthog- onally blocked design, the least squares estimates of the fitted model's parameters remain unchanged by the block effect, except possibly for the intercept. That is. if the design blocks orthogonally, then the least squares estimates of the polynomial parameters in the fitted model are the same as those if the block effect did not exist in the model. Khuri(l994) demonstrated that in the case of a fixed effect. blocking causes an increase in the variance, that is. ~ ( 8 , ) > ~ ( b : ) for each i. But, the op- posite occurs in the case of a random effect, namely, ~ ( 4 , ) 5 ~(j,*,) for each %(See Searle(l971, pp. 87-89)).
Through these graphs, we can investigate more clearly how blocking influences on the variances of the least squares e~t imat~es of the fitted model's parameters, and compare the block effect in the cases of the orthogonal and nonorthogonal block de- signs, respectively. That is, we can examine more clearly the change in the variances of the least squares estimates of the fitted model's parameters along several block- ing arrangements and that to choose which blocking arrangement among competing blocking arrangements in the same experimental runs is most effective in terms of the variance of the least squares estimates of the fitted model's parameters.
Since for large values of k , the number of parameters would become too large for studying the effects of blocking on individual parameters, this graphical method would be most useful in experiments involving a small number of factors. For large values of k, a measure assessing the effect of blocking based on the whole variance- covariance matrix of the least squares estimator would be needed. The design op- timality criteria based upon the determinant and trace of the variance-covariance matrix of the least squares estimator are very well known. The best known and most often used criterion is D-optimality. In general, the determinant of a square symmet- ric p x p matrix A can be expressed as the product of its eigenvalues XI, Az,. . . , A,. that is, J A J = IIr='=,A,. But under extreme conditions when some of the eigenvalues of variance-covariance matrix of the least squares estimator are very small, the deter- minant may be almost zero. In a particular setting, the trace criterion can be a good indicator to assess the effect of blocking. Thus, since tr(A) = Crz1 A , , as an addi- tional tool of this graphical method, we consider the trace of the variance-covariance matrix of the least squares estimator as follows :
In the case of a fixed block effect, from formulas (10) and ( l l ) ,
Dow
nloa
ded
by [
Joh
Gut
enbe
rg U
nive
rsita
et]
at 1
5:33
24
Oct
ober
201
4

374
and
PARK AND JANG
are called the total blocking variance and the total unblocking variance in the case of a fixed block effect. Here, w,, is i th diagonal element of (WIW)- ' and u;, is i th diagonal element of (U 'U- ' . Similarly, in the case of a random block effect, from formulas (12) and (13) ,
and
are called the total blocking variance and the total unblocking variance in the case of a random block effect. Here, g,, is zth diagonal element of (U'r-'Cr)-' and q,, is i th diagonal element of (CrlC')-'U'rlT(UIU)-'.
4. A NUMERICAL EXAMPLE
Let us consider an example used in Khuri(l994). This example is based on an experiment described by Box and Draper (1987, p.360), concerning a small reactor study. The experiment was performed sequentially in four blocks, each consisting of six runs. Three input variables were considered (i.e. F: flow rate in liters per hour, C: concentration of catalyst, T: temperature). Table I shows the original block design described by Box and Draper(1987). A second-order model in X I , 22 and x s was fitted. Here, X I : x2 and x3 denote the coded values of F, C and T, respectively. The original block design is of the central composite form with four center points and a replicated axial portion. This particnlar design is rotatable and blocks orthogonally, as can be verified by applying Box and Hunter's(l957) conditions.
Let us consider other blocking arrangements of the same 24 experimental runs in Table I. These blocking arrangrments are described in Table 11; which is modified from Table I1 in Khuri(1994). For the original block design and several blocking arrangements described in Table 11, computations are made of the variances of the least squares estimates in formulas (10)-(13) in the cases of a fixed block effect and a random block effect, respectively. It should be noted that blocking arrangement 6 has different number of blocks and block sizes and is orthogonal, but the other blocking arrangements are not. It also should be noted that blocking arrangements 1.-5 have the same number of blocks and the same block sizes as in the original block design. but the allocation of experimental runs to the blocks is not the same.
Figure 1 and Figure 2 show the BEVPs for all parameters along several blocking arrangements in the cases of a fixed block effect and a random block effect, respec- tively. In the case of a random block effect. i t must be considered the value of the ratlo C = oils?. We have trled to d e p ~ c t the BEVPs for the several values of <. As
" -
the results, we have found that on the whole, i t appears that ~ ( b i , ) increases as
Dow
nloa
ded
by [
Joh
Gut
enbe
rg U
nive
rsita
et]
at 1
5:33
24
Oct
ober
201
4

Table 11. Division of the experimental runs described in Table I for the blocking arrangements
Blocking Block 1 Block 2 Block 3 Block 4 arrangement
8, 9, 10 1.14.15
5 , 6 , 7 , 8 16,17,18 22,23,24 9,10,11,12
Dow
nloa
ded
by [
Joh
Gut
enbe
rg U
nive
rsita
et]
at 1
5:33
24
Oct
ober
201
4

I : . 8 I .
1 i k 5 8 1
BLOCKING ARRANGEMENT
Figure 1 Blockvlg effect variance plot for severd blocking arrangements with a fixed effect
Dow
nloa
ded
by [
Joh
Gut
enbe
rg U
nive
rsita
et]
at 1
5:33
24
Oct
ober
201
4

EVALUATING EFFECT OF BLOCKING
0.6 ! -do 3
1 . 1 . * 03 - ' 0.0 , I , , , 1
0 1 2 3 4 5 5 BLOCKING ARRANGEMENT
Figure 2. Blocking effect variance plot for several blocking arrangements with a random effect ({= 0.5)
Dow
nloa
ded
by [
Joh
Gut
enbe
rg U
nive
rsita
et]
at 1
5:33
24
Oct
ober
201
4

PARK AND JANG
Table 111. The total blocking variances and the total unblocking variances and their differences for several blocking arrangements with a fixed effect
-- -- - -
Blocking arrangement
2 3 4 -
original* 1 3 6'
TUVf 1.0208 1.0208 1.0208 1.0208 1.0208 1.0208 1.0208
TBVf 1.0208 1.7083 1.3375 1.0896 1.0850 1.1397 1.0255
Difference 0.0000 0.6875 0.3167 0.0687 0.06.12 0.1189 0.0046
* Onhogonal blocking arrangements
C increases. Hence, we describe the BEVP with only a fixed value(( = 0.5). From Figure 1, we find the fact that for several blocking arrangements, the values of v(ei) in formula (10) appear to be always greater than or equal to the values of ~ ( b ; ) in formula (11) for each 2 . but from Figure 2, the opposite occurs in the case of a random block effect. From both Figures. we can see that since the original block design and blocking arrangement 6 block orthogonally. the BEVPs of all parameters for these orthogonal blocked designs appear as one point, except possibly for the in- tercept. This means that for these orthogonal blocked designs, the variances of the least squares estimates of the fitted model's parameters remain unchanged by the block efTects. Also, from these Figures, comparing the BEVPs for the nonoithogunal blocking arrangements 1.- 5 which have the same number of blocks, we can clearly see that the BEVP for blocking arrangement 4 minimizes the change in the vari- ance of the least squares estimator of the fiited model's parameters This means that blocking arrangement 4 is most effective among competing nonorthogonal blocking arrangements. We see that for the random-effects model, as shown in Figure 2 : the constant term. v(&) always has largest change.
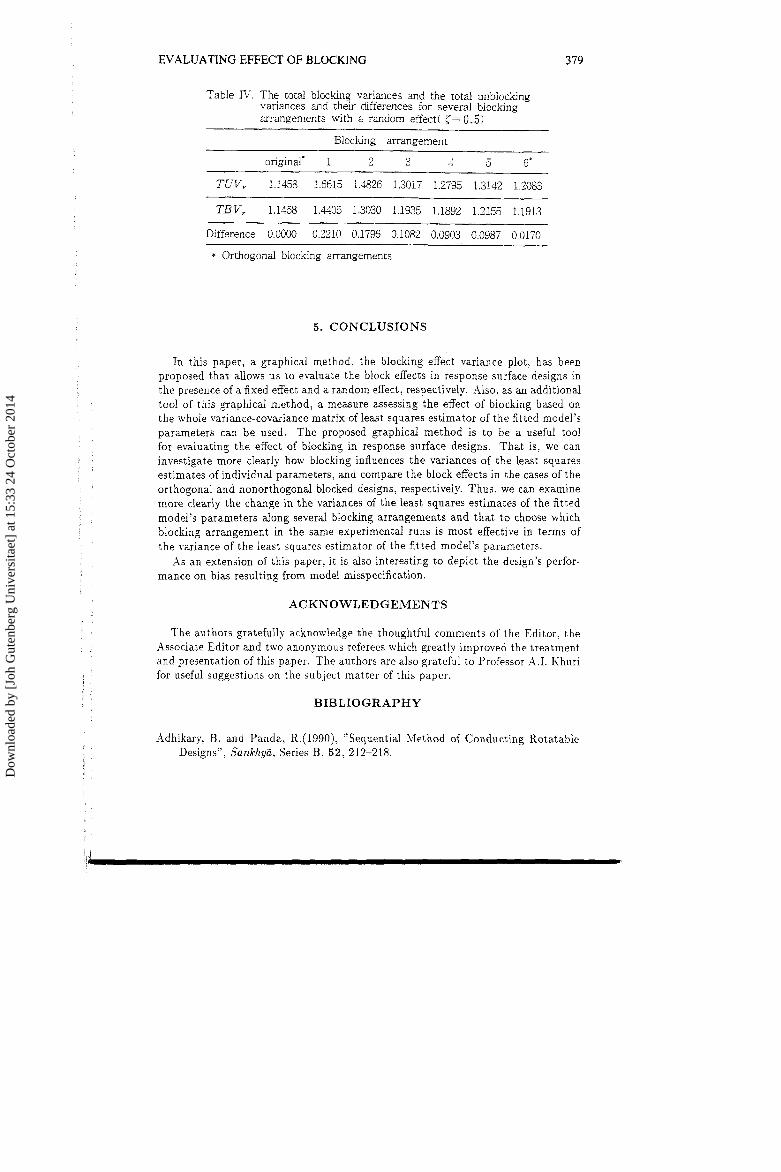
The proposed graphical method wouid be most useful if the number of factors is small. To supplement this limitation, a measure assessing the effect of blocking based on the whole variance-covariance matrix of least squares estimator is proposed. From formulas (14)-(17), computations of the total blocking variances, the total unblocking variances and their differences in the cases of a fixed effect and a random effect respectively are made. The results are given in Tables 111-IV. From Tables 111-IV, we conclude that for the original block deslgn, the trace of the variance- covariance matrix of the least squares estimator of the fitted model's parameters remains unchanged by the block effects and to choose blocking arrangement 4 among competing nonorthogonal blocking arrangements which have the same number of blocks is most effective in terms of the variance of the least squares estimator of the fitted model's parameters.
Dow
nloa
ded
by [
Joh
Gut
enbe
rg U
nive
rsita
et]
at 1
5:33
24
Oct
ober
201
4
EVALUATING EFFECT OF BLOCKING
Table IV. The total blocking variances and the total unblocking variances and their differences for several blocking arrangements with a random effect( c= 0.5)
Blocking arrangement
'2 3 4 - original' 1 3 6'
TUV, 1.1458 1.6615 1.1826 1.3017 1.2795 1.3142 1.2083
TBV, 1.1458 1.4105 1.3030 1.1935 1.1892 1.2155 1.1913
Difference 0.0000 0.2210 0.1796 0.1082 0.0903 0.0987 0.0170
* Orthogonal blocking arrangements
5. CONCLUSIONS
In this paper, a graphical method. the blocking effect variance plot, has been proposed that allows us to evaluate the block effects in response surface designs in the presence of a fixed effect and a random effect, respectively. hlso, as an additional tool of this graphical method. a measure assessing the effect of blocking based on the whole variance-covariance matrix of least squares estimator of the fitted model's parameters can be used. The proposed graphical method is t o be a useful tool for evaluating the effect of blocking in response surface designs. Tha t is, we can investigate more clearly how blocking influences the variances of the least squares estimates of individual parameters, and compare the block effects in the cases of the orthogonal and nonorthogonal blocked designs, respectively. Thus, we can examine more clearly the change in the variances of the least squares estimates of the fitted model's parameters along several blocking arrangements and that t o choose which blocking arrangement in the same experimental runs is most effective in terms of the variance of the least squares estimator of the fitted model's parameters.
As an extension of this paper, it is also interesting to depict the design's perfor- mance on bias resulting from model misspecification.
ACKNOWLEDGEMENTS
The authors gratefully acknowledge the thoughtful comments of the Editor. the Associate Editor and two anonymous referees which greatly improved the treatment and presentation of this paper. The authors are also grateful to Professor A.I. Khuri for useful suggestions on the subject matter of this paper.
BIBLIOGRAPHY
Adhikary, B. and Panda, R.(1990), "Sequential Method of Conducting Rotatable Designs", Sankhyii, Series B: 52, 212-218.
Dow
nloa
ded
by [
Joh
Gut
enbe
rg U
nive
rsita
et]
at 1
5:33
24
Oct
ober
201
4

380 PARK AND JANG
Box, G. E. P. and Draper, N. R.(1987), Empirical Model-Building and Response Surfaces, John Wiley & Sons. Inc., New York.
Box, G. E. P. and Hunter, J. S.(1957): "Multi-factor Experimental Designs for Ex- ploring Response Surfaces'', The Annals of Mathematical Statistics, 28, 195- 241.
Dey, A. and Das, M. N.(1970), "On Blocking Second Order Rotatable Designs", Calcutta Statistical Association Bulletin, 19, 75-85.
Khuri, A. 1.(1992), "Response Surface Models with Random Block Effects", Tech- nometrics, 34, 26-37.
-- -- - -- (1994); "Effect of Blocking on the Estimation of a Response Surface", Journal of Applied Statistics, 21, 305-316.
------ (1996). "Response Surface Models with Mixed Effects": Journal of
Quality Technology, 28. 177-186.
Park, S. H. and Jang, D. H.(1997a), "Measures for Evaluating the Effect of Blocking in Response Surface Designs". submitted.
-- ----- up (1997b), "A Measure and a Graphical Method for Evalu-
ating the Effect of Blocking in Response Surface Designs with Random Block Effect", submitted.
Searle, S. R.(1971), Linear .Yodels, John LTiiley, New York.
Received February, 1998; Revised December, 1998.
Dow
nloa
ded
by [
Joh
Gut
enbe
rg U
nive
rsita
et]
at 1
5:33
24
Oct
ober
201
4