a “graph-based” service catalogue - bnova.it · slide 3 slide 5 slide 7 - 9 slide 11 slide 13 -...
TRANSCRIPT

A “Graph-based” Service Catalogue
How Neo4J can help your business with a tool to govern your services
Alberto De Lazzari – IT Architect, Veneto Banca

Slide 3
Slide 5
Slide 7 - 9
Slide 11
Slide 13 - 20
Introduction: the Multichannel Project
The landscape of our services
What are the problems we try to solve?
Key features to achieve
Approaches
Slide 22 - 23
Slide 25 - 28
Slide 30 - 32
Why Neo4J? (We wouldn’t be standing here today)
What we have done (and what we have achieved)
Conclusions
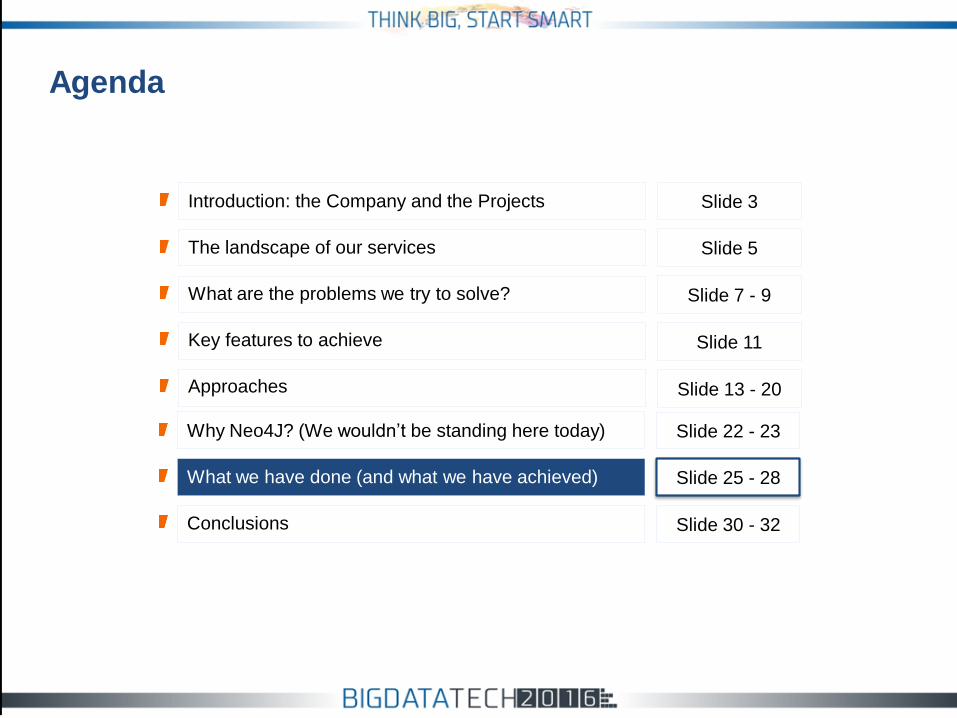
Agenda

Introduction: the Multichannel Project
Data Provider services are
integrated and organized by an
architectural powerful engine for
decoupling the business layer
from the external ones
Multichannel project
The applications in the
multichannel project spans into
self and supervised channels
The focus is on the channel, the
customer and the way he
«speaks» with the bank
Multichannel applications rely on
a brand new architecture which
is resilient, scalable and based on
the atomic service paradigm
Business data are stored into a
Datawerhouse that encapsulate
the data quality engine
Da
ta P
rovid
er
Ap
plic
ati
on
sIn
fra
stu
ctu
res
HUB Cliente Contact CenterCommercial
support tools
Architecture Datawarehouse
BankUp

Agenda
Slide 3
Slide 5
Slide 7 - 9
Slide 11
Slide 13 - 20
Introduction: the Company and the Projects
The landscape of our services
What are the problems we try to solve?
Key features to achieve
Approaches
Slide 22 - 23
Slide 25 - 28
Slide 30 - 32
Why Neo4J? (We wouldn’t be standing here today)
What we have done (and what we have achieved)
Conclusions

An “atomic service layer”:
a fine-grained set of services that implements atomic “functions”
Veneto Banca Multichannel Business Services are composed by two layers:
650
services
350
services
A “business service layer”:
a higher level set of services that are a composition(integration/orchestration) of one or more atomic services
The landscape of our services
SEC NCR CartaSìThomson
Reuters
Internal users and customers applications with high integration to each other
Many different providers:

Agenda
Slide 3
Slide 5
Slide 7 - 9
Slide 11
Slide 13 - 20
Introduction: the Company and the Projects
The landscape of our services
What are the problems we have to face?
Key features to achieve
Approaches
Slide 22 - 23
Slide 25 - 28
Slide 30 - 32
Why Neo4J? (We wouldn’t be standing here today)
What we have done (and what we have achieved)
Conclusions

Service glossary and structure:
No automatic process for the identification of each service for each
level
No service discovery and description: the name of the endpoint or the
developer knowledge are not enough to avoid duplication and collect
informations. It’s error prone and hard to maintain.
No informations between the lower layer and higher one. What is the
overall structure?
The problem we have to face: Information,
Documentation and Governance

The problem we have to face: Impact Analysis and
Testing Process
Impact Analysis and Testing Process:
For a given set of software changes we want to know what are the
business services that will be impacted and the applications that use
these services.
What is the subset of tests (unit, integration, user acceptance) we must
run? We don’t want to run all the test suites every time!!

The problem we have to face: Automation
Automatic activation of features:
“Service mocking” tool: store the mocking behavior according to the set
of business services exposed by our platform and activate it on the fly.
A console for “hot”configuration switching without the need of restarting
the services. ”Silent” features that could be activated later.

Agenda
Slide 3
Slide 5
Slide 7 - 9
Slide 11
Slide 13 - 20
Introduction: the Company and the Projects
The landscape of our services
What are the problems we try to solve?
Key features to achieve
Approaches
Slide 22 - 23
Slide 25 - 28
Slide 30 - 32
Why Neo4J? (We wouldn’t be standing here today)
What we have done (and what we have achieved)
Conclusions

Key features to achieve
We need a repository where we can collect all the
informations we can extract for our backend
services
The relationships between the objects are one of
the most important informations that we must
handle.
We need a whiteboard friendly representation
that should be easy to draw and understand by
anyone

Agenda
Slide 3
Slide 5
Slide 7 - 9
Slide 11
Slide 13 - 20
Introduction: the Company and the Projects
The landscape of our services
What are the problems we try to solve?
Key features to achieve
Approaches
Slide 22 - 23
Slide 25 - 28
Slide 30 - 32
Why Neo4J? (We wouldn’t be standing here today)
What we have done (and what we have achieved)
Conclusions
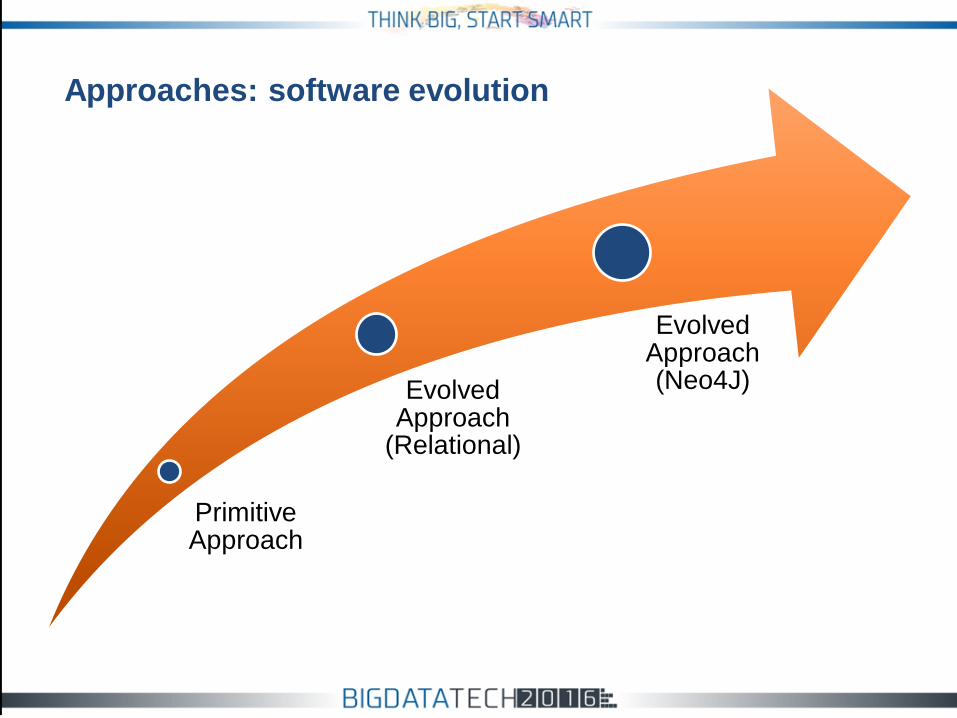
Approaches: software evolution
Primitive Approach
EvolvedApproach
(Relational)
EvolvedApproach(Neo4J)

Approaches: the «primitive» approach
Service Catalogue
(Excel sheet)
Software repositoryinspection
Lookup & collectdocumentation

Approaches: the «primitive» approach
Manual and time consuming process
Error prone
Men can make mistake!
Catalogue not up-to-date with the code
Misalignment between code and service catalogue
What’s wrong with that?
At the end an idea comes out:
We need something to represent the relationships in
a multi-directional pattern

Approaches: the «evolved» approach 1/3
Catalogue Builder Catalogue Repo
Parsers
Readers
&
Connectors
Java Class
Spring XML
OtherXML files
RelationalDB
Source code
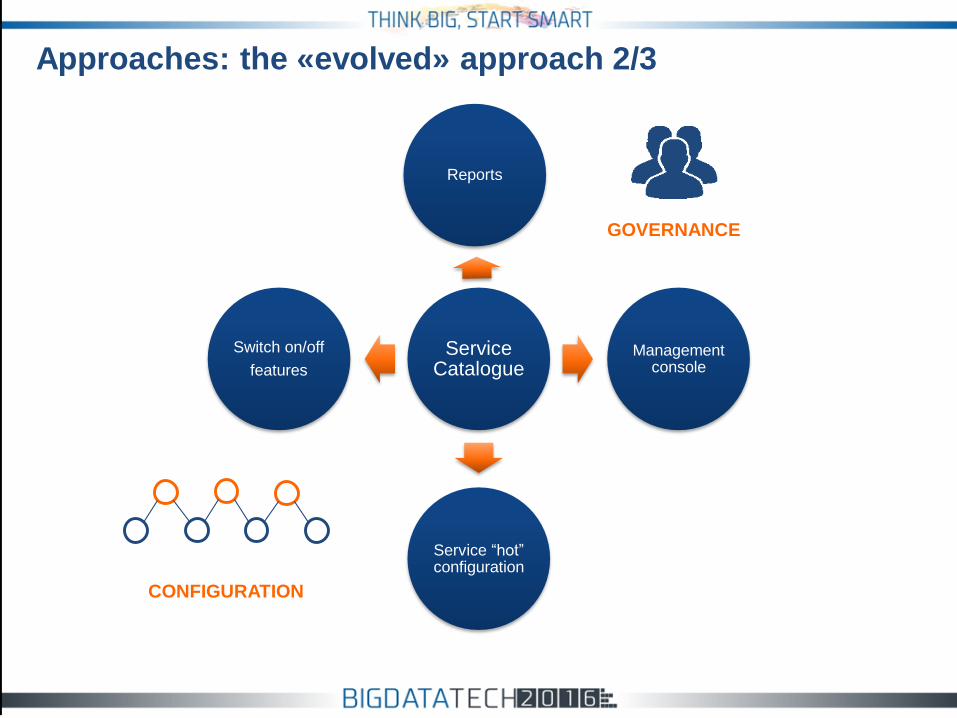
Approaches: the «evolved» approach 2/3
Service Catalogue
Reports
Management console
Service “hot” configuration
Switch on/off
features
GOVERNANCE
CONFIGURATION

Approaches: the «evolved» approach 3/3
Redundancy of data.
Joins are difficult to write and understand
Difficult to refactor and upgrade the data model
No more manual process. Weshould follow the process of the software lifecycle
Catalogue is always up to date with the application delivery and deployment in every environment.

Approaches: let’s move forward
Catalogue Builder Catalogue Repo
Parsers
Readers
&
Connectors
Java Class
Spring XML
OtherXML files
???
Source code

Approaches: the «Neo4J» approach
Catalogue Builder Catalogue Repo
Parsers
Readers
&
Connectors
Java Class
Spring XML
OtherXML files
???
Source code

Agenda
Slide 3
Slide 5
Slide 7 - 9
Slide 11
Slide 13 - 20
Introduction: the Company and the Projects
The landscape of our services
What are the problems we try to solve?
Key features to achieve
Approaches
Slide 22 - 23
Slide 25 - 28
Slide 30 - 32
Why Neo4J?
What we have done (and what we have achieved)
Conclusions

Why Neo4j?
A graph is the most natural way to represent entities (nodes) that have
connections (relationships)
We can add new types of nodes and relationships easily (on the fly!!) so the
model can evolve in a simple way (refactor properties to nodes with no
pain)
The whiteboard model is the physical model (what we draw on a paper is
what we get on the database)
We think that most of the information rely on the relationships. They are
stored in the database and not calculated at runtime

Why Neo4j?
Easy integration through its APIs (and with Spring Data)
Expressive and powerful query language (Cypher)
Written on top of JVM
Cache sharding
Easy Clustering and high avaliability
Hot backups
See http://neo4j.com/neo4j-scales-web-enterprise/ for more
Agenda
Slide 3
Slide 5
Slide 7 - 9
Slide 11
Slide 13 - 20
Introduction: the Company and the Projects
The landscape of our services
What are the problems we try to solve?
Key features to achieve
Approaches
Slide 22 - 23
Slide 25 - 28
Slide 30 - 32
Why Neo4J? (We wouldn’t be standing here today)
What we have done (and what we have achieved)
Conclusions

What we have done: Data sample (1/2)

What we have done: Data sample (2/2)

What we have done: Impact Analysis
(Software change)Change Advisory
Board
Change Sets
(Changed files)
Bottom-Up
Analysis
Impacted
Components
Test Plans
RATIONAL
TEAM
CONCERT
RATIONAL
QUALITY
MANAGER
SERVICE
CATALOGUE

What we have done: Impact Analysis
(External Provider Issue)
End Users
ExternalProvider
Issue
Bottom-Up
Analysis
Impacted
Components
Warns & Alerts
SERVICE
CATALOGUE
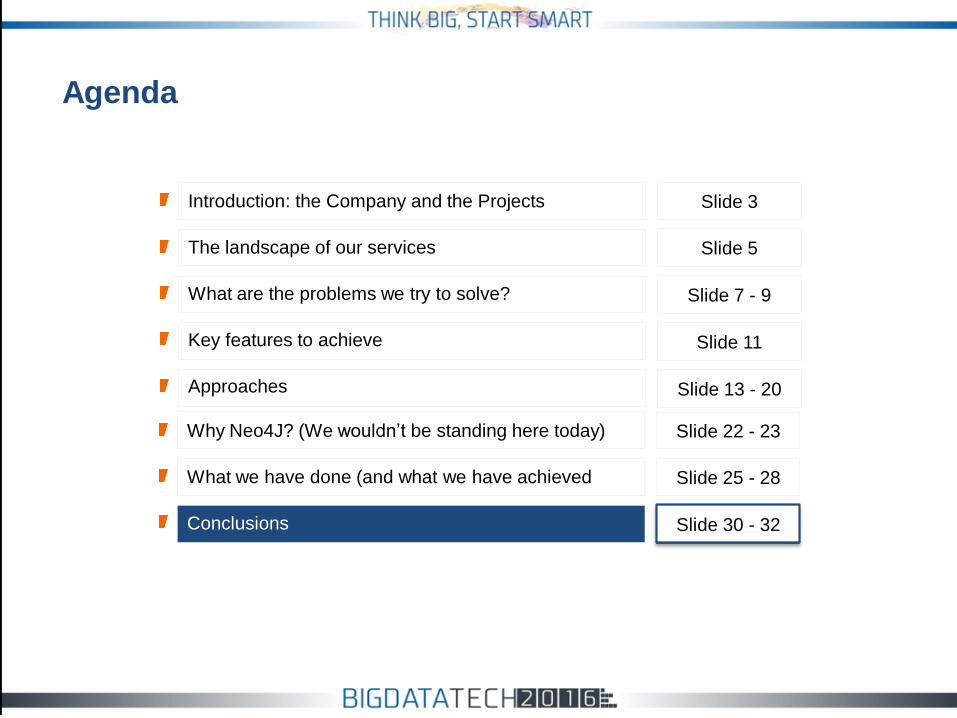
Agenda
Slide 3
Slide 5
Slide 7 - 9
Slide 11
Slide 13 - 20
Introduction: the Company and the Projects
The landscape of our services
What are the problems we try to solve?
Key features to achieve
Approaches
Slide 22 - 23
Slide 25 - 28
Slide 30 - 32
Why Neo4J? (We wouldn’t be standing here today)
What we have done (and what we have achieved)
Conclusions

Conclusions 1/2
...at the end what can we certainly say that...
You must have a service catalogue inside an IT governance and
application map design
Once you got it you can extend the graph with more heterogeneous
informations and areas of interest
If you ask us: well ok, but why with Neo4j?
► Standard DB’s do not manage relationships in a strict manner for
us, Neo4j do it!
► It’s whiteboard friendly, so you can use it without a PC
► It’s powerful and easy. It’s powerful because is easy
► …and last but non least… we like it!

Enterprise Architecture Application
Map
Business Continuity
An so on …
CostManagement
Conclusions 2/2: Future Evolutions
A “GRAPH-BASED” SERVICE CATALOGUE
My heartfelt thanks to:
Luca Montagnini – Veneto Banca CIO
Lorenzo Speranzoni – Larus BA CEO and Founder
My beloved wife
Contacts:
LinkedIn: https://it.linkedin.com/in/albertodelazzari

GRAZIE