a global analysis of land-based polluti on sources...
TRANSCRIPT

ANALYSIS REPORT
LAND-BASEDPOLLUTION SOURCESA global Analysis of Land-Based Polluti on Sources science and transboundary management
GEF IW:Science Project
United Nati ons UniversityInsti tute for Water, Environment and Health175 Longwood Road South, Suite 204Hamilton, ON Canada L8P 0A11.905.667.5511 • www.inweh.unu.edu ISBN: 92-808-6024-0
The United Nati ons Think Tank on Water
Enhancing the use of Science in International
Waters projects to improve project results
Enhancing the use of Science in International
Waters projects to improve project results


Analysis Report of the
Land-based Pollution
Sources Working Group
IW: Science, or Enhancing the Use of Science in International Waters Projects to Improve
Project Results is a medium-sized project of the Global Environment Facility (GEF)
International Waters (IW) focal area, implemented by the United Nations Environment
Program (UNEP) and executed by the United Nations University Institute for Water,
Environment and Health (UNU-INWEH). GEF ID Number: 3343.
CORE PARTNERS

This report is written as part of the IW:Science series of reports comprising a Synopsis and Analysis for each of fi ve classes of global
transboundary water system: River Basin, Lake, Groundwater, Land-based Pollution Sources, and Large Marine Ecosystems and Open
Oceans. The fi ndings and content of the Synopsis and Analysis Reports are then integrated into two IW:Science Synthesis Reports to
provide a global water view with regard to Emerging Science Issues and Research Needs for Targeted Intervention in the IW Focal Area, and
Application of Science for Adaptive Management & Development and use of Indicators to support IW Projects. All reports can be found on
the IW:Science, UNU-INWEH, IW:LEARN and GEF websites.
This report was prepared under the responsibility of the IW:Science Core Partner and Lead Institution of the Land-based Poluttion Sources
Working Group:
Through the dedication, input and authorship of the Land-based Pollution Sources Working Group Co-chairs:
Hartwig Kremer Chief Executive Offi cer – LOICZ
Ramesh Ramachandran Institute for Ocean Management, Anna University
and the IW:Science Land-based Pollution Sources Working Group members:
Anil Arga National Institute of Oceanography, India
Andrés Carsen UNDP – Consultant, Argentina
Michelle Etienne Green Islands Foundation, Seychelles
Virginie Hart UNEP/MAP, Greece
Kem Lowry University of Hawaii, United States of America
Purvaja Ramachandran Institute for Ocean Management, Anna University, India
Juan Restrepo Department of Geological Sciences, EAFIT University, Colombia
Jan Vermaat Institute for Environmental Studies, VU University, Amsterdam
Christoph Zoeckler Consultant, UNEP – World Conservation Monitoring Centre
DISCLAIMERThe designations employed and presentations of material throughout this publication do not imply the expression of any opinion whatsoever
on the part of the United Nations University (UNU) concerning legal status of any country, territory, city or area or of its authorities, or
concerning the delimitation of its frontiers or boundaries. The views expressed in this publication are those of the respective authors and do
not necessarily refl ect the views of the UNU. Mention of the names of fi rms or commercial products does not imply endorsement by UNU.
©The United Nations University, 2012
Available from:
United Nations University Institute for Water, Environment and Health (UNU-INWEH)
175 Longwood Road South, Suite 204
Hamilton, Ontario CANADA L8P OA1
Tel: + 1-905-667-5511 Fax: + 1-905-667-5510
Email: [email protected] Web: www.inweh.unu.edu
IW:Science Project Manager: Andrew Dansie
ISBN 92-808-6024-0
Cover photo: Catching fi sh in the coral triangle, Timor-Leste / UN Photo, M. Perret
Analysis Report of the Land-based Pollution Sources Working GroupMarch 2012

Land-based Pollution Sources
iii
List of Acronyms and Abbreviations
ACRONYM MEANING
AMF ADAPTIVE MANAGEMENT FRAMEWORK
CSDMS COMMUNITY SURFACE DYNAMICS
MODELING SYSTEM
DPSIR DRIVER, PRESSURE, STATE, IMPACT,
RESPONSE (FRAMEWORK)
ELME EUROPEAN LIFESTYLES AND MARINE
ECOSYSTEMS
EMP ENVIRONMENTAL MANAGEMENT PLAN
EQO ENVIRONMENT QUALITY OBJECTIVE
GEOHAB MARINE GEOLOGICAL AND BIOLOGICAL
HABITAT MONITORING
GESAMP JOINT GROUP OF EXPERTS ON THE
SCIENTIFIC ASPECTS OF MARINE
ENVIRONMENTAL PROTECTION
GIWA GLOBAL INTERNATIONAL WATERS
ASSESSMENT
GLOBALLAST GLOBAL BALLAST WATER MANAGEMENT
PROGRAMME
GPA GLOBAL PROGRAMME OF ACTION FOR
THE PROTECTION OF THE MARINE
ENVIRONMENT
ICM INTEGRATED COASTAL MANAGEMENT
ICSU INTERNATIONAL COUNCIL OF SCIENCES
ICZM INTEGRATED COASTAL ZONE
MANAGEMENT
IPCC INTERGOVERNMENTAL PANEL ON
CLIMATE CHANGE
IPY INTERNATIONAL POLAR YEAR
IWRM INTEGRATED WATERS RESOURCE
MANAGEMENT
LBP LAND BASED POLLUTION
LME LARGE MARINE ECOSYSTEMS
ACRONYM MEANING
LMMA LOCALLY MANAGED MARINE AREA
LOICZ LAND-OCEAN INTERACTIONS IN THE
COASTAL ZONE
MEG MULTIDISCIPLINARY EXPERT GROUP
MOA MEMORANDUM OF AGREEMENT
MPA MARINE PROTECTED AREA
MPPI MAJOR PERCEIVED PROBLEMS AND
ISSUES
MUM MEANINGFUL, USEFUL, MEASUREABLE
NAP NATIONAL ACTION PLAN
NGO NON-GOVERNMENT ORGANIZATION
NOAA NATIONAL OCEANIC AND ATMOSPHERIC
ADMINISTRATION
NRM NATURAL RESOURCE MANAGEMENT
OAS ORGANIZATION OF AMERICAN STATES
OECD ORGANISATION FOR ECONOMIC CO-
OPERATION AND DEVELOPMENT
PEMSEA PARTNERSHIPS IN ENVIRONMENTAL
MANAGEMENT FOR THE SEAS OF EAST
ASIA
RA RISK ASSESSMENT
RM RISK MANAGEMENT
SAP STRATEGIC ACTION PLAN
TDA TRANSBOUNDARY DIAGNOSTIC
ANALYSIS
TOT TRAINING OF TRAINERS
TWAP TRANSBOUNDARY WATERS
ASSESSMENT PROGRAMME
WIOLAB WESTERN INDIAN OCEAN LAND-BASED
ACTIVITIES

iv
Analysis Report

Land-based Pollution Sources
1
Table of Contents
1. Critical emerging science issues ............................................................................ 2
1.1 What are the critical science challenges “on the horizon” specifi c to each ecosystem type? ..............................................................6
1.2 What is the signifi cance of regional and global-scale drivers, in particular climate change, in the genesis of transboundary
problems? .....................................................................................................................................................................................7
1.3 Describe how understanding and managing multiple causality in a transboundary water context is undertaken? ...............................8
1.4 How are variable spatial and temporal scales in IW projects accounted for? .....................................................................................8
1.5 What approaches were used to understand/assess the coupling of social and ecological systems? ..................................................8
1.6 What scientifi c knowledge is available and/or used to evaluate trade-offs between the response options developed by IW projects? .9
2. Development and use of indicators to support IW projects ................................. 10
2.1 How did the projects help build and implement sound indicators? ................................................................................................. 11
2.2 How can we identify effective proxy indicators for use in IW Science? ........................................................................................... 19
2.3 How to make better use of appropriate science and best practices for TDA? .................................................................................. 20
3. Application of science for adaptive management ................................................ 24
3.1 Was engagement of both local and wider science communities utilized in IW projects? If not, how can improvements be made? .... 26
3.2 Is scientifi c expertise and local knowledge well applied within the IW focal area? ........................................................................ 28
3.3 Identify lessons learned for linking science and policy implementation, including policy formulation and broader governance issues 28
3.4 Is adaptive management happening? How to better understand and effectively communicate the scientifi c dimensions of
adaptive management to different user groups? ........................................................................................................................... 30
3.5 How to better communicate newly synthesized science knowledge to stakeholders within and external to GEF............................... 31
List of Tables and Figures
Figure 1 Large Marine Ecosystems of Africa and the Mediterranean ................................................................................................7
Figure 2 Large Marine Ecosystems of Latin America ..................................................................................................................... 13
Figure 3 The Orders of Outcome Framework (from Olsen et al., 2006 and featured in Olsen et al 2009 LOICZ R&S Volume
34, GESAMP 1996; Olsen et al., 1997 and Olsen et al., 1999) ....................................................................................... 14
Figure 4 Large Marine Ecosystems of Northern Europe ................................................................................................................. 15
Table 1 Category of Proxy Indicators used in Coastal Management (modifi ed from PEMSEA, 2008) ............................................... 16
Figure 5 Blue-print: 5 Quality criteria and seven components for describing the social dimension of managing social-
ecological change – theory and testing [In blue – practical indicators for the social dimension of coastal
management in the North Brazilian mangrove region of Bragança, Pará] ....................................................................... 19
Figure 6 Flow Diagram for the TDA Process ................................................................................................................................. 23
Figure 7 Applying the continual evaluation process of adaptive management leads to cost-effective, successful restoration
projects2 ...................................................................................................................................................................... 24
Figure 8 A schematic diagram of an adaptive management planning cycle (adapted from Manley et al., 2000) ............................... 25
Figure 9 Large Marine Ecosystems of South East Asia ................................................................................................................. 27
Figure 10 Depiction of ideal fl ow across boundaries in the context of cooperative research (modifi ed from Johnson, 2007) ............. 29
Appendices listing
The appendices for this report are available electronically from the IW:Science, UNU-INWEH, IW:LEARN and GEF websites
Appendix A Core Question answers prepared by Working Group members

2
CHAPTER ONE
Critical emerging
science issues1A. What are the critical science challenges “on
the horizon” specifi c to each ecosystem type?
B. What is the signifi cance of regional/global scale drivers in particular climate change in the genesis of transboundary problems?
C. Describe how understanding and managing multiple causality in transboundary water con-text is undertaken.
D. How have variable spatial and temporal scales in IW projects accounted for?
E. What approaches were used to understand/assess the coupling of socio ecological systems?
F. What scientifi c knowledge is available and/or used to evaluate tradeoffs between the response options developed by IW Projects?
To arrive at a comprehensive analysis of critical emerg-ing science issues, the Land-based Pollution Sources Working Group decided, as a fi rst step, to consider the discussion on emerging challenges in the earth system and global change context, organized by the International Council of Sciences (ICSU), and based on an open forum consultation that invited some 10,000 comments from global interdisciplinary scientifi c experts and culminated in a set of fi ve major challenges and related sub questions of major societal concern. These challenges and questions are considered as likely to populate priority agendas of the global science commu-nity in the coming decades. During the group discussion around the analysis of the synopsis, it was realized that
most of these questions and challenges are directly rel-evant to the IW projects examined in this project.
The ICSU challenges and related core scientifi c questions are outlined in detail by Reid et al., (2010)1, and summa-rized below:
1. Forecasting: Improve the usefulness of forecasts of future environmental conditions and their conse-quences for people.
Priority Research Questions:
• What “signifi cant environmental changes” are likely to result from human actions? How would those changes affect “human well-being”, and how are people likely to respond?
• What threats do “global environmental changes”pose for “vulnerable communities” and groups and what responses could be most effective in reducing harm to those communities?
2. Observing: Develop, enhance and integrate the observation systems needed to manage global and regional environmental change.
Priority Research Questions:
• What do we need to observe in coupled social-envi-ronmental systems, and at what scales, in order to respond to, adapt to, and infl uence global change?
• What are the characteristics of an adequate system for observing and communicating this information?
1 W. V. Reid, D. Chen, L. Goldfarb, H. Hackmann, Y. T. Lee, K.
Mokhele, E. Ostrom, K. Raivio, J. Rockström, H. J. Schelln-
huber and A. Whyte (2010): Earth System Science for Global
Sustainability: Grand Challenges; Science, Vol 330, 916-917

3
3. Confi ning: Determine how to anticipate, avoid and manage disruptive global environmental change.
Priority Research Questions:
• Which aspects of the coupled social-environmental system pose signifi cant risks of positive feedback with harmful consequences?
• How can we identify, analyze and track our prox-imity to thresholds and discontinuities in coupled social-environmental systems? When can thresholds not be determined?
• What strategies for avoidance, adaptation and transformation are effective for coping with abrupt changes, including massive cascading environmental shocks?
• How can improved scientifi c knowledge of the risks of global change and options for response most effectively catalyse and support appropriate actions by citizens and decision-makers?
4. Responding: Determine what institutional, eco-nomic and behavioural changes can enable effective steps toward global sustainability.
Priority Research Questions:
• What institutions and organizational structures are effective in balancing the trade-offs inherent in social-environmental systems at and across local, regional and global scales and how can they be achieved?
• What changes in economic systems would contrib-ute most to improving global sustainability and how could they be achieved?
• What changes in behaviour or lifestyle, if adopted by multiple societies, would contribute most to improving global sustainability and how could they be achieved?
• How can institutional arrangements prioritize and mobilize resources to alleviate poverty, address social injustice and meet development needs under rapidly changing and diverse local environmen-tal conditions and growing pressures on the global environment?
• How can the need to curb global environmental change be integrated with the demands of other inter-connected global policy challenges, particularly those related to poverty, confl ict, justice and human security?
• How can effective, legitimate, accountable and just collective environmental solutions be mobilized at multiple scales? What is needed to catalyze the adoption of appropriate institutional, economic, or behavioural changes?
5. Innovating: Encourage innovation (and mechanisms for evaluation) in technological, policy, and social responses to achieve global sustainability.
Priority Research Questions:
1. What incentives are needed to strengthen systems for technology, policy and institutional innovation to respond to global environmental change and what good models exist?
2. How can pressing needs for innovation and evalua-tion be met in the following key sectors?
a. How can global energy security be provided entirely by sources that are renewable and that have neutral impacts on other aspects of global sustainability, and in what time frame?
b. How can competing demands for scarce land and water be met over the next half century while dramatically reducing land-use green-house gas emissions, protecting biodiversity,

4
Analysis Report
and maintaining or enhancing other ecosys-tem services?
c. How can ecosystem services meet the needs for improving the lives of the world’s poor-est peoples and those of developing regions (such as safe drinking water and waste dis-posal, food security and increased energy use) within a framework of global sustainability?
d. What changes in communication patterns are needed to increase feedback and learning processes to increase the capacity of citizens and offi cials, as well as to provide rapid and effective feedback to scientists regarding the applicability and reliability of broad fi ndings and theoretical insights to what is observed in the fi eld?
e. What are the potentials and risks of geo-engineering strategies to address climate change, and what local or global institutional arrangements would be needed to oversee them, if implemented?
These challenges and questions formulated by the global science community can assist in mapping the this analy-sis of GEF IW-Science projects in a globally-shared and forward-looking context. Two major adjustments may need to be applied to the traditional organization of GEF IW projects:
1. Overcoming the traditional divide of water bodies: i.e., the rather isolated consideration of rivers, aqui-fers, lakes, large marine ecosystems, and the open ocean;
2. Applying a socio-ecological system scale in the design and scientifi c analysis (including TDA and causal chain analysis) of future GEF projects to arrive at an issue-driven defi nition of system bound-aries, including spatial, temporal and institutional scale of concern. These scales need to be properly defi ned and a standardized framework for assessing would be helpful.
As an example for the points made above, we elabo-rate here on deltas as a refl ection of complex scale overlays and multiple drivers. Among the emerging science issues in coastal zones recently identifi ed by the research funding community as a priority in the next decade, deltas are among the most vulnerable, which may justify particular attention in an IW context.
While the 2007 IPCC report highlighted the high risk of many river deltas being severely affected by sea level rise, recent studies indicate a whole set of human factors adding to this risk by causing deltas to sink signifi cantly. The sinking of deltas is exacerbated by upstream trapping of sediments by reservoirs and dams, man-made channels and levees that whisk sediment into the oceans beyond coastal fl oodplains. Coastal urbanization further drives the accelerated compacting of fl oodplain sediment, due to extraction of groundwater and natural gas.
Researchers in the Community Surface Dynam-ics Modeling System (CSDMS) project in Boulder, Colorado conclude that 24 out of the world’s 33 major deltas are sinking and that 85 per cent expe-rienced severe fl ooding in recent years, resulting in a temporary submergence of roughly 250,000 km2 of land. About 500 million people in the world live on deltas. Considering that drivers of delta-coast vulnerability, and thus community vulnerability, can Eutrophication in Vembanad Lake / IOM, Anna University

Land-based Pollution Sources
5
be located along the whole water continuum from source to se, and include extreme events such as storm surges (some 10 million people affected every year, a holistic approach is needed.
Assisting coastal communities and people in the contributing catchment to cope with and adapt to future delta change will require information about ecosystem goods and services of deltas in a social ecological system context. It will be a challenge for scientists to compile the necessary information and process it to support decision making across bound-aries and on the appropriate spatial and temporal scales. Storm links and challenges may arise here also for a future transboundary waters assessment, as currently developed in GEF project TWAP.
Obviously, the scientifi c challenges addressed here also refer to generally low lying and/or highly dynamic coastal zones subject to rapid climate and anthropogenic pressure as well as extreme events: for example, islands, polar coastal zones such as the Arctic, etc.
When discussing critical emerging science issues in the GEF IW context, a few aspects need to be well under-stood. Thus, while there is substantial innovation needed to arrive at a solid system-based description of issues and scales, it is fair to say that “rocket”-science is not needed to inform IW projects. This is because they are fi rst and foremost intended to secure a stronger political buy-in and institutional reforms needed for sustainable management. Most of the projects reviewed here relate to the “Response” part of a classical Driver, Pressure, State, Impact, Response (DPSIR) framework. They aim to provide the knowledge base and learning platform to enable better governance schemes for improved man-agement of socio-ecological systems, and thus human welfare. From a perspective of the framework of the so called “orders of outcome” (see section 2) this is aimed at improving the enabling conditions for sustainable management of regional seas and their adjacent coastal zones. Based on better baseline conditions, the target is improved governance for increasing system resilience to cope with change, which is often driven by far distant processes. Ultimately, projects aim to infl uence societal behaviour: i.e., the way humans interact with nature and the resulting feedbacks.
In many cases, drivers and pressures are known, and state changes, such as changing material fl uxes reaching the coasts through increasingly managed and engineered rivers, or effects generated by the pressure of rapidly growing urbanization, sea level rise, and increasing waste water loads, are reasonably well comprehended, but the step from knowledge to action is frequently the critical issue.
In conclusion, the future scientifi c challenges that GEF projects are likely to face are largely to be found in the context of institutionalizing applied sciences and in building constituency to promote changes in behaviour. This includes appreciating what knowledge is needed and where: i.e., in which group of actors it should sit. It requires a clear understanding of protocols for monitor-ing of the key parameters in a social ecological system scale; it needs transparent and peer-reviewed strate-gies for data assimilation and storage, including clearly defi ned responsibilities; and it requires a widely accepted understanding on how to deal with uncertainty and risk. In the future, responses to global change, be they on local, regional or global scales, and the decisions that must be made, should be scientifi cally informed whether or not knowledge is incomplete and forecasts uncertain.
Finally, a further three, rather complex conditions will be pivotal to the success of future projects:
A. A conceptualized learning strategy, addressing the information needs of different actors: i.e., concepts and language are commonly agreed to enable broad cross-sectoral ownership. This strategy should build on well-documented science;
B. Inclusion of scientifi cally sound and continuously evolving assessment of project accomplishments toward improved sustainable management. A prom-ising concept here may be application of the so called “orders of outcome”, as developed from the management cycle concept promoted by GESAMP in 1996 and further developed by the scientifi c com-munity (section 2 for detail);
C. Evaluation of the potential of the system of con-cern to cope with future global environmental including climate change. For this, the assessment of governance baselines and frameworks may be of assistance.

6
Analysis Report
With all this in mind, mapping of the GEF analysis onto the future challenges identifi ed by the earth system sci-ence community can be represented as follows:
GEF IW
ANALYSIS QUESTIONS
ICSU EARTH SYSTEM
SCIENCE GRAND
CHALLENGES
(CHALLENGE AND
KEY ISSUES TO BE
ADDRESSED)
What are the critical science
challenges “on the horizon” specifi c
to each ecosystem type?
All fi ve challenges
What is the [current? future?]
signifi cance of regional and
global-scale drivers, in particular
climate change, in the genesis
of transboundary problems?
[Distinguish between temporal
scales and consider individual
characteristics of countries and
regions]
1 Forecasting
2 Observing
Describe how understanding and
managing multiple causality in a
transboundary water context is
undertaken?
3 Confi ning
4 Responding
5 Innovating
How are variable spatial and
temporal scales in IW projects
accounted for?
3 Confi ning
4 Responding
What approaches were used to
understand/assess the coupling of
social and ecological systems?
3 Confi ning
4 Responding
What scientifi c knowledge is
available and/or used to evaluate
trade-offs between the response
options developed by IW projects?
*New Question
4 Responding
5 Innovating
When it comes to analysis of the projects, particularly as refl ected in sections 2 and 3, discussion of indica-tors focuses on how best to gauge the interplay between environmental change and socio-political response. What are the best proxy indicators for what is ultimately needed to accomplish the projects goals: i.e., to enable and maintain sustainable development in international waters? It becomes evident that selection of the right indicators is a scientifi c challenge and includes concep-
tualizing social dimensions in complex systems. The traditional ecosystem-centred observation, with result-ing monitoring strategies, will need to be complemented by thorough socio-economic observations. Incorporating valuations of changing ecosystem goods and services under different response options may encourage devel-opment of future scenarios with the potential to (a) deal with uncertainty and (b) assist in improving decision making. In some regions of the world, application of these concepts is now underway.
Reviewers discussed use of a standardized framework to assist in measuring project success, and we assume that in this context the debate around the best possible indi-cators and resulting project monitoring will enter a new round. Improvements in knowledge sharing across proj-ects, and twinning between projects to share experiences, are among the most promising efforts in the IW project portfolio. Finally, a stronger collaboration with global and regional scientifi c networks may assist in support-ing projects by providing access to up-to-date science knowledge.
1.1 What are the critical science challenges “on the horizon” specifi c to each ecosystem type?
Rather than focusing on certain ecosystem types, the sci-ence challenges seen by the group are located predomi-nantly in the fi eld of properly informing the application of scientifi c knowledge. In conceptualizing the applica-tion of science indication must be developed as to where, how and by whom the scientifi c knowledge shall be applied. Obviously there are implications for application of indicators and observation to be employed.
In order to lead this into the concept of informed adap-tive management the projects are challenged to provide a platform for identifying and dealing with uncertainty. Information across the actor groups, including policy and management, is expected to inform decision making but be subject to continued revision that enables adapta-tion to new fi ndings and conditions.
The changes in “system resilience” i.e. the human - nature interaction context as an outcome of the project implementation need to be thoroughly assessed and peer reviewed for which a gauging meter such as order of outcome need to be employed.

Land-based Pollution Sources
7
Future scenarios based on transparent and peer reviewed assumptions of societal preference may assist in informing social choice in the environment of different tradeoffs.
One fi nal general recommendation is to be explicit in the terminology, i.e. the defi nitions of gover-nance, adaptive management, social ecological sys-tems to name a few.
In conclusion an overarching scientifi c challenge in the IW as well as other transboundary contexts will be to elucidate the still very visible barriers between scientifi c knowledge on the one hand and the steps towards application and better informed decision making on the other. Exploring the issues of ham-pered response and overcoming hesitation in policy implementation and enforcement are key scientifi c questions of the future (they are actually refl ected in more than just one of the Erath system science challenges).
1.2 What is the signifi cance of regional and global-scale drivers, in particular climate change, in the genesis of transboundary problems?
Regional drivers play a signifi cant role in socio-eco-logical system functioning and change, as do global change drivers. The group emphasized that climate change is a central element but that issues such as pollution, subsidence/erosion, and anthropogenic forcing on catchment scales are strong pressures.
Socio-political changes, such as the rapid oscilla-tions in the global market, will very much dictate the extent to which sustainability concepts will affect future developments in resource exploration and exploitation. Larger scale, even global-scale, drivers can strongly infl uence regional and local development, leaving little room for communities to adapt. For example,
• Population growth – regional scale [PEMSEA];• Urbanization – local/regional [PEMSEA];• Economic development - global/regional [PEMSEA];• Urban wastes including sewage - local/regional
[PEMSEA];
• Material fl uxes [natural plus human] urban run-off, agricultural runoff, natural fl uxes and sediment retention by dams - across all scales (WIOLAB, DeltaAmericas, Role of the Coastal Ocean in the Disturbed and Undisturbed Nutrient and Carbon Cycles (by LOICZ), Sao Francisco);
• Tourism [African tourism] – local/regional;
Figure 1 Large Marine Ecosystems of Africa and the Mediterranean
Used with permission from the U.S. NOAA-LME Program Offi ce 2011, http://www.lme.noaa.gov

8
Analysis Report
• Rapid socio-political change triggering popula-tion movements, new institutions, etc. – regional [Danube GEF];
• Trading/sea transportation - all scales but drivers are global [ballast water, etc.] (ship waste project)
• Energy transport, storage, uses, etc. – global/regional; and
• Fisheries [algal blooms] including aquaculture – regional/local.
As mentioned above, the exploitation of energy resources, particularly in Arctic environments, the man-agement of river systems in times of increasing water scarcity, and the development of global trade infrastruc-ture and coastal urbanization may serve as examples. The concept of integrated management, whether it is coastal and/or including catchments or land-use and cover change, can thus be rather easily jeopardized, over-run by larger political and economic interests outside the system of concern.
Overall, it can be said that the overarching pressure on coastal systems is land-based pollution: for example, increasing land conversion for crop based bio-fuel pro-duction has undoubtedly had a strong signifi cance for nutrient fl uxes through international waters.
1.3 Describe how understanding and managing multiple causality in a transboundary water context is undertaken?
Multiple causality is recognized in many of the projects and managing it entails accepting certain tradeoffs and dealing with a level of uncertainty. This issue is, in gen-eral, considered to be an area where scientifi c input into IW projects may have a signifi cant contribution to make.
On the project level, consideration of multiple causality is strongly evident, including multiple strategic priorities culminating in a variety of strategic plans (PEMSEA). Transboundary Diagnostic Analysis and legal instru-ments (e.g., WIOLAB) feature multiple causalities on a regional scale. However, there is rather limited consider-ation of the social side, and only minor considerations of governance aspects. As a means to improve knowledge transfer, including cross-system learning, the concept of twinning systems (e.g., catchments) across continental scale has been applied and promoted in projects in Latin
America (DeltaAmericas) and Asia. As mentioned earlier, this is considered a valuable approach also in terms of enabling international learning about multiple causali-ties. Comparable concepts are promoted by research funders such as the European Commission.
1.4 How are variable spatial and temporal scales in IW projects accounted for?
There is an evident tendency within several of the IW projects to address issues along the water continuum. Notable examples can be found in PEMSEA, and indi-vidual cases are addressed in DeltaAmericas and those projects dealing with Caribbean systems. Particularly in Asia and partly in South America, institutions have been designed or reinforced to address variable spatial scales: for example, regional monitoring programmes, regional assessments, etc. The ecosystem approach is promoted as a vehicle for ensuring variable spatial scales are taken into account, for management purposes, and for encour-aging establishment of the necessary institutions. Spatial scales range from local to regional n certain projects.
In terms of temporal scales the PEMSEA “follow up” project and the underlying fund are aimed at transferring into a long-term effort, and fostering sustainable devel-opment on regional sea scale. In terms of environmental quality targets, this includes securing national commit-ment and setting up programmes designed to reduce nutrient fl uxes by 10-50 per cent by 2010 and increase ICM managed areas by 5-10 per cent until 2015. This is a target built on the concept of underlying variable tem-poral and spatial scales. Small-scale pilot projects dem-onstrating successful implementation of approaches may be used and scaled up in the future. Capitalizing on these pilot initiatives may generate added value far beyond the anticipated project lifetime.
1.5 What approaches were used to understand/assess the coupling of social and ecological systems?
The concept of a coupled social-ecological system approach is not explicitly used in the projects. However, features of this approach are visible in various projects examined. While the concept and its implications, partic-ularly for indicators, are addressed more thoroughly in the sections to follow, we provide some examples here:
Land-based Pollution Sources
9
• Coupling of values and ecosystem goods and ser-vices with observed and anticipated environmental system change (PEMSEA);
• Arctic project – social aspect, indigenous peoples. WIOLAB also had a social aspect;
• Some of projects have problem statements that refer to a range of human behaviors and their impact on the environment;
• Proxy indicators – runoff and demographics – pro-vide a link between demographic signals and coastal functioning;
• WIOLAB demonstration projects were considered a good example of local and cultural aspects.
1.6 What scientifi c knowledge is available and/or used to evaluate trade-offs between the response options developed by IW projects?
The whole area of tradeoffs in management of increas-ing pressures and response options in the coastal systems context is rather new to the scientifi c community. One result, refl ecting evaluation of different options and likely changes in the socio-ecological system, can be seen in projects funded by the EU (e.g. KnowSeas and ELME). This, together with other observations made in the IW portfolio, allows the following summary of key aspects:
• Signifi cant social-ecological-based scenarios are required to evaluate trade-offs (new concepts of integrated modelling and conceptualizing of social dimensions are critical);
• There are scientifi c tools to explore development and change of value systems that may infl uence social choice. Those should be addressed with high priority;
• Projects did not address climate change to any great extent and this needs to be changed, particularly as regards regional dimensions of hazards and risk;
• A body of tentative knowledge about climate change and long-term trends is available but has not been largely used.
Priority tools to be strongly emphasized include:
• Risk assessment; e.g., what is the probability of a storm surge/ storm surges over the next 12 months;
• What makes a coastal community resilient (resil-ience and risk research);
• Disaster management (community preparedness, humanities and the value of informal networks, pre-diction and forecasting.
These issues strongly overlap with the ICSU challenges, and also refl ect the emphasis on regional scale currently discussed by major global research funders.
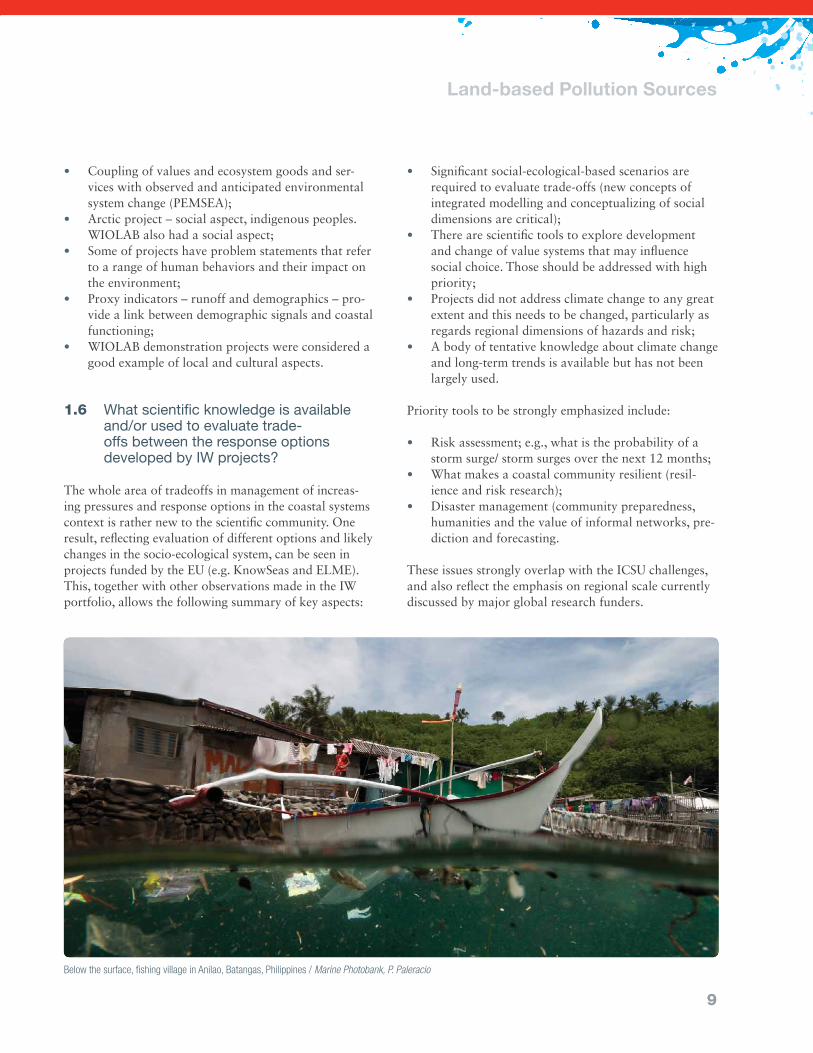
Below the surface, fi shing village in Anilao, Batangas, Philippines / Marine Photobank, P. Paleracio

10
2 CHAPTER TWO
Development and
use of indicators to
support IW projects
An indicator is defi ned by Taal et al. (1998)2 as:
"a parameter or a value derived from parameters, which points to, provides information about or describes the state of a phenomenon/ environment/ area."
Indicators may also be described as qualitative or quan-titative variables used to assess the type and rate of change observed in the environment. Burbridge (1997)3, refers more specifi cally to management in his defi nition of indicators:
"as features which characterize well defi ned and designed management programmes."
Guided by the OECD (1994) framework, three ICM indicators have been defi ned:
1. Pressure Indicators: describing stresses infl icted by human activities and imposed on the coastal zone environment;
2. State Indicators: describing the condition of the environment - be it chemical, geo-physical or bio-logical. Natural resources are expressed in both a quantitative and qualitative manner;
3. Response Indicators: recording the choice of a pol-icy as a response to an environmental problem.
2 Burbridge, P.R., 1997. A generic framework for measuring
success in integrated coastal management. Ocean & Coastal
Management, 37(2), 175-189.
3 Taal, M.D., de Koning, P., Werners, S., Zanting, H.A., van
Buuren, J.T. and van der Valk, F., 1998. Framework on integrat-
ing models and indicators for European coastal zone man-
agement. Report for European Topic Centre for Consultation.
Resource Analysis, The Netherlands.
The “Pressure-State-Impact-Response” (PSIR) Framework (Turner et al., 1998)4 identifi es four addi-tional parameters:
1. Pressure Indicators;2. State Indicators;3. Impact Indicators: assessing the effects upon the
health of the human population and ecosystems; and
4. Response Indicators.
Duda, (2002)5 developed a provisional list of indica-tors, intended for measuring the success or otherwise of Environmental Management Plans (EMPs) and these were assessed in terms of several criteria:
• Meaningful: is the subject and theme of the indica-tor meaningful to the evaluation of EMP success? May it be deemed as important and relevant to the various processes of an EMP?
• Useful: will this indicator be useful and realistic as a tool for actively measuring specifi c EMP successes?
• Measurable: in practice, how easily would this indi-cator measure quantitatively and/or qualitatively?
A further key test is whether the benefi ts revealed by such indicators are attributable to environmental management plan initiatives. The value of these potential indicators against the MUM (Meaningful, Useful, Measureable) criteria was assessed qualitatively and/or quantitatively by seeking input by EMP Project Offi cers and members
4 OECD (Organisation for Economic Cooperation and Develop-
ment), 1994. Environmental Indicators: OECD Core Set. OECD,
Paris.
5 Turner, R.K., Lorenzoni, I., Beaumont, N., Bateman, I.J., Lang-
ford, I.H. and McDonald, A.L., 1998. Coastal Management for
Sustainable Development: analysing environmental and socio-
economic changes on the UK coast. The Geographical Journal
164(3), 269-281

11
of relevant authorities. Thus, indicators are quantitative/ qualitative statements or measured/ observed param-eters that can be used to describe existing situations and to measure changes or trends over time (Duda, 2002)6. Indicators are often used as tools for monitoring and evaluation (M&E) plans to refl ect changes in the state of coastal and marine environments, trends in socioeco-nomic pressures and conditions in coastal areas, and corresponding links among anthropogenic activities and ecological health. M&E plans are used for tracking the projects and for observing the changes over the lifetime of a project. Funders normally require indicators to assess the success of projects. Indicators are meaningless, how-ever, without an established baseline from which change can be evaluated. It is with reference to these frame-works, ICM experiences, and the subsequent discussion on indicators, that indicators of the success of the proj-ects are further considered and discussed.
2.1 How did the projects help build and implement sound indicators?
With one exception, most of the indicators focused on project outputs (e.g., number of plans produced, train-ings held, etc.) and environmental outcomes (e.g., sus-pended solids, fecal coliform, per unit water etc.). There is a whole suite of indicators used in coastal manage-ment and Table 1 below provides a generic listing of core indicators under three major headings:
A. Governance, B. Sustainable development aspects, and C. Environmental issues.
6 Duda, A. 2002. Monitoring and Evaluation Indicators for GEF
International Waters Projects. Monitoring and Evaluation Working
Paper 10. Global Environment Facility. Washington, DC, USA.
The projects do not provide suffi cient details, however, on protocols governing data collection, analysis, storage, access and dissemination of the accrued dataset dur-ing the course of the project. Indicators often focus on project tracking, but may not refl ect the sophistication of the actual environmental monitoring occurring. These considerations lead into a core conceptual aspect of the use of indicators and the target audience. The ratio-nale behind the development of indicators in projects includes:
• Who exactly are the “target audiences”?• Who are the data users?• To whom should the data be made available/ acces-
sible, and • At what scale/ level of detailing?
In designing an indicator system, identifying target audi-ences and their information needs is a critical task. Some questions include:
• Who will use the information? • Will it be used for routine monitoring of manage-
ment activities, assessing changes in environmental conditions or both?
• Is the primary intention evaluative so that manag-ers can identify problems and adjust management activities?
• Is learning from experience an intention for gather-ing data? If so, what sorts of indicators need to be added to facilitate learning and adaptation?
• A more or less neglected question in the context of all projects reviewed is the one addressing the change of behaviour: i.e., do we observe adaptive management and changes in how people interact with nature. Indicators needed in this realm are to be based on thorough defi nition of a baseline of sys-

12
Analysis Report
tem characteristics and governance (see Olsen et al 2009, LOICZ R&S volume 34)7.
• As an exception, one may quote the indicators developed and applied in PEMSEA, which do, in fact, evaluate institutional dimensions and chang-ing behaviour. Obviously, changes in value systems and preferences in social choice have a strong infl u-ence here. In the following discussion, this aspect is described in more detail.
The PEMSEA (Partnerships in Environmental Management for the Seas of East Asia) has developed “Project Performance Evaluation Indicators” in order to evaluate the success of the project from various perspec-tives. In PEMSEA practices, evaluation indicators are summarized in fi ve major categories or levels8,9
• Status indicators – environmental or ecological, socio-economic and management features of the area where ICM is practiced, as the information basis for prioritizing environmental and resource problems and management issues to be addressed by the ICM efforts;
• Stress or pressure indicators – main forces infl uenc-ing the state of the environment or ecosystems, par-ticularly those forces of a transboundary nature;
• Process indicators – management interventions undertaken during the ICM process;
• Response indicators – outputs produced as a result of management interventions;
• Sustainability indicator – essential elements to keep ICM going in the long run;
• Impact indicators – environmental, economic and social outcomes of ICM practices, usually for mea-suring the physical, biological, or socio-economic changes resulting from ICM programme imple-mentation against the baseline conditions before implementation.
7 http://www.loicz.org/imperia/md/content/loicz/print/rsre-
ports/34_the_analysis_of_governance_responses_ to_ecosys-
tem_change.pdf).
8 Chua, T.E., H. Yu and G. Chen. 1998. From sectoral to inte-
grated coastal management: A case in Xiamen, China. Ocean
and Coastal Management, 37(2): 233-251.
9 Chua, T.E., J. Lee, H. Yu and S.A. Ross. 2003. Measuring the
performance of integrated coastal management programs.
Paper presented at the East Asian Congress 2003, Putrajaya,
Malaysia, 8-12 December 2003.
The selection of specifi c indicators will depend, in large part, on target audiences, usually project manag-ers and funders. However, as part of the policy cycle, which builds on the management cycle as described by GESAMP (1996), Olsen et al., 1997 and 1999, political decision makers may also be targeted. All these target groups, including project managers and funders, require data to assess outcomes and to develop lessons from project implementation.
Conceptually, this policy cycle is a framework for exam-ining the processes of ecosystem governance and for identifying repeated efforts to address critical issues (including actors involved). It can identify the presence or absence of learning, as a society works to achieve its goals over time. Past experiences in other comparably targeted projects demonstrate repeatedly, however, that even a sound processes, with appropriate participation, a technically competent program staff and sustained governmental support, may not necessarily deliver the desired outcomes. The Orders of Outcomes Framework (Olsen 200310; UNEP/GPA 200611; National Research Council 200812) is designed to complement the policy cycle by focusing on the sequence of outcomes that must be achieved when working to realize desired societal and environmental conditions. This framework is featured in the fi gure below and one can see where indicators such as the ones mentioned above may feed in meaningfully.
Without these interim evaluations, the second order of outcomes (i.e. the change of behaviour in how humans interact with nature) diminishes. Strategic Action Plans (SAPs) usually include indicators useful for the imple-menting institutions. However, most SAPs do not have economic/social indicators incorporated [in the LBP projects]. So, what is missing?
• How are data stored and disseminated?• Organization of databases by target audience — a
kind of a “click box” for each target audience.
10 Olsen, S.B. (2003) Frameworks and indicators for assessing
progress in integrated coastal management initiatives. Ocean
& Coastal Management 46 (3-4): 347-361.
11 UNEP/GPA (2006) Ecosystem-Based Management: Markers
for Assessing Progress. UNEP/ GPA, The Hague.
12 National Research Council. (2008). Increasing Capacity for
Stewardship of Oceans and Coasts. Washington D.C.: The
National Academies Press.

Land-based Pollution Sources
13
Figure 2 Large Marine Ecosystems of Latin America
Used with permission from the U.S. NOAA-LME Program Offi ce 2011, http://www.lme.noaa.gov

14
Analysis Report
• Emphasis on who the users are and how to make the indicators available.
Thus, indicators need to be useful tools for the imple-menting institutions, and they need to inform the assess-ment of system and governance baselines and change,
particularly in societal response. This then leads to gauging success or need for improvement of the proj-ects, which is an added value to a project, the investors and society as a whole. Obviously, this cannot be done without sound and solid science underpinnings across disciplines.
Figure 3 The Orders of Outcome Framework (from Olsen et al., 200613 and featured in Olsen et al 2009
LOICZ R&S Volume 34, GESAMP 1996; Olsen et al., 1997 and Olsen et al., 1999)14 15 16 17
13 Olsen, S.B., Sutinen, J.G., Juda, L., Hennessey, T.M. & Grigalunas, T.A. (2006): A Handbook on Governance and Socioeconomics of
Large Marine Ecosystems. Coastal Resources Center, University of Rhode Island, Narragansett.
14 Olsen, S.B.; Page, G.G. & Ochoa, E. (2009): The Analysis of Governance Responses to Ecosystem Change: A Handbook for Assembling
a Baseline. LOICZ Reports & Studies No. 34. GKSS Research Center, Geesthacht, 87 pages.
15 GESAMP (1996) The Contributions of Science to Integrated Coastal Management. Reports and studies No. 61. Food and Agriculture
Organization of the United Nations, Rome.
16 Olsen, S.B., Tobey, J. & Kerr, M. (1997) A common framework for learning from ICM experience. Ocean and Coastal Management (37):
155-174.
17 Olsen, S.B., Lowry, K. & Tobey, J. (1999) A Manual for Assessing Progress in Coastal Management. Coastal Resources Center, Univer-
sity of Rhode Island, Narragansett.
Global
Regional
National
Local
Intermediate Outcome
Time
Scale
End Outcomes
First Order:
ENABLING CONDITIONS
Governmental commitment:
authority, funding;
Institution capacity to
implement;
Unambiguous goals;
Second Order:
CHANGED BEHAVIOR
Charges in behavior of
institutions and stakeholder
groups;
Changes in behaviors directly
affecting resources of concern;
Changes in investment;
Third Order:
ATTAINMENT OF PROGRAM GOALS
Some targets for social and/or
environmental qualities
maintained, restored or
improved.
Fourth Order:
SUSTAINABLE ECOSYSTEM CONDITIONS & USERS
A desirable and dynamic
balance between social and
environmental conditions is
sustained.

Land-based Pollution Sources
15
Figure 4 Large Marine Ecosystems of Northern Europe
Used with permission from the U.S. NOAA-LME Program Offi ce 2011, http://www.lme.noaa.gov

16
Analysis Report
Table 1 Category of Proxy Indicators used in Coastal Management (modifi ed from PEMSEA, 200818)
CATEGORY RESPONSE$ PROXY INDICATOR
Governance
Policy, strategies
and plans
Coastal profi le/ Environmental risk
assessment
Per cent coastline for which profi le has been done
Coastal strategy and action plans Area under ICZM, coastal plans including MPAs
Local government development plan
including coastal and marine areas
Use per cent of local plans (ICZM) that are graded/ rated, proportion of
local government undertaking local governance
Institutional
arrangements
Coordinating mechanism Number of explicit MoA or informal mechanisms for coordinating between
provincial and local government, percent of governance level (e.g.,
Philippines: number of local governments THAT have offi ce of forestry
management)
Participation of stakeholders in the
coordinating mechanism
Number of public debates, regular discourse/ consultations; whether there
are legal procedures mandated for public hearings, number of litigations
Legislation ICM/pollution enabling legislation Number of violations and court cases for non-compliance
Administration and monitoring of
compliance to legislation
Environmental cases fi led/resolved
Information and
public awareness
Public education and awareness Right to information Act (RTI), frequency of information availability, number
of events held concerning environment issues, number media stories and
viewership
Stakeholder participation and
mobilization
Involvement of number of NGOs, percent local management budgets
allocated to educational/ outreach activities
Capacity
development
Availability/accessibility Number of courses offered/ trainings/ workshops
Human resource capacity Proportion of staff who have advanced degrees in specialized management
fi elds (mangrove specialists, marine biologists, social scientists etc),
frequency of ToTs offered
Financing
mechanisms
Budget for ICM/ pollution abatement Proportion of budget that comes from designated revenue source, 5-year
plans- municipal budget and does not require special allotment every year
Sustainable fi nancing mechanisms
Sustainable Development Aspects
Natural and
man-made hazard
prevention and
management -
Level of preparedness for disasters Designation of hazard zones, evacuation mechanisms, shelters, number of
coastal protection of structures or other shields (bioshields), soft solution-
inclusion of building codes, designated fl ood plains etc
State Indicators Degree of vulnerability to disasters -
state indicator
Proportion of community in designated hazard areas, in 100 year event,
proportion of key facilities in the hazard zone
Social and economic losses due to
disasters
Number of lives/ property/ livelihood at risk
Areal extent of habitats - System State Number of Ecologically Sensitive Areas
18 Provincial Government of Batangas, Philippines and PEMSEA. 2008. State of the Coasts of Batangas Province. Partnerships in Environ-
mental Management for the Seas of East Asia (PEMSEA), Quezon City, Philippines. 119p.
$ Response here also links to the DPSIR framework

Land-based Pollution Sources
17
CATEGORY RESPONSE$ PROXY INDICATOR
Habitat protection,
restoration and
management
- Response
Indicators
Habitat management plan and
implementation - Response
Proportion of key habitats under the habitat management plan,
Protected areas for coastal habitats
and heritage - Response Indicator
Proportion of eligible areas under management, marine protection acts
Reclamation and conversion Proportion of reclaimed land conversion- e.g. identifi cation of newly
urbanized areas,
Water quality
and quantity
management
Water conservation and management Proportion of reservoirs and existence of quality criteria, standards for
number of days supply- amount of time the community exceeds expected
reserves for water supply, environmental fl ows
Incidences/deaths due to waterborne
diseases
Proportion of population suffering from gastrointestinal problems- e.g.
number of children with diarrhea
Deforestation, fl oods and fl uxes Deforestation index, number of fl ood incidents per year, percent of the
degree of forest cover annually, well used, land use change, sediment load,
water discharge, soil type, vegetation cover
Food security
and livelihood
management
Fishery management plan and
implementation
Specialized fi sheries effort regulation (type of crafts and gears)
Fisheries Production Fishing effort (catch/ yr)
Malnutrition Proportion of population receiving basic calorie requirement per day; fi sh
consumption in kg/ person (UNICEF/ FAO)
Poverty, education and employment Proportion of fi shery resources availability, proportion of literacy
Environmental & Scientifi c
Land-based
Pollution
and waste
management -
Impact Indicators
Management plans Percent sale of fertilizers/ yr, tonnes of fertilizer/ ha/yr
Water quality - impact indicators Water quality index, number per area of sewage treatment under various
categories (primary, secondary, tertiary)
Air quality Air quality index, number of coastal industries
Sanitation and domestic sewerage Number of sewage treatment plants, proportion of community served by
sewage system
Municipal solid waste Proportion of waste ending up in landfi lls/ other technology
Industrial, agricultural and hazardous
wastes
Proportion of industry, agriculture, hazardous wastes in managed waste
stream
Bio-fi lms for nutrient reduction Percent of waste water subject to state of art treatment
Suspended solids Standards
Fecal coliform Number faecal coliform/ 100 ml
Sea-based
Pollution
and waste
management
Ballast water pollution mitigation International convention for ballast water management
Treatment technology and
management options
Response of the industry
Biogeochemical
Functioning
Nutrient loading - State Indicator Number of people per catchment - Scientifi c Proxy indicator
Runoff GDP as a controlling variable of runoff
Trapping effi ciency Sediment load, number of dams in the catchment

18
Analysis Report
Proxy indicators are “an indirect measure of a variable used when the variable of interest is diffi cult to mea-sure” (Weiss, 1998) 19. So development of an action plan is a proxy indicator for government action to indicate progress toward environmental change/improvement. Likewise, we sometimes use number of community meet-ings or per cent of community residents attending plan-ning meetings as proxies for community participation.
Some key aspects highlighting availability of indicators in LBP projects include:
• Any best practices for transboundary issues and/or lessons learned;
• Effective institutions capable of dealing with trans-boundary issues;
• Services of the platform such as IWRN/OAS; • Criteria for defi ning best practices; and• Implementation of sustainable practices (with a few
examples from case studies):
• Enabling mechanisms to transition to long-term sustainable model on a regional scale;
• Extensive logframe focusing on policy frameworks;
• Target defi nition for sustainable coastal man-agement – e.g., scaling up of integrated coastal zone management to 5 per cent of the coastline by 2010;
• Reductions in nutrient loading by 10 – 15 per cent; and
• Habitats identifi ed as protected areas – restora-tion, increased biomass of 5 – 10% by 2015.
In many of the projects, SAPs do not indicate any social or economic dimension or value and, thus, the integra-tion of human and environmental entities must still be conceptualized. Building on regional and local scale application of the socio-ecological system approach, Glaser and Glaeser (accepted, ELSEVIER Treatise on Estuarine and Coastal Science volume 11, to be pub-lished in 2011) mention fi ve quality criteria and seven components for describing the social dimensions of man-aging social-ecological change (Fig. 2).
19 Weiss, C.H. (1998) Evaluation: Methods for Studying Pro-
grams & Policies 2nd edition. Prentice Hall
The fi ve quality criteria include state characteristics:
1. Universal core and local specifi city2. Stakeholder resonance3. Normative transparency4. Comprehensive coverage5. Appropriate scale.
The seven components include:
1. Population and resource use2. Poverty, basic needs and wellbeing3. Equity and justice4. Social and human capital5. Resilience, vulnerability and adaptive capacity6. Participation, management and governance7. Collaborative learning and refl ectivity.
From these seven components, a set of practical and applicable indicators are derived that have proven to be of assistance in addressing the social dimension of socio-ecological system functions and feedbacks. Most of these indicators are proxy indicators. They may be use-ful to feed into an effective Orders of Outcome assess-ment. Obviously, the list provided does not claim to be universally applicable, but rather is developed from prac-tical projects outside the GEF IW realm. However, the approach to conceptualize the “social” may be worth building in into future IW activities, along with the pro-cess of gauging success and failure based on thorough baseline descriptions.
The Mekong Delta supports a high density of human population and gateway
for the effects of upstream and delta human activities to enter the marine
environment / A. Dansie

Land-based Pollution Sources
19
Figure 5 Blue-print: 5 Quality criteria and seven components for describing the social dimension of
managing social-ecological change – theory and testing [In blue – practical indicators for the social
dimension of coastal management in the North Brazilian mangrove region of Bragança, Pará]20
Universal Core and Local Specificity2. Proverty, Basic Needs & Well-Being
4. Social & Human Capital 5. Resilience, Vulnerability & Adaptive Capacity
7. Collaborative Learning & Reflexivity
6. Participation, Management & Governance
3. Equity & Justice1. Population & Resource Use
Stakeholder Resonance
Appropriate Scale Normative Transparency
Comprehensive Coverage
20 Glaser and Glaeser (accepted, ELSEVIER treatise on Estuarine and Coastal Science volume 11, to be published in 2011)
2.2 How can we identify effective proxy indicators for use in IW Science?
Examples of proxy indicators, as defi ned above, in-clude:
• Economic valuation of ecosystems: i.e. ecosystem goods and services; and
• Livelihood status measurements - the proxy indi-cator for household income is number of electric appliances, cars, etc.
In an ideal situation, indicators should be incorporated during the early stages of management implementa-tion, but this has not been the case for existing proj-ects. Although there are 140 ICM efforts in 56 coastal nations adhering to the aspiring goals of ICM (Olsen
et al., 1997)21, harmonized indicators for evaluating the progress and success of ICM projects are still under development, and LOICZ has recently embarked on an initial proof of concept with coastal practitioners in Latin America (see comments on governance baselines above). As an integral part of coastlines, the potential for EMP indicators of success may be greatly infl uenced and guided by the lessons learned from and discussed for ICM. Three challenges have been identifi ed in the pro-cess of developing meaningful indicators22:
21 Olsen, S., Tobey, J. and Kerr, M., 1997. A common framework
for learning from ICM experience. Ocean & Coastal Manage-
ment 37(2), 155-174.
22 Fry, V.E. & Jones, P.J.S. (2000) The development of meaningful
indicators of Estuary Management Partnership success. Re-
port from UCL to English Nature under the Estuaries Initiative
Review.

20
Analysis Report
• A focus must be on process indicators, which will assist in generating a picture to map the project suc-cess against the orders of outcome (here largely the enabling conditions, and to some extent change in behaviour);
• Individual projects are diverse and unique in their locally orientated strategies; and
• Specifi c benefi ts and successes are diffi cult to dem-onstrate and attribute to the project.
Enabling conditions used to evaluate project implementa-tion success include: plans completed, projects initiated, number of MOA signed, and those projects that identify a strategy, as well as a process for implementing a strat-egy, in response to an identifi ed socio-economic or envi-ronmental issue. Some of the indicators for which prox-ies would be required in coastal management include:
• Ecosystem health• Community empowerment (this can be a variable
described by changes in institutional dimensions and the ways society may take infl uence in the major pillars of governance i.e. markets, civil society and policy)
• Reef health [a state]• Ocean acidifi cation • Effective leadership – what is critical here is to be
transparent about the question: at what point is this measured and what is the parameter that is the most meaningful (e.g., community satisfaction) with lead-
ership? This is largely a matter of a proper social assessment concept and the right scales.
• Community commitment.
As an example: indicators for the “State of the Coasts” were determined based on PEMSEA’s Framework for Sustainable Development of Coastal Areas through ICM to indicate current status, management responses, targets and impacts of management actions in each of the governance elements (policy, strategies and plans; institutional arrangements; legislation; information and public awareness; capacity development; and fi nancing mechanisms) and the fi ve sustainable development aspects (natural and man-made hazard prevention and management; habitat protection, restoration and management; water use and supply manage-ment; food security and livelihood management; and pollution reduction and waste management).
2.3 How to make better use of appropriate science and best practices for TDA?
The majority of coastal environmental problems are multi-causal in origin so that exact causes are often diffi cult to specify. While incomplete knowledge leads to uncertainty in the decision-making process, coastal resources managers have tools for managing this uncertainty and for address-ing major causes such as land-based sources of pollution. Science that provides insight into the causal impacts of interventions, and long-term trends in resource conditions, is at the heart of adaptive ocean and coastal management and policy-making. Based on a review of recent literature and interviews with coastal resource managers, fi ve factors were considered 23 critical when integrating scientifi c knowledge into public policy-making. The factors are:
• The limitations of science;• Scientifi c uncertainty;• The importance of communication; (one may add
here: …along agreed and understood concepts and terminology) and
• The role of politics and stakeholders.
23 Benoit, J and Lefebvre, C. (2005) Translating Science into
Management: Challenges and Opportunities for the Coastal
Community. Report Prepared for the Coastal States Organiza-
tion 14pp.
For generations coastal communities in Asia have relied on a wide range of fi sh
for their livelihoods. However, fi sh stocks in South-East Asia are being signifi cantly
depleted due to illegal fi shing and overfi shing / UN Photo, M. Perret
Land-based Pollution Sources
21
Popular perception is that science provides the best way to get at cause-and effect relationships so that we may understand the world well enough not only to make pre-dictions about it, but to control and manipulate it (Steel et al 2004)24. Transferred to transboundary issues, there seems to be two ways of making better use of appropri-ate science and best practices for TDA that should be included at the start of related projects:
1. To look at “best practices” in the use of science and technical analysis; and
2. “Fact-fi nding” in appropriate appreciation of the underlying cause-effect relationships, the right scales to determine meaningful ecosystem and institutional boundaries of the issue under consideration, of the local, regional global and climate drivers involved and the level of uncertainty; fact fi nding should also be transparent in terms of identifying those aspects which may need to be attributed to surprises (e.g., unexpected socio-political and/or economic system changes)
The PEMSEA tools/strategies may be a good model in this context. PEMSEA focused on management through ICM, utilizing several tools and components: sciences; information and communication; civil society; regional collaborative arrangements; environmental investments, capacity building in a broad sense; coastal and marine policy specifi cations; and networking. On the contrary, the Global International Waters Assessment (GIWA) did not always make ideal use of appropriate science frame-works. There is a need to capitalize on existing knowl-edge outside the UN context, with appropriate use of traditional knowledge. Some of the projects that could be used in the context of making better use of appropri-ate science and best practices for TDA are listed below:
• Framework for addressing bio-invasion (in bal-last water) where fi sherfolk are encouraged to look for new species. This involves passive sampling by a larger population to identify marine bio-invasive species.
• Use of indigenous knowledge: for example,• MADAM - The Mangrove Dynamics and
Management Program Project in Brazil. The
24 Steel B, List P, Lach D, Shindler B. 2004. The role of scientists
in the environmental policy process: a case study from the
American west. Environmental Science & Policy 7: 1-13
MADAM program has two main objectives: i) to research the dynamics of mangrove ecosys-tems and ii) to support formulation of manage-ment recommendations based on traditional knowledge.
• SPICE - Science for the Protection of Indonesian Coastal Environment project in the Indonesian Archipelago - provides signifi cant informa-tion on the structure and functioning of coastal ecosystems covering mangroves, coral reefs, coastal pelagic systems and peat swamps, and on their alterations due to human interven-tions. These results have already found their way into management strategies being devel-oped by the regional planning authorities. Phase II of the SPICE project is to focus on natural sciences, complemented by social science. The research cluster “Governance and Management
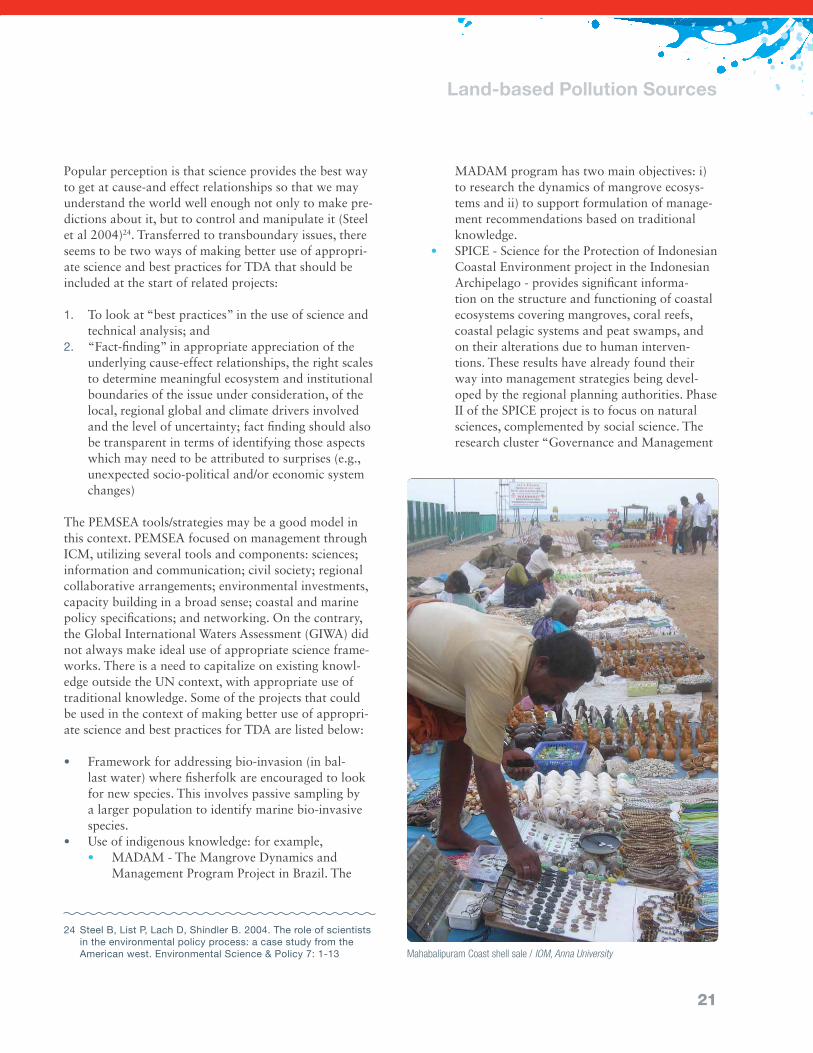
Mahabalipuram Coast shell sale / IOM, Anna University

22
Analysis Report
of Coastal Social-Ecological Systems” has been added to the existing 5 clusters of Phase I.
• CAVIAR - Community Adaptation and Vulnerability in the Arctic Regions - an International Polar Year (IPY 2007-2008) Project. The Arctic is experiencing rapid changes in environmental, societal and eco-nomic conditions. The particular conditions to which communities are sensitive are not well documented, nor have the conditions that might facilitate or constrain the adaptive capacity in the face of interacting climate and socio-eco-nomic changes been substantiated. Insights into the particular vulnerabilities of Arctic commu-nities have not been compared across Arctic countries nor are these studies well connected to policy development. This project is designed to meet research gaps, and outlines a research strategy that develops a theoretical framework for community vulnerability assessment, refi nes a common methodology, establishes procedures for case studies, develops a process to compare and integrate results, and ensures direct applica-tion of research to policy.
• Continued training between science and managers.• LME Projects - how do lifestyles and people’s aspira-
tions help govern regional seas? As an example, the European Lifestyle and Marine Ecosystems project (ELME) refl ects the two key issues above and aims to establish innovative transdisciplinary modelling, assist-ing establishment of meaningful future scenarios for regional seas around Europe (http://www.elme-eu.org/).
• Develop and implement a fl exible template for docu-mentation and a “learning strategy” that includes “peer review”.
• A good TDA/SAP needs guidance:• What are the steps?• Baseline data collection• Consultation of stakeholders• Identifi cation of hotspots• Identifi cation of experts.
• TDA must produce guidelines from the different steps.
• Some underlying principles behind TDA (Mee, pers. com.) are:• Improved stakeholder analysis;
• Introduction of buy-ins by the multiple actors involved on the relevant temporal and spatial scales;
• Adapting the TDA process to make it more inclusive and rigorous refl ecting multiple geo-graphic scales, scientifi cally rigorous documen-tation, socio-ecological systems and governance baselines (see also reference above to orders of outcome framework).
• TDAs are often too generic; they must lead into SAP (involving lessons learned) including economic/non-economic valuations that may illustrate the changes observed in ecosystem goods and services and may be complemented by indications of costs certain response options may bring.
• TDA (according to Hart pers. Com.) are character-ized by the following:• Identifying issues of transboundary nature• Consultations and data gathering
- methodology• Assessment of biodiversity degradation• Assessment of environmental impacts • Assessment of socio-economic impacts and • Causal chain analysis.
• Resulting Strategic Action Plans (SAP) are nego-tiated policy documents with clear priorities for action (e.g., the National Action Plan). It remains to be clarifi ed, however, as to what level they may feed into legally binding policy and on which scale.• Ideally a SAP identifi es i) policy; ii) legal and
institutional reforms needed and iii) investments required to identify/ address the priority trans-boundary water problems.
• The SAP is a cooperative process calling for ownership by key stakeholders in the countries of the region addressed.
The fi rst step (Fig. 3) in the TDA process (featured is the one carried out for the Mediterranean Sea) is to identify major perceived problems and issues (MPPIs). This step was performed through a participatory process. These MPPIs were the basis for the analysis phase, during which time the MPPIs were investigated for validity.
• Do data support the MPPI as a priority concern? • What data are necessary to evaluate the MPPI? • What do the stakeholders think about the impor-
tance of the MPPI?

Land-based Pollution Sources
23
• What are the causes of the MPPI (causal chain analysis)?
• What are the environmental impacts of the MPPI? • What are the socio-economic impacts of the MPPI? • The analysis phase ends with a de facto ranking of
the relative importance of the various MPPIs.
Figure 6 Flow Diagram for the TDA Process25
MPPI ANALYSIS
Access Existing
Data
Fill Data and
Information Gaps
Causal Chain
Root Causes
EQOsQUANTITATIVE ANALYSIS
OF ENVIRONMENT TDA
Preliminary SAP
TARGETS
Investigations
Investigation 1
Investigation 2
INDICATORS
This is based on the perspective of the GEF/IW, as the TDA is a product of the GEF/IW process13. These steps lead to investigation of the quantitative understanding of the environment and its interaction with society, which is the TDA. This quantitative understanding by nature has uncertainties:
• the data are not perfect, • they are too infrequent, • they are too sparsely located around the region, • the analytical methods are imperfect, etc.
However, the TDA is based on expert judgment of the best available data. The TDA then is followed by agree-ment of overarching regional quality objectives. If the TDA gives the present status of the environment, what is the common vision of the desired status? What environ-mental goals are desirable? These are environment qual-ity objectives (EQOs). The root causes and the MPPIs generally “drive” the next step in the process: selection of specifi c targets and actions to move towards achieve-ment of the EQOs. These targets must be realizable,
25 UNEP/MAP/MED POL: Transboundary Diagnostic Analysis
(TDA) for the Mediterranean Sea, UNEP/MAP, Athens, 2005.
transparent, have fi nite and defi ned duration, and be associated with defi nable and measurable indicators.
In summary, the TDA follows the general GEF Guidelines for International Waters projects. The EQOs naturally lead to identifi cation of specifi c targets to be met within the desired time frame, and from there to identifi cation of specifi c interventions and actions that can be considered in the framework of the NAPs and SAP. Critical elements that constitute the TDA documen-tation are:
• Executive Summary.• Section 1 is the introduction• Section 2 is the technical basis of the TDA, address-
ing the MPPIs.• Section 3 is the legal and institutional framework
analysis.• Section 4 is the stakeholder analysis.• Section 5 covers the environmental quality
objectives.
The projects reviewed in the IW LBP portfolio, to a con-siderable extent, rely on TDAs. However, documentation in many cases is rather limited as to how this analysis has been considered in the projects and the underpinning science and data.
Coastal systems are complex, and their management takes place against a dynamic background where change is continuous and unpredictable. The adaptive manage-
A. Dansie

24
CHAPTER THREE
Application of science for
adaptive management3ment approach has become a useful alternative to deal with such systems. Walter and Holling (1990)26 explain adaptive management as treating management27 strat-egies, and policies as experiments conducted to learn more about the ecosystem’s processes and structures. Adaptive managers, therefore, have the combined roles of defi ning desired realities, generating options, and applying measurements that allow adjustments to be made to the management strategy. The adaptive manage-ment process provides opportunities for “learning-by-doing”. Such learning reveals how ecosystems respond, what the managers are doing, which strategies are suc-cessful, and whose interests are served (Lee, 1999)28.
The concept of adaptive management was developed specifi cally to provide a framework for decision-making to help “reduce uncertainty”. The principles of adap-tive management can be applied at various scales and using various strategies. The most important element is to learn from the project. In fact, adaptive management has been called “learning by doing.” Uncertainties are identifi ed and acknowledged during the planning phase, and steps are taken to deal with these uncertainties. The framework developed by NOAA’s Coastal Service Centre provides an important feedback loop and can be used to improve restoration success29.
26 Walters, C. J., Holling, C. S., 1990. Large scale management
experiments and learning by doing. Ecology 71: 2060-2068.
27 Zhang, X., (2010) Integration of Science and Coastal Manage-
ment: a Case Study of Hong Kong, LEWI Working Paper Series #
Paper # 101; http://www.hkbu.edu.hk/~lewi/publications.html
28 Lee, K. N., 1999. Appraising adaptive management. Conserva-
tion Ecology 3(2):3.
29 http://www.csc.noaa.gov/coastal/management/monitor.htm#ada
Figure 7 Applying the continual evaluation process
of adaptive management leads to cost-
effective, successful restoration projects2
Adaptive Management
PLAN ACT
AD
JUST EVALUATE M
ONITO
R
The role of science in adaptive management is to pro-vide information on changing parameters. Manley et al. (2000)30 describe the cycle of adaptive management in four phases, as shown in Fig. 1. One of the most sig-nifi cant developments in project management has been the increased use of adaptive management principles to assess the success of a project at a particular point in time, based on monitoring-program results, and then to make adjustments that are likely to improve overall proj-ect success. The process can be repeated as many times as necessary to keep the project on track toward meeting all of its objectives. It is important to be able to modify management of an ongoing project, because it allows a manager to consider how such things as new knowledge from outside the project, new technology, inventories, and adjustments to performance goals could affect the project. The ultimate goal is to make a project “work”without wasting funds by attempting to adhere to infl ex-ible and unrealistic goals.
30 Manley, P.N., Tracy, J.C. Murphy, D.D., Noon, B.R., Necho-
dom, M.A. and Knopp, C.M. (2000). “Elements of an Adaptive
Management Strategy for the Lake Tahoe Basin”. In Lake
Tahoe Watershed Assessment: volume I (Technical Editors:
Murphy, D.D.; Knopp, C.M., Gen. Tech. Rep. PSW-GTR-175.
Albany, CA: Pacific Southwest Research Station, Forest Ser-
vice, US Department of Agriculture; 753 p.

25
Figure 8 A schematic diagram of an adaptive management planning cycle (adapted from Manley et al., 2000)
Identification Information Needs Acquiring and Assessing Information
Management Action Evaluation and Decision Making
Monitoring
Modelling
Research
Prioritization &
Allocation of
ResourcesInformation
Sustainability
GoalsStakeholders
Prioritization &
Allocation of
Resources
Agency
Information
Needs
Identification
Projects
Project
Resources
Project
Resources
New
Regulations

26
Analysis Report
The cycle of adaptive management can be described in fi ve phases:
1. Identify information needs2. Develop information acquisition and assessment
strategy3. Evaluate management options and choose manage-
ment strategy4. Implement management strategy, and5. Evaluate management strategy. [Note: essential for
adaptive management.]
The fi rst two phases focus on the information acquisi-tion and assessment phase of the cycle with a brief refer-ence as to how information can best be transferred to the evaluation and decision-making phase. The other stages are critical to developing a fully functioning adaptive approach to the management of resources in the basin; however, they largely pertain to public policy develop-ment and participatory evaluation processes rather than to the direct relationships between scientifi c research and management. Coordination of scientifi c activities with management actions is at the core of an adaptive man-agement approach. Adaptive management calls for new roles for science that lie outside the formal academic training of most scientists. Generating new information is only one of several important steps in adaptive manage-ment. McLain and Lee (1996)31 posit that effective man-agement requires societies not only to acquire knowledge but also to change their behavior in response to new information about the systems in which they live.
This is an emerging scientifi c issue to actually gauge the level to which a change of behavior can be observed (the governance baseline approach – see LOICZ R&S 34). Science can inform the establishment of the enabling conditions and adaptive socio-environmental monitor-ing, but stakeholders and practitioners themselves need to report on their changing value and preference sys-tems to allow an assessment of changes in behavior. Orstom (2009)32 for example explores a framework to assess the likelihood that behavior changes in the form of self-organization among resource users (A General Framework for Analyzing Sustainability of Social-Ecological Systems).
31 McLain, R. J., and R. G. Lee. 1996. Adaptive management: prom-
ises and pitfalls. Environmental Management 29(4):437-448
32 Ostrom, E. (2009) www.sciencemag.org SCIENCE VOL 325,
419-422 24 July 2009
The following core questions were to be explored.
3.1 Was engagement of both local and wider science communities utilized in IW projects? If not, how can improvements be made?
Examples of engagement of local and wider science com-munities from IW projects are particularly evident in the following land-based sources of pollution projects:
• The project on the Role of the Coastal Ocean in the Disturbed and Undisturbed Nutrient and Carbon Cycles was a purely science driven project, which engaged local regional and global science communi-ties to a large degree. Due to an inherent capacity building and training component building “regional mentors” for a specifi c research approach, this engagement has grown to a global network of sci-entists applying the methodology and engaging in evaluation and adaptation.
• GIWA is a key transboundary project dealing with global environmental problems and threats to trans-boundary water bodies. However, across the over 60 GIWA sites, the engagement with science communi-ties has been rather variable. One lesson is that in such global assessment, there is potential to have an even larger effect by inventorying and involving existing scientifi c networks and research on appro-priate scales from the beginning.
• European Regional Seas Program has proposed the generation of high quality data for accurate “model-ling”, providing computerized views of conditions, both existing and possible future scenarios. Again, links with complementing regional-scale research efforts and networks have potential to improve. Further progress requires tangible science man-agement efforts to establish the links between the more policy-directed regional seas program and the research community, and it needs a broadly agreed platform for data sharing and maintaining data-bases. Currently, the situation in different regions is quite heterogeneous, and databases, research and monitoring, as well as observatory efforts, are still considerably fragmented.
• PEMSEA has developed a long-term, “adaptive management” approach to site-level ICM proj-ects. Adaptive management encourages a problem-oriented approach to management and to capacity building. Engagement with the scientifi c community

Land-based Pollution Sources
27
has occurred on both specifi c issues and geographic areas. Discussions and updates on coastal manage-ment analytical needs and knowledge products were subjects of regional conferences. The broad buy-in from national, regional and local stakeholders and practitioners has been critical. Development of research networks comprised of high-ranking schol-ars has also been important.
• In the African tourism project, standard project monitoring and evaluation will be conducted in accordance with established UNEP and GEF proce-
dures. Technical review teams have been established, but are constrained by the availability of data.
• Monitoring is a key component in the Guangdong- Pearl River Delta project. Engagement with the sci-ence community had defi ned the baseline of the sys-tem states and pressures.
• WIOLAB - the project has undergone some adaptive management, in particular in relation to the demon-strations, but has not gone beyond the scope of the original objective with its focus on pollution from land-based sources.
Figure 9 Large Marine Ecosystems of South East Asia
Used with permission from the U.S. NOAA-LME Program Offi ce 2011, http://www.lme.noaa.gov

28
Analysis Report
• Projects either with direct regional and/or global networks or implemented by organizations hat bring this capacity: PEMSEA, LOICZ, GEOHAB, and GLOBALLAST partnership.
How can improvements be made?
• There should be no hesitation and no perception of competing interests preventing the projects from engaging the broader scientifi c community.
• The manner in which current funding schemes oper-ate in the UN shapes participation and outcomes.
• Twinning arrangements (i.e. across systems or site exchanges and learning) and other collaborative ini-tiatives can broaden participation and build capac-ity, and scientifi c forums can reinforce dialogue. Examples are predominantly among those projects addressing the management of river catchments and effects on coastal seas.
• Attribution – more scientists could be drawn into UN activities. Ownership and attribution of knowl-edge needs to be clear from the beginning (i.e. the terms and conditions of this collaboration).Compensation creates incentives for scientists to participate, so in some cases, compensation may be required.
• Clear charter and clear expectations facilitate attri-bution of individual contributions.• In LBP projects, what is the charter of a scien-
tifi c group? What are the expectations? What are the incentives to participate and how is par-ticipation acknowledged?
• Do scientists regard this participation as useful both for their career and for the larger effort in which they are involved?
• Improvements could be achieved through the “train-ing of trainers” concept • Capacity building, information sharing, training
modules, enhanced knowledge• Institutionalization of “applied sciences”.
3.2 Is scientifi c expertise and local knowledge well applied within the IW focal area?
The attitude of people, and their perceptions, beliefs, and knowledge, can have a profound effect on the suc-cess of coastal management initiatives. While science can serve as a rational foundation for management, in many cases it is the groups affected by coastal resource management decisions that determine how acceptable a decision is and infl uence how effective management will be. Experiences and culture, understanding of an issue, and support for an agency can each shape the level of public support for and compliance with coastal resource management decisions and policies33. In a few of the LBP projects, scientifi c expertise, formal training and educa-tion, and cognizance of local knowledge have aided in the decision-making process. Some of the shared knowl-edge includes:
• Existing baseline information, -(e.g. PEMSEA);• Coastal resource profi les; • Developing or adapting analytic methodologies; • Scientifi c insights/breakthroughs from local projects;
and• Scanning for emerging issues.
3.3 Identify lessons learned for linking science and policy implementation, including policy formulation and broader governance issues
In order to be effective, policy must be focused and prac-tical, addressing priority and strategic coastal use and change issues. Lessons can be drawn from each aspect of the policy process (i.e., policy formulation, implementa-tion, monitoring and evaluation and adaptive efforts). To draw useful lessons, it is necessary to engage meaning-fully with the scientifi c community, the public, the pri-vate sector, and all levels of government.
33 NOAA (2007) Linking People, Information and Technology,
Social Science Tools for |Coastal Programs, NOAA Coastal
Services Centre, USA. www.csc.noaa.gov/cms/human_dimen-
sions/focus_socialsci.html.

Land-based Pollution Sources
29
Figure 10 Depiction of ideal fl ow across boundaries
in the context of cooperative research
(modifi ed from Johnson, 2007)34
Local
Knowledge
Scientific
Knowledge
Policy
Making
Local (fi shers) knowledge (blue lines) fl ows to scientists (due to collaboration) but
not into policy-making (due to legal mandates). Scientists’ knowledge (red dashed
line) fl ows to local (fi shers) knowledge (due to collaboration) and into policy-
making (due to qualifi cation as the best scientifi c information).
Key points important to consider when identifying les-sons learned for linking science and policy include:
• Scientists need to understand how to conduct man-agement-relevant applied science: i.e., scientists need to understand how their information can be trans-formed into knowledge products that can be applied in socio-ecological system management;
• The WIOLAB project demonstrates the applica-tion of policy–science links (see annex on WIOLAB Project);
• Science-policy collaboration is also explicit in the project that focuses on ballast water;
• The LOICZ project, in a fi nal policy and manage-ment review of the Role of the Coastal Ocean in the Disturbed and Undisturbed Nutrient and Carbon Cycles (GEW IW project), provided information on how biogeochemical assessment of coastal ocean systems needs to be transformed to inform science-policy discourse and lead to decision support;
• The ICZM protocol for the Mediterranean (Madrid, 2008) is a protocol to the Barcelona Convention that indicates the infl uence of multiple coastal zone
34 Johnson, T. R. 2007. Integrating fishermen and their knowl-
edge in the science policy process: case studies of coopera-
tive research in the Northeastern U.S. Doctoral dissertation.
Rutgers University. Rutgers, New Jersey
management projects and plans on a regional sea development;
• Community-based management often includes capacity building by foundations, universities, donor agencies, other projects. A cross-site train-ing is the prime focus of the project, Demonstration of Community-based Management of Seagrass Habitats in Trikora Beach East Bintan, Riau Archipelago Province, Indonesia;
• PEMSEA has developed a substantial adaptive man-agement strategy for the use of risk assessment and risk management (RA/RM), together with Integrated Coastal Management (ICM). By combining these frameworks, a comprehensive coverage of marine and coastal environments and the associated land-based and sea-based issues was obtained;
• At the local project level, the strategy for learning and adaptive management is often less clear. For example, pilot and demonstration projects are a feature of most site-level strategies. These specifi c projects should be thought of as mini-experiments from which lessons can be extracted as to whether to “scale-up” to additional, similar projects and, if so, to determine the requisite requirements for con-structing successful projects. While these pilot proj-ects and demonstration projects are often carefully and thoughtfully designed, procedures for learning from them are often not explicit.
At the regional level, the PEMSEA project aims at preparing
a framework for establishing a sustainable regional
collaborative mechanism that can generate a coastal and
ocean governance regime. This effort will build on the
experiences from all the other components. Several lessons
learned can be identifi ed from the PEMSEA Project:
• Success and sustainability hinges on the proper com-bination of key programme ingredients;
• Sustainability can be achieved through strong gov-ernment action; supporting legal systems; sound sci-ence and capacity building;
• Partnerships must be inclusive and based on buy-in on all relevant scales;
• PEMSEA’s combination of “top-down” and “bot-tom-up” impetus is effective in securing necessary political commitment; and
• Partnerships do not happen overnight.

30
Analysis Report
3.4 Is adaptive management happening? How to better understand and effectively communicate the scientifi c dimensions of adaptive management to different user groups?
Adaptive management encourages a problem-oriented approach to management and to capacity building. It is our notion that policy initiatives are undertaken as explicit experiments – and out of this emerges adapta-tion. For this purpose, deliberate and organized trial-and-error experiments are essential at several scales including:
• Project-scale adaptive management; • Systematically gathered data- where interventions
were changed; and• Adaptive management across the portfolio: e.g. Xiamen
– new paradigm in adaptive management.
PEMSEA has adopted the concept of ecosystem-based management for river basins, estuaries and coastal seas in the region through the application of integrated and adaptive management approaches in addressing pollution, loss of habitats and biodi-versity, depletion of fi sheries and marine resources, coastal reclamation, and other coastal and marine issues in the context of the socioeconomic, political, cultural and ecological characteristics of the region (PEMSEA, 2004)35.
Adaptive Management Framework in coastal management:
An Adaptive Management Framework (AMF) is a sys-tematic process for continually improving management policies and practices by learning from the outcomes of operations through careful monitoring and relevant research. There are many benefi ts to an adaptive man-agement framework as it allows decision making to pro-ceed, even when there are considerable gaps in knowl-edge and uncertainty, by specifying actions, monitoring and adjustment of visions, targets and associated man-agement practices.
35 PEMSEA, 2004.Sustaining Benefits. PEMSEA IEC Manual 1,
38p. Global Environmental Facility/ United Nations Develop-
ment Programme/ International Maritime Organization Regional
Programme for Building Partnerships for the Seas of East Asia
(PEMSEA), Quezon City, Philippines.
The Coastal Resources Center (2006)36 study states that the Adaptive Management Framework (AMF) includes six basic components:
1. Information collation: where information from stakeholders and ongoing research is pooled and organized so it can be readily accessed and used to improve the common understanding of natu-ral resource management (NRM) issues and opportunities.
2. Systems analysis and vision: where stakeholders come together to develop their NRM vision and aspirations for a particular location, catchment or region, and to develop a systems approach to their assets to enable exploration of differing perspectives, values, beliefs and linkages between understandings. Concepts are refi ned to provide a workable under-standing of the ecological system and its expected responses.
3. Planning: where stakeholders collectively establish NRM goals and targets and negotiate a preferred strategy based on consideration of multiple and sometimes confl icting objectives and possible trade-offs that may be required.
4. Implementing actions: where stakeholders assign roles, responsibilities and resources to conduct the agreed actions for achieving goals and targets in the plan.
5. Monitoring and reviewing: where stakeholders eval-uate progress towards the vision, goals, and imple-mentation schedule and targets established at the start of the adaptive management process, modify-ing goals or practices as a result of emerging knowl-edge, using agreed review timelines.
6. Core components: comprising facilitation and man-agement of the adaptive management process and the evolving knowledge whereby networking, learn-ing, negotiation, confl ict resolution and knowledge development processes are organized.
A few examples of Adaptive management from the LBP Projects:
Adaptive management also includes cross-site innova-tions and continued review within the DPSIR cycle:
36 CRC (2006) Enabling adaptive management for regional natural
resource management, technical report 18, August 2008

Land-based Pollution Sources
31
• The project report that derived from the global bio-geochemical assessment implemented by LOICZ provides graphics and feeds into follow-up activities aimed to address effective science communication, including refl ection on how to deal with uncertainty;
• Addressing uncertainty at a regional seas scale or across portfolios could be of use in adaptive man-agement; this is particularly the case if uncertainty is being quantifi ed scientifi cally and involved in sce-nario simulation for likely futures of regional seas (this can be seen in recent EU projects outside the GEF portfolio);
• Changing technology: i.e., changing to collaborative management among agencies is a potential example of changing management principles;
• Changing ballast water technology;• The LMMA network (http://www.lmmanetwork.
org/), which is a network of marine conservation practitioners working in Asia and the Pacifi c who have joined together to increase the success of their efforts is an example of adaptive management.
3.5 How to better communicate newly synthesized science knowledge to stakeholders within and external to GEF
The approach must be to communicate information about coastal problems and solutions in ways that are relevant and actionable. As decision makers, natural resource managers should monitor scientifi c trends and connect with scientifi c experts who can answer ques-tions relevant to the public policy debates in which they engage. Likewise, there is a growing need for scientists to present their research fi ndings outside traditional publi-cation pathways (which are nonetheless the one and only truly accepted scientifi c reward system!) and to target their research communication on specifi c public policy issues. Three common communication problems that can arise among scientists, resource managers, and the citi-zens they serve are outlined below:
1. Concepts and language – different concepts and lan-guage barriers (e.g., on the level of system descrip-tions or delineations of boundaries of drivers, impacts and institutional dimensions) can easily sty-mie or obstruct policy-science discussions;
2. Relationships and partnerships - applying knowl-edge can be a challenge for managers because it is not always clear what scientifi c fi ndings are rel-
evant to the problem at hand, or where and in what form the information might be available (Bosch et al 200337, Gregrich 200338).
3. Information Technology and data sharing - one tool resource managers have identifi ed to improve internet information exchange is a central source of reliable on-line information that combines what is known about particular topics both from public policy and scientifi c research standpoints. With such a resource, particular attention should be paid to issues surrounding the comparability of data, data records (metadata), how data is being used, and who is using it39.
Some of the ways to better communicate newly syn-thesized science knowledge to stakeholders within and external to GEF as discussed within the LBP Working Group are delineated below.
• Talk to them - communicate to different stakeholders;
• Science conferences with information channels to other audiences and involvement of youth and early stage researchers/stakeholders;
• Post-normal science communication - Silvio Funtowicz’s40 defi nition of “post-normal science”, where “facts are uncertain, values in dispute, stakes high and decisions urgent”. Ravez started discus-sion of post-normal science in the context of the debate over environmental issues: in this case, not all the factors are knowable, it is necessary to cope with uncertainties, but at the same time it is of great importance to fi nd a way to cope with this knowl-edge and to continue with the decision-making pro-
37 Bosch OJH, Ross AH, Beeton RJS. 2003. Integrating science
and management through collaborative learning and better
information management. Systems Research and Behavioral
Science 20: 107 - 19
38 Gregrich RJ. 2003. A note to researchers: communicating sci-
ence to policy makers and practitioners. Journal of Substance
Abuse Treatment 25: 233-7
39 CSO (2005) Translating Science into Management: Chal-
lenges and Opportunities for the Coastal Community. Report
Prepared by Jeff Benoit and Chantal Lefebvre of the Urban
Harbors Institute – University of Massachusetts Boston for the
Coastal States Organization
40 Funtowicz, S.O. and Ravetz, J. R. (1993) “Science for the
post-normal age”, Futures, vol. 25(7), pp.739-755

32
Analysis Report
cess. A few examples of post-normal science include the following:
• Report card of status of coastal health• Different communication strategies for outreach• Communicating conceptualized diagrams to
elucidate complex interplay and feedback in social ecological systems including effects of surprises and how they affect our world
• Visual media• Targeting specifi c groups also outside the sci-
ence community.
• Change incentives so that outreach and connections to management are reinforced;• Educate school children / youth (including
youth for an educational curricula addressing issues of a changing earth system and human dimensions)
• Develop language, stories, and images to com-municate this new knowledge effectively and to communicate successes effectively.
• From the beginning of the process, make stake-holder analysis compulsory;
• Local language website, bottom-up approach (own-ership); and
• Revitalize traditional knowledge: i.e. incorporate traditional knowledge such as water management in community-based management notions of ‘kapu’/taboo; restricted areas/species/harvesting seasons).
In conclusion..... “All you gotta do is put your mind to it knuckle down,
buckle down, do it, do it, do it”— Roger Miller
A coral head provides refuge for many species of reef fi sh in South East Asia / A. Dansie


ANALYSIS REPORT
LAND-BASEDPOLLUTION SOURCESA global Analysis of Land-Based Polluti on Sources scienceand transboundary management
GEF IW:Science Project
United Nati ons UniversityInsti tute for Water, Environment and Health175 Longwood Road South, Suite 204Hamilton, ON Canada L8P 0A11.905.667.5511 • www.inweh.unu.edu ISBN: 92-808-6024-0
The United Nati ons Think Tank on Water
Enhancing the use of Science in International
Waters projects to improve project results
Enhancing the use of Science in International
Waters projects to improve project results