a gis methodology for cycling investment prioritization ... · Álvaro caviedes, maïté thirouin...
TRANSCRIPT
TS07A - Spatial Planning and DRM - 6305
Álvaro Caviedes, Maïté Thirouin and Daniel Paez
A GIS methodology for improvement of cycling networks using cadastre and urban form information.
8th
FIG Regional Conference 2012
Surveying towards Sustainable Development
Montevideo, Uruguay, 26 – 29 November 2012
1/21
A GIS methodology for cycling investment prioritization using cadastre and
urban form information.
Álvaro CAVIEDES, Maïté THIROUIN and Daniel PAEZ, Colombia
Key words: bicycle network, GIS, urban infrastructure development, urban form assessment,
cadastre, spatial decision support system
SUMMARY
Around the world, cities appear to be increasing their desire for cycling as a real solution for
their transportation problems. Most western cities have invested in cycling networks with
facilities integrated to the core transport network.
As the development of cycling network has rarely followed strict planning guidelines,
network gaps are common. This produces that cities are constantly searching technical
methodologies for decision support around bicycle network infrastructure improvement.
This paper presents a methodology, using GIS. The aims of the methodology are to
characterizing zones around bikeways understanding the variables that affect its use. A case
study was conducted in Bogotá, the capital of Colombia.
It appears that the GIS methodology used was able to identify deficiencies of the Bogotá
network in terms of accessibility, personal safety and road safety. Priority zones where
bikeways are most needed were compared with existing network gaps and ranked based on
priority needs.
Results from the case study in Bogotá suggest that this methodology facilitates the
identification of infrastructure investments. However, prioritization of the intervention zones
is highly dependent on expert knowledge and, therefore, limitations exist for using the
methodology widely in other countries.
Further research is proposed in enhancing the methodology to not only evaluating current
bicycle networks but also in identifying possible priority corridors for new infrastructure in
areas where cycling could be a feasible transport option.

TS07A - Spatial Planning and DRM - 6305
Álvaro Caviedes, Maïté Thirouin and Daniel Paez
A GIS methodology for improvement of cycling networks using cadastre and urban form information.
8th
FIG Regional Conference 2012
Surveying towards Sustainable Development
Montevideo, Uruguay, 26 – 29 November 2012
2/21
A GIS methodology for cycling investment prioritization using cadastre and
urban form information.
Álvaro CAVIEDES, Maïté THIROUIN and Daniel PAEZ, Colombia
1. INTRODUCTION
Today, authorities pay particular attention to the behavior of cities in terms of pollution and
sustainable development. Transportation projects in cities are key for the sustainable
development of those places. Such projects have to respond to challenges such as social
inequality that is also likely to generate personal safety issues. The urbanism plans built
around the new transportation projects contribute to this evolution as they tend to improve the
quality of life in towns (Yigitcanlar, O'Connor, & Westerman, 2008). Additionally, today it is
expected that transport systems contribute to air quality and provide comfort and efficiency.
As more citizens leave the countryside for cities, the urban population grows, creating a need
to tackle new transport necessities. Transporting people in a safe, efficient and comfortable
way is a great challenge that every town worldwide is facing.
These issues concern Bogotá, the capital of Colombia. Bogotá is a city of social inequalities
with more than 8 million inhabitants. Today, Bogotá is developing rapidly (Dawsey & Arora)
(The World Bank, 2012), and the need for new transportation systems to tackle the pollution
and the traffic congestion is emerging.
One of the green transport modes constituting a viable option is the bike, considered by its
users as cheap and healthy (Heinen, Maat, & van Wee, 2010). Many bicycle networks have
been implemented in Western countries (Martens, 2004). However, in some cities the use of
the bicycle is declining significantly due to many factors including road safety, lack of
continuous network and unsuitable infrastructure (Tolley, 1990).In Bogotá, limitations have
been identified in the system (GDS, 2010).
This paper presents a methodology, using geographic information systems (GIS) to prioritize
investment in transport infrastructure. A case study in the city of Bogotá was conducted where
identified gaps in the cycling network were spotted. This paper is divided in four parts. The
first part presents a review of current research in the area of cycling network development and
prioritization. In this section the case study of Bogotá is introduced. The second part describes
de methodology used. Then results from applying the methodology in the case study are
discussed. Finally conclusions for the research and opportunities for further work are
presented.

TS07A - Spatial Planning and DRM - 6305
Álvaro Caviedes, Maïté Thirouin and Daniel Paez
A GIS methodology for improvement of cycling networks using cadastre and urban form information.
8th
FIG Regional Conference 2012
Surveying towards Sustainable Development
Montevideo, Uruguay, 26 – 29 November 2012
3/21
2. BACKGROUND
In order to prioritize interventions on a bicycle network, two main methods could be
identified in the literature: users’ survey and multi-criteria approach with expert knowledge.
Significant popularity exists for the multi-criteria method (Rybarczyk & Changshan, 2009)
(Neutens, Delafontaine, Scott, & De Maeyer, 2012). The paper: “Bicycle facility planning
using GIS and multi-criteria decision analysis” (Rybarczyk & Changshan, 2009) is an
example in which the method demonstrated advantages to produce a positive result.
The multi-criteria method requires finding relevant criteria. In general, those criteria are
supply-based or demand-based. In the Multi-Criteria process, significant criteria indirectly
related to supply and demand have been used (Rybarczyk & Changshan, 2009)
With the multi-criteria method, analysis results for each criterion are obtained. To superpose
those results and build a complete answer, it is necessary to standardize them and then weight
them (Hsu & Lin, 2012). GIS allows a display of the complete results with a map and tables.
GIS appears as a viable option for applying the multi-criteria analysis (Shaw, 2010). A GIS
integrates hardware, software, and data for capturing, managing, analyzing, and displaying all
forms of geographically referenced information. GIS allows us to view, understand, question,
interpret and visualize data in many ways that reveal relationships, patterns and trends in the
form of maps, globes, reports and charts (ESRI, 2012).
2.1 Case study
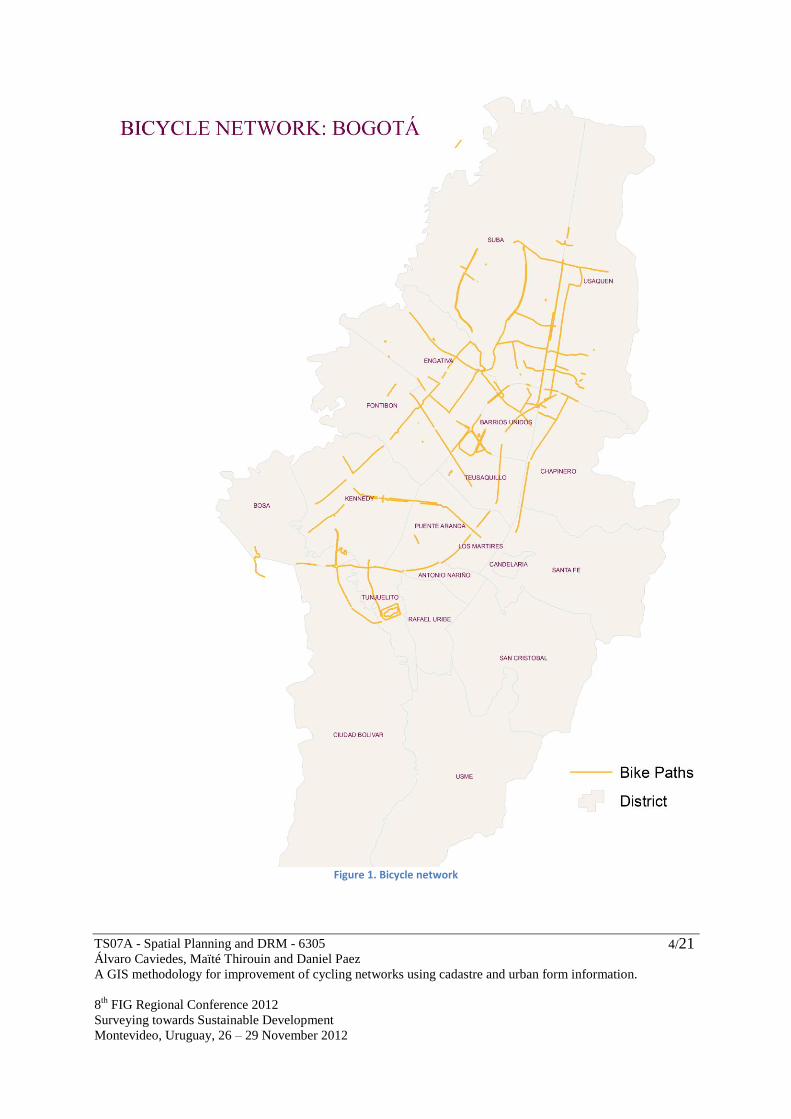
For an administrative and political purpose, Bogotá is divided in 20 districts. The bicycle
network in Bogotá was designed to connect the main activity zones for each district in order
to present an alternative to compete with the other transport systems (Pucher,
1996).Nevertheless, today the bicycle network has two important problems: on one hand, the
network presents gaps along its length, and on the other, the coverage does not offer a good
transportation option for the population (GDS, 2010).
The next map presents the bicycle network in Bogotá. The disconnections along the network,
most of them in the periphery of the city, should be noted.
TS07A - Spatial Planning and DRM - 6305
Álvaro Caviedes, Maïté Thirouin and Daniel Paez
A GIS methodology for improvement of cycling networks using cadastre and urban form information.
8th
FIG Regional Conference 2012
Surveying towards Sustainable Development
Montevideo, Uruguay, 26 – 29 November 2012
4/21
Figure 1. Bicycle network

TS07A - Spatial Planning and DRM - 6305
Álvaro Caviedes, Maïté Thirouin and Daniel Paez
A GIS methodology for improvement of cycling networks using cadastre and urban form information.
8th
FIG Regional Conference 2012
Surveying towards Sustainable Development
Montevideo, Uruguay, 26 – 29 November 2012
5/21
The other problem is the coverage. Most of the districts in Bogotá have a significant poor
bicycle network presence. The bicycle networks in districts such as Suba, Usaquén,
Chapinero, Fontibón, Puente Aranda, Santa Fe, Tunjuelito and Ciudad Bolivar are not
sufficient to offer a transport option in the totality of the area. People in districts such as San
Cristóbal, Rafael Uribe, Usme, Candelaria and Sumapaz suffer from an even worse situation.
Figure 2. Network bicycle coverage
The gaps and the coverage make the bicycle use an impractical alternative for the mobility in
the city.
The next section presents a methodology to identify the priority zones in Bogotá to develop
improvements in the bicycle network using GIS.
3. METHODOLOGY
In this paper we formulate a GIS based methodology with a multi criteria analysis for the
identification of the main cycling network gaps in Bogotá. The methodology is divided in four
phases (see next figure).

TS07A - Spatial Planning and DRM - 6305
Álvaro Caviedes, Maïté Thirouin and Daniel Paez
A GIS methodology for improvement of cycling networks using cadastre and urban form information.
8th
FIG Regional Conference 2012
Surveying towards Sustainable Development
Montevideo, Uruguay, 26 – 29 November 2012
6/21
Figure 3: Research methodology
There are many variables that affect the bicycle network use. This research focuses on the
factors that affect the current situation in Bogotá and the ones identified in the studies realized
in Europe (Martens, 2004), (Vandenbulcke, et al., 2009).
The following variables are the pillars to identify the priority zones for the bicycle network
improvement for this research:
- Population density
- Income repartition
- Personal safety
- Employ density
- Land uses
- Crime concentration
- Presence of illegal districts near the bikeways
After the individual analysis of each variable, the methodology proposes the compilation of
the information found to determine where the priority zones for the bicycle network
improvement are. A multi criteria methodology analysis was developed for this goal. ArcMap

TS07A - Spatial Planning and DRM - 6305
Álvaro Caviedes, Maïté Thirouin and Daniel Paez
A GIS methodology for improvement of cycling networks using cadastre and urban form information.
8th
FIG Regional Conference 2012
Surveying towards Sustainable Development
Montevideo, Uruguay, 26 – 29 November 2012
7/21
allows the development of one surface summarizing the important information of each
criterion. The problem is that the criteria are represented in a raster surface that contains the
main information in a specific range, making it impossible to compare in an adequate way
with other criteria. For this reason, each criterion surface was normalized to obtain a
comparable range. The range determined is between 0 and 1.
Table 1. Criteria range
The next step of the proposed method is to assign a weight to each of the variables given that
they don’t have the same influence and importance to the priority zones (Handy, Xing, &
Buehler, 2010). The assignation of each weight is based on the (AHP) Analytic Hierarchy
Process. , which allows to make important decisions based on mathematics and psychology.
The system computes hierarchically the answers of a group of people asking for the
importance of different options to make a specific decision (Olson, Fliedner, & Currie, 1995).
A questionnaire with 21 questions about the variables mentioned above was designed to apply
the AHP. Each of these questions was designed to compare a pair of variables; the respondent
has to answer each question taking into account his preference between two options in a
defined context (bicycle network improvement). The respondents were selected based on
their experience and knowledge in the transportation, infrastructure, urban planning and
logistic fields.
The matrix presented below displays the variable pair comparisons. Each pair of variables
was compared on a scale 1 to 9, where 1 represents an equal importance between the
variables, 5 represents a strong preference of one variable over another, and 9 represents the
highest preference of one variable over another.
Criterion Range
Population density 0-1
Income 0-1
Employment 0-1
Accident 0-1
Commercial 1
Residential 1
Official 0.8
Historical Zones 0.6
Green zones 0.2
Industrial 0.1
Non built 0
Floor extraction 0
Crime 0-1
Illegal neighborhoods 0-1
Land use
0 represents the zones with the higher number of homicides
0 represents the illegal neighborhoods with the higher network coverage
Note
0-1
0 represents the zones with the lower level of population density
0 represents the zones with the higher level of income per home
0 represents the zones with the lower level of employment
0 represents the zones with the higher number of bicycle accidents

TS07A - Spatial Planning and DRM - 6305
Álvaro Caviedes, Maïté Thirouin and Daniel Paez
A GIS methodology for improvement of cycling networks using cadastre and urban form information.
8th
FIG Regional Conference 2012
Surveying towards Sustainable Development
Montevideo, Uruguay, 26 – 29 November 2012
8/21
Criterion Weight
Population density 21%
Income repartition 26%
Personal safety 7%
Emplloy density 25%
Land uses 8%
Crime concentration 5%
Presence of illegal neighborhoods near the bikeways 8%
Figure 4. Criteria matrix.
The responses were grouped in one matrix to start the weight assignation (Olson, Fliedner, &
Currie, 1995). The results found in the process are shown in the following table.
Table 2. Criteria weight assignation.
The last step of the methodology proposed is to summarize (with ArcMap) the information
from each criterion in one continuous surface with the weight assignation.
4. RESULTS
In this section, results for each of the variables studied are presented for the case study of
Bogotá. At the end, a final priority map with a rank for each of the gaps is shown.
4.1 Population density
The following tables present the current situation that characterizes the populations that have
access to the bike facilities and the ones that don’t benefit from it. The percentages are the
number of men/women that live within a certain distance of the bike paths and belonging to a
certain range of age over the total population of Bogotá. It can be noticed that the ones who
have an easier access to the bikeways are the younger than 15 years old and the one that are
Po
pu
lati
on
den
sity
Inco
me
Emp
loym
ent
Acc
iden
t
Lan
d u
se
Cri
me
Illeg
al n
eigh
bo
rho
od
s
Population density
Income
Employment
Accident
Land use
Crime
Illegal neighborhoods

TS07A - Spatial Planning and DRM - 6305
Álvaro Caviedes, Maïté Thirouin and Daniel Paez
A GIS methodology for improvement of cycling networks using cadastre and urban form information.
8th
FIG Regional Conference 2012
Surveying towards Sustainable Development
Montevideo, Uruguay, 26 – 29 November 2012
9/21
between 25 y 45 years old. The percentages of men and women are slightly different, but the
tendencies with age are the same.
Table 3.Male age Bicycle accessibility rank
Table 4. Female age Bicycle accessibility rank
Following the current situation analysis, the 2011 Mobility Survey made by the city council of
Bogotá (Alcaldía Mayor de Bogotá, 2011) indicates strong differences in the spatial
population density repartition (population densities of each district).
The methodology studied the importance and the existing relationship between the population
density and the bicycle network. This is particularly significant to prioritize the accessibility
for those zones with an important number of people per square kilometer.
Multiple factors contained in the population density information (Alcaldía Mayor de Bogotá,
2011) such as geographic location, personal information (gender, age, and income) and
persons per household were analyzed to present the population density range distribution in
each district of Bogotá.
Male age rank Distance (m)
<15 15-25 25-45 45-55 >45
<15 0.1% 0.04% 0.07% 0.02% 0.02%
15-50 0.3% 0.1% 0.3% 0.06% 0.07%
<50 0.4% 0.2% 0.3% 0.08% 0.09%
50-100 0.3% 0.2% 0.4% 0.2% 0.2%
<100 0.7% 0.4% 0.8% 0.2% 0.3%
<200 3% 2.3% 4% 1% 1%
200-500 5% 3.6% 6.3% 1.5% 1.8%
500-1000 5.5% 3.7% 6.6% 1.5% 1.7%
Female age rank Distance (m)
<15 15-25 25-45 45-55 >45
<15 0.06% 0.05% 0.09% 0.02% 0.02%
15-50 0.2% 0.2% 0.3% 0.07% 0.1%
<50 0.3% 0.2% 0.4% 0.1% 0.1%
50-100 0.4% 0.3% 0.5% 0.2% 0.2%
<100 0.6% 0.5% 0.9% 0.3% 0.4%
<200 3% 2.3% 4% 1% 1%
200-500 5% 3.6% 6.3% 1.5% 1.8%
500-1000 5.5% 3.7% 6.6% 1.5% 1.7%
TS07A - Spatial Planning and DRM - 6305
Álvaro Caviedes, Maïté Thirouin and Daniel Paez
A GIS methodology for improvement of cycling networks using cadastre and urban form information.
8th
FIG Regional Conference 2012
Surveying towards Sustainable Development
Montevideo, Uruguay, 26 – 29 November 2012
10/21
Stratum Distance
Stratum 1 Stratum 2
Stratum 3 Stratum 4 Stratum 5 Stratum 6
< 200 m 2% 4.7% 2.5% 1.7% 1.5% 5.7%
200-500 m 3% 6.9% 2.7% 1.5% 1% 7%
500-1000 m 4.5% 7.6% 1.5% 0.7% 0.56% 7.6%
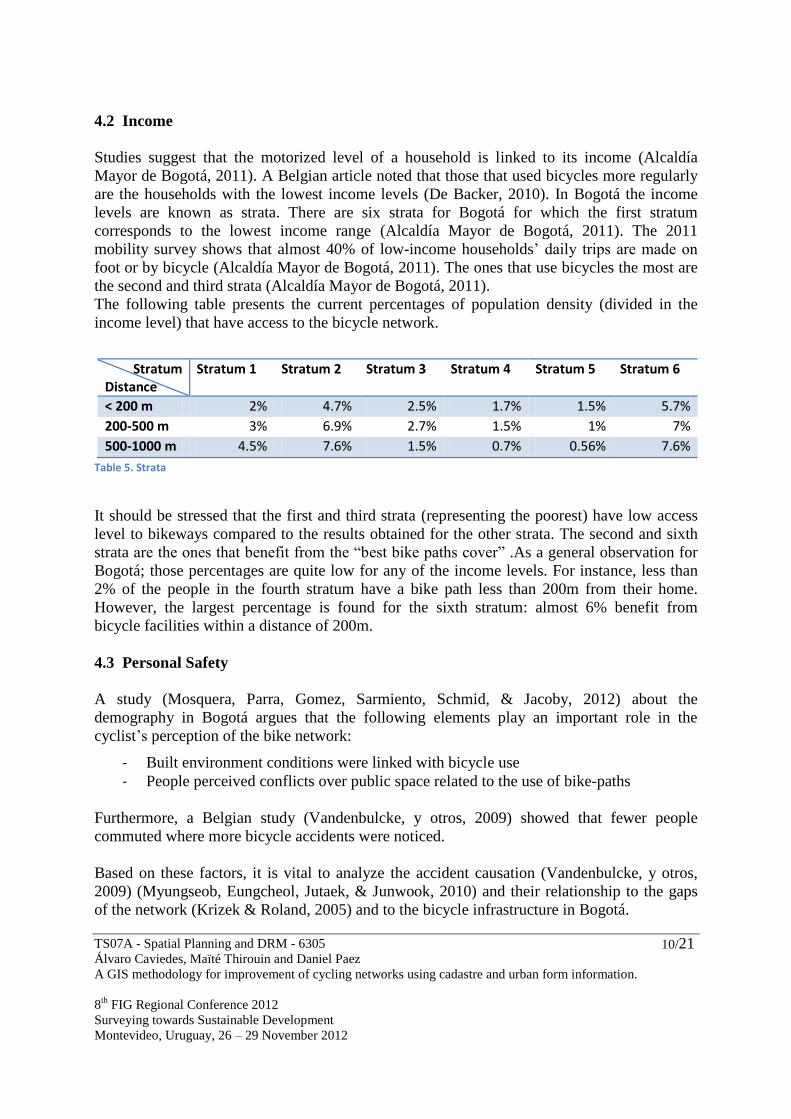
4.2 Income
Studies suggest that the motorized level of a household is linked to its income (Alcaldía
Mayor de Bogotá, 2011). A Belgian article noted that those that used bicycles more regularly
are the households with the lowest income levels (De Backer, 2010). In Bogotá the income
levels are known as strata. There are six strata for Bogotá for which the first stratum
corresponds to the lowest income range (Alcaldía Mayor de Bogotá, 2011). The 2011
mobility survey shows that almost 40% of low-income households’ daily trips are made on
foot or by bicycle (Alcaldía Mayor de Bogotá, 2011). The ones that use bicycles the most are
the second and third strata (Alcaldía Mayor de Bogotá, 2011).
The following table presents the current percentages of population density (divided in the
income level) that have access to the bicycle network.
Table 5. Strata
It should be stressed that the first and third strata (representing the poorest) have low access
level to bikeways compared to the results obtained for the other strata. The second and sixth
strata are the ones that benefit from the “best bike paths cover” .As a general observation for
Bogotá; those percentages are quite low for any of the income levels. For instance, less than
2% of the people in the fourth stratum have a bike path less than 200m from their home.
However, the largest percentage is found for the sixth stratum: almost 6% benefit from
bicycle facilities within a distance of 200m.
4.3 Personal Safety
A study (Mosquera, Parra, Gomez, Sarmiento, Schmid, & Jacoby, 2012) about the
demography in Bogotá argues that the following elements play an important role in the
cyclist’s perception of the bike network:
- Built environment conditions were linked with bicycle use
- People perceived conflicts over public space related to the use of bike-paths
Furthermore, a Belgian study (Vandenbulcke, y otros, 2009) showed that fewer people
commuted where more bicycle accidents were noticed.
Based on these factors, it is vital to analyze the accident causation (Vandenbulcke, y otros,
2009) (Myungseob, Eungcheol, Jutaek, & Junwook, 2010) and their relationship to the gaps
of the network (Krizek & Roland, 2005) and to the bicycle infrastructure in Bogotá.
TS07A - Spatial Planning and DRM - 6305
Álvaro Caviedes, Maïté Thirouin and Daniel Paez
A GIS methodology for improvement of cycling networks using cadastre and urban form information.
8th
FIG Regional Conference 2012
Surveying towards Sustainable Development
Montevideo, Uruguay, 26 – 29 November 2012
11/21
Accident percentage
Group 1 2%
Group 2 84.5%
Group 3 13.5%
Distance Accident percentage
< 10m 8.4%
10 - 200 m 19%
200 - 500 m 30%
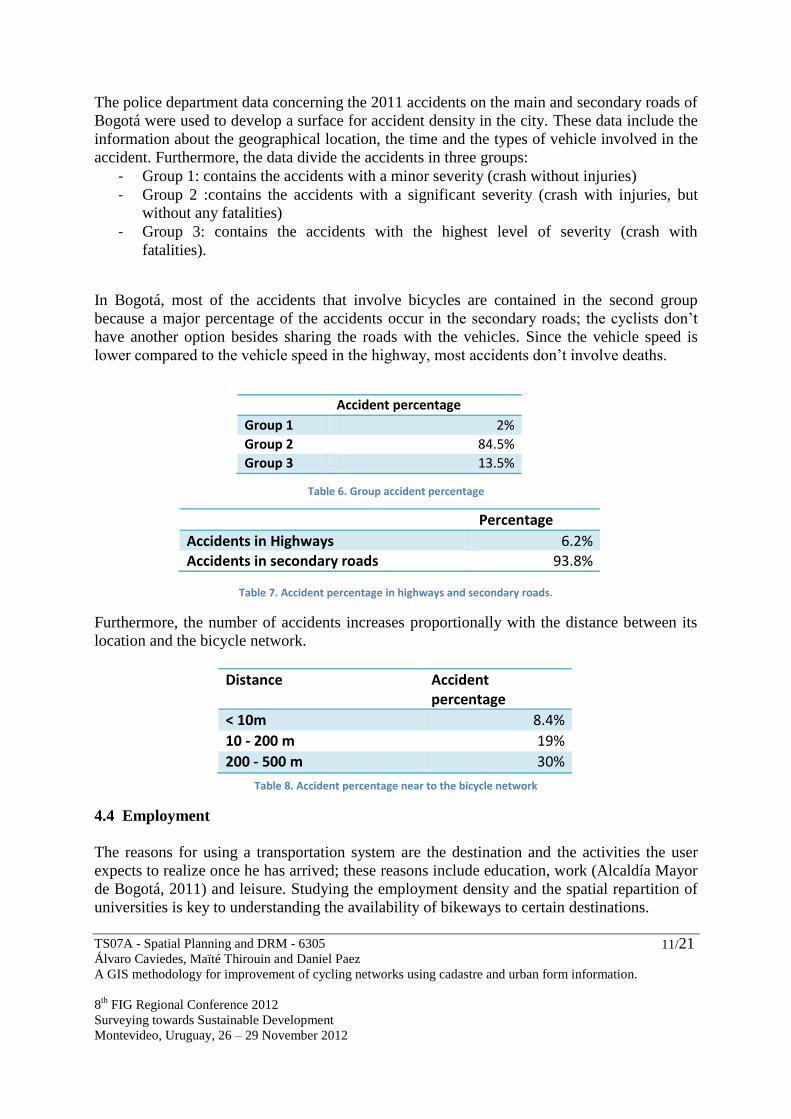
The police department data concerning the 2011 accidents on the main and secondary roads of
Bogotá were used to develop a surface for accident density in the city. These data include the
information about the geographical location, the time and the types of vehicle involved in the
accident. Furthermore, the data divide the accidents in three groups:
- Group 1: contains the accidents with a minor severity (crash without injuries)
- Group 2 :contains the accidents with a significant severity (crash with injuries, but
without any fatalities)
- Group 3: contains the accidents with the highest level of severity (crash with
fatalities).
In Bogotá, most of the accidents that involve bicycles are contained in the second group
because a major percentage of the accidents occur in the secondary roads; the cyclists don’t
have another option besides sharing the roads with the vehicles. Since the vehicle speed is
lower compared to the vehicle speed in the highway, most accidents don’t involve deaths.
Table 6. Group accident percentage
Table 7. Accident percentage in highways and secondary roads.
Furthermore, the number of accidents increases proportionally with the distance between its
location and the bicycle network.
Table 8. Accident percentage near to the bicycle network
4.4 Employment
The reasons for using a transportation system are the destination and the activities the user
expects to realize once he has arrived; these reasons include education, work (Alcaldía Mayor
de Bogotá, 2011) and leisure. Studying the employment density and the spatial repartition of
universities is key to understanding the availability of bikeways to certain destinations.
Percentage
Accidents in Highways 6.2% Accidents in secondary roads 93.8%

TS07A - Spatial Planning and DRM - 6305
Álvaro Caviedes, Maïté Thirouin and Daniel Paez
A GIS methodology for improvement of cycling networks using cadastre and urban form information.
8th
FIG Regional Conference 2012
Surveying towards Sustainable Development
Montevideo, Uruguay, 26 – 29 November 2012
12/21
Jobs into 200m / Total Jobs
Jobs between 200 and 500m / Total Jobs
Jobs between 500 and 1000m / Total Jobs
% 26 27.6 23.5
Distance Percentage of universities within this distance (%)
< 15 m 0 15-50 m 2.7 50-100 m 1.8
The following table shows the employment repartition in Bogotá. Each column corresponds to
the percentage of jobs localized within a certain distance of the bike paths considering the
total number of jobs in the city. Only one quarter of workers can go at work by bicycle.
Table 9. Jobs
As education is one of the main reasons for using transport systems, the research looks at the
universities’ accessibility to the bike paths. Once again, the percentages are very low,
signifying the poor network coverage regarding universities.
Table 10.Universities
For the control and the organization of Bogotá, the government has a political sub division
called UPZ (planning zones). Bogotá has 112 planning zones, which are an important tool that
permits the design of improvements and the development of the urban planning in a detailed
level. The research identifies and develops a continuous surface with the employment density
distribution for each planning zone.
4.5 Land use
Following the same idea that the objective of the user is to arrive at a specific location;
therefore, land uses are useful when considering them as an origin or a destination. Bogotá
presents the following land uses: commercial, residential, industrial, non-built, floor
extraction, official, Green zone and Historical. The hypothesis is that some uses are
considered as attractive zones (commercial, residential, official), others as disturbing zones
(floor extraction, industrial), and a last group as dangerous zones for cyclists (non-built).
Currently, only 14.7% of the land that is within 200m of the bike paths is of commercial use,
whereas 54% is residential and almost 10% is Non-Built land. The last group is dangerous
Distance Number of universities
< 15 m 0 15-50 m 3 50-100 m 2

TS07A - Spatial Planning and DRM - 6305
Álvaro Caviedes, Maïté Thirouin and Daniel Paez
A GIS methodology for improvement of cycling networks using cadastre and urban form information.
8th
FIG Regional Conference 2012
Surveying towards Sustainable Development
Montevideo, Uruguay, 26 – 29 November 2012
13/21
and not very attractive as it is not a destination or origin itself for the bicyclists.
Figure 5. Land use within 200 m of the bike paths
4.6 Crime
Another interesting point is the criminality. In Bogotá, some bicycle ways pass through
dangerous districts in terms of personal safety, which can affect the use of the bicycle. To
avoid those zones, one has to go out of the bikeway and take another route passing by streets
that don’t offer bicycle facilities, which means less security and comfort for the users.
The information for homicides between the years 2000 and 2003 was obtained from the
forensic science department (Instituto nacional de medicina legal y ciencias forenses de
Colombia) to determine where the dangerous zones in the city are. The geographic location of
the homicides on a surface indicates the crime concentration. (Páez & Bocarejo, 2012)
4.7 Illegal neighborhoods
The illegal neighborhoods refer to the neighborhoods located in zones that are not allowed for
residential construction. These neighborhoods are composed of populations with low incomes
and low accessibility to the public transport systems.
The following map presents the bicycle network cover in illegal neighborhoods. These zones
in Bogotá represent an area of almost 70,000,000 square meters, but only 35% is covered by
the network within a 500-meter service distance. The people who live there are the
households with the lowest incomes. This fact isn’t reflected in the accesibility to the
transport facilities.

TS07A - Spatial Planning and DRM - 6305
Álvaro Caviedes, Maïté Thirouin and Daniel Paez
A GIS methodology for improvement of cycling networks using cadastre and urban form information.
8th
FIG Regional Conference 2012
Surveying towards Sustainable Development
Montevideo, Uruguay, 26 – 29 November 2012
14/21
Figure 6. Illegal neighborhoods
TS07A - Spatial Planning and DRM - 6305
Álvaro Caviedes, Maïté Thirouin and Daniel Paez
A GIS methodology for improvement of cycling networks using cadastre and urban form information.
8th
FIG Regional Conference 2012
Surveying towards Sustainable Development
Montevideo, Uruguay, 26 – 29 November 2012
15/21
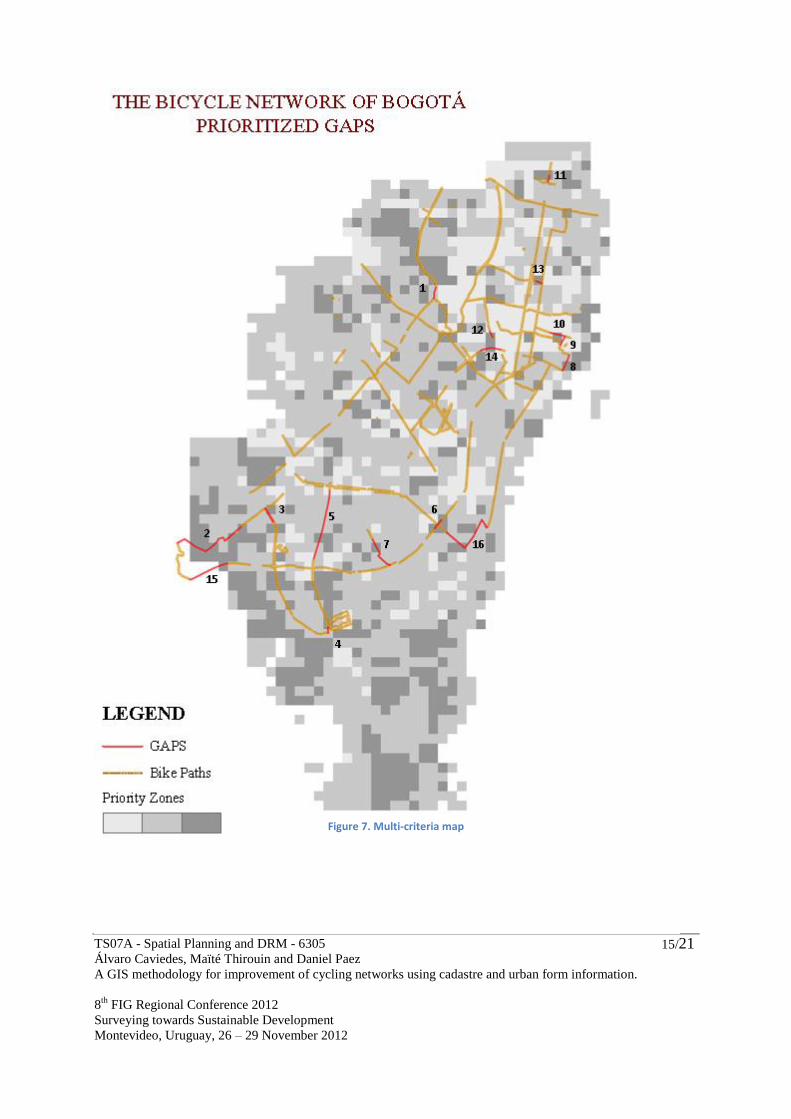
Figure 7. Multi-criteria map

TS07A - Spatial Planning and DRM - 6305
Álvaro Caviedes, Maïté Thirouin and Daniel Paez
A GIS methodology for improvement of cycling networks using cadastre and urban form information.
8th
FIG Regional Conference 2012
Surveying towards Sustainable Development
Montevideo, Uruguay, 26 – 29 November 2012
16/21
The map presents the priority zones in Bogotá for the bicycle network improvement. The dark
zones are those that have the highest score in the multi-criteria evaluation and need special
attention. They are the main concern when designing the connections in the gaps.
The research proposal is to choose the gaps that are contained in the priority zones to connect
the network in an efficient way. For this purpose, the problem is divided in two.
First, the gaps of the total network are connected following the principal and secondary
highways because the bicycle facilities are only needed in places that affect the personal
safety of the cyclists (Pettinga, y otros, 2009). Furthermore, the highways offer the best option
to connect the trip distribution. 82 connections for the gaps were identified.
Second, the connections were ranked based on their location in the priority surface.
The ones within a significant dark area are the ones that have priority in their construction.
These priority connections are summarized in the following table.
Tabla 1. Gap connection priority
.
ID Gap Lenght (m)
1 534.11
2 3874.97
3 754.51
4 304.20
5 3315.56
6 532.81
7 1613.91
8 832.74
9 460.81
10 712.06
11 316.84
12 291.12
13 296.25
14 976.17
15 1951.60
16 3252.81

TS07A - Spatial Planning and DRM - 6305
Álvaro Caviedes, Maïté Thirouin and Daniel Paez
A GIS methodology for improvement of cycling networks using cadastre and urban form information.
8th
FIG Regional Conference 2012
Surveying towards Sustainable Development
Montevideo, Uruguay, 26 – 29 November 2012
17/21
5. CONCLUSIONS
In this paper a present assessment of the bike paths in Bogotá was developed. Various
characteristics of the network were analyzed, determining where the bike paths pass. The gaps
of the network were then identified and finally the results were reached using a GIS and a
multi-criteria analysis.
For the case study in Bogotá, the methodology identified that the bike paths serve only a
quarter of the places of work and two percent of the universities, indicating that the cover is
not sufficient in regard to the education and work-based trips. Three-quarters of the workers
in Bogotá don’t have the choice to use bicycles to go to work and must use other more
expensive modes of transport, which may be slower and less comfortable.
The majority of the access is attributed to the highest income level: almost 6% of the total
area of this income range has real access to the bike paths (distance less than 200m), whereas
for the same distance, approximately 2% of the first, third, fourth, and fifth strata boast
access. In both cases, the percentage remains very low. Moreover, as seen before, the poorest
should benefit first of those facilities, but we observed the contrary.
ArcGIS allowed us to obtain all the gaps of the network. With the method of weights exposed
above and the survey made to define those weights, we presented a map including all the data
we had analyzed. This map indicates where it is more useful for the user that the bike ways
pass. Superposing this map with the gaps identified, we could prioritize the gaps that are more
important to solve.
Regarding those weights, we only 4% was attributed to low criminality. Finally it appeared
that passing through the zones where population needs most those facilities (low income, high
population density, working places) was privileged against the problems that the bicyclists
can face (criminality, accidents, land use).
Results from this investigation suggest that the bike ways in Bogotá were not designed taking
into account the criteria studied in this paper. With a quick look at the literature, the
importance of those criteria is evident. The data and information we obtained is striking as
nothing is as expected and as it should be.
The methodology facilitates the identification of priority zones based on specific criteria.
These zones are a significant tool to take decisions concerning investment in the network
improvement and an option to encourage bicycle use. However, the prioritization is highly
dependent on expert knowledge and, therefore, limitations exist for using the methodology
widely in other countries.
Further research is proposed in enhancing the methodology to not only evaluating current
bicycle networks but also in identifying possible priority corridors for new infrastructure in
areas where cycling could be a feasible transport option.

TS07A - Spatial Planning and DRM - 6305
Álvaro Caviedes, Maïté Thirouin and Daniel Paez
A GIS methodology for improvement of cycling networks using cadastre and urban form information.
8th
FIG Regional Conference 2012
Surveying towards Sustainable Development
Montevideo, Uruguay, 26 – 29 November 2012
18/21
REFERENCES
Acevedo, J., Bocarejo, J. P., Lleras, G., & Rodriguez, Á. (2009). El transporte como soporte
al desarrollo de Colombia. Una visión al 2040. Bogotá: Universidad de los Andes.
Alcaldía Mayor de Bogotá, D. (2011). Encuesta de Movilidad de Bogotá 2011. Bogotá.
Bertolini, L., le Clercq, F., & Straatemeier, T. (2007). Urban transportation planning in
transition. Elsevier, Transport policy , 4.
Chowdhury, S., Abdel-Aty, M., & Chocoi, K. (2012). Macroscopic spatial analysis of
pedestrian and bicycle crashes. Science Direct , 9.
Correa, D. (2008). Consideraciones para el desarrollo de movilidad en bicicleta en Bogotá.
Bogotá: Universidad de los Andes.
Dawsey, J., & Arora, R. (s.f.). 15 best new cities for business. Recuperado el 21 de 08 de
2012, de CNN Money:
http://money.cnn.com/magazines/fortune/global500/2011/hottest_cities/
De Backer, M. (2010). Ville à Vélo. Paris: Bimestriel du Gracq.
ESRI. (2012). What is GIS? Recuperado el 25 de 08 de 2012, de ESRI.com:
http://www.esri.com/what-is-gis
GDS, D. G. (2010). Ánalisis de la red de ciclo-rutas de Bogotá, para evaluar las
características físicas y de comportamiento que permitan promover el uso seguro en Bogotá.
Bogotá.
Goodchild, M. F. (2010). Twenty years of progress: GISciense in 2010. Journal of spatial
information science , 3-17.
Handy, S. L., Xing, Y., & Buehler, T. J. (2010). Factors associated with bicycle ownership
and use: a study of six small U.S. cities. Springer, Transportation , 961-983.
Heinen, E., Maat, K., & van Wee, B. (2010). The role of attitudes toward characteristics of
bicycle commuting on the choice to cycle to work over various distances. Elsevier,
Transportation Research , 106.
Hsu, T., & Lin, Y. (2012). A model for planning a bicycle network with multi-criteria
suitability evaluation using GIS. WIT Transactions on ecology and the environment , 243-252.
Huang, Y., & Ye, G. (1995). Selecting Bicycle Commuting Routes Using GIS. Berkeley
planning journal , 17.
Kiyoshi, S., Yusuke, K., Kenji, D., & Nobu, T. (2012). Proposal and Application of a New
Method for Bicycle . Science Direct .

TS07A - Spatial Planning and DRM - 6305
Álvaro Caviedes, Maïté Thirouin and Daniel Paez
A GIS methodology for improvement of cycling networks using cadastre and urban form information.
8th
FIG Regional Conference 2012
Surveying towards Sustainable Development
Montevideo, Uruguay, 26 – 29 November 2012
19/21
Krizek, K., & Roland, R. (2005). What is at the end of the road? Understanding
discontinuities of on-street bicycle lanes in urban settings. Transportation research part D ,
55-68.
Martens, K. (2004). The bicycle as a feedering mode: experiences from three European
countries. Elsevier, Transportation Research , 281-294.
Mefford, C., & Griffith, T. (s.f.). bike walktwing cities. Recuperado el 20 de 08 de 2012, de
Using geographic information systems to design on-street Bicycle routes:
http://www.bikewalktwincities.org/sites/default/files/Using_GIS_to_Design_On-
street_Bicycle_Routes.pdf
Meyer, M., & Miller, E. Urban transportation Planning. Massachusetts.
Mosquera, J., Parra, D., Gomez, L., Sarmiento, O., Schmid, T., & Jacoby, E. (2012). An
inside look at active transport in Bogotá: A quialitative study. Reaxys Database Information .
Myungseob, K., Eungcheol, K., Jutaek, O., & Junwook, J. (2010). Critical factors associated
with bicycle accidents at 4-legged signalized urban intersections in South Korea. KSCE
journal of civil engineering, Springer .
Neutens, T., Delafontaine, M., Scott, D. M., & De Maeyer, P. (2012). A GIS-based method to
identify spatiotemporal gaps in public service delivery. Applied Geography , 253-264.
Office of Planning, E. &. (s.f.). Bicycle and Pederastian Program. Recuperado el 2012 de 07
de 30, de Federal Highway Administration:
http://www.fhwa.dot.gov/environment/bicycle_pedestrian/publications/sidewalk2/sidewalks2
14.cfm
Olson, D. L., Fliedner, G., & Currie, K. (1995). Comparision of the REMBRANDT system
with analytic hierarchy process. Elsevier, European Journal of Operational Research , 18.
Ortúzar. (2005). Crecimiento del parque automotor en contextos urbanos. Bogotá.
Páez, D., & Bocarejo, J. P. (2012). ANALYSIS OF DENSITY UNDER THE CONTEXT OF
SUSTAINABLE DEVELOPMENT IN DEVELOPING COUNTRIES. Sixth Urban Research
and Knowledge Symposium , 7-8.
Papinski, D., & Scott, D. (2010). A GIS-based toolkit for route choice analysis. Science direct
Pettinga, Á., Rouwete, A., Braakman, B., Pardo, C., Kuijper, D., Spapé, I., y otros. (2009).
Cycling-Inclusive Policy Development: A Handbook.
Pucher, J. (1996). Bicycle Boom in Germany:A Revival Engineered by Public Policy.
Transportation Quarterly , 31-46.

TS07A - Spatial Planning and DRM - 6305
Álvaro Caviedes, Maïté Thirouin and Daniel Paez
A GIS methodology for improvement of cycling networks using cadastre and urban form information.
8th
FIG Regional Conference 2012
Surveying towards Sustainable Development
Montevideo, Uruguay, 26 – 29 November 2012
20/21
Pucher, J., Dill, J., & Handy, S. (2009). Infrastructure , programs and policies to increase
bicycling: An international review. Elsevier, Preventive Medicine .
Rybarczyk, G., & Changshan, W. (2009). Bicycle facility planning using GIS and multi-
criteria decision analysis. Science Direct , 282-293.
Rybarczyk, G., & Changshan, W. (2009). Bicycle facility planning using GIS and multi-
criteria decision analysis. Science Direct , 12.
Shaw, S.-L. (2010). Geographic information systems for transportation: from a static past to a
dynamic future. Taylor and Francis Group , 129-140.
The World Bank. (2012). Recuperado el 21 de 09 de 2012, de
http://data.worldbank.org/country/colombia
Tolley, R. (1990). The greening of urban transport: planning for walking and cycling in
Western cities. WILEY.
Vandenbulcke, G., Thomas, I., de Geus, B., Degraeuwe, B., Torfs, R., Meussen, R., y otros.
(2009). Mapping bicycle use and the risk of accidents for commuters who cycle to work in
Belgium. Elsevier, Transport Policy .
Yigitcanlar, T., O'Connor, K., & Westerman, C. (2008). The making of knowledge cities:
Melbourne's knowledge-based urban development experience. Elsevier, CITIES .
Ziari, H., & Khabiri, M. (2010). Applied Gis software for improving pedestrian & bicycle
safety. Taylor & Francis , 6.

TS07A - Spatial Planning and DRM - 6305
Álvaro Caviedes, Maïté Thirouin and Daniel Paez
A GIS methodology for improvement of cycling networks using cadastre and urban form information.
8th
FIG Regional Conference 2012
Surveying towards Sustainable Development
Montevideo, Uruguay, 26 – 29 November 2012
21/21
CONTACTS
Álvaro Caviedes (corresponding author)
Universidad de los Andes
Carrera 1 N° 18A – 12
Bogotá
COLOMBIA
(+57)211 291 93 80
Maïté Thirouin
Universidad de los Andes
Carrera 1 N° 18A – 12
Bogotá
COLOMBIA
(+57)312 444 74 36
mm.thirouin118 @uniandes.edu.co
Daniel Paez
Universidad de los Andes
Carrera 1 N° 18A – 12
Bogotá
COLOMBIA
(+57)314 482 92 63
dpaez @uniandes.edu.co