a gis data-driven process for identifying rail ... · - 2 - a gis data-driven process for...
TRANSCRIPT

A GIS Data-Driven Process for Identifying Rail Infrastructure Improvements
Authors:
Kevin Ebright-McKeehan, Cambridge Systematics
Tom Murtha, Chicago Metropolitan Agency for Planning
c/o
Cambridge Systematics
115 S. LaSalle St., Suite 2200
Chicago, IL 60603
Phone: (312) 665-0236
Fax: (312) 346-9908
Chicago Metropolitan Agency for Planning (CMAP) 233 S. Wacker Dr., Suite 800 Chicago IL 60606 Phone: (312) 386-8790
- 2 -
A GIS Data-Driven Process for Identifying Rail Infrastructure Improvements
ABSTRACT
The identification of infrastructure critical to regional rail freight operations has many implications. Primarily, such a process informs policy-makers and directs funding to areas of high importance and/or greatest need. For the Chicago Metropolitan Agency for Planning (CMAP), analysts at Cambridge Systematics developed an infrastructure identification process designed to evaluate which key areas of the regional rail network likely require investment. The process utilized geographic information systems (GIS) tools and available public-sector data regarding regional rail movements to craft infrastructure investment recommendations to CMAP for further analysis.
The evaluation began with a blank slate, allowing the data to drive the initial stages of the project identification process and, thus, limiting assumption and bias. Analysts evaluated all rail infrastructure equally and key infrastructure were identified in a three-step process, with each step eliminating or refining potential improvements. Specifically, this data-driven process analyzed a number of variables: infrastructure usage, regional freight rail flows, the importance of specific infrastructure to the regional economy, geographic relationships, and stakeholder views. From all regional rail infrastructure, 14 improvement areas were recognized through this process as potential investments, including improvements for 11 specific rail corridors. As the analysis progressed, three classes of rail infrastructure improvements emerged – Rail Capacity Improvements, Recommended Rail Corridors for Capacity Study, and Increased Utilization. Each of the 14 improvements fall into one of these three classes. Additionally, 21 at-grade crossings and four road-rail viaducts were identified for consideration for investment.
INTRODUCTION
To help craft the Chicago region’s GO TO 2040 comprehensive plan, the Chicago Metropolitan Agency for Planning (CMAP) commissioned a study of the region’s freight system. The goal of this study was to identify transportation policies and infrastructure projects crucial for greater Chicago’s continued economic competitiveness. The identified infrastructure projects and policies provided in the report were then considered for inclusion into the long-range regional plan.
The rail transport mode underwent detailed evaluation. This paper details the goals, methodology, and results of the process undertaken by analysts to identify rail infrastructure important to the region’s freight movements and, by extension, the region’s economic competitiveness. The complex process utilized available public-sector datasets and geographic information systems (GIS) tools, while avoiding the expensive acquisition of privately-held data or the compilation of complex freight flow models. Further complicating the evaluation is the

- 3 -
presence of many Metra and Amtrak passenger trains operating on the region’s rail freight network.
The region’s railroad operators provided validation of the analysis results and gave exclusive operational insight to refine the final recommendations. Stakeholder validation proved especially valuable considering the challenges associated with a public-sector evaluation of a system operated and driven by private-sector forces. Despite these challenges, the high-level approach undertaken by analysts – coupling publically available data, GIS analysis, and stakeholder validation – still produced locally-relevant results cost effectively. And by focusing on data analysis and stakeholder validation, the study’s final rail infrastructure investment recommendations were based on a solid foundation with rail industry support. Importantly, the study was conducted within a framework of ongoing freight system development, including the Chicago Region Environment and Transportation Efficiency (CREATE) Program. The effect of this study was to propose beneficial projects in addition to those previously identified for implementation within the CREATE Program, rather than as an alternative.
The primary objective of this analysis is to define the components of the region’s rail system which support extensive economic activity and are in need of investment. To achieve this, a basic assumption was made concerning the link between transportation infrastructure and economic activity. Economic data suggests a strong positive correlation between investment in transportation infrastructure and economic growth (Aschauer, 1989), while other studies have demonstrated the relationship between infrastructure capacity, facility accessibility, and economic vitality (de Dios Ortuzar & Willumsen, 2004; Loo & Liu, 2005; Aoyama, et. al., 2006). Generally, a pattern emerges from these studies: increased investment in transportation infrastructure improves freight facility accessibility which in turn generates or supports robust economic activity.
Specifically, studies have found that an effective logistics industry supported by efficient infrastructure has the ability to drive regional economic growth (de Dios Ortuzar & Willumsen, 2004; Aoyama, et. al., 2006). The efficiency of transportation infrastructure is especially vital for inland hubs (Loo & Liu, 2005), including Chicago (Drummer, 2009), and their ability to export goods generated regionally. Such hubs are gaining primacy in logistics (Loo & Liu, 2005; Drummer, 2009), as are high-density rail corridors, for shippers and customers (Bezar, 1997). Lack of rail capacity at these hubs, however, is the primary cause of network congestion (Bezar, 1997). Further, the level of sophistication of the supporting transportation network is often a determining factor in a region’s economic vitality (Aoyama, et. al., 2006), as is the degree of accessibility to freight facilities and capacity (Bezar, 1997).
With the advent of just-in-time production and value-added freight servicing, investment which focuses on infrastructure connectivity or linkages can be far more effective than macroeconomic planning (Aoyama, et. al.; 2006). Value-added servicing, in particular, adds efficiency (Bezar, 1997) and, thus, economic value. An emphasis in planning on network and servicing connectivity is rare (Hesse & Rodrigue, 2004; Aoyama, et. al.; 2006). Our approach for this paper avoids travel modeling or commodity analysis in favor of spatial analysis of connectivity, accessibility, and economic data. Such an emphasis can be used to focus attention on infrastructure improvements designed to benefit a regional economy (Button, 1995; Loo & Liu, 2005; Aoyama, et. al.; 2006).

- 4 -
As this paper progresses, the ideas developed in these cited studies will be prominent; economic activity is related to infrastructure and facility performance. Future study, by industry of operational considerations of proposed improvements, addressing internal economic factors and leading up to a business case for development, as well as public sector consideration of external factors within large-scale regional models would be complementary to this study.
The remainder of this paper is organized as follows: An examination of the datasets used and processes employed is followed by detailed sections for each of the three steps in our analysis and a conclusion. Map exhibits, sources, and acknowledgements may be found after the conclusion.
CHICAGO REGIONAL RAIL NETWORK OVERVIEW MAP
Figure 1 (above) Map Information: CMAP Recommended Rail Project Evaluation: Regional Rail Network. Created using ESRI ArcInfo
desktop software, with data from CMAP and FRA.

- 5 -
DATA AND ANALYSIS TECHNIQUES
All data utilized in the infrastructure identification process is publicly available on the internet, with the exception of some economic data garnered from the study’s client – CMAP. No modeling or forecast data or privately collected datasets were procured for the rail infrastructure identification process. While this is not a traditional approach, each study will answer questions regarding appropriate sources of data (Longley, et. al., 2003; Maguire, et. al., 2005; DiBase, 2010). The decision to use publicly available data for this study followed a desire to reduce costs and to produce the best results possible with the best available information. Stakeholder validation from regional rail industry sources was employed on the back-end of the process as a check on the logical consistency of the results.
The procurement of rail freight flow modeling data or complex economic data has other downsides other than cost. Some consider freight movement models more complex than passenger travel models, yet “less advanced” (de Dios Ortuzar & Willumsen, 2004), thus clouding any results received from model runs. Critical to robust freight modeling is detailed knowledge of freight terminal capacity, terminal accessibility, regional land use, and typical industry rail movements, but often such data is not available due to private-sector secrecy (de Dios Ortuzar & Willumsen, 2004). Regardless of inputs, modeling outputs are often not compatible with native data formats or GIS and require time-consuming conversion (Maguire, et. al., 2005).
With these factors in mind, analysts decided not to undertake freight flow modeling in the rail infrastructure identification process, but instead rely on public data and GIS techniques. Data in support of this task was gathered from governmental sources, much of it publicly available and much of it from CMAP. Rail line data from the Federal Railroad Administration (FRA) was employed, while terminal and freight generation data came from CMAP. The latter datasets involved surveying the regional rail freight industry for data.
Similarly, all spatial analysis processes may be performed with software from the Environmental Systems and Research Institute (ESRI), specifically an ArcInfo desktop license at a minimum, using GIS techniques. ESRI’s suite of GIS software is the most widely used and accessible commercial geospatial software platform in use today (Foundyller, 2009). The techniques call upon ArcInfo’s advanced analysis toolsets.
Spatial analysis provides the basis for all complex GIS functions (Longley, et. al., 2003). The spatial analysis tools used here fall under four of the six analysis groups as described by some geospatial professionals: descriptive summaries, measurements, queries/reasoning, and transformations (Longley, et. al., 2003). Each stage of the three-step infrastructure identification process utilized some combination of these four spatial analysis categories. Stage 1 – Understanding Regional Freight Rail Flows – employed all four in an attempt to develop a baseline consideration of freight rail movement through the Chicago region. Such an application of spatial analysis techniques is referred to by some as an exploratory spatial data analysis (ESDA) (Maguire, et. al., 2005). While this paper will not reproduce the spatial analysis processes deployed, the processes used in this study are found in the Analysis and Spatial Statistics toolsets in ESRI’s ArcToolbox. An ESRI Spatial Analyst license is not necessary to perform the types of

- 6 -
geoprocessing involved in this study. Instead, the processes employed are congruent to the standard ArcInfo desktop.
The geospatial techniques employed in this study also build upon the work done in prior rail infrastructure studies (Loo & Liu, 2005). On the whole, the spatial analyses consider capacity, accessibility, and location in regards to the rail network, components considered to be keystones for any network analysis. Intermodal centers and freight generators are given particular consideration, even though each often serves very different roles (Loo & Liu, 2005). Containerized intermodal centers capture international and transcontinental commerce and reflect a region’s logistical sophistication, while freight generators reflect the strength of a region’s economic hinterland (Loo & Liu, 2005). Spatial and statistical weights were applied to larger facilities as freight gravitates toward high-density facilities (Bezar, 1997). Network link length and aspect also factor into the spatial analysis in congruence with other rail studies which measure the potential of infrastructure to contribute to the regional logistics system (Loo & Liu, 2005; Aoyama, et. al.; 2006).
All of these types of spatial analyses are employed through the three-step process used to identify rail infrastructure in need of investment.
• Step 1 - Understanding Regional Freight Flows: Analysts develop an understanding of regional freight rail flows to determine the primary functions of the freight rail system.
• Step 2 – Identifying Potential Infrastructure Projects: Once analysts derive a basic understanding of the regional rail system, operational priorities are established. Infrastructure serving these priorities are identified and areas for potential investment are defined.
• Step 3 – Final Infrastructure Project List and Recommendations: Potential projects are ranked. The best performers are kept and a list of final recommendations is compiled for stakeholder review.
Each of these steps is described in more detail in the following sections.
STEP 1: UNDERSTANDING REGIONAL FREIGHT RAIL FLOWS
Prior to the identification of critical infrastructure investments, a baseline understanding of rail is required. To understand the fundamentals of the region’s rail freight network, a data-driven process was undertaken using available data resources and GIS tools. This investigation sought to ascertain how rail freight moved within the region and accessed local intermodal facilities. Once these elements were understood by analysts, potential infrastructure improvements were evaluated for their importance to the freight flow patterns revealed in the process. Notable findings from this process include:
• A regional pattern of east-west freight movement, which generally parallels truck traffic. This pattern is weighted at rail segment level by FRA density.
- 7 -
• High rail line density clustering around transcontinental rail lines and belt lines and in Cook County.
• Low rail line density running west-northwest out of Chicago toward Elgin, generally paralleling the east-west transcontinental railroads of the Union Pacific (UP) and Burlington Northern Santa Fe (BNSF). The Canadian National (CN) Freeport subdivision anchors this low-density area.
• A tight clustering of high-capacity intermodal facilities near transcontinental rail lines and belt lines, thus, in high rail density areas.
• A spatial distribution of intermodal facilities beginning in central Cook County and spreading southwestward along the Chicago Sanitary and Ship Canal. This distribution is weighted by lifts.
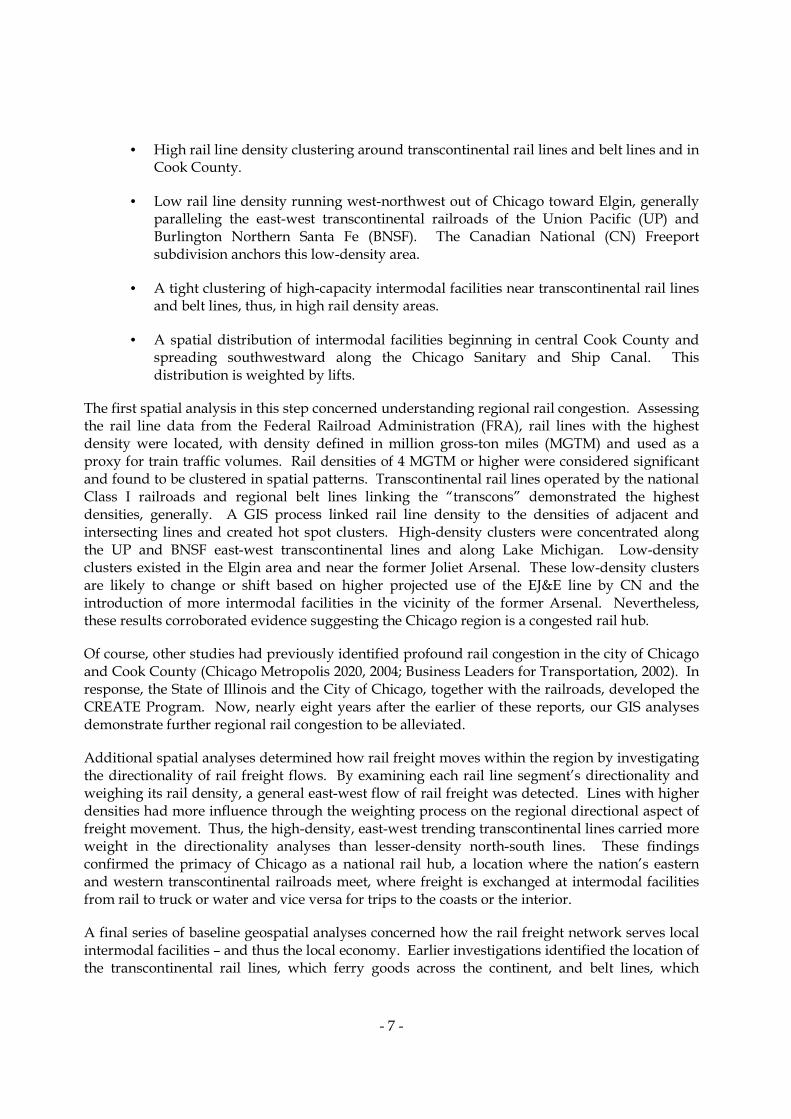
The first spatial analysis in this step concerned understanding regional rail congestion. Assessing the rail line data from the Federal Railroad Administration (FRA), rail lines with the highest density were located, with density defined in million gross-ton miles (MGTM) and used as a proxy for train traffic volumes. Rail densities of 4 MGTM or higher were considered significant and found to be clustered in spatial patterns. Transcontinental rail lines operated by the national Class I railroads and regional belt lines linking the “transcons” demonstrated the highest densities, generally. A GIS process linked rail line density to the densities of adjacent and intersecting lines and created hot spot clusters. High-density clusters were concentrated along the UP and BNSF east-west transcontinental lines and along Lake Michigan. Low-density clusters existed in the Elgin area and near the former Joliet Arsenal. These low-density clusters are likely to change or shift based on higher projected use of the EJ&E line by CN and the introduction of more intermodal facilities in the vicinity of the former Arsenal. Nevertheless, these results corroborated evidence suggesting the Chicago region is a congested rail hub.
Of course, other studies had previously identified profound rail congestion in the city of Chicago and Cook County (Chicago Metropolis 2020, 2004; Business Leaders for Transportation, 2002). In response, the State of Illinois and the City of Chicago, together with the railroads, developed the CREATE Program. Now, nearly eight years after the earlier of these reports, our GIS analyses demonstrate further regional rail congestion to be alleviated.
Additional spatial analyses determined how rail freight moves within the region by investigating the directionality of rail freight flows. By examining each rail line segment’s directionality and weighing its rail density, a general east-west flow of rail freight was detected. Lines with higher densities had more influence through the weighting process on the regional directional aspect of freight movement. Thus, the high-density, east-west trending transcontinental lines carried more weight in the directionality analyses than lesser-density north-south lines. These findings confirmed the primacy of Chicago as a national rail hub, a location where the nation’s eastern and western transcontinental railroads meet, where freight is exchanged at intermodal facilities from rail to truck or water and vice versa for trips to the coasts or the interior.
A final series of baseline geospatial analyses concerned how the rail freight network serves local intermodal facilities – and thus the local economy. Earlier investigations identified the location of the transcontinental rail lines, which ferry goods across the continent, and belt lines, which
- 8 -
provide crucial connectivity between all transcons. Invariably, most regional intermodal facilities have immediate or near-immediate access to transcontinental rail lines or belt lines. Approximately half of all intermodal facilities have access within one-half mile of a transcon or belt line. Nearly all of the remainder are within three miles. This confirmed the importance of these lines to the regional economy, as transcons and belt lines represent the delivery method for rail freight into, out of, within, and through the region.
Further intermodal facility analysis revealed a geographic clustering of sites within areas with high rail density, specifically within the city of Chicago, near O’Hare Airport, along the Chicago Sanitary and Ship Canal, and generally throughout Cook County. A GIS hot spot cluster analysis which weighted 2006 lifts at each facility detected a southwest-northeast trending cluster extending from near the lakeshore in central Chicago along the canal to near Lemont. The hot spot epicenter, as determined through another GIS process, occurs nearly atop BNSF’s Corwith Yard. All of these analyses suggest a clustered distribution of intermodal facilities in the areas with the highest rail density, highest concentration of freight generators, and notable industrial land use areas.
STEP 2: IDENTIFYING POTENTIAL INFRASTRUCTURE PROJECTS
With an understanding of how rail freight moves within the region, critical rail infrastructure can be identified and recommended for investment. All rail infrastructure was considered individually, initially, and then either removed from consideration or carried forward in the process based on a set of consistent spatial criteria employed in a two phase process.
The first phase involved removing infrastructure which did not address the regional rail findings from step 1. Rail segments or facilities not serving the general east-west trending movement of freight, not servicing an intermodal facility, or carrying the potential to relieve congestion in high-density clusters were removed. Regarding the latter, a previous study in China found potential opportunities for investment where low-density rail corridors served a market similar to a high-density corridor (Bezar, 1997). The study found these investments presented opportunities for efficiencies, rather than redundancy. Thus, in this study, some low-density lines are deemed to be of value to the flow of rail freight, particularly the CN Elsdon and Freeport subdivisions, and could be utilized to relieve rail densities on adjacent lines. Additional infrastructure were removed if currently being upgraded through the Chicago Regional Environmental and Transportation Efficiency Program (CREATE), or other improvements. This process removed all but 22 infrastructure corridors.
In the second phase, the remaining 22 corridors were more thoroughly evaluated on their importance to intermodal facilities. GIS tools were used to assess the corridors on their proximity to these facilities and their significance to intermodal traffic. Data considered in this evaluation included spatial proximity of rail lines to intermodal facility clusters, access to high-volume intermodal sites, and the rail density around intermodal centers, among other data. After initial corridor appraisals, the preliminary results were presented to CMAP staff for continued refinement. From the list of 22 potential corridor investments, 17 were selected for continued evaluation based on this data analysis.

- 9 -
STEP 3: FINAL INFRASTRUCTURE PROJECT LIST AND RECOMMENDATIONS
The third and final evaluation step examined the remaining 17 infrastructure improvements on a battery of economic performance measures using GIS tools. The performance measures regarding rail freight concentrated on regional economic development and access to freight facilities. Three performance measures were of particular importance: 1) Intermodal facilities with NHS roadway/rail access; 2) Major generators near interstate, four-lane highway, or intermodal facility; and 3) Value of goods exported annually vs. value of goods imported. To determine the relationship between infrastructure and each measure, analysts developed an evaluation scheme involving five grades ranging from “Very Strong Relationship” to “Little or No Relationship.” Through data analysis, infrastructure segments demonstrating a strong performance to a particular measure received a higher grade.
For the intermodal facility/rail access performance measure, potential improvements were graded by developing a series of spatial buffers surrounding facilities. This process drew a more detailed correlation between infrastructures and particular intermodal facilities than the analysis discussed above in phase two. To determine the relationship between infrastructure and major freight generators, sales and employment figures for any business generating freight traffic were examined. Hot spot clusters were developed using both sales figures and the numbers of employees as weights in the analysis. From these clusters, spatial buffers were established to ascertain the grades for infrastructure improvements. And finally, the grading method regarding the value of goods exported was conducted by creating clusters and buffers around manufacturing business, industrial land use areas, and industrial and enterprise zones.
Analysts generating the grades for the remaining 17 infrastructure investments discarded low performing projects. As the final list of improvements matured, feedback from stakeholders, primarily representatives of the railroad industry and those closely involved in the CREATE program, was solicited. Based on conversations with these stakeholders, the list of infrastructure improvements was refined. Stakeholders assisted in better defining the extents of identified projects and suggested adding a few projects not identified previously. The stakeholders validated the initial results of the three-phase evaluation process and provided confidence in the final results. The resulting list of recommended improvements included nine corridors requiring capacity study, and two corridors which could bear increased utilization, for a total of 11 specific infrastructure projects. Three more overall rail capacity investments, including improving capacity within intermodal yards and preserving land for intermodal development, yielded a total of 14 recommendations.
EVALUATION OF AT-GRADE RAIL CROSSINGS AND VIADUCTS
Poor performing at-grade rail crossings have the potential to delay freight traffic on roads and rail. Some of these rail crossings are hazardous for train crews, truck drivers, freight facility employees, and the general public. Similarly, antiquated rail viaducts are barriers to the efficient routing of freight in the region. Height, weight, and speed restrictions underscore the delays and dangers associated with deteriorating or outmoded viaducts. Poor performing at-grade crossings

- 10 -
and viaducts are a drag on the regional freight network. Thus, criteria were developed to evaluate which – if any – crossings and viaducts needed investment.
There exist hundreds of problematic at-grade rail crossings in the region, places where delay potential is high and casualty prediction rates are above the mean. Identifying which problematic at-grade rail crossings are critical to freight involved a thorough examination of rail crossing data – and data methodology – from the FRA Office of Safety Analysis and other sources. The first set of analyses focused on distilling the nearly 4,000 regional rail crossings into a dataset containing crossings with the potential for very high-delays. Database queries located crossings which had high vehicle volumes, high train counts, and low maximum train speeds. Crossings with very high casualty prediction were also examined. From these queries, a working list of over 100 at-grade rail crossings were developed and served as a baseline. Analysts then performed a series of analyses on these crossings, flagging those crossing on freight intermodal connectors, truck routes, or highways. Crossings were also evaluated against five CMAP-recommended performance measures. These measures included:
• Proximity to intermodal facilities with National Highway System (NHS) roadway or rail access
• Proximity to major freight generators near interstate, four-lane highway or intermodal facility
• Ability increase value of goods exported annually versus value of goods importeda
• Vehicle-miles of delay for at-grade crossings
• Exposure (truck volume and daily trains) factor for rail crossings
The final list of crossings underwent stakeholder reviews by local freight groups, representatives of area railroads, and CMAP staff. Ultimately, 21 at-grade crossings were selected for study. While this analytical process identified problematic at-grade rail crossings, it did not make recommendations for mitigation. While there exists a variety of means to alleviate the problematic at-grade rail crossings, not all require grade separation. This list of 21 at-grade crossings provides policymakers and stakeholders with a starting point from which to craft appropriate, individualized measures for each site.
For viaducts, Chicago Metropolis 2020 provided a list of height-restricted and decaying structures as identified in their freight system study “The Metropolis Freight Plan: Delivering the Goods.” The viaducts selected for evaluation included road-rail viaducts with a posted height of less than 14 feet. Viaducts with a height of less than 13.5 feet were flagged for special consideration. To determine which viaducts are most critical to the regional freight network, analysts identified structures on freight-oriented roads and rail, specifically those serving freight intermodal connectors, truck routes, or other roads with high truck volumes. Additionally, viaducts carrying rail lines which primarily serve freight concerns were flagged during evaluation. Since many viaducts used by Metra are slated for improvement in the latest TIP, Metra viaducts generally were avoided in the analysis. One Metra viaduct was retained – on Irving Park Road at the UP Harvard subdivision – due to the road’s elevated truck volume and crucial role in the movement of freight on Chicago’s North Side. Once the list of important viaducts was established, analysts compared them against three CMAP-generated performance measures, which were identical to the at-grade rail crossing measures with the exception of delay

- 11 -
and exposure factor. Poor performers were eliminated, resulting in the identification of four problematic viaducts critical to the regional movement of freight.
CONCLUSION
Public-sector data – most of it widely available – and solid GIS spatial analysis techniques can produce a high-level analysis of rail infrastructure that is also locally relevant, minimizing cost and complexity. Using this approach, Cambridge Systematics analysts working in concert with CMAP undertook an examination of the Chicago region’s rail network to determine infrastructure critical to the region’s economic competitiveness. The process developed by analysts indentified 14 rail infrastructure improvements: 9 rail corridors requiring capacity studies, 3 rail capacity improvements, and 2 under-capacity corridors for increased utilization. An additional 21 at-grade rail crossings and 4 rail-road viaducts were also marked for investment. Thus, the process provided CMAP with a regional blueprint from which to begin long-range freight rail transportation planning.
- 12 -
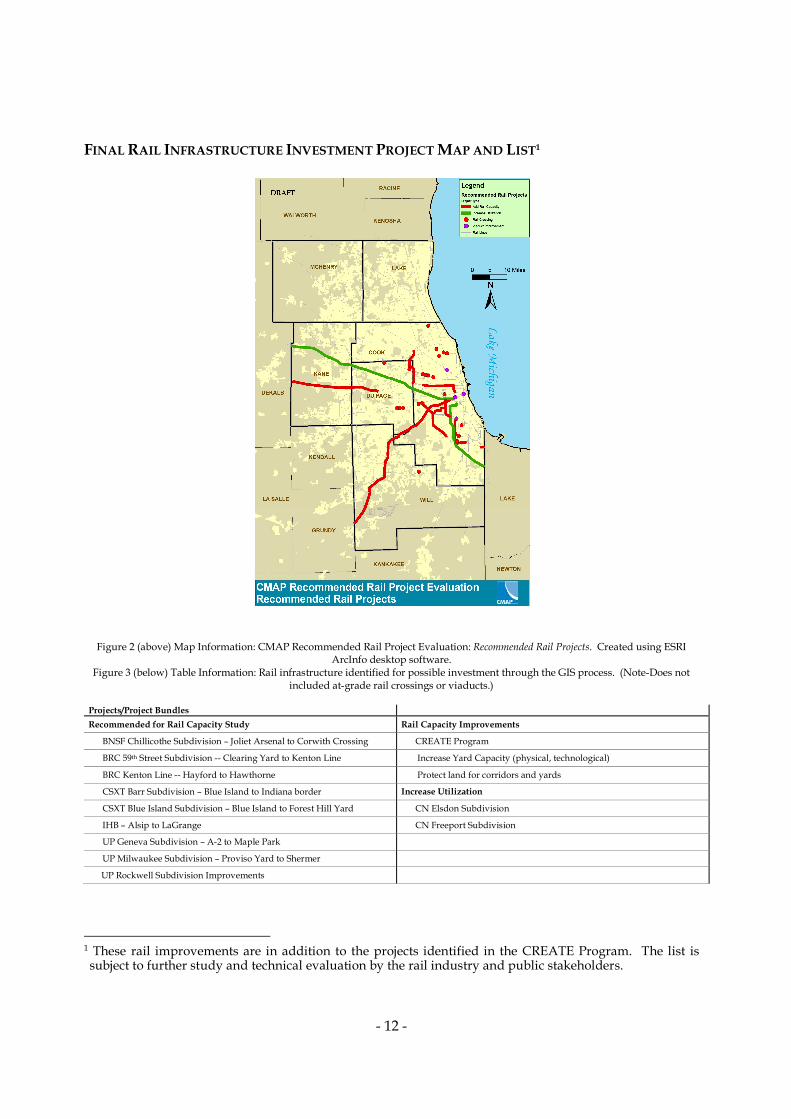
FINAL RAIL INFRASTRUCTURE INVESTMENT PROJECT MAP AND LIST1
Figure 2 (above) Map Information: CMAP Recommended Rail Project Evaluation: Recommended Rail Projects. Created using ESRI ArcInfo desktop software.
Figure 3 (below) Table Information: Rail infrastructure identified for possible investment through the GIS process. (Note-Does not included at-grade rail crossings or viaducts.)
Projects/Project Bundles
Recommended for Rail Capacity Study Rail Capacity Improvements
BNSF Chillicothe Subdivision – Joliet Arsenal to Corwith Crossing CREATE Program
BRC 59th Street Subdivision -- Clearing Yard to Kenton Line Increase Yard Capacity (physical, technological)
BRC Kenton Line -- Hayford to Hawthorne Protect land for corridors and yards
CSXT Barr Subdivision – Blue Island to Indiana border Increase Utilization
CSXT Blue Island Subdivision – Blue Island to Forest Hill Yard CN Elsdon Subdivision
IHB – Alsip to LaGrange CN Freeport Subdivision
UP Geneva Subdivision – A-2 to Maple Park
UP Milwaukee Subdivision – Proviso Yard to Shermer
UP Rockwell Subdivision Improvements
1 These rail improvements are in addition to the projects identified in the CREATE Program. The list is subject to further study and technical evaluation by the rail industry and public stakeholders.

- 13 -
OTHER ANALYTICAL MAPS GENERATED IN STUDY
Figure 4 (left) Map Information: CMAP Recommended Rail Project Evaluation: Intermodal + High Density Hot Spots. Created using
ESRI ArcInfo desktop software. This maps shows clusters of rail line density plus the locations of intermodal facilities. Figure 5 (right) Map Information: CMAP Recommended Rail Project Evaluation: Intermodal/Freight/Land Use Proximity. Created using
ESRI ArcInfo desktop software. This map shows the many different geospatial performed in Stage 3, with analysts using spatial analysis to evaluate the connectivity between major freight generators, industrial land use, truck routes, intermodal facilities, and rail
lines.
- 14 -
SOURCES Aschauer, D.A. (1989). Is Public Expenditure Productive? Journal of Monetary Economics. Vol. 23, Issue 2. Retrieved May 12, 2010 from http://www.sciencedirect.com.ezaccess.libraries.psu.edu/science
Aoyama, Y.; Ratick, S.; Schwarz, G. (2006). Organizational Dynamics of the U.S. Logistics Industry: An Economic Geography Perspective. The Professional Geographer. Vol. 58, No. 3.
Bezar, F.A. (1997). The Emerging Intermodal Market in China. Transportation & Distribution. Vol. 38, Issue 12.
Business Leaders for Transportation (2002). Critical Cargo.
Button, K. (1995). “Transport Terminals, Interchanges and Economic Development.” Transport and Urban Development. Edited by David Banister. London: E&FN Spon.
Chicago Metropolis 2020. (2004) The Metropolis Freight Plan: Delivering the Goods.
Chicago Operating Rules Association (2000). Chicago Terminal District Map. Hammond, IN, and Chicago, IL. Indiana Harbor Belt & Belt Railway of Chicago.
De Dios Ortuzar, J.; & Willumsen, L.G. (2004). Modeling Transport. Hoboken, N.J. John Wiley & Sons, Inc.
DiBiase, D. (2010). Nature of Geographic Information. The Pennsylvania State University. Retrieved May 12, 2010 from https://www.e-education.psu.edu/natureofgeoinfo/
Drummer, R. (2009). Report: Fuel Costs, New Infrastructure Reshaping US Industrial Supply Chain. In the Pipeline; April 29, 2009. Retrieved May 12, 2010 from http://www.costar.com/News/Article.aspx?id=157C81E78D3115611FC6DEB0489BDA8E
Foundyller, C. (2009). GIS/Geospatial Industry Worldwide Growth Slows to 1% in 2009. Directions Magazine. August 29, 2009. Retrieved May 12, 2010 from http://www.directionsmag.com/press.releases/?duty=Show&id=36318
Hesse, M.; & Rodrigue, J-P. (2004). The Transport Geography of Logistics and Freight Distribution. Journal of Transport Geography. Vol. 12, Issue 3
Kaplan, D.H.; Wheeler, J.O.; & Holloway, S.R. (2004). Urban Geography. Hoboken, N.J. : John Wiley & Sons, Inc.
Longley, P.A.; Goodchild, M.F.; Maguire, D.J.; & Rhind, D.W. (2003). Geographic Information Systems and Science. New York. John Wiley & Sons, Inc.
Loo, B.P.Y.; & Liu, K. (2005). A Geographic Analysis of Potential Railway Load Centers in China. The Professional Geographer. Vol. 57, No. 4.
Maguire, D.J.; Batty, M.; & Goodchild, M.F. (2005). GIS, Spatial Analysis, and Modeling. Redlands, Calif.: ESRI Press.

- 15 -
ACKNOWLEDGEMENTS
The authors wish to express their gratitude to the following individuals and organizations:
From Cambridge Systematics, Inc.: Andreas Aeppli, Dan Beagan, Erik Cempel, Kimon Proussaloglou, Barb Sloan, Monique Urban, Sam Van Hecke, Audrey Wennink, Erika Witzke.
From the Chicago Metropolitan Agency for Planning: Randy Blankenhorn, Jill Leary, Don Kopec, and Bob Dean for their support of this project.
Others: Chicago Metropolis 2020, members of the CTCO/CMAP Freight Committee, including, but not limited to, Larry Wilson, Tom Zapler, Jeff Harris, Scott Kuhner, and the region’s railroads.
For Kevin: Amy, Kellan, and Finn.