a gis and transportation optimization model approach to
TRANSCRIPT

A GIS and Transportation Optimization Model Approach to Determining Highway
and Rural Road Commodity Flows
EWITS Working Paper Number 3 April 1996
by
John Ellis and Eric L. Jessup Department of Agricultural Economics
and
Ken Casavant, EWITS Project Director
Washington State University Department of Agricultural Economics
103 Hulbert Hall Pullman, WA 99164-6210
EWITS Research Reports: Background and Purpose
This report is the third in a series of Working Papers (current topics related to the mission of the Eastern Washington Intermodal Transportation Study (EWITS)) to accompany EWITS reports providing information on the multimodal network necessary for the efficient movement of both freight and people into the next century. EWITS is a six-year study funded jointly by the Federal government and the Washington State Department of Transportation as a part of the Intermodal Surface Transportation Efficiency Act of 1991. Dr. Ken Casavant of Washington State University is Director of the study. A state-level Steering Committee provides overall direction pertaining to the design and implementation of the project. The Steering Committee includes Jerry Lenzi, Regional Administrator (WSDOT, Eastern Region); Richard Larson (WSDOT, South Central Region); Don Senn (WSDOT, North Central Region); Charles Howard (WSDOT, Planning Manager), and Jay Weber (Douglas County Commissioner). Pat Patterson represents the Washington State Transportation Commission on the Steering Committee. An Advisory Committee with representation from a broad range of transportation interest groups also provides guidance to the study. The following are key goals and objectives for the Eastern Washington Intermodal Transportation Study:
• Facilitate existing and state-wide transportation planning efforts
• Forecast future freight and passenger transportation service needs for eastern Washington
• Identify gaps in eastern Washington’s current transportation infrastructure
• Pinpoint transportation system improvement options critical to economic
competitiveness and mobility within eastern Washington For additional information about the Eastern Washington Intermodal Transportation Study or this Working Paper, please contact Ken Casavant at the following address:
Ken Casavant, Project Director Department of Agricultural Economics
Washington State University Pullman, WA 99164-6210
(509) 335-1608

DISCLAIMER The contents of this report reflect the views of the authors, who are responsible for the facts and accuracy of the data presented herein. The contents do not necessarily reflect the official views or policies of the Washington State Department of Transportation or the Federal Highway Administration. This report does not constitute a standard, specification, or regulation.
EWITS PREVIOUS REPORTS NOW AVAILABLE
1. Gillis, William R. and Kenneth L. Casavant. "Linking Transportation System Improvements to New Business Development in Eastern Washington.” EWITS Research Report Number 1. February 1994.
2. Gillis, William R. and Kenneth L. Casavant. "Lessons from Eastern
Washington: State Route Mainstreets, Bypass Routes and Economic Development in Small Towns.” EWITS Research Report Number 2. February 1994.
3. Gillis, William R. and Kenneth L. Casavant. "Washington State Freight Truck
Origin and Destination Study: Methods, Procedures, and Data Dictionary.” EWITS Research Report Number 3. December 1994.
4. Gillis, William R. and Kenneth L. Casavant. "Major Generators of Traffic on
U.S. 395 North of Spokane: Including Freight Trucks and Passenger Vehicles Crossing the International Border.” EWITS Research Report Number 4. January 1995.
5. Newkirk, Jonathan, Ken Eriksen, and Kenneth L. Casavant. "Transportation
Characteristics of Wheat and Barley Shipments on Haul Roads To and From Elevators in Eastern Washington.” EWITS Research Report Number 5. March 1995.
6. Jessup, Eric and Kenneth L. Casavant. "A Quantitative Estimate of Eastern
Washington Annual Haul Road Needs for Wheat and Barley Movement.” EWITS Research Report Number 6. March 1995.
7. Willis, William R., Emily Gruss Gillis, and Kenneth L. Casavant.
"Transportation Needs of Eastern Washington Fruit, Vegetable and Hay Industries.” EWITS Research Report Number 7. March 1995.
8. Casavant, Kenneth L. and William R. Gillis. "Importance of U.S. 395 Corridor
For Local and Regional Commerce in South Central Washington.” EWITS Research Report Number 8. April 1995.

9. Gillis, William R., Eric L. Jessup, and Kenneth L. Casavant. "Movement of Freight on Washington's Highways: A Statewide Origin and Destination Study.” EWITS Report Number 9, November 1995.
10. Chase, Robert A. and Kenneth L. Casavant. "Eastern Washington Transport-
Oriented Input-Output Study: Technical Report.” EWITS Research Report Number 10. March 1996.
11. Chase, Robert A. Kenneth L. Casavant. "The Economic Contribution of
Transport Industries to Eastern Washington.” EWITS Report Number 11. April 1996.
EWITS Previous Working Paper Series Now Available
1. Lee, Nancy and Ken Casavant. "Grain Receipts at Columbia River Grain Terminals.” EWITS Working Paper # 1, March 1996.
2. Lenzi, Jerry, Eric Jessup, and Ken Casavant. "Prospective Estimates for Road
Impacts in Eastern Washington from a Drawdown of the Lower Snake River.” EWITS Working Paper #2, March 1996.

Table of Contents Introduction ................................................................................................................... 1 Required Data ................................................................................................................ 1 Procedures .................................................................................................................... 3 Results ........................................................................................................................... 7 Conclusions................................................................................................................. 10 Base Scenario Assumptions ...................................................................................... 11 Further Assumptions for No-Barge Scenario ........................................................... 11 Observations from Initial Linear Programming Effort.............................................. 12 Still to Do ..................................................................................................................... 12 Notes and Observations Concerning the Analysis .................................................. 13 EWITS GIS Accomplishments .................................................................................... 14
List of Figures Figure 1 Eastern Washington Study Area..................................................................... 2 Figure 2 Routes to Snake and Columbia River Ports ................................................... 2 Figure 3 Adams County Roads..................................................................................... 3 Figure 4 Flowchart of Methodology .............................................................................. 6 Figure 5 Adams County Optimal Wheat Flows Base Scenario..................................... 8 Figure 6 Adams County Optimal Wheat Flows No-Barge Scenario.............................. 9 Figure 7 Adams County Optimal Barley Flows ............................................................. 9
List of Tables Table 1 Results ......................................................................................................... 17

Introduction Applied transportation analyses are relying more and more on advanced technologies such as Geographic Information Systems (GIS) to handle the large amounts of data implicit to such studies. This paper presents the methodologies employed in an applied analysis, which weds the use of a GIS and a classical least cost transportation optimization model. The context is that of an applied policy study examining the impacts on the roads and highways of Eastern Washington of a potential removal of barge traffic on the Snake River within that state. Such a ban is one option being considered to possibly aid several endangered species of salmon in migrating from their spawning grounds in the Upper Snake drainage to the Pacific (Hamilton, et. al). Faster running water is thought to possibly reduce mortality rates in migrating salmon smelts. Grain producers in the eastern two-thirds of Washington State, however, rely heavily on the lock and dam system on both the Columbia and Snake Rivers to transport their grain to ocean ports in Portland, Oregon and Vancouver, Washington, and any interruption in that system could impact greatly on their costs of marketing grain. The study presented is a preliminary one involving one county (Adams County) out of twenty currently under study in the overall Eastern Washington Intermodal Transportation Study (EWITS) project, and has been jointly funded by the Washington State Department of Transportation and Federal ISTEA funds (Figure 1). EWITS has multiple components with a major facet being to depict the transportation system of the region as closely as possible and to perform various policy analyses. Figure 2 portrays the Adams county location in the overall study area and routes to the Snake and Columbia Rivers. An additional goal of the study is to construct a least cost transportation optimization model, taking into account alternative transportation modes, for the agricultural sector of Eastern Washington.
Required Data A tremendous amount of data was required to accurately depict the ag transportation system of Eastern Washington. The state DOT provided GIS coverages as INTERGRAPH files for the major county, state, U.S. and Interstate Highways. Grain shipments, however, originate at remote locations throughout the region and numerous additional road coverages were obtained using U.S. census data (TIGER files). Detailed data concerning grain elevator locations, capacities, handling and storage rates, crop yields, modal availability, and grain movement were also required. A brief survey (Newkirk, et. al) was sent out to each of the 400 plus grain elevators in the study area requesting detailed information on the topics outlined above and a greater than 90% return rate was achieved. This information was then combined with detailed data concerning 1994 planted acreage of wheat and barley enrolled in the U.S. government farm programs. The Farm Services Administration (FSA) administers these programs and the state office in Spokane, Washington provided raw data concerning planted acreage for wheat and barley. Over 33,000 individual records were examined to determine the township and range location for each field enrolled in the region. Additional data required included the location of on-farm grain storage bins. The U.S. Soil Conservation Service, which has in the past cost shared in building such bins, and county tax assessor-collectors, were consulted as to the location and capacity of these structures. Barge, rail, and truck rates were also collected from public sources of information as well as within the elevator survey.
1

Figure 1: Eastern Washington Study Area
Figure 2: Routes to Snake and Columbia River Ports
2
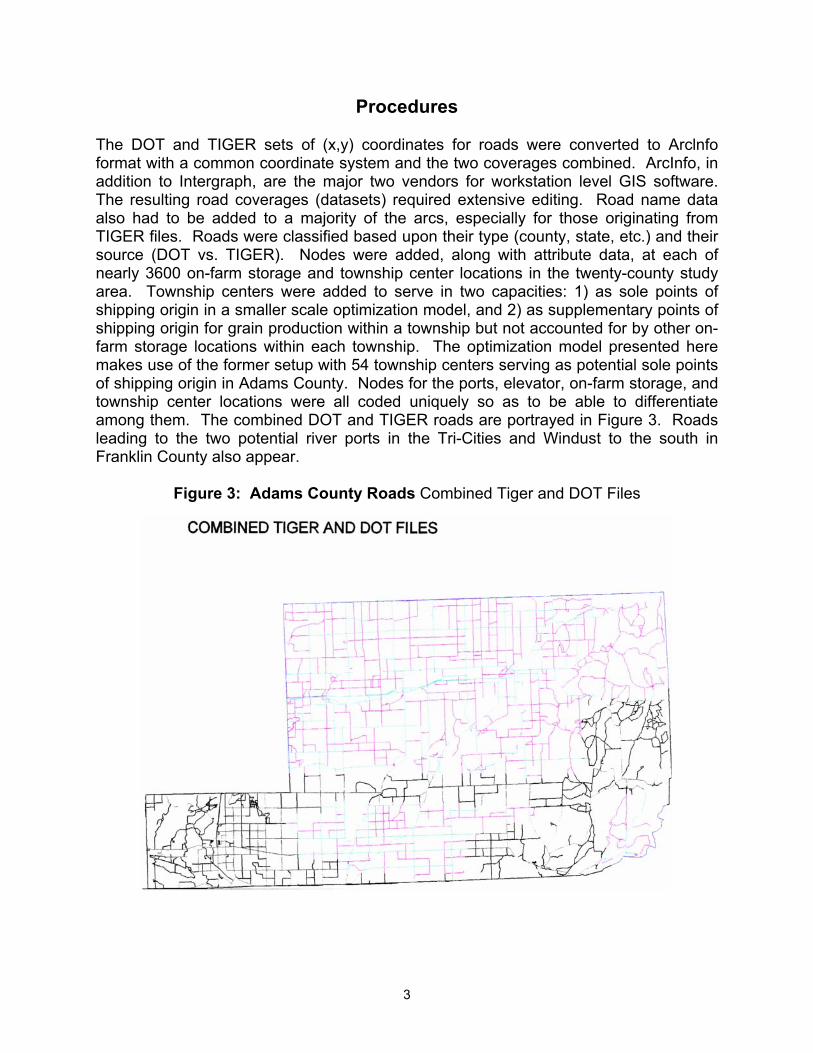
Procedures The DOT and TIGER sets of (x,y) coordinates for roads were converted to Arclnfo format with a common coordinate system and the two coverages combined. ArcInfo, in addition to Intergraph, are the major two vendors for workstation level GIS software. The resulting road coverages (datasets) required extensive editing. Road name data also had to be added to a majority of the arcs, especially for those originating from TIGER files. Roads were classified based upon their type (county, state, etc.) and their source (DOT vs. TIGER). Nodes were added, along with attribute data, at each of nearly 3600 on-farm storage and township center locations in the twenty-county study area. Township centers were added to serve in two capacities: 1) as sole points of shipping origin in a smaller scale optimization model, and 2) as supplementary points of shipping origin for grain production within a township but not accounted for by other on-farm storage locations within each township. The optimization model presented here makes use of the former setup with 54 township centers serving as potential sole points of shipping origin in Adams County. Nodes for the ports, elevator, on-farm storage, and township center locations were all coded uniquely so as to be able to differentiate among them. The combined DOT and TIGER roads are portrayed in Figure 3. Roads leading to the two potential river ports in the Tri-Cities and Windust to the south in Franklin County also appear.
Figure 3: Adams County Roads Combined Tiger and DOT Files
3

Once the arcs and nodes were coded, the network and dynamic segmentation aspects of Arclnfo could be used to build an origin-destination minimum distance table for various pairs of node types. More explicitly, the NODEDISTANCE command was used within an AML (Arc Macro Language) program to build a table with the minimum distance between each township center and say, all elevators within a hundred miles. This process was then repeated to construct a similar table with minimum distances from township centers to elevators with rail and from elevators to ports. Once obtained, these tables could be sorted by node of origin and distance and a subset chosen for each point of origin to build a table, for example, for the nearest 3 elevators from each point of origin. The PATH command in Arclnfo was then used for each pair of nodes in the reduced origin-destination table to create a uniquely numbered route (collection of arcs). These routes serve as data organization tools with which one may keep track of which arcs lie along a minimum distance path for each origin-destination node pair. The unique route number, route distance, plus node numbers and user defined site names for each node (i.e., route # 45, 34.2 miles, origin nod e# 456 for township 20-48, and destination node # 245 for elevator 104A at Washtucna) were then exported to an external database program for eventual use in the GAMS optimization program (Brooke, et. al). This data was combined with cost data for storage, handling and mode transport costs to determine a cost coefficient for each route. For example, one would combine the cost of truck transport for the 34.2 miles from township 20-48 to elevator 104A with the storage and handling costs at that elevator. Similar procedures would apply for shipments from one elevator to another with rail access as well as from elevators to ports. These cost coefficients were then included with route names as potential shipment activities in the least cost transportation model to be solved with the GAMS optimization package. The specific least cost linear programming transportation model employed will not be given in its entirety here. The overall objective, however, consists of minimizing the total cost of transporting known volumes of wheat and barley from various locations to predetermined final destinations with known demands. Elevators and ports may serve as intermediate destinations with the appropriate charges being applied to the total cost of transport. Additional equations, or constraints, are added to the mathematical programming formulation to better reflect the actual conditions governing commodity transport. Constraints included in this formulation include those stating that the amount of wheat/barley shipped from each township center may not exceed the available supply and similarly that the amount of wheat/barley arriving at each final destination must be at least equal to the amount demanded at that location. The original production data for each township (obtained from the FSA as described earlier) was considered to be a random sample of total grain production in the county. Those values were indexed upward for each township so that total 1994 production for the county would be reflected. Constraints for the intermediate elevators and ports state that the amount of wheat/barley flowing into an intermediate site via all modes must equal the amount flowing out via all relevant modes of transport. Other constraints were also included to reflect the fact that shipment of wheat directly from township centers to ports could only take place for those township centers within 60 miles of the port. Additional constraints also limited such shipments to be less than the total on-farm storage capacity minus the amount of wheat normally shipped to elevators in the months following harvest.
4

Once the linear programming model is solved, the optimal least cost solution must be processed prior to being imported back into the GIS. The dynamic segmentation functions within Arclnfo make this a somewhat simple procedure. Nonzero grain flows, along with the route number for which they apply, are imported back into Arclnfo. These values are then joined to the SECTIONS table, which contains the individual arc numbers for each route as described earlier. These procedures were followed since two different routes (say from two adjoining township centers to the same elevator) may traverse the same section of highway (arc # 258 perhaps). Optimal wheat flow may be 50,000 bushels along route 1 and 100,000 bushels for route 2. If arc # 258 is common to both routes, then the GIS needs to know that 150,000 bushels are transported over that arc. The FREQUENCY command in Arclnfo is applied to the flow augmented SECTIONS table and a summary table results with total wheat or barley flows for each arc. These values may then be added to the arc attribute table for direct query and display or a relate may be set up. In this fashion, total flows may be displayed directly using the arcs as the underlying geographic reference point. Figure 4 portrays a summary of the overall methodology followed to combine the use of the GIS and the least cost transportation model. Arclnfo is used initially to generate the distance tables for minimum distance combinations of nodes (township to elevators, elevators to elevators, and elevators to ports). Such distance tables are used by an intermediate program such as FoxPro or Quattro Pro to generate cost coefficients as part of an input file for eventual use in the GAMS optimization-programming model. Multiple alternatives are given to the optimization program (i.e., potential shipping of grain from township 20-48 to: 1) any of the nearest 3 elevators, and/or 2) to the nearest 2 elevators with rail access, and/or 3) to either of the nearest 2 ports within 60 miles) so as to maintain as much flexibility as possible. Should a subsequent optimization run, examining an alternative policy, preclude use of one of those routes, then the optimization model still has several routing alternatives to choose from. The GAMS optimization software is used to determine the least cost set of shipping routes and the results are then combined with their unique route numbers and exported back into Arclnfo. Flows are then aggregated across arcs and are available for display or further analysis within Arclnfo. This multi-step process, employing 3 different pieces of software, was employed so as to provide maximum flexibility in modeling the complex transportation system. Arclnfo does have some internal optimization capabilities, but those capabilities were not robust enough to handle multiple commodities and the numerous transport options available in the area.
5

Figure 4: Flowchart of Methodology
6
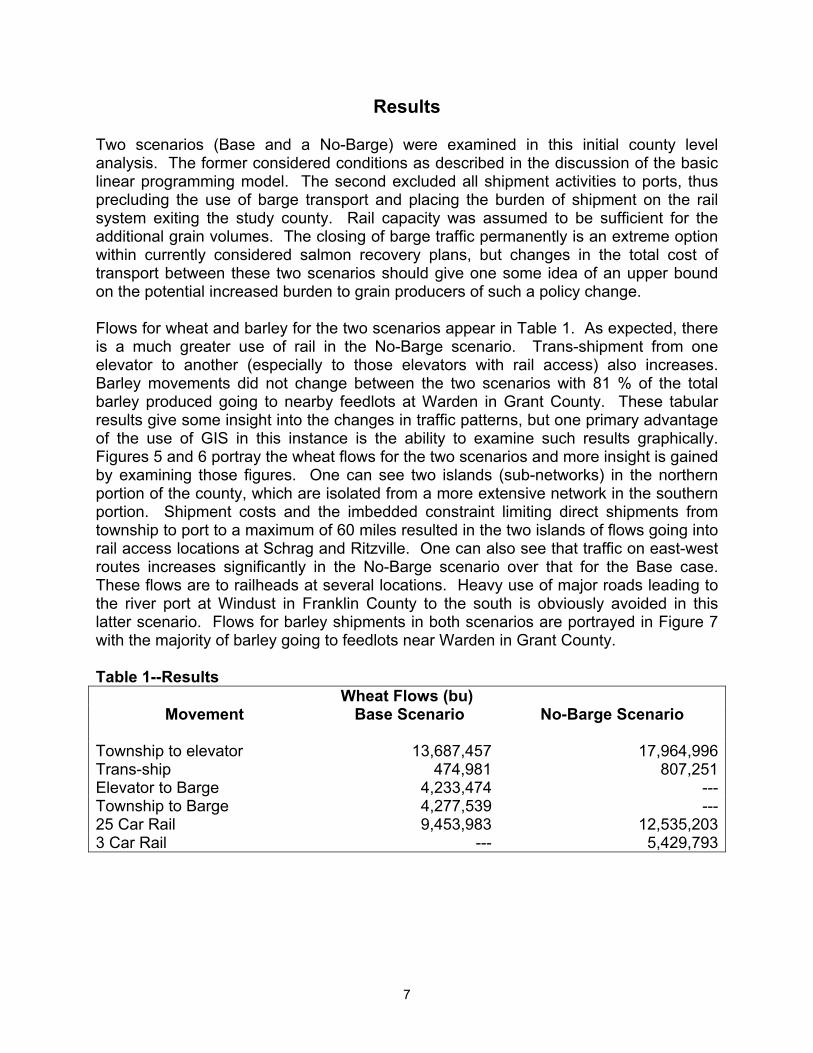
Results Two scenarios (Base and a No-Barge) were examined in this initial county level analysis. The former considered conditions as described in the discussion of the basic linear programming model. The second excluded all shipment activities to ports, thus precluding the use of barge transport and placing the burden of shipment on the rail system exiting the study county. Rail capacity was assumed to be sufficient for the additional grain volumes. The closing of barge traffic permanently is an extreme option within currently considered salmon recovery plans, but changes in the total cost of transport between these two scenarios should give one some idea of an upper bound on the potential increased burden to grain producers of such a policy change. Flows for wheat and barley for the two scenarios appear in Table 1. As expected, there is a much greater use of rail in the No-Barge scenario. Trans-shipment from one elevator to another (especially to those elevators with rail access) also increases. Barley movements did not change between the two scenarios with 81 % of the total barley produced going to nearby feedlots at Warden in Grant County. These tabular results give some insight into the changes in traffic patterns, but one primary advantage of the use of GIS in this instance is the ability to examine such results graphically. Figures 5 and 6 portray the wheat flows for the two scenarios and more insight is gained by examining those figures. One can see two islands (sub-networks) in the northern portion of the county, which are isolated from a more extensive network in the southern portion. Shipment costs and the imbedded constraint limiting direct shipments from township to port to a maximum of 60 miles resulted in the two islands of flows going into rail access locations at Schrag and Ritzville. One can also see that traffic on east-west routes increases significantly in the No-Barge scenario over that for the Base case. These flows are to railheads at several locations. Heavy use of major roads leading to the river port at Windust in Franklin County to the south is obviously avoided in this latter scenario. Flows for barley shipments in both scenarios are portrayed in Figure 7 with the majority of barley going to feedlots near Warden in Grant County. Table 1--Results
Wheat Flows (bu) Movement Base Scenario No-Barge Scenario
Township to elevator 13,687,457 17,964,996Trans-ship 474,981 807,251Elevator to Barge 4,233,474 ---Township to Barge 4,277,539 ---25 Car Rail 9,453,983 12,535,2033 Car Rail --- 5,429,793
7

Barley Flows (bu)
Movement Base and No-Barge Scenarios Township to elevator 258,406Trans-ship 22,79725 Car Rail 135,603Elevator to Feedlot 122,803Township to Feedlot 455,294 Base Scenario Total Cost $8,752,720No-Barge Scenario Total Cost 9,591,139Change in Cost $838,419(or approximately 5 cents per bu.) Assumes no additional fixed cost to expand Rail Capacity.
Figure 5: Adams County Optimal Wheat Flows
8

Figure 6: Adams County Optimal Wheat Flows
Figure 7: Adams County Optimal Barley Flows
9

The change in total cost of transport between the two scenarios is another key component of the analysis. Those values (Table 1) indicate an increase of $838,419 (~9.6%) in transport costs for the No-Barge scenario. As noted earlier, these values assume that existing rail capacity is sufficient to handle the larger rail traffic imposed by the No-Barge scenario. If additional rail cars, engines, personnel, or other fixed facilities are required, then obviously the change in total cost would be greater. If one divides the change in total cost by the total number of bushels of wheat transported (17.9 million), the increased cost of transport translates to approximately 4.6 cents per bushel. This does not appear to be an exorbitant value, but does not take into account all of the other non-grain related costs of closing the lock and dam system. This estimate could also decrease should barge traffic be curtailed only a few months a year as in some proposed salmon recovery plans. In that case, grain barge traffic could be shifted to months in which barge transport is still available.
Conclusions GIS techniques and a classical transportation model worked well together in the current preliminary policy analysis. One should note that data gathering and processing requirements were very considerable, with a great deal of effort devoted to both. Road coverages from two separate sources had to be combined and edited extensively. More fully developed commercial road coverages are now available and would definitely be worth the cost in lieu of the many person-hours employed in combining the DOT and TIGER files. Location and other attribute data for the grain elevators were also key components and could be obtained only by survey. Other sources were consulted for the extensive data needs concerning location and capacity of on-farm grain storage as well as the more refined locations of exactly where grain shipments originate in each county. The GIS basically performed two functions in this setup: origin-destination distance generation and display and query of final results. An intermediate program was required to process the distance, cost data for input into the optimization model, and also to massage the optimal least cost routing results prior to export back into the GIS. Many of the individual tasks described above have been automated using macro command programs within Arclnfo, FoxPro or Quattro Pro. This eases the burden on the user and eventual plans are to streamline the process as much as possible. A multi-period optimization model is under development, which will better aid in examining more time dependent policy questions including the No-Barge problem addressed here.
10

Base Scenario Assumptions
1. Wheat and Barley production levels were based on 1994 production for the county. Data obtained from the ASCS concerning planted acres and yields used as a random sample of where grain is produced by township. Data from the ASCS was inflated upwards to reflect 1994 total production.
2. Based upon talks with elevator operators, township centers further than 60 miles
away from either Windust or the Tri-Cities were not considered as direct suppliers of wheat to those ports, i.e., only townships within 60 miles could bypass the elevators and ship directly to the ports.
3. Total shipments of wheat directly to ports from township centers were limited to
the amount of on-farm storage capacity remaining after shipments to elevators in later periods was accounted for. I.e., if the county had 4 million bushels of total on-farm storage capacity, and 1.5 million bushels are usually shipped to elevators in the months following harvest, then total shipment of grain from township centers was limited to 2.5 million bushes.
4. Cost coefficients for the model were calculated on an annual basis assuming the
shipping patterns (bi-monthly) found in our elevator survey. Grain shipped to elevators during harvest was assumed to be stored and shipped according to those patterns, and was charged holding costs accordingly. Grain shipped to elevators in later months was assumed to have no storage charge.
5. Eighty-one percent of the barley produced was assumed shipped to feedlots near
Warden in Grant County.
Further Assumptions for No-Barge Scenario
1. All barge traffic was assumed unavailable for the entire year.
2. Existing rail capacity was assumed large enough for the altered shipping demands. No direct truck to Portland or Vancouver shipments were considered in this initial model.
11

Observations from Initial Linear Programming Effort
1. Extreme care must be taken when formulating the optimization model so as to more realistically portray the transportation system in place. This includes such conditions as the upper bound on township to port shipments as well as which elevators are possible transshipment destinations for each elevator of origin. Current optimal solutions do not use all elevator sites. Additional equations may be added to the model to insure that all elevators are used at some minimum level.
2. As the model is expanded to include 4 or more explicit time periods, our ability to
more accurately predict the costs of a short term Snake River drawdown will be greatly enhanced. When in place, this model will undoubtedly show smaller impacts on total cost as barge shipments will be shifted in time to avoid the drawdown and the higher costs of shipping by rail will be partially avoided.
3. More detail is needed to determine what, if any, constraints exist on rail car
availability. This applies both for individual locations, as a whole, and by 3-car vs. 25-car modes. Similar added detail concerning feedlot locations and annual demands for feed barley would be a nice addition as well.
4. In the No-Barge scenario there is significantly more East-West traffic as
producers and elevator shippers move their grain to the railheads at Bruce, Schrag, Cunningham, Ritzville, and Lind. North-south traffic, especially on State Highway 2 1, as well as East-West traffic on State Highways 260 and 263 in Franklin County, falls drastically. A permanent drawdown or abandonment of the dam system would significantly alter agricultural traffic patterns within the state.
Still to Do
1. Finish fully formulating and testing the 4 period model.
2. Complete the matrix generator for this model.
3. Automate the procedures for importing the GAMS optimization results back into
the GIS program for display and analysis
4. Eventually expand to having the on-farm storage locations as production sites. This will increase the size of the optimization model about ten-fold.
5. Calculate estimated changed in road maintenance costs due to the proposed
drawdown.
6. Incorporate state CRIS data for actual vs. linear road mileages. This will account for the effect of changes in elevation on road mileages and not rely solely on a flat distance measure. Incorporating this information is a long-term goal and will be a major undertaking.
12
Notes and Observations concerning the analysis
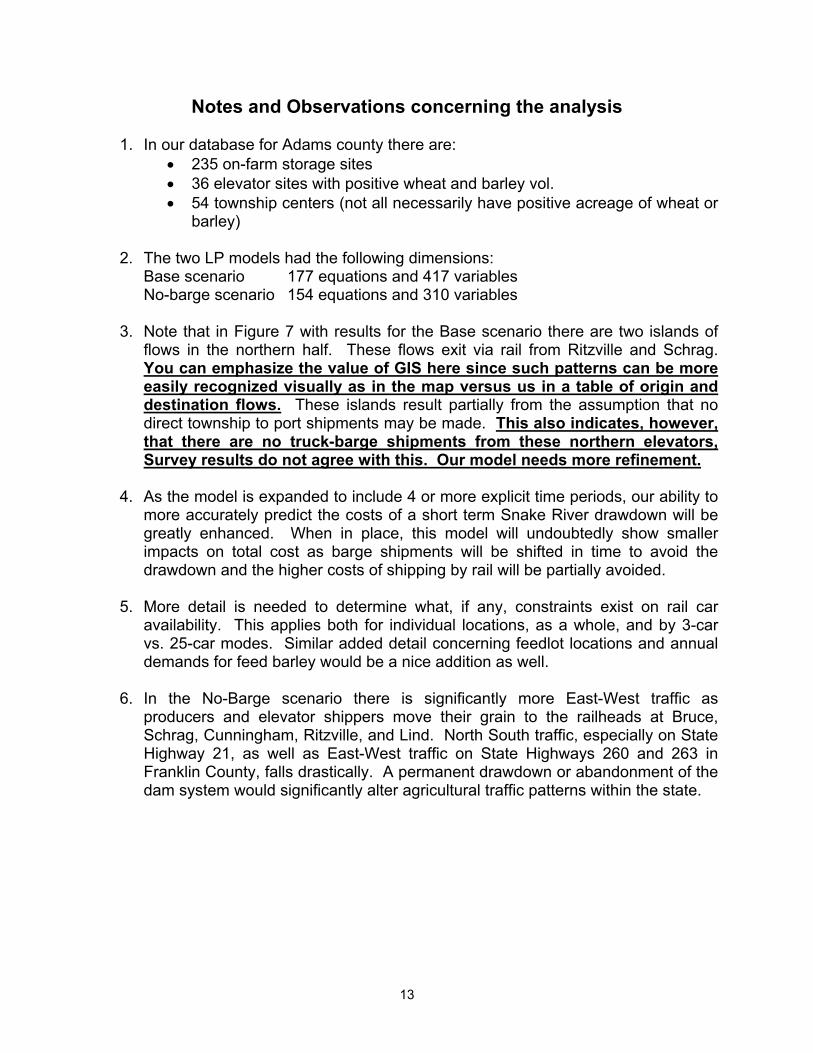
1. In our database for Adams county there are: • 235 on-farm storage sites • 36 elevator sites with positive wheat and barley vol. • 54 township centers (not all necessarily have positive acreage of wheat or
barley)
2. The two LP models had the following dimensions: Base scenario 177 equations and 417 variables No-barge scenario 154 equations and 310 variables
3. Note that in Figure 7 with results for the Base scenario there are two islands of
flows in the northern half. These flows exit via rail from Ritzville and Schrag. You can emphasize the value of GIS here since such patterns can be more easily recognized visually as in the map versus us in a table of origin and destination flows. These islands result partially from the assumption that no direct township to port shipments may be made. This also indicates, however, that there are no truck-barge shipments from these northern elevators, Survey results do not agree with this. Our model needs more refinement.
4. As the model is expanded to include 4 or more explicit time periods, our ability to
more accurately predict the costs of a short term Snake River drawdown will be greatly enhanced. When in place, this model will undoubtedly show smaller impacts on total cost as barge shipments will be shifted in time to avoid the drawdown and the higher costs of shipping by rail will be partially avoided.
5. More detail is needed to determine what, if any, constraints exist on rail car
availability. This applies both for individual locations, as a whole, and by 3-car vs. 25-car modes. Similar added detail concerning feedlot locations and annual demands for feed barley would be a nice addition as well.
6. In the No-Barge scenario there is significantly more East-West traffic as
producers and elevator shippers move their grain to the railheads at Bruce, Schrag, Cunningham, Ritzville, and Lind. North South traffic, especially on State Highway 21, as well as East-West traffic on State Highways 260 and 263 in Franklin County, falls drastically. A permanent drawdown or abandonment of the dam system would significantly alter agricultural traffic patterns within the state.
13

14
EWITS GIS Accomplishments
1. Combined DOT and TIGER Road Coverages for all 20 counties. Composite coverage has approximately 98,000 arcs. Baseline road name annotation work is 85% complete.
2. Added all 3200 plus on-farm storage and township center locations to the
database along with capacity values.
3. Added approximately 450 elevator locations along with attribute data to the GIS. Able to do queries by elevator wheat volume or capacity.
4. Obtained color printer for output. Developed procedures for combining Arc
output with PC based graphics programs in order to create hardcopies and overhead transparency output.
5. Obtained and processed over 33,000 records concerning 1994 planted acres of
wheat and barley from the ASCS. In the process of tying this data to the GIS so origination points of production (by township) are more accurate than that available from simple county statistics. A large task.
6. Obtained the GAMS optimization software necessary for solving the least cost
transportation model.
7. Reformulated the least cost model to reflect township centers only for production sites. This model is approximately 1/10th the size of an on-farm storage based model and will serve as an intermediate step toward the final, larger model.
8. Developed procedures within Arclnfo for determining minimum distance routes
from on-farm storage or township center locations to given elevators and then exporting those distances and routes to the GAMS optimization model. Developed a macro-programming model, which will create a distance table for differing combinations of nodes for the entire twenty county coverage.
9. Presented some preliminary county level results in a paper entitled "Modeling
Changes in Grain Transportation Flows in Response to Proposed Snake River Drawdowns: A Case Study for Eastern Washington State" at the 1995 GIS-T meetings in Sparks, Nevada in April. Made a similar presentation ("A GIS and Transportation Optimization Model Approach to Determining Highway and Rural Road Commodity Flows") at the recent Fifth National Conference on Transportation Planning Methods Applications meetings in Seattle.