a geo-environmental assessment of flood dynamics in lower
TRANSCRIPT
Ethiopian Journal of Environmental Studies and Management Vol.3 No.2 2010
*Department of Geography, Visva Bharati University Santiniketan INDIA [email protected]
96
A Geo-Environmental Assessment of Flood Dynamics in Lower Ajoy River Inducing Sand
Splay Problem in Eastern India
Sutapa Mukhopadhyay Abstract:
Flood as a widespread destructive natural disaster is recurring in the river basins of Eastern India. Though large
number of flood controlling measures have been taken in the river valleys from the early ages but it is to be
noted that spatial dimension of the flood affected area and the magnitude of flood are being increased
significantly year by year. The present alleviation measures are seemed to give false security to the bank
dwellers. Once to protect the agricultural fields and the settlements embankments were constructed along both
sides of the rivers but now the hydrologists feel that those human interventions have changed the character of
the river regime. Consequent effect of it is the breaching of the embankments and the occurrences of sand splay
over a massive area. Studies have made here in one of the important flood prone river basins of Eastern India,
i.e. Ajoy, where the rate of sand splay formation has significantly hastened many times and it has a negative
effect on the fertility of the agricultural fields. Some structural and non-structural measures have been
suggested on the basis of the field observation.
Introduction:
loods are arguably one of the most
universally experienced and
damaging surface hydrologic phenomena in
the geosphere. They tend to be larger in spatial
impact and bear an immense socio-economic
and political significance in places frequented
by this process. Of all types of floods, riverine
floods appear to be the most common and
dominant occurrence with significant effects
on the surrounding environment, both physical
and cultural (Ward, 1978). Floods are caused
by variety of factors, not all of them are
weather induced. Topography and hydrological
capacity of the subsoil and failure of flood
protection structure are the other critical
factors in this regard. In the present scenario of
worldwide development environment conflict,
ecological disturbances like deforestation and
flood plain encroachment by human activities
have increased the frequency and intensity of
floods indicating that no country is free from
severe flood hazards.
Flood is undoubtedly the most dreadful natural
calamity of Eastern India where it becomes
almost an annual phenomenon. The worst
affected state of this part of India is West
Bengal where 55.43 percent of total
geographical area is flood prone. According to
the Government report 2000, the most
remarkable flood year, about 2.21 crores of
population were affected and the total
estimated loss was Rs 5,660.65 crores. It is
important to note that spatial dimension of the
flood affected area is being increased
significantly and the damages they render are
pervasive and long term.
From the early ages large number of flood
controlling measures have been taken in the
river valleys of Eastern India but now a days
people feel that human intervention in the river
valley have changed the hydrological regime
of the rivers of South Bengal and these may be
the cause of the flood related disasters of
Bengal. The present alleviation measures like
the increase of the height of the embankment,
repairing of embankment, aforestation in the
upper catchment, adopted by the local
governments turns into failure and it seems to
give a false security to the bank dwellers. Sir
William Wilcox (1930) accused the riverside
embankments as satanic chains and proposed
canal for draining out the floodwater. Prof
M.N.Saha (1935) was also concerned about the
effect of embankments on the hydrological
character of the rivers while explaining the
causes of the flood of Bengal, Mr. S.C.
Majumbar (1945), the eminent engineer
warned about the long term effect of
embankment and stated “ construction of
embankment as flood controlling measures
would be like mortgaging the future
generations to derive some temporary benefits
for the present generation”. But it is irony that
still at the present 21st century dams and
embankments are considered as flood relieving
measures, often these are designed abysmally
poor knowledge of the hydrological character
of the rivers (Pearce, 2001). So we cannot
reduce the new genre of flood hazards by
frequent breaching of embankments. Sand
splay is one such effect of it, which have great
effect on the economy of the riverside villages.
Sands play is the deep sheet of sand deposited
at the back swamp areas due to sudden break
of river embankment and ejection of sand from
the riverbed all of a sudden. Once a time when
F

Changing Faces Of Floods................ Sutapa EJESM Vol.3 No.2 2010
97
human being was far from the active back
swamp areas, such occurrences were no
problem at all. But due to massive
encroachment of human being to the interior of
this region, the sand splay is bringing lots of
problem in connection with ecohydrology and
economy. Moreover the rate of sand splay
formation has been hastened many times due
to significant growth of manmade flash flood.
Today the rate of sand splay formation is so
rapid and its effect is so much in both short
and long term is defined as disaster. This
phenomenon is not only responsible for
spreading of sand to the agricultural lands and
back swamp areas but also acutely responsible
for negative change of soil fertility,
ecohydrology of the basin etc.
With this back ground in this article the study
has been done on the changing flood character
of river Ajoy, one of the important flood prone
river basins of West Bengal state of Eastern
India, since last fifty years and the extended
nature of sand splay as a post flood
geomorphological hazard along the river.
The Geographical and Administrative
Acquaintance
The river Ajoy is a right bank tributary of the
Bhagirathi River, one of the major
distributaries of the Ganga. From the source
region at Chakai to the confluence at Katwa,
the river Ajoy is passing through three major
geological set up. From the source region to
about 190 kms downstream at Jamtara it flows
over Archaean gneissic complex, then it is on
Gondwana sedimentary rocks for 30 km up to
Pandabeswar and for rest it flows over older
and recent alluvial deposits. The total area of
the Ajoy river basin is 6,221 sq km. The
average slope of the basin is 1 in 750 from
source region to Pandabeswar and from
Pandabeswar downwards the slope drops to
about 1 in 2,250. The lower Ajoy river basin
has been demarcated from Pandabeswar as
there is a significant break along the long
profile of the river slope. So following 80m.
contour line, as the break of slope point, the
upper limit of the lower Ajoy basin has been
demarcated. The river flows over the flat
surface that supports the oscillation of the
channel, sluggish flow, low bank height and
low velocity. The river trickles through the
sand bed from the month of November to mid
June and becomes a subject to a sudden freshet
at the onset of Monsoon. As the flood rarely
occurs at the upper catchment so the present
discussion is mainly at the lower stretch of the
Ajoy river basin. The length of the river of this
part is 145 kms and the total basin area of this
lower stretch is 2,816.65 sq. km. The whole
basin latitudinally extends from 23025' North
to 23045' North and longitudinally between
87020'East to 88º
East. The important
settlements like Pandebeswar, Illambazer,
Kanska, Bolpur –Santiniketan, Guskara,
Natunhat, Mangalhat, Ketugram, Katwa have
taken shape in the basin over decades (fig 1).
There are 619 mouzas (small administrative
unit), under 12 CD Block (Community
Development Block) located in the said basin
area. It is estimated that out of the total mouzas
about 493 are flood affected entirely or
partially, which is about 79.65% of the total.
Physical Background of the area The whole river basin has been designated
from the elevation range of 80 m in the west to
14 m above sea level in the east (fig 2). The
physiographic set up of this basin area is
characterised by two major units viz. i) the
badland with lateritic hard crust zone of the
western part of the basin area where the level
of lateritic landscape is modified by the gully
actions. This undulated land occupies about
37.05% of the total area and is covered by
brown clay with scattered forest cover. ii) the
fluvial aggradational landform occupies the
rest 62.95% of the total area where natural
levees, flood plains, sand splay, alluvial
terraces, sand bars are the dominant features.
Below 40 m contour, just from the eastern
flank of the lateritic hard crust there is almost
flat surface where meandering nature with
large shoal deposits are common along the
river course.
On the basis of the slope and other
morphological attributes four altitudinal zones
have been demarcated in the lower Ajoy basin
i) Western plain (80 m to 60m): The region
covers the laterite upland on the Gondwana
rocks in the eastern part of the Raniganj
coalfield. It occupies about 46,623.29 hectares
that is 16.55% of the total lower basin area.
ii) Western Central plain (60 m to 40 m): It lies
in between the eastward extending part of
lateritic upland and older valleys of the river
system.
iii) Central Plain (40m to 20m): It has an area
of 10,19,63.04 hectares or 36.20% of the total
area. It bears the lowest quaternary alleviation
and younger alluvial silts in the eastern part.

Ethiopian Journal of Environmental Studies and Management Vol.3 No.2 2010
98
Fig. 1Location map of Lower Ajoy River Basin,India
Fig. 2 Contour Map of Lower Ajoy River Basin, India
iv) Eastern plain (Less than 20m) : It is
characterised by the new flood plain, channel
deposits and some scattered marshy lands of
eastern flank of the Ajoy - Bhagirathi system.
Average slope of the Ajoy River basin
area is 1 in 750 from source point to
Pandabeswar and over this lower stretch the
slope drops down to about 1 in 2250, i.e. from
Pandabeswar to confluence point. Due to the
construction of embankments along both the
banks the width of the channel varies along its
long stretch. In this long stretch of lower
catchment area sub parallel drainage
predominates over the subdendritic pattern and
to some extent braided pattern is formed at
many parts.
The shape of the basin is funnel like
where huge volume of water from upper
Changing Faces Of Floods................ Sutapa EJESM Vol.3 No.2 2010
99
catchment flows through a restricted narrow
channel in the lower catchment and it causes
flood. The Hinglo and Kunur are the major sub
basins of river Ajoy over this stretch. The
Hinglo sub basin is characterised by low
drainage density (1.25/sqkm), which suggests
that the catchment area is constituted by such
rocks like granite and gneiss, which permits
more infiltration of the surface runoff. The
bifurcation ratio is moderately high suggesting
erosive nature of the sub basin. A drainage
density of 0.85 per sq kms, which indicates
that the catchment area has more infiltration
capacity, characterizes the Kunur sub basin.
High bifurcation ratio also indicates high
erosive nature of the sub basin.
As the general gradient of the basin
area in from northwest to south/south east so
the embankments have mainly constructed
along the right bank of the river up to Bhedia.
These embankments have also checked the
river widening processes in the lower courses.
This gradual constricted flow of the river in
downward course has vital role in the
occurrences of flood over the area.
Mean annual discharge of the river is
65.46 cumecs at Natunhat , which is 45 km
above from the confluence and it rises to about
247.95 cumecs in the month of August and
again declines to about 1 cumec in March &
April. During summer month rainfall merely
exceeds 100 mm and it is even over 1500 mm
during rainy months. Therefore sudden
outburst of monsoon or local cyclonic
depression over Bay of Bengal and the
Gangetic West Bengal during the month of
September & early October is one of most
important causes of flood in the lower Ajoy
basin area. It is to be noted that almost all
devastating floods of the Ajoy river have
occurred in the month of September when
heavy rainfall occurs in a couple of days.
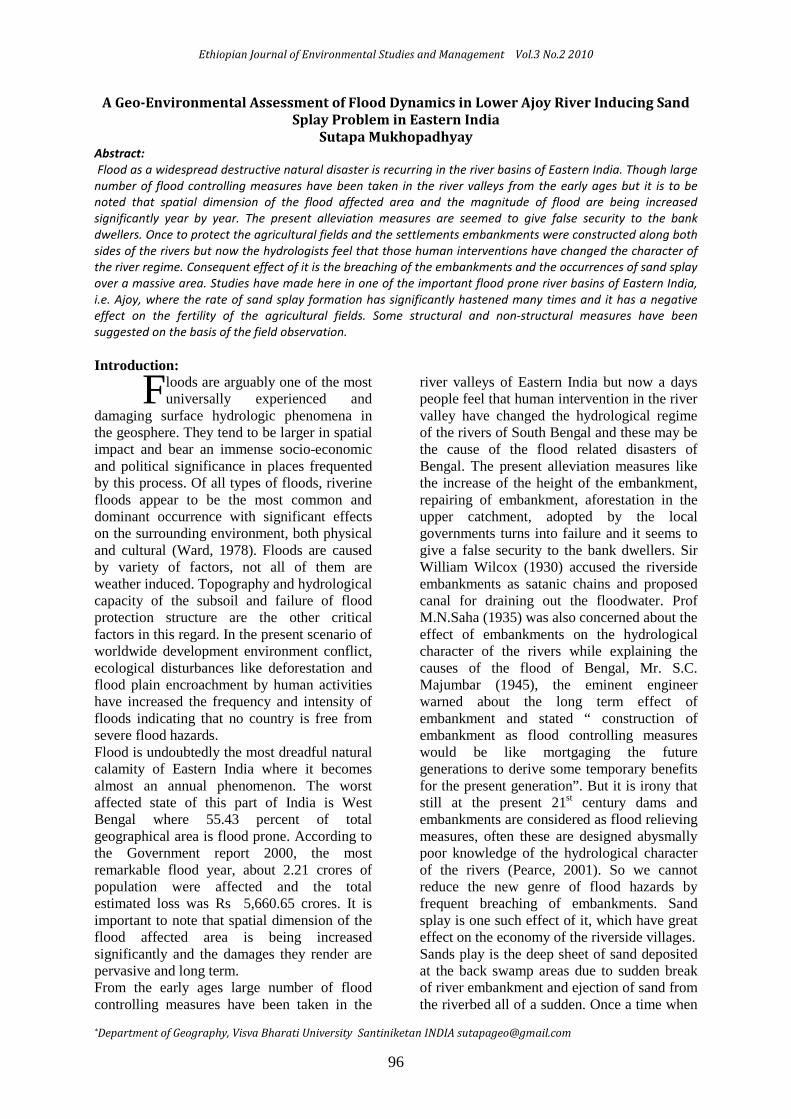
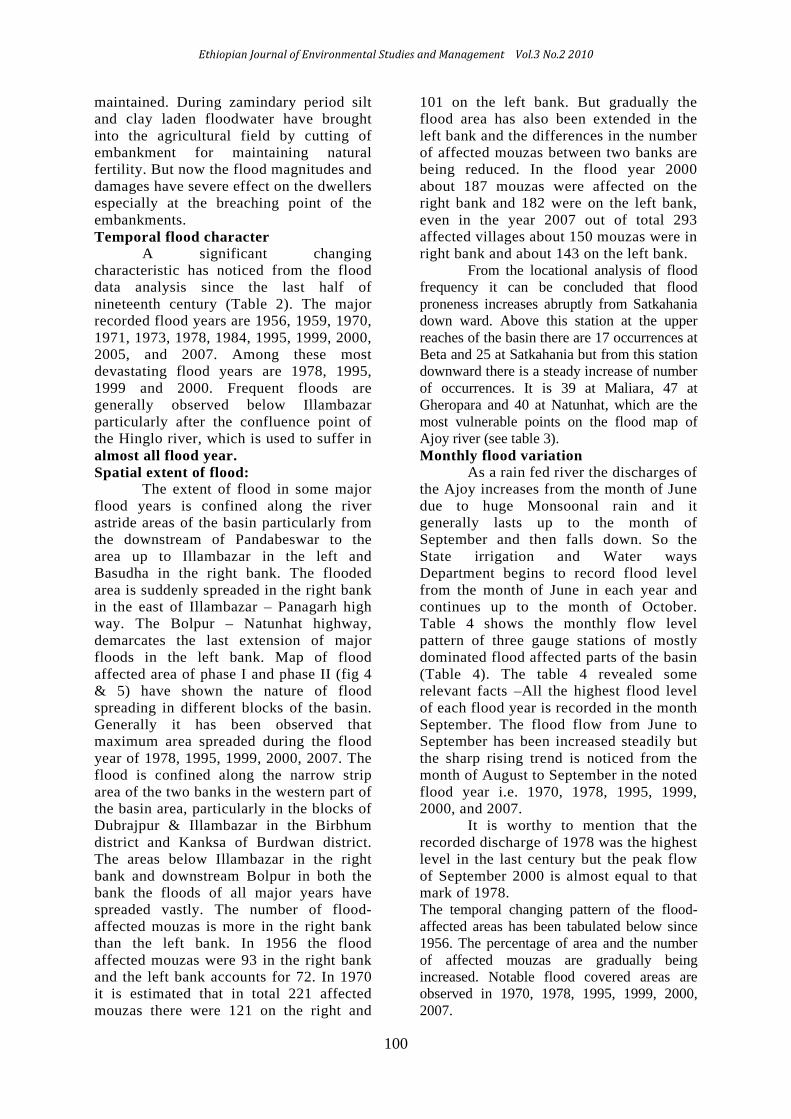
The land use pattern of an area in
highly altered by the annual flood. Broadly it
can be said that this lower basin area consists
highly productive land (fig 3). It is estimated
that 62.58% of the total land is used for
cultivation of which 40.27 % is irrigated and
22.31% is non-irrigated. The area lying below
40 mt contour line has network of irrigation
canals, tanks and tube wells. Forested land
occupies only 13.17% of the total land and the
concentration is more in the right bank than the
left bank. On the other hand about 1.77 percent
of land is occupied by cultivable waste, these
are mainly found in the river astride sand
covered part (Table 1). Generally during flood,
fine grained newer alluvium deposited over the
land and increase the productivity of the soil.
So the extensive fertile multiple cropping land
is prominent along the right bank of the river
below Bhedia. However devastating floods of
1978, 1985, 1999 & 2000,2005 and 2007 have
dramatically changed the agricultural lands
into cultivable wastelands. The sand deposition
with an average depth of 50 cm to 1 mt over
fertile cultivable lands has converted the land
into sandy wasteland. In this river basin area
about 700.15 hectares of good cultivated land
have been lost due to sand splay where the
farmers are not in a position to cultivate their
principal crops like paddy, wheat, potatoes etc.
Historical overview on the floods of Ajoy
river
The lower Ajoy river basin has been
suffering from floods since time
immemorial. The evidence of flood in the
form of yellowish and whitish sandy silt
layer has been traced even in the river
astride archeological sites that dates back
to more than two millennium B.C. Ajoy
river was navigable for those years and
had great commercial significance some
thousand years back. Villages along the
river like Supur, Raypur, Illambazar,
Karimpur, Katwa etc were once important
trading centres. But these settlements have
lost their significance due to the changing
of the river regime. During 18th
& 19th
century normal flood had occurred which
resulted the formation of flood plain as
there was no embankment in those days. A
huge volume of water was flowing through
the river of sufficient depth. The river had
a tendency to shift its course and as a
result a flood plain had extended to a large
extent of area.
During British period in 19th
century recorded major floods were in
1867, 1877, 1885 & 1896. After that
unusual high flood occurred in 1913, 1914
causing serious loss of life and property,
damage to standing crops, seeds and
houses. The English district officer took
immediate steps to help the people,
suspension of revenue collection was
ordered in all the flood-affected areas. In
the nineteenth century some embankments
were scatteredly constructed by the then
zamindars and was not technically
Ethiopian Journal of Environmental Studies and Management Vol.3 No.2 2010
100
maintained. During zamindary period silt
and clay laden floodwater have brought
into the agricultural field by cutting of
embankment for maintaining natural
fertility. But now the flood magnitudes and
damages have severe effect on the dwellers
especially at the breaching point of the
embankments.
Temporal flood character
A significant changing
characteristic has noticed from the flood
data analysis since the last half of
nineteenth century (Table 2). The major
recorded flood years are 1956, 1959, 1970,
1971, 1973, 1978, 1984, 1995, 1999, 2000,
2005, and 2007. Among these most
devastating flood years are 1978, 1995,
1999 and 2000. Frequent floods are
generally observed below Illambazar
particularly after the confluence point of
the Hinglo river, which is used to suffer in
almost all flood year.
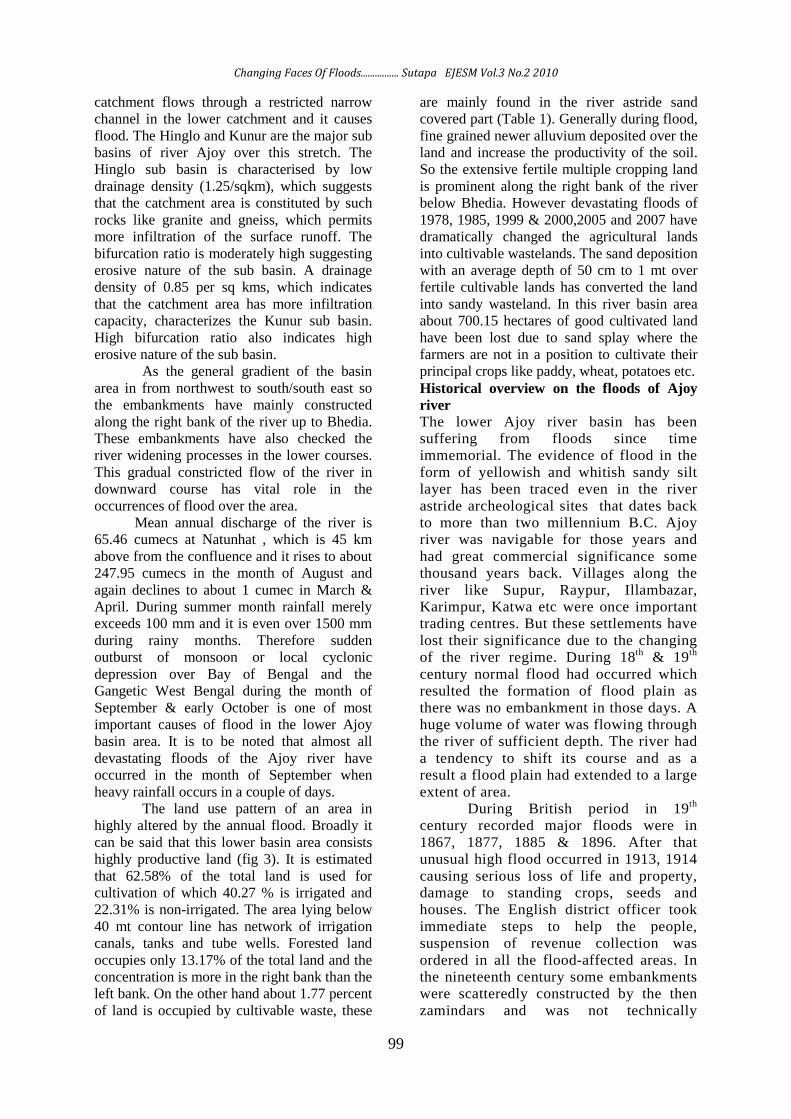
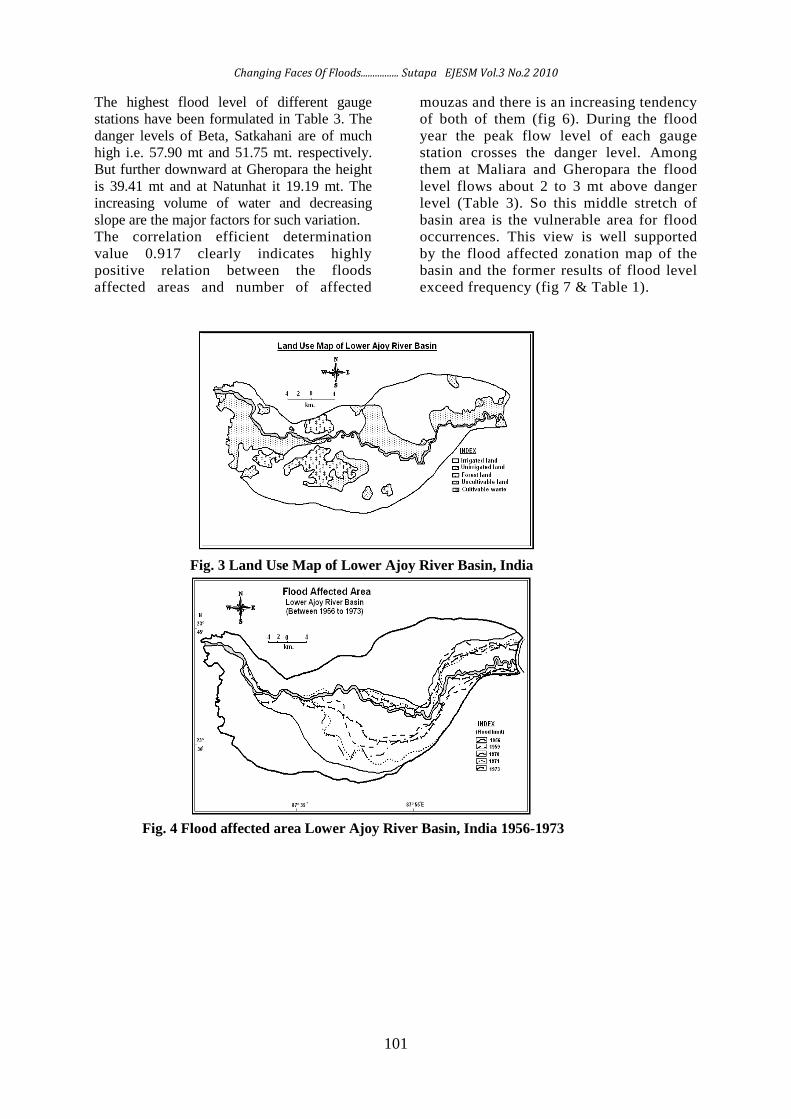
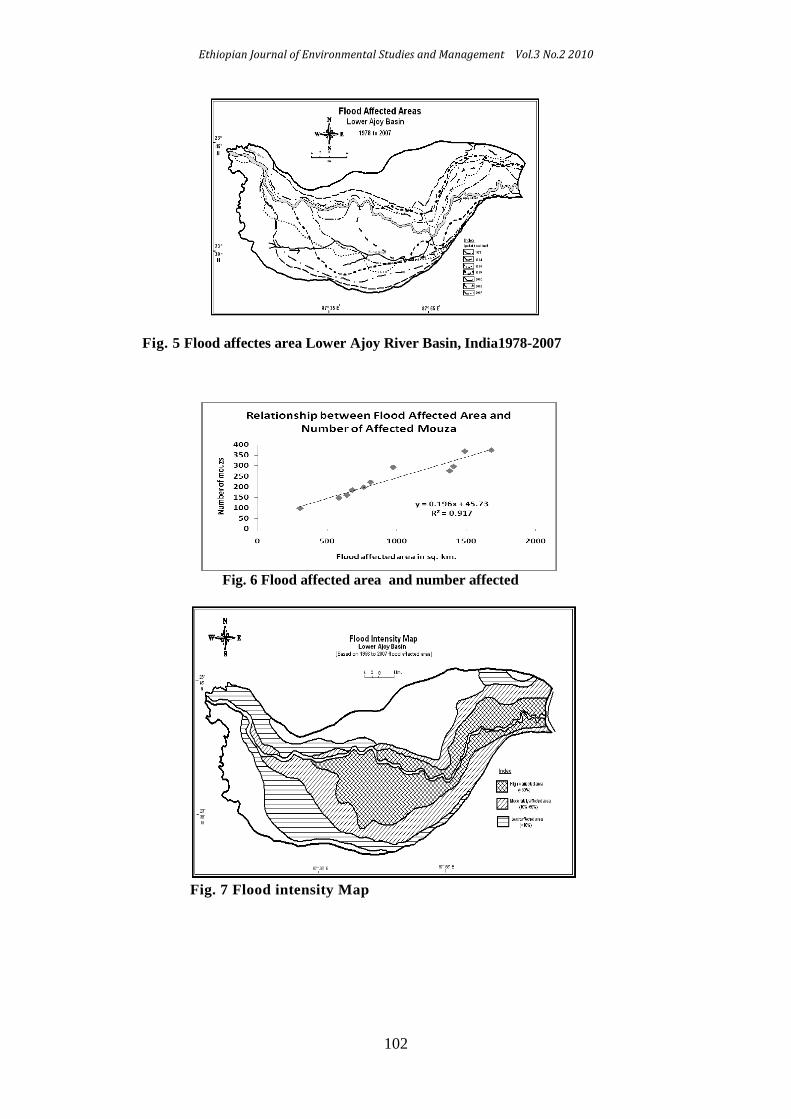
Spatial extent of flood: The extent of flood in some major
flood years is confined along the river
astride areas of the basin particularly from
the downstream of Pandabeswar to the
area up to Illambazar in the left and
Basudha in the right bank. The flooded
area is suddenly spreaded in the right bank
in the east of Illambazar – Panagarh high
way. The Bolpur – Natunhat highway,
demarcates the last extension of major
floods in the left bank. Map of flood
affected area of phase I and phase II (fig 4
& 5) have shown the nature of flood
spreading in different blocks of the basin.
Generally it has been observed that
maximum area spreaded during the flood
year of 1978, 1995, 1999, 2000, 2007. The
flood is confined along the narrow strip
area of the two banks in the western part of
the basin area, particularly in the blocks of
Dubrajpur & Illambazar in the Birbhum
district and Kanksa of Burdwan district.
The areas below Illambazar in the right
bank and downstream Bolpur in both the
bank the floods of all major years have
spreaded vastly. The number of flood-
affected mouzas is more in the right bank
than the left bank. In 1956 the flood
affected mouzas were 93 in the right bank
and the left bank accounts for 72. In 1970
it is estimated that in total 221 affected
mouzas there were 121 on the right and
101 on the left bank. But gradually the
flood area has also been extended in the
left bank and the differences in the number
of affected mouzas between two banks are
being reduced. In the flood year 2000
about 187 mouzas were affected on the
right bank and 182 were on the left bank,
even in the year 2007 out of total 293
affected villages about 150 mouzas were in
right bank and about 143 on the left bank.
From the locational analysis of flood
frequency it can be concluded that flood
proneness increases abruptly from Satkahania
down ward. Above this station at the upper
reaches of the basin there are 17 occurrences at
Beta and 25 at Satkahania but from this station
downward there is a steady increase of number
of occurrences. It is 39 at Maliara, 47 at
Gheropara and 40 at Natunhat, which are the
most vulnerable points on the flood map of
Ajoy river (see table 3).
Monthly flood variation
As a rain fed river the discharges of
the Ajoy increases from the month of June
due to huge Monsoonal rain and it
generally lasts up to the month of
September and then falls down. So the
State irrigation and Water ways
Department begins to record flood level
from the month of June in each year and
continues up to the month of October.
Table 4 shows the monthly flow level
pattern of three gauge stations of mostly
dominated flood affected parts of the basin
(Table 4). The table 4 revealed some
relevant facts –All the highest flood level
of each flood year is recorded in the month
September. The flood flow from June to
September has been increased steadily but
the sharp rising trend is noticed from the
month of August to September in the noted
flood year i.e. 1970, 1978, 1995, 1999,
2000, and 2007.
It is worthy to mention that the
recorded discharge of 1978 was the highest
level in the last century but the peak flow
of September 2000 is almost equal to that
mark of 1978.
The temporal changing pattern of the flood-
affected areas has been tabulated below since
1956. The percentage of area and the number
of affected mouzas are gradually being
increased. Notable flood covered areas are
observed in 1970, 1978, 1995, 1999, 2000,
2007.
Changing Faces Of Floods................ Sutapa EJESM Vol.3 No.2 2010
101
The highest flood level of different gauge
stations have been formulated in Table 3. The
danger levels of Beta, Satkahani are of much
high i.e. 57.90 mt and 51.75 mt. respectively.
But further downward at Gheropara the height
is 39.41 mt and at Natunhat it 19.19 mt. The
increasing volume of water and decreasing
slope are the major factors for such variation.
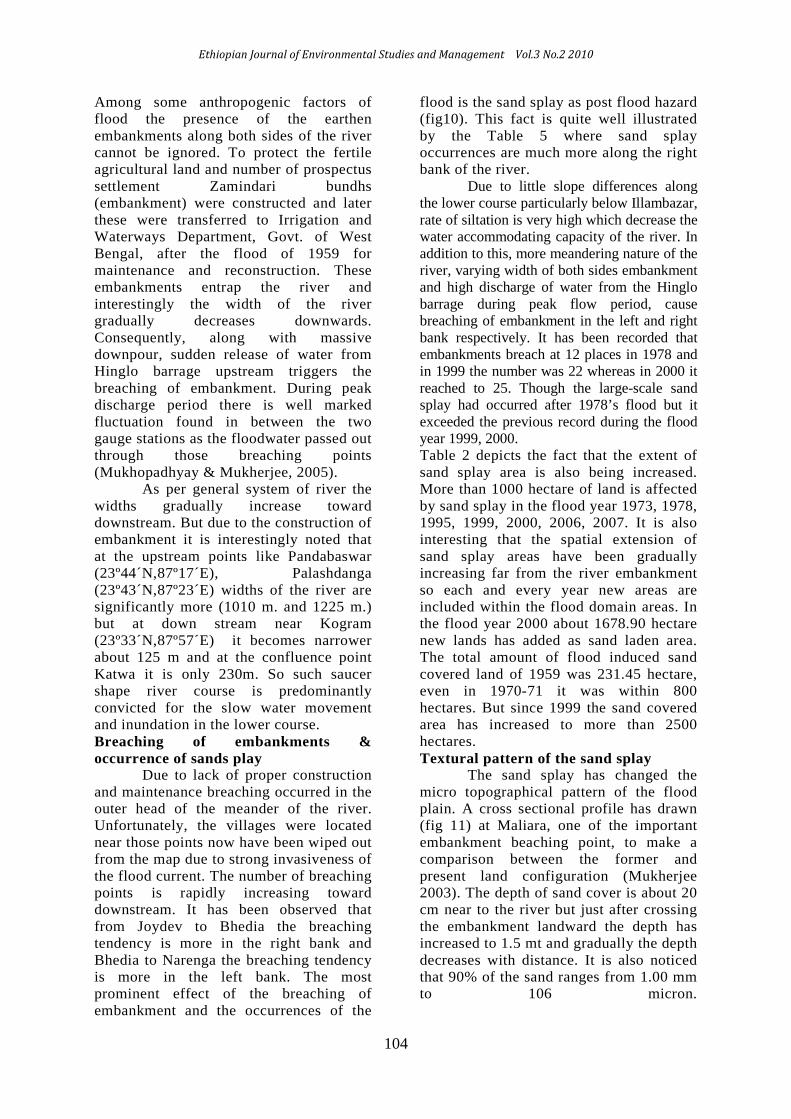
The correlation efficient determination
value 0.917 clearly indicates highly
positive relation between the floods
affected areas and number of affected
mouzas and there is an increasing tendency
of both of them (fig 6). During the flood
year the peak flow level of each gauge
station crosses the danger level. Among
them at Maliara and Gheropara the flood
level flows about 2 to 3 mt above danger
level (Table 3). So this middle stretch of
basin area is the vulnerable area for flood
occurrences. This view is well supported
by the flood affected zonation map of the
basin and the former results of flood level
exceed frequency (fig 7 & Table 1).
Fig. 3 Land Use Map of Lower Ajoy River Basin, India
Fig. 4 Flood affected area Lower Ajoy River Basin, India 1956-1973
Ethiopian Journal of Environmental Studies and Management Vol.3 No.2 2010
102
Fig. 5 Flood affectes area Lower Ajoy River Basin, India1978-2007
Fig. 6 Flood affected area and number affected
Fig. 7 Flood intensity Map

Changing Faces Of Floods................ Sutapa EJESM Vol.3 No.2 2010
103
The correlation graphs (fig. 8 & fig. 9)
have shown a positive relation between the
flood height of the gauge station and the
flood affected areas. But the coefficient of
determination value is not significant
(0.374) at Maliara where the slope of the
land surface is a major determinant factor.
The R2 value is 0.496 at Natunhat, which
indicates moderately significant
relationship.
Causes of flood So many physical and human
induced factors are responsible for such
kind of occurrences. The short period
massive rainfall is the main cause of such
problem. Out of total rainfall almost 85%
rainfall occurred within 3 to 4 monsoon
months of the year. About 60 to 70%
rainfall was happened within very short
period of time i.e. 3-4 days during 1956,
1970, 1973, 1978, 1999, 2000, 2005.
Another two factors that aggravate the
flood situation in the above-mentioned
areas are sudden decrease of river width
particularly below Bhedia and the
synchronization of the water level between
river Ajay and river Bhagirathi. Other
related physical factors are the long,
narrow shape of the river basin, gentle
longitudinal gradient of the river-all of
which favour the situation of riverbed
siltation and reduction of river load
capacity (Mukhopadhyay & Mukherjee
2005).
Fig. 8 Flood height and Flood Affected Areas at Maliara
Fig. 9 Flood height and Flood Affected Areas at Nathunhat
Ethiopian Journal of Environmental Studies and Management Vol.3 No.2 2010
104
Among some anthropogenic factors of
flood the presence of the earthen
embankments along both sides of the river
cannot be ignored. To protect the fertile
agricultural land and number of prospectus
settlement Zamindari bundhs
(embankment) were constructed and later
these were transferred to Irrigation and
Waterways Department, Govt. of West
Bengal, after the flood of 1959 for
maintenance and reconstruction. These
embankments entrap the river and
interestingly the width of the river
gradually decreases downwards.
Consequently, along with massive
downpour, sudden release of water from
Hinglo barrage upstream triggers the
breaching of embankment. During peak
discharge period there is well marked
fluctuation found in between the two
gauge stations as the floodwater passed out
through those breaching points
(Mukhopadhyay & Mukherjee, 2005).
As per general system of river the
widths gradually increase toward
downstream. But due to the construction of
embankment it is interestingly noted that
at the upstream points like Pandabaswar
(23º44´N,87º17´E), Palashdanga
(23º43´N,87º23´E) widths of the river are
significantly more (1010 m. and 1225 m.)
but at down stream near Kogram
(23º33´N,87º57´E) it becomes narrower
about 125 m and at the confluence point
Katwa it is only 230m. So such saucer
shape river course is predominantly
convicted for the slow water movement
and inundation in the lower course.
Breaching of embankments &
occurrence of sands play Due to lack of proper construction
and maintenance breaching occurred in the
outer head of the meander of the river.
Unfortunately, the villages were located
near those points now have been wiped out
from the map due to strong invasiveness of
the flood current. The number of breaching
points is rapidly increasing toward
downstream. It has been observed that
from Joydev to Bhedia the breaching
tendency is more in the right bank and
Bhedia to Narenga the breaching tendency
is more in the left bank. The most
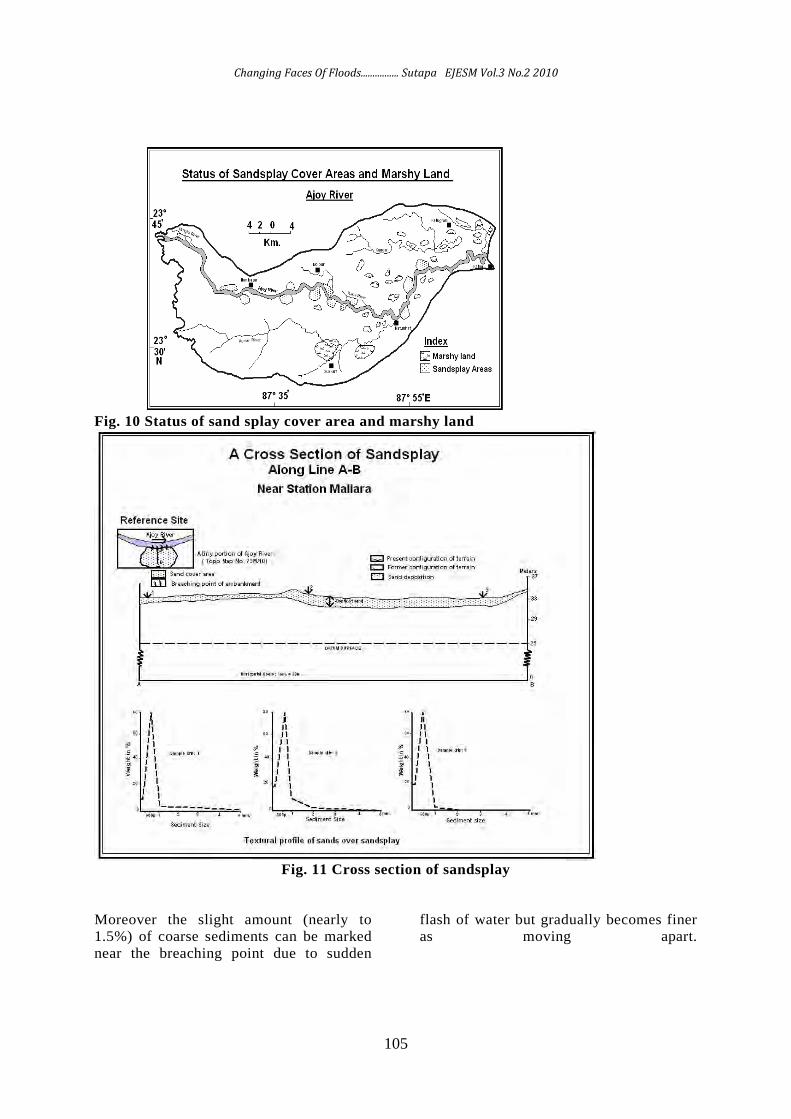
prominent effect of the breaching of
embankment and the occurrences of the
flood is the sand splay as post flood hazard
(fig10). This fact is quite well illustrated
by the Table 5 where sand splay
occurrences are much more along the right
bank of the river.
Due to little slope differences along
the lower course particularly below Illambazar,
rate of siltation is very high which decrease the
water accommodating capacity of the river. In
addition to this, more meandering nature of the
river, varying width of both sides embankment
and high discharge of water from the Hinglo
barrage during peak flow period, cause
breaching of embankment in the left and right
bank respectively. It has been recorded that
embankments breach at 12 places in 1978 and
in 1999 the number was 22 whereas in 2000 it
reached to 25. Though the large-scale sand
splay had occurred after 1978’s flood but it
exceeded the previous record during the flood
year 1999, 2000.
Table 2 depicts the fact that the extent of
sand splay area is also being increased.
More than 1000 hectare of land is affected
by sand splay in the flood year 1973, 1978,
1995, 1999, 2000, 2006, 2007. It is also
interesting that the spatial extension of
sand splay areas have been gradually
increasing far from the river embankment
so each and every year new areas are
included within the flood domain areas. In
the flood year 2000 about 1678.90 hectare
new lands has added as sand laden area.
The total amount of flood induced sand
covered land of 1959 was 231.45 hectare,
even in 1970-71 it was within 800
hectares. But since 1999 the sand covered
area has increased to more than 2500
hectares.
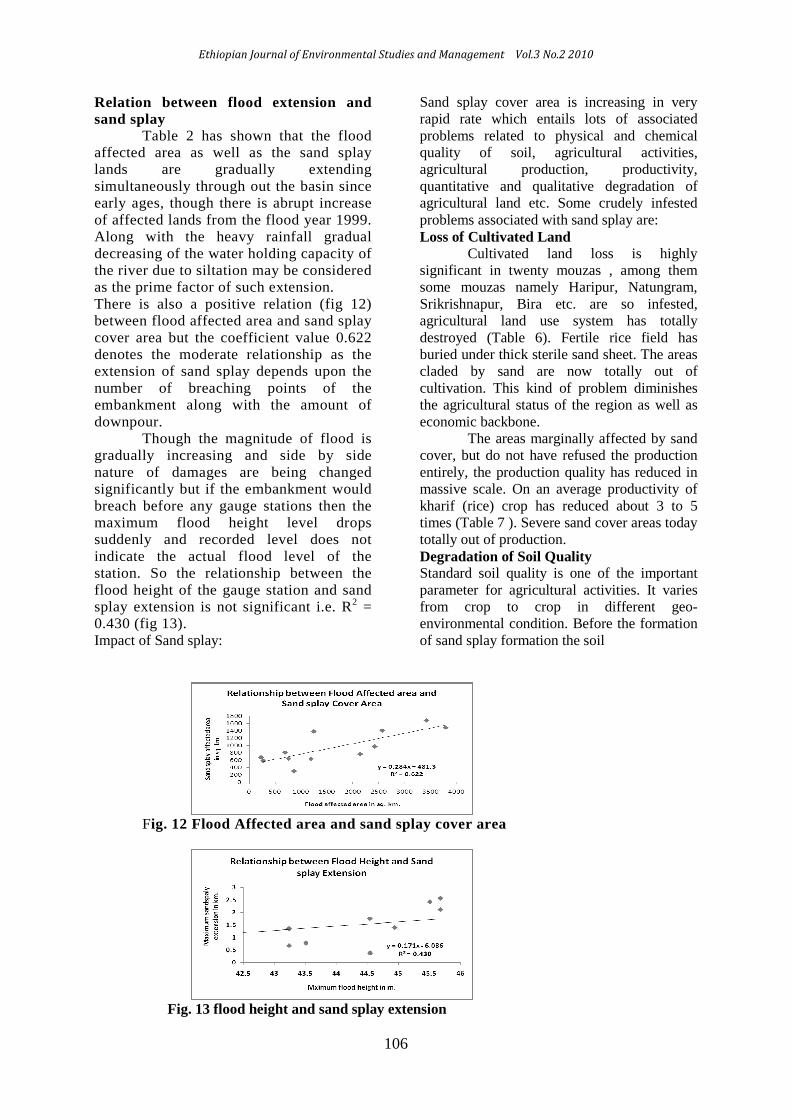
Textural pattern of the sand splay The sand splay has changed the
micro topographical pattern of the flood
plain. A cross sectional profile has drawn
(fig 11) at Maliara, one of the important
embankment beaching point, to make a
comparison between the former and
present land configuration (Mukherjee
2003). The depth of sand cover is about 20
cm near to the river but just after crossing
the embankment landward the depth has
increased to 1.5 mt and gradually the depth
decreases with distance. It is also noticed
that 90% of the sand ranges from 1.00 mm
to 106 micron.
Changing Faces Of Floods................ Sutapa EJESM Vol.3 No.2 2010
105
Fig. 10 Status of sand splay cover area and marshy land
Fig. 11 Cross section of sandsplay
Moreover the slight amount (nearly to
1.5%) of coarse sediments can be marked
near the breaching point due to sudden
flash of water but gradually becomes finer
as moving apart.
Ethiopian Journal of Environmental Studies and Management Vol.3 No.2 2010
106
Relation between flood extension and
sand splay
Table 2 has shown that the flood
affected area as well as the sand splay
lands are gradually extending
simultaneously through out the basin since
early ages, though there is abrupt increase
of affected lands from the flood year 1999.
Along with the heavy rainfall gradual
decreasing of the water holding capacity of
the river due to siltation may be considered
as the prime factor of such extension.
There is also a positive relation (fig 12)
between flood affected area and sand splay
cover area but the coefficient value 0.622
denotes the moderate relationship as the
extension of sand splay depends upon the
number of breaching points of the
embankment along with the amount of
downpour.
Though the magnitude of flood is
gradually increasing and side by side
nature of damages are being changed
significantly but if the embankment would
breach before any gauge stations then the
maximum flood height level drops
suddenly and recorded level does not
indicate the actual flood level of the
station. So the relationship between the
flood height of the gauge station and sand
splay extension is not significant i.e. R2 =
0.430 (fig 13).
Impact of Sand splay:
Sand splay cover area is increasing in very
rapid rate which entails lots of associated
problems related to physical and chemical
quality of soil, agricultural activities,
agricultural production, productivity,
quantitative and qualitative degradation of
agricultural land etc. Some crudely infested
problems associated with sand splay are:
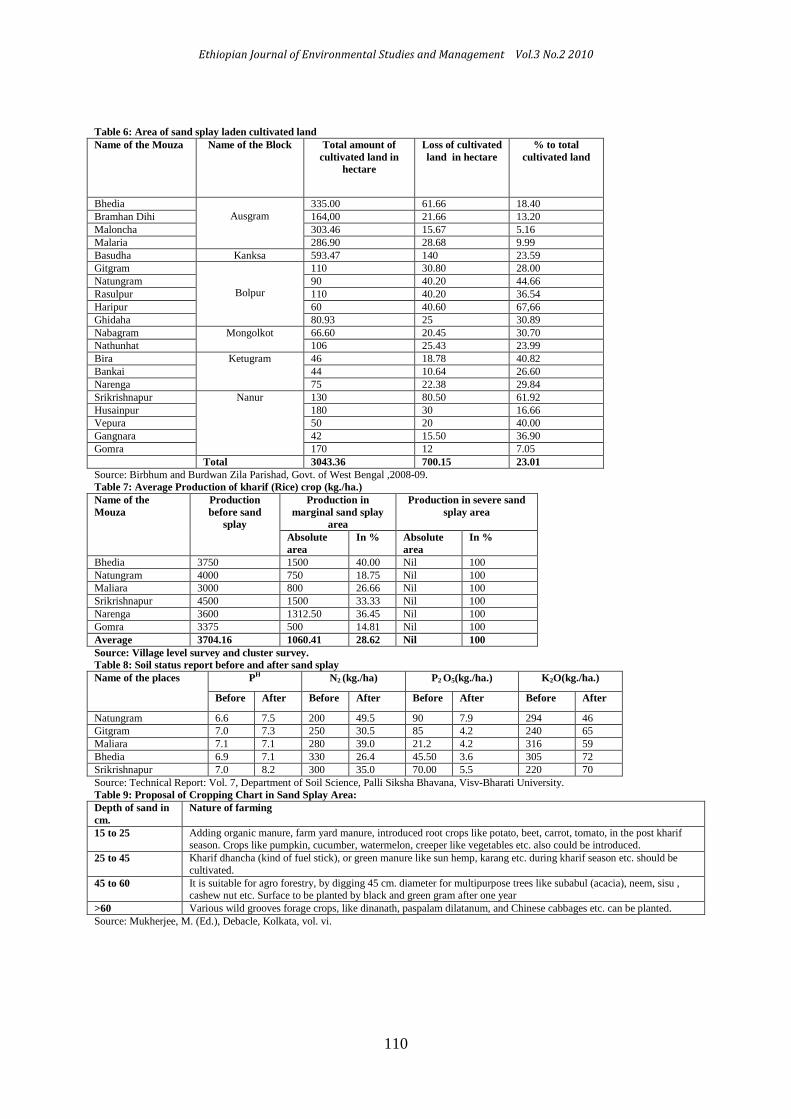
Loss of Cultivated Land
Cultivated land loss is highly
significant in twenty mouzas , among them
some mouzas namely Haripur, Natungram,
Srikrishnapur, Bira etc. are so infested,
agricultural land use system has totally
destroyed (Table 6). Fertile rice field has
buried under thick sterile sand sheet. The areas
claded by sand are now totally out of
cultivation. This kind of problem diminishes
the agricultural status of the region as well as
economic backbone.
The areas marginally affected by sand
cover, but do not have refused the production
entirely, the production quality has reduced in
massive scale. On an average productivity of
kharif (rice) crop has reduced about 3 to 5
times (Table 7 ). Severe sand cover areas today
totally out of production.
Degradation of Soil Quality Standard soil quality is one of the important
parameter for agricultural activities. It varies
from crop to crop in different geo-
environmental condition. Before the formation
of sand splay formation the soil
Fig. 12 Flood Affected area and sand splay cover area
Fig. 13 flood height and sand splay extension

Changing Faces Of Floods................ Sutapa EJESM Vol.3 No.2 2010
107
The areas marginally affected by sand
cover, but do not have refused the production
entirely, the production quality has reduced in
massive scale. On an average productivity of
kharif (rice) crop has reduced about 3 to 5
times (Table 7 ). Severe sand cover areas today
totally out of production.
Degradation of Soil Quality
Standard soil quality is one of the important
parameter for agricultural activities. It varies
from crop to crop in different geo-
environmental condition. Before the formation
of sand splay formation the soil quality was
very much amicable for the production of
paddy, vegetables etc. but after the coverage of
sand splay, that suitable soil condition has
abruptly degraded. Some essential macro soil
quality for crop cultivation like PH, N2, P2O5,
K2O etc. has changed for a great extent, which
is withstanding against healthy production of
crops. N2, P2O5, K2O etc. have reduced in such
a scale these are far below the expected
threshold limit for good production. N2 has
reduced about 5 to 10 times; P2O5 has lowered
down about 15 to 25 times and K2O about 3 to
5 times (Table8). So soil quality has degraded
in such a pattern that existing paddy dominated
crop culture is highly hampered.
Change of Occupation Structure Most of the people in the Lower Ajoy River
Basin were largely dependent on agricultural
activities for their life and livelihood. But in
the places where the extent of sand splay is
excessively high, agricultural land has thickly
covered by sand and has under gone into
massive sterility against production there the
rural people who were engaged into
agricultural sector have forced to shift in other
occupation like missioners, daily day labour,
retail business etc. In fact, the newly emerged
sand splay land may be considered as the
principal responsible for shifting of population
from cultivator to agricultural labourer, big
farmer to marginal farmer, primary worker to
marginal secondary workers etc. But the
agricultural oustees are not in well and peace
at all.
Sand Splay Alleviation Measures
Sand splay is newly growing quasi-
geomorphic hazard caused by human being for
taming the river flow. Lofty embankments
along the river are considered as the prime
cause of such disaster So immediate step
should be taken to resist this problem in very
childhood. For this both structural and non-
structural measures can be adopted.
Structural Measures Embankment should be broad based
and narrow apex and should be stair stepped. It
will help to soak and reduce the striking force
of flood discharge. The arc of the embankment
should be caged right from the base, because
these places get maximum corrosive force
from rushing discharge. These steps will help
to reduce the tendency of embankment
breaching. Sensitive places of the embankment
should be surfaced and concretized to save it
from sudden breaching. The places already
affected by sand splay, phase wise sand
removal programs should be activated. The
quality sand could be served to the brick clin
factory, households who are willing to
construct concrete houses. Government,
agricultural landholders and the consumers of
the sand can share the cost.
Non-structural Measure
Instead of the remove of sand heap,
existing land should be taken into cultivation
programs either mixing of required bio-
fertilizers and chemicals.According to the
thickness of sand, new crop charts should be
prepared. Over sand splay it is quite
impossible to cultivate paddy for the first time
but there are many crops like watermelon,
cucumber, vegetables etc. those can be
cultivated normally on those region. The
following proposed crop chart for different
sand splay thickness zone would give the detail
cropping guidelines. For minor change of sand
splay texture, spraying of soil from outsides
could be done. It will help to raise the level of
soil cultivability.
Conclusion
The flood situation and its way of
lateral extension and inundation being
performed in such a manner that the flood
plain dwellers have nothing to do against
flood. The present alleviation measures
like the increase of height of embankment,
repairing of embankment, aforestation in
the upper catchment for checking soil
erosion etc adapted by the local
government become turns into failure and
seems to be the false security to the bank
dwellers. Structural measures are very
expensive and time-consuming policies. So
new solutions may increasingly
Ethiopian Journal of Environmental Studies and Management Vol.3 No.2 2010
108
acknowledge the indigenous, traditional
and innovative strategies to cope with
floods, like flood tolerant houses and crops
(Kundzewicz, 2000). Provision of
adequate and unhindered natural drainage
of the flood plain is mandatory for the
upkeep of the ecology and health of the
flood plains. This should be made possible
by improving, restoring and increasing the
number of waterways for the quick and
efficient passage of floodwater as well as
making available all natural flood storage
on the flood plains. So in fine it may be
suggested that to keep a healthy
environmental aspect of the flood plain the
behavioral adjustment of flood plain
dwellers should be changed as well as the
policy makers and administrator should
think for alternative policies in flood
reduction and management.
References:
Kundzewicz, Z.W. (2000), Coping with
Hydrological Extremes, Water International,
25(1), 67-75.
Majumdar, S.C. (1941), Rivers of Bengal
Delta, Department of Irrigation and waterways,
Govt. of West Bengal
Mukherjee, M (2003), Flood and Land
Degradation - A study in the Lower Ajoy
Basin. Land Degradation and Desertification
(Ed). Rawat Publication, India, pp 374 – 381.
Mukhoopadhyay, S. and Mukherjee, M (2005),
Hydrological Characteristics of Flood: A study
in the lower Ajoy river. River Floods: A Socio
technical Approach. ACB Publications. pp 51-
58.
Pearce, F. (2001): Dams and floods. WWF
International Research Paper, www.relief
Web.int
Saha, M.N. (1935), Collected works of
M.N.Saha,Vol.I, University of Calcutta, India.
William, W (1930), Lectures on the Ancient
System of Irrigation in Bengal, University of
Calcutta. India
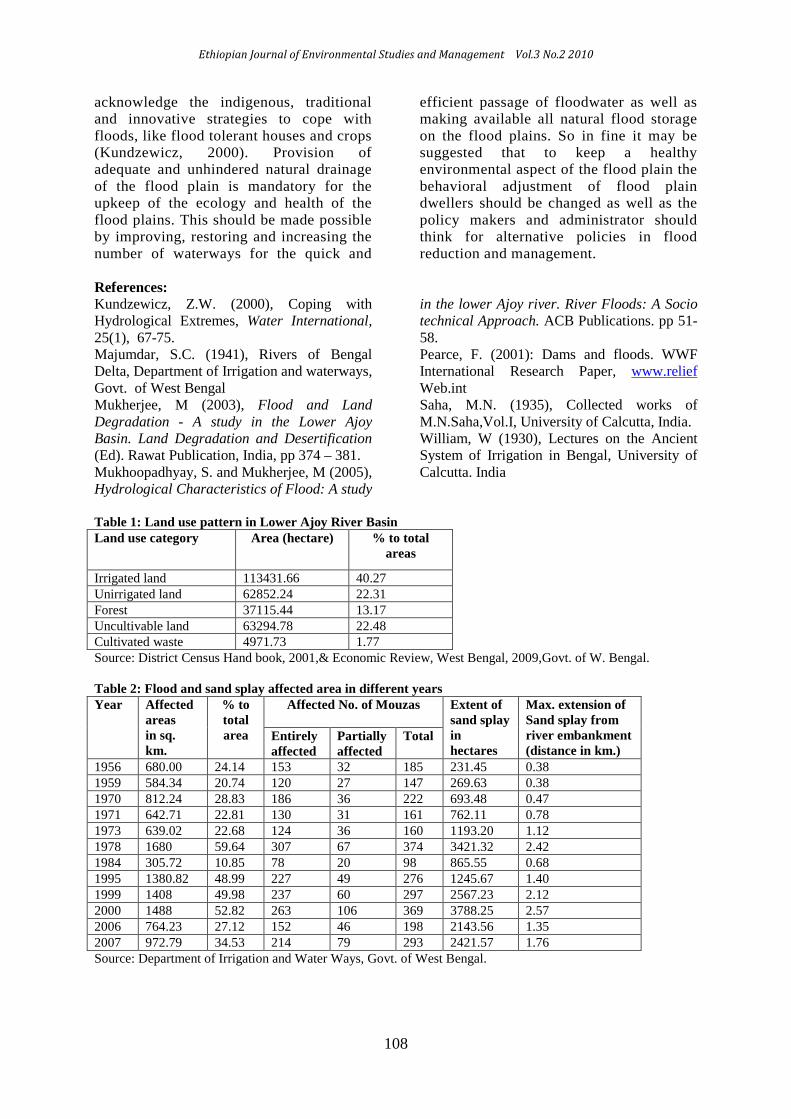
Table 1: Land use pattern in Lower Ajoy River Basin
Land use category Area (hectare) % to total
areas
Irrigated land 113431.66 40.27
Unirrigated land 62852.24 22.31
Forest 37115.44 13.17
Uncultivable land 63294.78 22.48
Cultivated waste 4971.73 1.77
Source: District Census Hand book, 2001,& Economic Review, West Bengal, 2009,Govt. of W. Bengal.
Table 2: Flood and sand splay affected area in different years
Year Affected
areas
in sq.
km.
% to
total
area
Affected No. of Mouzas
Extent of
sand splay
in
hectares
Max. extension of
Sand splay from
river embankment
(distance in km.) Entirely
affected
Partially
affected
Total
1956 680.00 24.14 153 32 185 231.45 0.38
1959 584.34 20.74 120 27 147 269.63 0.38
1970 812.24 28.83 186 36 222 693.48 0.47
1971 642.71 22.81 130 31 161 762.11 0.78
1973 639.02 22.68 124 36 160 1193.20 1.12
1978 1680 59.64 307 67 374 3421.32 2.42
1984 305.72 10.85 78 20 98 865.55 0.68
1995 1380.82 48.99 227 49 276 1245.67 1.40
1999 1408 49.98 237 60 297 2567.23 2.12
2000 1488 52.82 263 106 369 3788.25 2.57
2006 764.23 27.12 152 46 198 2143.56 1.35
2007 972.79 34.53 214 79 293 2421.57 1.76
Source: Department of Irrigation and Water Ways, Govt. of West Bengal.

Changing Faces Of Floods................ Sutapa EJESM Vol.3 No.2 2010
109
Table 3: Highest flood level in different gauge stations. Gauge
Station
DL (m.)
EDL (m.)
1956 1959 1970 1971 1973 1978 1984 1995 1999 2000 2006 2007
Beta 57.90
58.90
61.05 N.S N.S 59.06 N.S 61.14 58.83 59.75 60.70 61.50 58.70 60.65
Satkakonia 51.75
52.75
54.41 N.S 53.50 53.10 53.48 55.44 53.39 54.42 54.68 54.90 53.38 53.84
Maliara 41.70
42.70
45.37 45.58 44.17 44.47 43.16 45.71 43.28 45.72 44.46 45.86 43.42 44.28
Gheropara 39.41
40.41
40.89 41.31 40.51 40.29 40.63 42.82 39.02 42.50 43.25 42.97 40.22 42.60
Natunhat 19.19
20.19
21.02 21.84 20.40 20.62 20.00 22.42 21.70 22.30 22.89 23.21 20.49 21.37
Total 44.548 36.24 39.64
5
43.50
8
39.31
7
45.50
6
43.24
4
44.93
8
45.19
6
45.68
8
43.24
2
44.54
8
Source: Irrigation and Waterways Directorate, Mayurakshi S. Canal Division,Govt. of W.Bengal. N.S.= No Spill.
Table 4: Month wise flow level in different gauge satiations in monsoon season (June to October) Year Station Maliara Station Gheropara Station Natunhat
June July Aug. Sept. Oct. June July Aug. Sept. Oct. June July Aug. Sept. Oct.
1956 40.61 41.90 42.00 45.37 41.28 36.50 37.20 38.40 40.89 39.10 17.60 18.81 19.60 21.02 20.96
1959 40.21 43.22 43.52 44.38 45.58 37.71 38.21 39.80 41.39 38.80 18.10 18.90 19.85 21.18 21.84
1970 42.00 42.45 41.75 44.17 42.09 37.23 39.10 36.40 40.51 39.20 17.12 17.92 18.92 20.40 20.12
1971 39.90 44.08 44.46 44.47 43.19 36.42 37.92 38.60 40.29 37.80 17.42 18.81 19.75 20.62 19.78
1973 NA 42.60 43.16 43.10 NA 36.81 38.82 37.21 40.63 38.50 17.91 19.42 21.00 21.67 19,91
1978 43.60 42.15 42.24 45.71 43.28 38.81 37.50 39.95 42.82 39.70 18.60 17.90 19.01 22.42 21.30
1984 39.70 41.75 43.18 42.91 43.28 38.40 38.21 39.02 37.50 37.45 18.19 19.70 21.60 21.70 21.88
1995 40.61 41.72 42.30 45.72 41.60 38.40 36.86 37.19 42.40 37.20 17.92 18.48 20.00 22.30 20.10
1999 40.50 40.82 41.58 40.40 38.40 36.00 37.17 38.00 43.25 39.59 17.51 18.12 19.65 22.89 19.10
2000 40.60 42.10 42.20 45.86 39.30 36.54 38.78 35.96 40.97 37.00 16.80 17.61 19.18 23.21 18.61
2007 40.21 42.34 42.76 43.27 39.40 37.23 38.90 37.58 37.80 38.23 17.67 17.90 19.34 22.56 20.42
Source: Irrigation and Waterways Directorate, Mayurakshi South Canal Division, Govt. of West Bengal.
Table 5: Sand splay distribution in two banks of the river Year Cumulative no. of sand
splay
Cumulative
total
number
Area of sand splay in hectare Total area in
hectare
Newly affected
area in hectare
Left bank Right bank Left bank Right bank
1956 2 3 5 102.20 119.25 231.45 -
1959 3 5 8 133.42 136.21 269.63 65.67
1970 5 7 12 248.76 444.72 693.48 143.43
1971 6 9 15 368.93 393.18 762.11 165.32
1973 6 11 16 497.66 695.54 1193.20 347.86
1978 9 18 27 1432.32 1989 3421.32 1054.63
1984 9 18 27 335.23 530.3 865.55 89.64
1995 10 19 29 643.27 602.4 1245.67 245.68
1999 10 24 34 1097.74 1469.49 2567.23 1465.31
2000 15 32 47 1478.98 2309.29 3788.25 1678.90
2006 17 32 49 1087.67 1055.89 2143.56 891.34
2007 19 34 53 1165.88 1255.69 2421.57 876.21
Source: Department of Irrigation and Water Ways and Questionnaire survey
Ethiopian Journal of Environmental Studies and Management Vol.3 No.2 2010
110
Table 6: Area of sand splay laden cultivated land
Name of the Mouza Name of the Block Total amount of
cultivated land in
hectare
Loss of cultivated
land in hectare
% to total
cultivated land
Bhedia
Ausgram
335.00 61.66 18.40
Bramhan Dihi 164,00 21.66 13.20
Maloncha 303.46 15.67 5.16
Malaria 286.90 28.68 9.99
Basudha Kanksa 593.47 140 23.59
Gitgram
Bolpur
110 30.80 28.00
Natungram 90 40.20 44.66
Rasulpur 110 40.20 36.54
Haripur 60 40.60 67,66
Ghidaha 80.93 25 30.89
Nabagram Mongolkot 66.60 20.45 30.70
Nathunhat 106 25.43 23.99
Bira Ketugram 46 18.78 40.82
Bankai 44 10.64 26.60
Narenga 75 22.38 29.84
Srikrishnapur Nanur 130 80.50 61.92
Husainpur 180 30 16.66
Vepura 50 20 40.00
Gangnara 42 15.50 36.90
Gomra 170 12 7.05
Total 3043.36 700.15 23.01
Source: Birbhum and Burdwan Zila Parishad, Govt. of West Bengal ,2008-09.
Table 7: Average Production of kharif (Rice) crop (kg./ha.)
Name of the
Mouza
Production
before sand
splay
Production in
marginal sand splay
area
Production in severe sand
splay area
Absolute
area
In % Absolute
area
In %
Bhedia 3750 1500 40.00 Nil 100
Natungram 4000 750 18.75 Nil 100
Maliara 3000 800 26.66 Nil 100
Srikrishnapur 4500 1500 33.33 Nil 100
Narenga 3600 1312.50 36.45 Nil 100
Gomra 3375 500 14.81 Nil 100
Average 3704.16 1060.41 28.62 Nil 100
Source: Village level survey and cluster survey.
Table 8: Soil status report before and after sand splay
Name of the places PH N2 (kg./ha) P2 O5(kg./ha.) K2O(kg./ha.)
Before After Before After Before After Before After
Natungram 6.6 7.5 200 49.5 90 7.9 294 46
Gitgram 7.0 7.3 250 30.5 85 4.2 240 65
Maliara 7.1 7.1 280 39.0 21.2 4.2 316 59
Bhedia 6.9 7.1 330 26.4 45.50 3.6 305 72
Srikrishnapur 7.0 8.2 300 35.0 70.00 5.5 220 70
Source: Technical Report: Vol. 7, Department of Soil Science, Palli Siksha Bhavana, Visv-Bharati University.
Table 9: Proposal of Cropping Chart in Sand Splay Area:
Depth of sand in
cm.
Nature of farming
15 to 25 Adding organic manure, farm yard manure, introduced root crops like potato, beet, carrot, tomato, in the post kharif
season. Crops like pumpkin, cucumber, watermelon, creeper like vegetables etc. also could be introduced.
25 to 45 Kharif dhancha (kind of fuel stick), or green manure like sun hemp, karang etc. during kharif season etc. should be
cultivated.
45 to 60 It is suitable for agro forestry, by digging 45 cm. diameter for multipurpose trees like subabul (acacia), neem, sisu ,
cashew nut etc. Surface to be planted by black and green gram after one year
>60 Various wild grooves forage crops, like dinanath, paspalam dilatanum, and Chinese cabbages etc. can be planted.
Source: Mukherjee, M. (Ed.), Debacle, Kolkata, vol. vi.