a. general information - rutgers university data set 2016 - 2017 rutgers university - newark...
TRANSCRIPT
Common Data Set 2016 - 2017RUTGERS UNIVERSITY - NEWARK
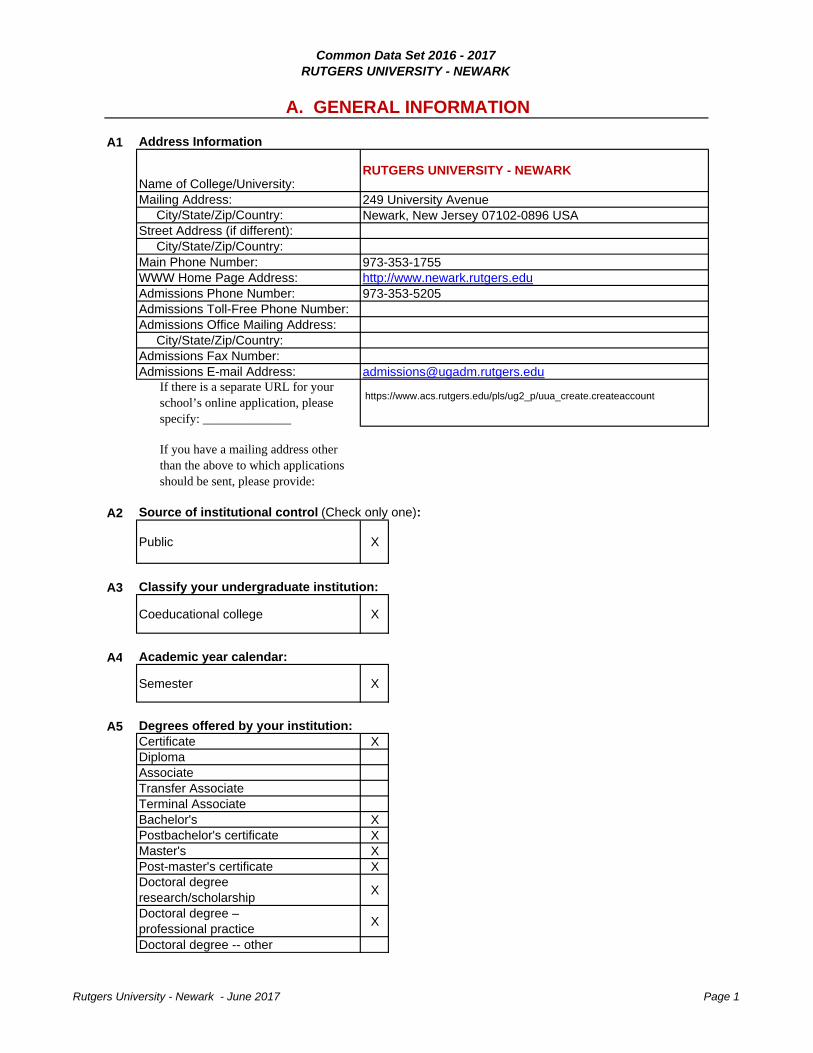
A1 Address Information
Name of College/University:Mailing Address: City/State/Zip/Country:Street Address (if different): City/State/Zip/Country:Main Phone Number:WWW Home Page Address:Admissions Phone Number:Admissions Toll-Free Phone Number:Admissions Office Mailing Address: City/State/Zip/Country:Admissions Fax Number:Admissions E-mail Address:
If there is a separate URL for your school’s online application, please specify: ______________
If you have a mailing address other than the above to which applications should be sent, please provide:
A2
Public X
A3 Classify your undergraduate institution:
Coeducational college X
A4 Academic year calendar:
Semester X
A5 Degrees offered by your institution:Certificate XDiplomaAssociate Transfer AssociateTerminal AssociateBachelor's XPostbachelor's certificate XMaster's XPost-master's certificate XDoctoral degreeresearch/scholarship
X
Doctoral degree –professional practice
X
Doctoral degree -- other
Source of institutional control (Check only one):
973-353-5205
973-353-1755http://www.newark.rutgers.edu
https://www.acs.rutgers.edu/pls/ug2_p/uua_create.createaccount
A. GENERAL INFORMATION
RUTGERS UNIVERSITY - NEWARK
Newark, New Jersey 07102-0896 USA249 University Avenue
Rutgers University - Newark - June 2017 Page 1

Common Data Set 2016 - 2017RUTGERS UNIVERSITY - NEWARK
B1
Men Women Men WomenUndergraduatesDegree-seeking, first-time freshmen 611 726 4 3Other first-year, degree-seeking 169 177 35 13All other degree-seeking 2,314 2,669 438 532Total degree-seeking 3,094 3,572 477 548All other undergraduates enrolled in credit courses 8 6 219 246Total undergraduates 3,102 3,578 696 794GraduateDegree-seeking, first-time 400 360 256 187
All other degree-seeking 600 505 929 781All other graduates enrolled in credit courses 2 3 57 71Total graduate 1,002 868 1,242 1,039
8,1704,151
12,3214,104 4,446 1,938 1,833
B2
Degree-SeekingFirst-TimeFirst Year
Degree-SeekingUndergraduates (include first-time
first-year)
TotalUndergraduates
(both degree- and non-degree-seeking)
63 349 356369 2,171 2,190216 1,458 1,478302 1,825 1,917
1 3 4327 1,538 1,653
3 23 2441 196 20322 128 345
1,344 7,691 8,170
Native Hawaiian or other Pacific Islander, non-HispanicTwo or more races, non-HispanicRace and/or ethnicity unknownTOTAL
GRAND TOTAL ALL STUDENTS
Nonresident aliens
Black or African American, non-Hispanic
American Indian or Alaska Native, non-Hispanic
Hispanic/Latino
White, non-Hispanic
Asian, non-Hispanic
B. ENROLLMENT AND PERSISTENCE
FULL-TIME PART-TIME
Total all undergraduatesTotal all graduate
Institutional Enrollment - Men and Women Provide numbers of students for each of the following categories as of the institution's official fall reporting date or as of October 15, 2016. Note: Report students formerly designated as “first professional” in the graduate cells.
Enrollment by Racial/Ethnic Category. Provide numbers of undergraduate students for each of the following categories as of the institution's official fall reporting date or as of October 15, 2016. Include international students only in the category "Nonresident aliens." Complete the "Total Undergraduates" column only if you cannot provide data for the first two columns. Report as your institution reports to IPEDS: persons who are Hispanic should be reported only on the Hispanic line, not under any race, and persons who are non-Hispanic multi-racial should be reported only under "Two or more races."
Rutgers University - Newark - June 2017 Page 2

Common Data Set 2016 - 2017RUTGERS UNIVERSITY - NEWARK
PersistenceB3 Number of degrees awarded from July 1, 2015 to June 30, 2016
Certificate/diplomaAssociate degreesBachelor's degrees 1588Postbachelor's certificatesMaster's degrees 1043Post-Master's certificatesDoctoral degrees – research/scholarship 74Doctoral degrees – professional practice 196Doctoral degrees – other TOTAL 2,901
Graduation Rates
Fall 2010 Cohort
B4
933B5
1B6
932B7
316B8
239B9
60B10
615B11
66.0%
Please provide data for the Fall 2010 cohort if available. If Fall 2010 cohort data are not available, provide data for the Fall 2009 cohort.
Of the initial 2010 cohort, how many did not persist and did not graduate for the following reasons: death, permanent disability, service in the armed forces, foreign aid service of the federal government, or official church missions; total allowable exclusions:
Final 2010 cohort, after adjusting for allowable exclusions: (subtract question B5 from question B4)
Of the initial 2010 cohort, how many completed the program in four years or less (by August 31, 2014):
Of the initial 2010 cohort, how many completed the program in more than four years but in five years or less (after August 31, 2014 and by August 31, 2015):
Of the initial 2010 cohort, how many completed the program in more than five years but in six years or less (after August 31, 2015 and by August 31, 2016):
Total graduating within six years (sum of questions B7, B8, and B9):
Six-year graduation rate for 2010 cohort (question B10 divided by question B6):
The items in this section correspond to data elements collected by the IPEDS Web-based Data Collection System's Graduation Rate Survey (GRS). For complete instructions and definitions of data elements, see the IPEDS GRS instructions and glossary on the 2016 Web-based survey.
For Bachelor's or Equivalent Programs
Report for the cohort of full-time first-time bachelor's (or equivalent) degree-seeking undergraduate students who entered in Fall 2010. Include in the cohort those who entered your institution during the summer term preceding Fall 2010.
Initial 2010 cohort of first-time, full-time bachelor's (or equivalent) degree-seeking undergraduate students; total all students:
Rutgers University - Newark - June 2017 Page 3

Common Data Set 2016 - 2017RUTGERS UNIVERSITY - NEWARK
Fall 2009 Cohort
B4
906B5
0B6
906B7
301B8
257B9
56B10
614B11
67.8%
Retention Rates
B22
84.1%
Report for the cohort of all full-time, first-time bachelor’s (or equivalent) degree-seeking undergraduate students who entered in Fall 2015 (or the preceding summer term). The initial cohort may be adjusted for students who departed for the following reasons: death, permanent disability, service in the armed forces, foreign aid service of the federal government or official church missions. No other adjustments to the initial cohort should be made.
For the cohort of all full-time bachelor’s (or equivalent) degree-seeking undergraduate students who entered your institution as freshmen in Fall 2015 (or the preceding summer term), what percentage was enrolled at your institution as of the date your institution calculates its official enrollment in Fall 2016?
Of the initial 2009 cohort, how many completed the program in more than five years but in six years or less (after August 31, 2013 and by August 31, 2014):
Report for the cohort of full-time first-time bachelor's (or equivalent) degree-seeking undergraduate students who entered in Fall 2009. Include in the cohort those who entered your institution during the summer term preceding Fall 2009.
Initial 2009 cohort of first-time, full-time bachelor's (or equivalent) degree-seeking undergraduate students; total all students:
Of the initial 2009 cohort, how many did not persist and did not graduate for the following reasons: death, permanent disability, service in the armed forces, foreign aid service of the federal government, or official church missions; total allowable exclusions:
Final 2009 cohort, after adjusting for allowable exclusions: (subtract question B5 from question B4)
Of the initial 2009 cohort, how many completed the program in four years or less (by August 31, 2012):
Of the initial 2009 cohort, how many completed the program in more than four years but in five years or less (after August 31, 2012 and by August 31, 2013):
Total graduating within six years (sum of questions B7, B8, and B9):
Six-year graduation rate for 2009 cohort (question B10 divided by question B6):
Rutgers University - Newark - June 2017 Page 4

Common Data Set 2016 - 2017RUTGERS UNIVERSITY - NEWARK
ApplicationsC1
C1 6,0057,080 13,085
3,8144,732 8,546
611 4 615
726
3 7291,344
C2
Yes NoX
Is your waiting list ranked?
Admission RequirementsC3 High school completion requirement
C4
X
If yes, please answer the questions below for Fall 2014 admissions:Number of qualified applicants offered a placed on waiting listNumber accepting a place on the waiting listNumber of wait-listed students admitted
Do you release that information to school counselors?
Does your institution require or recommend a general college-preparatory program for degree-seeking students?
High school diploma is required and GED is acceptedHigh school diploma is required and GED is not acceptedHigh school diploma or equivalent is not required
Total first-time, first-year (freshman) women who were admitted
Total full-time, first-time, first-year (freshman) men who enrolledTotal part-time, first-time, first-year (freshman) men who enrolled
Freshman wait-listed students (students who met admission requirements but whose final admission was contingent on space availability)
Total full-time, first-time, first-year (freshman) women who enrolledTotal part-time, first-time, first-year (freshman) women who enrolled
Do you have a policy of placing students on a waiting list?
If yes, do you release that information to students?
C. FIRST-TIME, FIRST-YEAR (FRESHMAN) ADMISSION
Total first-time, first-year (freshman) men who appliedTotal first-time, first-year (freshman) women who applied
Total first-time, first-year (freshman) men who were admitted
RecommendNeither require nor recommend
Require
First-time, first-year, (freshmen) students: Provide the number of degree-seeking, first-time, first-year students who applied, were admitted, and enrolled (full- or part-time) in Fall 2016. Include early decision, early action, and students who began studies during summer in this cohort. Applicants should include only those students who fulfilled the requirements for consideration for admission (i.e., who completed actionable applications) and who have been notified of one of the following actions: admission, nonadmission, placement on waiting list, or application withdrawn (by applicant or institution). Admitted applicants should include wait-listed students who were subsequently offered admission.
Rutgers University - Newark - June 2017 Page 5

Common Data Set 2016 - 2017RUTGERS UNIVERSITY - NEWARK
C5
UnitsRequired
UnitsRecommended
Total academic courses 16English 4
Mathematics
3(including Algebra I,
Geometry, Algebra II)
Science2 years (Nursing 1
year each of biology and chemistry)
Of these, units that must be lab
Foreign language2 years of one
language; Nursing not required
Social studiesHistory
Other Academic courses
5 other academic courses; 7 other
academic courses for Nursing
Computer ScienceVisual/Performing Arts
Basis for SelectionC6
N/A
N/A
Do you have an open admission policy, under which virtually all secondary school graduates or students with GED equivalency diplomas are admitted without regard to academic record, test scores, or other qualifications? If so, check which applies:
other (explain)
selective admission for out-of-state students selective admission to some programs
Open admission policy as described above for most students, but--Open admission policy as described above for all students
Rutgers University - Newark - June 2017 Page 6
Common Data Set 2016 - 2017RUTGERS UNIVERSITY - NEWARK
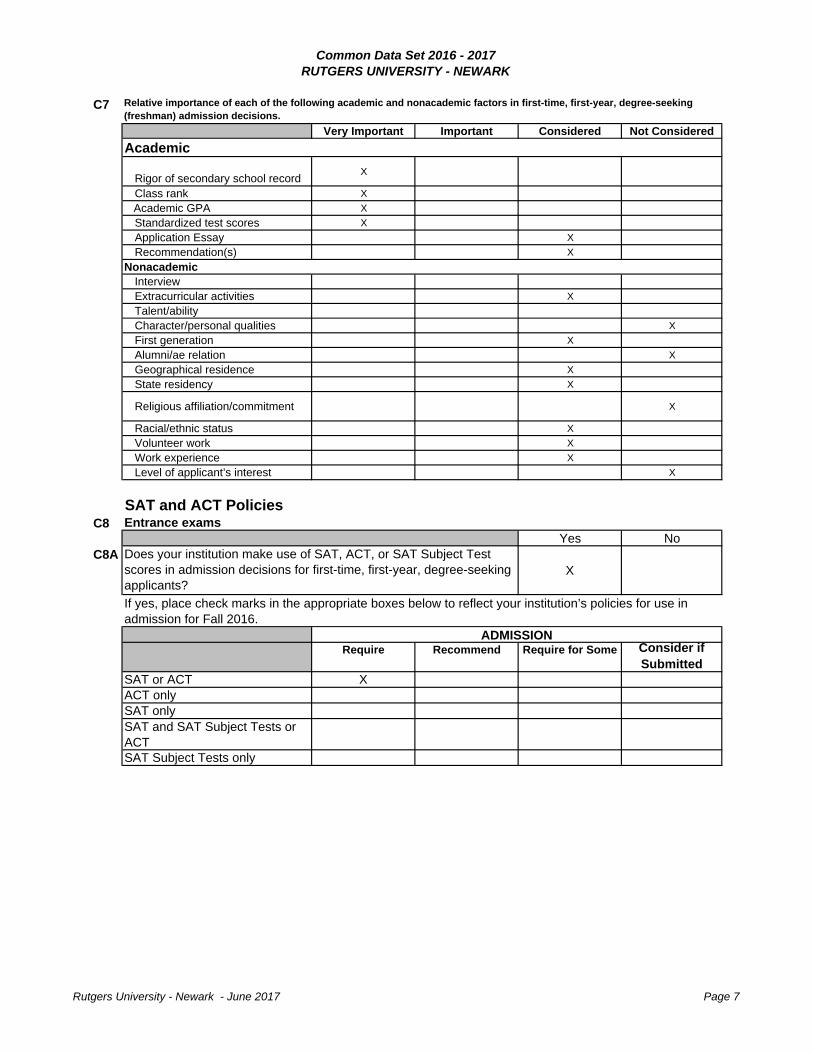
C7
Very Important Important Considered Not Considered
Academic
Rigor of secondary school recordX
Class rank X
Academic GPA X
Standardized test scores X
Application Essay X
Recommendation(s) X
NonacademicInterview
Extracurricular activities X
Talent/ability
Character/personal qualities X
First generation X
Alumni/ae relation X
Geographical residence X
State residency X
Religious affiliation/commitment X
Racial/ethnic status X
Volunteer work X
Work experience X
Level of applicant’s interest X
SAT and ACT PoliciesC8 Entrance exams
Yes NoC8A
X
Require Recommend Require for Some Consider if Submitted
SAT or ACT XACT onlySAT onlySAT and SAT Subject Tests or ACTSAT Subject Tests only
Relative importance of each of the following academic and nonacademic factors in first-time, first-year, degree-seeking (freshman) admission decisions.
ADMISSION
If yes, place check marks in the appropriate boxes below to reflect your institution’s policies for use in admission for Fall 2016.
Does your institution make use of SAT, ACT, or SAT Subject Test scores in admission decisions for first-time, first-year, degree-seeking applicants?
Rutgers University - Newark - June 2017 Page 7
Common Data Set 2016 - 2017RUTGERS UNIVERSITY - NEWARK
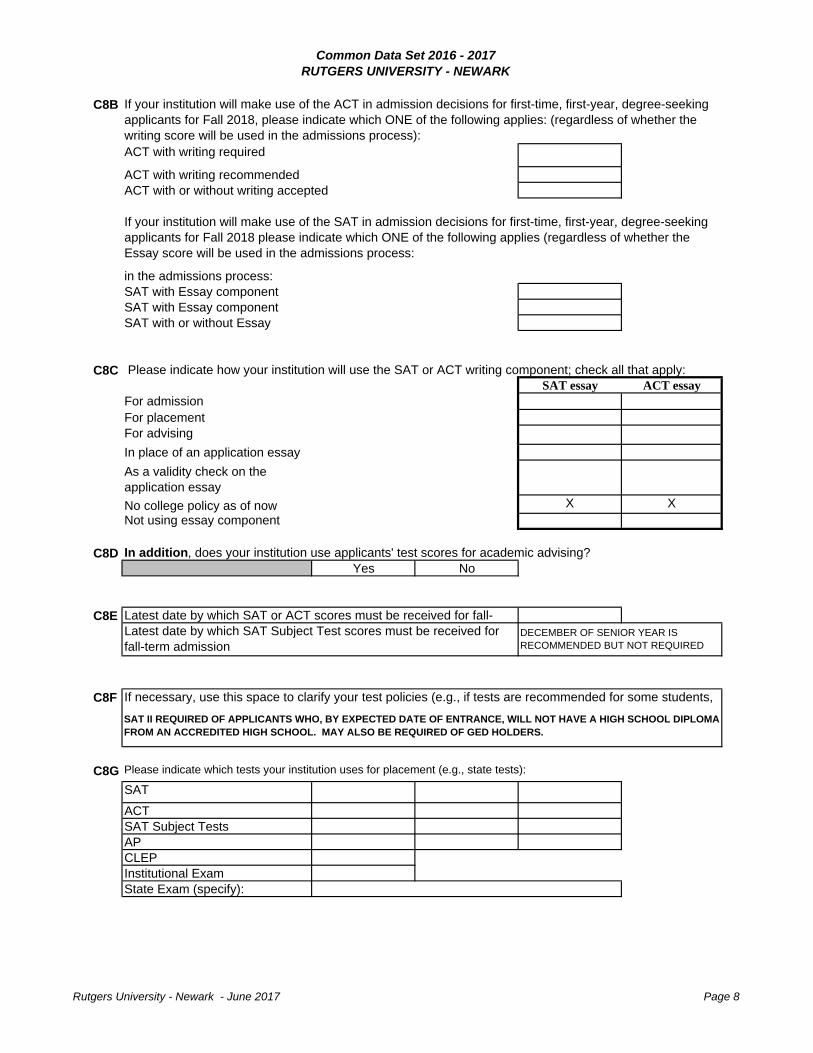
C8B
in the admissions process:SAT with Essay component SAT with Essay component SAT with or without Essay
C8CSAT essay ACT essay
For admissionFor placementFor advising
In place of an application essay
As a validity check on the application essay
No college policy as of now X XNot using essay component
C8DYes No
C8E
C8F
C8G
SAT
ACTSAT Subject TestsAPCLEPInstitutional ExamState Exam (specify):
If your institution will make use of the ACT in admission decisions for first-time, first-year, degree-seeking applicants for Fall 2018, please indicate which ONE of the following applies: (regardless of whether the writing score will be used in the admissions process):
Please indicate how your institution will use the SAT or ACT writing component; check all that apply:
ACT with writing required
ACT with writing recommendedACT with or without writing accepted
Latest date by which SAT or ACT scores must be received for fall-Latest date by which SAT Subject Test scores must be received for fall-term admission
Please indicate which tests your institution uses for placement (e.g., state tests):
In addition, does your institution use applicants' test scores for academic advising?
If your institution will make use of the SAT in admission decisions for first-time, first-year, degree-seeking applicants for Fall 2018 please indicate which ONE of the following applies (regardless of whether the Essay score will be used in the admissions process:
DECEMBER OF SENIOR YEAR IS RECOMMENDED BUT NOT REQUIRED
SAT II REQUIRED OF APPLICANTS WHO, BY EXPECTED DATE OF ENTRANCE, WILL NOT HAVE A HIGH SCHOOL DIPLOMA FROM AN ACCREDITED HIGH SCHOOL. MAY ALSO BE REQUIRED OF GED HOLDERS.
If necessary, use this space to clarify your test policies (e.g., if tests are recommended for some students,
Rutgers University - Newark - June 2017 Page 8

Common Data Set 2016 - 2017RUTGERS UNIVERSITY - NEWARK
Freshman Profile
C9
C9 Percent submitting SAT scores 94% 1,257Percent submitting ACT scores
25th Percentile 75th PercentileSAT Critical Reading 440 530SAT Math 470 570SAT Writing 450 540SAT EssayACT CompositeACT MathACT EnglishACT Writing
SAT Critical Reading SAT Math SAT Writing
700-800 1% 2% 1%600-699 7% 16% 9%500-599 34% 45% 37%400-499 50% 34% 46%300-399 8% 3% 7%200-299Totals should = 100% 100% 100% 100%
ACT Composite ACT English ACT Math30-3624-2918-2312-176-11Below 6Totals should = 100% 0.00% 0.00% 0.00%
Provide percentages for ALL enrolled, degree-seeking, full-time and part-time, first-time, first-year (freshman) students enrolled in Fall 2016, including students who began studies during summer, international students/nonresident aliens, and students admitted under special arrangements.
Number submitting SAT scoresNumber submitting ACT scores
Percent of first-time, first-year (freshman) students with scores in each range:
Percent and number of first-time, first-year (freshman) students enrolled in Fall 2016 who submitted national standardized (SAT/ACT) test scores. Include information for ALL enrolled, degree-seeking, first-time, first-year (freshman) students who submitted test scores. Do not include partial test scores (e.g., mathematics scores but not critical reading for a category of students) or combine other standardized test results (such as TOEFL) in this item. Do not convert SAT scores to ACT scores and vice versa. The 25th percentile is the score that 25 percent scored at or below; the 75th percentile score is the one that 25 percent scored at or above.
Rutgers University - Newark - June 2017 Page 9
Common Data Set 2016 - 2017RUTGERS UNIVERSITY - NEWARK
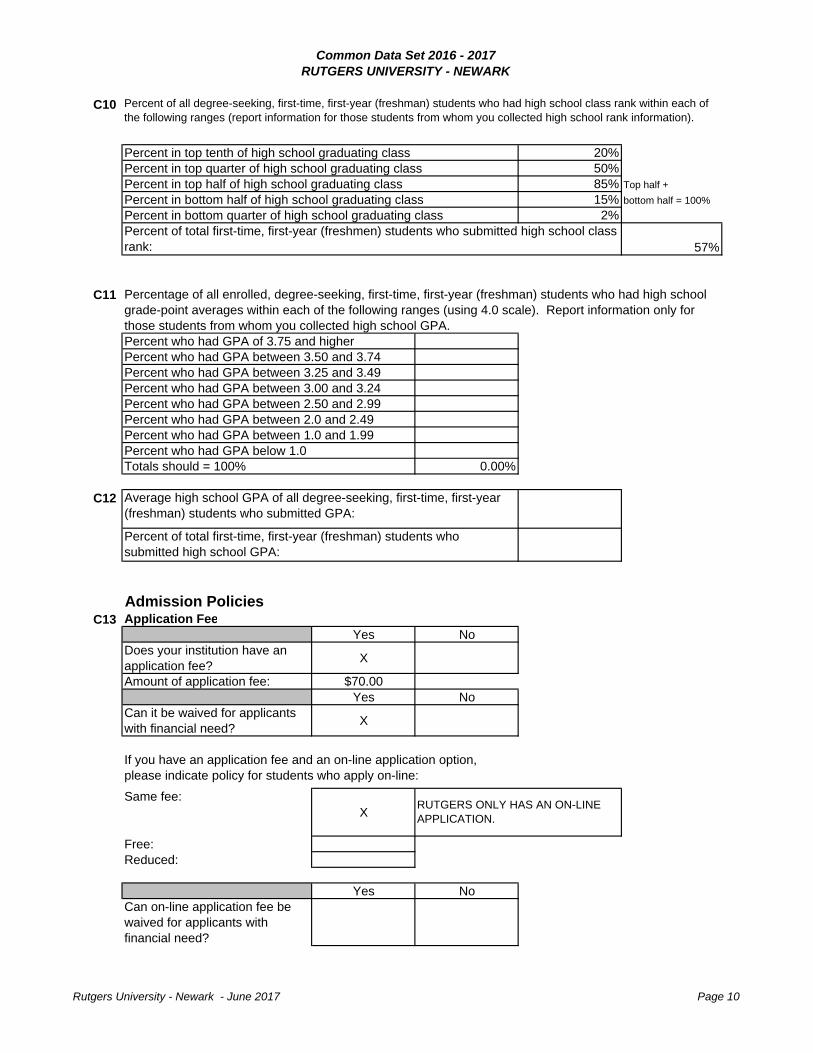
C10
20%50%85% Top half +
15% bottom half = 100%
2%
57%
C11
0.00%
C12
Admission PoliciesC13 Application Fee
Yes NoDoes your institution have an application fee?
X
Amount of application fee: $70.00Yes No
Can it be waived for applicants with financial need?
X
Same fee:X
Free:Reduced:
Yes NoCan on-line application fee be waived for applicants with financial need?
Average high school GPA of all degree-seeking, first-time, first-year (freshman) students who submitted GPA:
Percent of total first-time, first-year (freshman) students who submitted high school GPA:
If you have an application fee and an on-line application option, please indicate policy for students who apply on-line:
Totals should = 100%
Percent of total first-time, first-year (freshmen) students who submitted high school class rank:
Percentage of all enrolled, degree-seeking, first-time, first-year (freshman) students who had high school grade-point averages within each of the following ranges (using 4.0 scale). Report information only for those students from whom you collected high school GPA.
Percent in top tenth of high school graduating classPercent in top quarter of high school graduating classPercent in top half of high school graduating classPercent in bottom half of high school graduating class
Percent who had GPA of 3.75 and higherPercent who had GPA between 3.50 and 3.74Percent who had GPA between 3.25 and 3.49Percent who had GPA between 3.00 and 3.24
Percent of all degree-seeking, first-time, first-year (freshman) students who had high school class rank within each of the following ranges (report information for those students from whom you collected high school rank information).
Percent in bottom quarter of high school graduating class
Percent who had GPA between 2.50 and 2.99Percent who had GPA between 2.0 and 2.49
Percent who had GPA below 1.0Percent who had GPA between 1.0 and 1.99
RUTGERS ONLY HAS AN ON-LINE APPLICATION.
Rutgers University - Newark - June 2017 Page 10

Common Data Set 2016 - 2017RUTGERS UNIVERSITY - NEWARK
C14 Application closing dateYes No
Does your institution have an application closing date?
X
Application closing date (fall): Priority date:
C15 Yes NoX (Varies by
college/campus)
C16 Notification to applicants of admission decision sent (fill in one only)On a rolling basis beginning (date): By (date): Other:
C17 Reply policy for admitted applicants (fill in one only)Must reply by (date): Must reply by May 1 or within 2 weeks if notified thereafter XOther:
Yes, in full Yes, in part No
C18 Deferred admissionYes No
X
C19 Early admission of high school studentsYes No
X
C20 Common Application (Initiated during 2006-2007 cycle)
Are first-time, first-year students accepted for terms other than the fall?
Question removed from CDS.
Deadline for housing deposit (MM/DD): Amount of housing deposit:
Does your institution allow students to postpone enrollment after admission?
Refundable if student does not enroll?
Deferral is granted only for a full academic year, from one fall semester to the very next fall semester. A deferral is official only when you are notified that the Office of University Undergraduate Admissions has granted your request.
Does your institution allow high school students to enroll as full-time, first-time, first-year (freshman) students one year or more before high school graduation?
If yes, maximum period of postponement:
December 1 (First-year applicants) January 15 (Transfer applicants)
Rutgers University - Newark - June 2017 Page 11

Common Data Set 2016 - 2017RUTGERS UNIVERSITY - NEWARK
Early Decision and Early Action PlansC21 Early Decision
Yes No
X
C22 Early actionYes No
X
Is your early action plan a “restrictive” plan under which you limit students from applying to other early plansYes No
Does your institution offer an early decision plan (an admission plan that permits students to apply and be notified of an admission decision well in advance of the regular notification date and that asks students to commit to attending if accepted) for first-time, first-year (freshman) applicants for fall enrollment? If “yes,” please complete the following:
Number of applicants admitted under early decision plan
Other early decision plan closing dateOther early decision plan notification dateFor the Fall 2016 entering class:
Early action notification date
First or only early decision plan closing dateFirst or only early decision plan notification date
Do you have a nonbinding early action plan whereby students are notified of an admission decision well in advance of the regular notification date but do not have to commit to attending your college?
If “yes,” please complete the following: Early action closing date
Please provide significant details about your early decision plan:
Number of early decision applications received by your institution
Rutgers University - Newark - June 2017 Page 12
Common Data Set 2016 - 2017RUTGERS UNIVERSITY - NEWARK
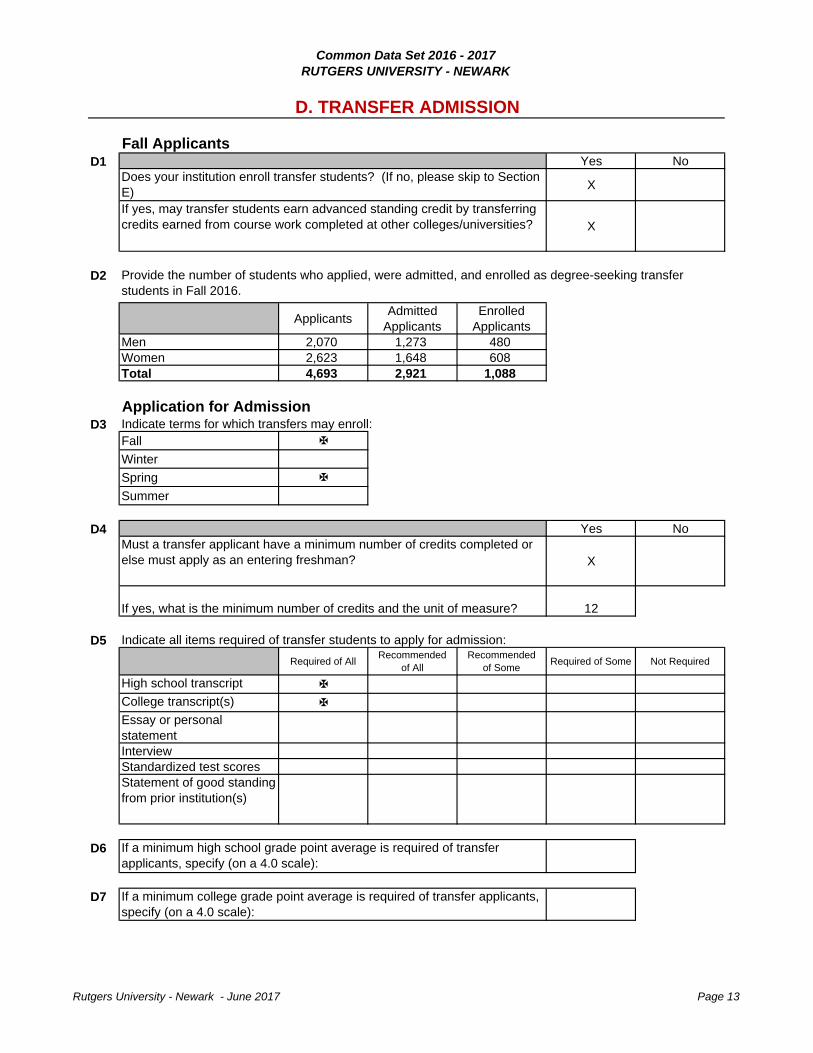
Fall ApplicantsD1 Yes No
X
X
D2
ApplicantsAdmitted
ApplicantsEnrolled
ApplicantsMen 2,070 1,273 480Women 2,623 1,648 608Total 4,693 2,921 1,088
D3Fall Winter
Spring Summer
D4 Yes No
X
12
D5
Required of AllRecommended
of AllRecommended
of SomeRequired of Some Not Required
High school transcript College transcript(s) Essay or personal statementInterviewStandardized test scoresStatement of good standing from prior institution(s)
D6
D7
D. TRANSFER ADMISSION
Indicate all items required of transfer students to apply for admission:
If a minimum high school grade point average is required of transfer applicants, specify (on a 4.0 scale):
Does your institution enroll transfer students? (If no, please skip to Section E)If yes, may transfer students earn advanced standing credit by transferring credits earned from course work completed at other colleges/universities?
If yes, what is the minimum number of credits and the unit of measure?
Application for AdmissionIndicate terms for which transfers may enroll:
Provide the number of students who applied, were admitted, and enrolled as degree-seeking transfer students in Fall 2016.
If a minimum college grade point average is required of transfer applicants, specify (on a 4.0 scale):
Must a transfer applicant have a minimum number of credits completed or else must apply as an entering freshman?
Rutgers University - Newark - June 2017 Page 13
Common Data Set 2016 - 2017RUTGERS UNIVERSITY - NEWARK
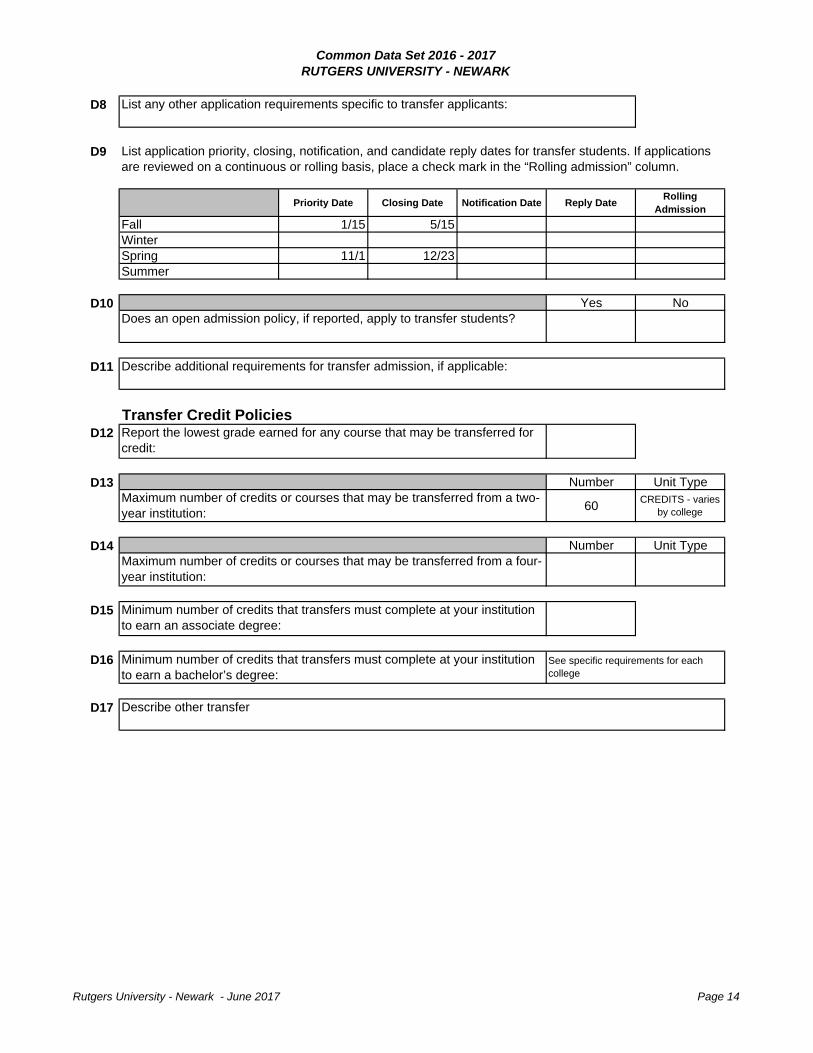
D8
D9
Priority Date Closing Date Notification Date Reply DateRolling
Admission
Fall 1/15 5/15WinterSpring 11/1 12/23Summer
D10 Yes No
D11
D12
D13 Number Unit Type
60CREDITS - varies
by college
D14 Number Unit Type
D15
D16
D17 Describe other transfer
See specific requirements for each college
Does an open admission policy, if reported, apply to transfer students?
Transfer Credit Policies
Describe additional requirements for transfer admission, if applicable:
List any other application requirements specific to transfer applicants:
List application priority, closing, notification, and candidate reply dates for transfer students. If applications are reviewed on a continuous or rolling basis, place a check mark in the “Rolling admission” column.
Maximum number of credits or courses that may be transferred from a four-year institution:
Minimum number of credits that transfers must complete at your institution to earn an associate degree:
Minimum number of credits that transfers must complete at your institution to earn a bachelor’s degree:
Report the lowest grade earned for any course that may be transferred for credit:
Maximum number of credits or courses that may be transferred from a two-year institution:
Rutgers University - Newark - June 2017 Page 14

Common Data Set 2016 - 2017RUTGERS UNIVERSITY - NEWARK
E1
Accelerated program XCooperative education program XCross-registration XDistance learning XDouble major XDual enrollment XEnglish as a Second Language (ESL) XExchange student program (domestic) XExternal degree programHonors Program XIndependent study XInternships XLiberal arts/career combination XStudent-designed major XStudy abroad XTeacher certification program XWeekend college XOther (specify): X
NEWARK CAMPUS:
The Honors College of Rutgers University's Newark College of Arts and Sciences is a four-year program, a college within a college, providing its by-invitation-only students with opportunities for enrichment both in and outside of the classroom. Students invited to join the Honors College benefit from small classes with first-rate faculty, co-curricular internships in major corporations and other institutions, and other special options. Reserved dormitory space, a substantial scholarship program, and research assistantships with faculty members combine to make the RU-Newark Honors College experience unique. For additional information, visit the Honors College website at http://honorsnewark.rutgers.edu or call (973)353-5860.
The School of Nursing offers a program on the New Brunswick Campus. Students are admitted in the fall semester only; BS in Nursing/MS in Nursing.
Cooperative baccalaureate program with School of Engineering (New Brunswick campus);
Cooperative baccalaureate in medical technology with affiliated hospitals; Interdisciplinary programs in archaeology, international affairs, legal studies, women’s studies; continuing professional education;
Baccalaureate in Business Major/Master of Human Resource Management (with School of Management and Labor Relations in New Brunswick); Baccalaureate-master’s dual degree programs with the School of Criminal Justice and Rutgers Business School; BA or BS in Biology/MS in Biology;
BA in Chemistry/MS in Chemistry; BA in Economics/MA in Economics; BS in Environmental Sciences/MS In Environmental Geology; BS in Environmental Sciences/MS in Environmental Sciences; BA in Political Science, Sociology or Anthropology/MS in Global Affairs; BA in History/MA in History; BA in History, Sociology or Anthropology/MA in Jazz History and Research; BA in Political Science/MA in Political Science; BA/MA in Peace and Conflict Studies;
BS in Computer Science or Information Science/Master of Information Technology; BS in Accounting/Master of Accountancy (Governmental Accounting or Financial Accounting); BS in Accounting/MBA in Professional Accounting; BS in Finance/Master of Quantitative Finance; BS/Master of Business and Science (MBS).
Pharm.D./M.B.A. program with Rutgers Business School. JD/MPA with the School of Public Affairs and Administration. MPA/M.Accy. option in Governmental Accounting with Rutgers Business School. MS in Global Affairs/Master of Public Policy with EJB School of Planning and Public Policy.
E. ACADEMIC OFFERINGS AND POLICIES
Special study options: Identify those programs available at your institution. Refer to the glossary for definitions.
5-year baccalaureate-MBA with Rutgers Business School; BS in Business Discipline/MBA; BA or BS in Science Discipline/MBA; Baccalaureate/M.A. in Criminal Justice with the School of Criminal Justice; Baccalaureate/MPA with the School of Public Affairs and Administration;
Rutgers University - Newark - June 2017 Page 15
Common Data Set 2016 - 2017RUTGERS UNIVERSITY - NEWARK
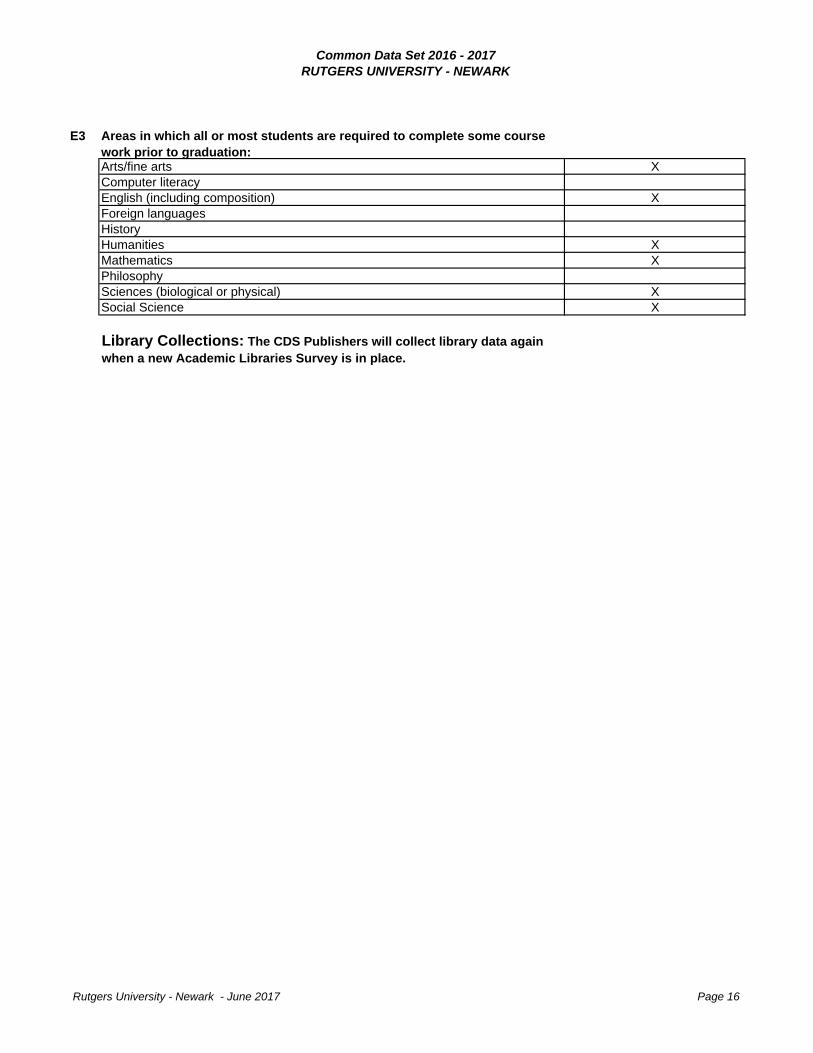
E3 Areas in which all or most students are required to complete some course work prior to graduation:Arts/fine arts XComputer literacyEnglish (including composition) XForeign languagesHistoryHumanities XMathematics XPhilosophySciences (biological or physical) XSocial Science X
Library Collections: The CDS Publishers will collect library data again when a new Academic Libraries Survey is in place.
Rutgers University - Newark - June 2017 Page 16

Common Data Set 2016 - 2017RUTGERS UNIVERSITY - NEWARK
F1
First-time, first-year (freshman) students
Undergraduates
3% 2%
41% 21%59% 79%0.5% 21.2%
18 2018 21
F2Campus Ministries XChoral groups XConcert band XDance XDrama/theater XInternational Student Organization
X
Jazz band XLiterary magazine XMarching band XModel UNMusic ensembles XMusical theater XOpera XPep band XRadio station XStudent government XStudent newspaper XStudent-run film society XSymphony orchestra XTelevision station XYearbook X
F. STUDENT LIFE
Percent who live in college-owned, -operated, or -affiliated housing
Percent who are from out of state (exclude international/nonresident aliens from the numerator and denominator)
Percent of women who join sororitiesPercent of men who join fraternities
Percentages of first-time, first-year (freshman) degree-seeking students and degree-seeking undergraduates enrolled in Fall 2016 who fit the following categories:
Activities offered Identify those programs available at your institution.
Percent who live off campus or commutePercent of students age 25 and olderAverage age of full-time studentsAverage age of all students (full- and part-time)
Rutgers University - Newark - June 2017 Page 17
Common Data Set 2016 - 2017RUTGERS UNIVERSITY - NEWARK
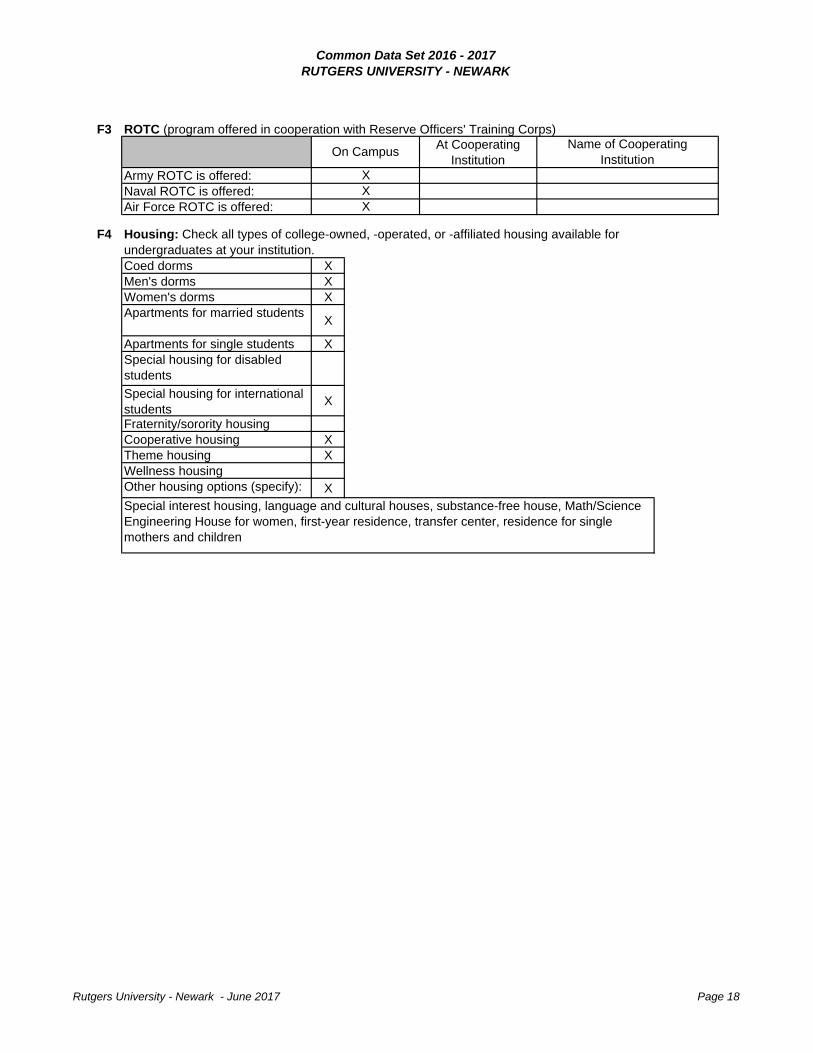
F3At Cooperating
Institution Army ROTC is offered:Naval ROTC is offered:Air Force ROTC is offered:
F4
Coed dorms XMen's dorms XWomen's dorms XApartments for married students
X
Apartments for single students XSpecial housing for disabled students
Special housing for international students
X
Fraternity/sorority housing Cooperative housing XTheme housing XWellness housingOther housing options (specify): X
On Campus
ROTC (program offered in cooperation with Reserve Officers' Training Corps)Name of Cooperating
InstitutionX
XX
Housing: Check all types of college-owned, -operated, or -affiliated housing available for undergraduates at your institution.
Special interest housing, language and cultural houses, substance-free house, Math/Science Engineering House for women, first-year residence, transfer center, residence for single mothers and children
Rutgers University - Newark - June 2017 Page 18
Common Data Set 2016 - 2017
RUTGERS UNIVERSITY - NEWARK
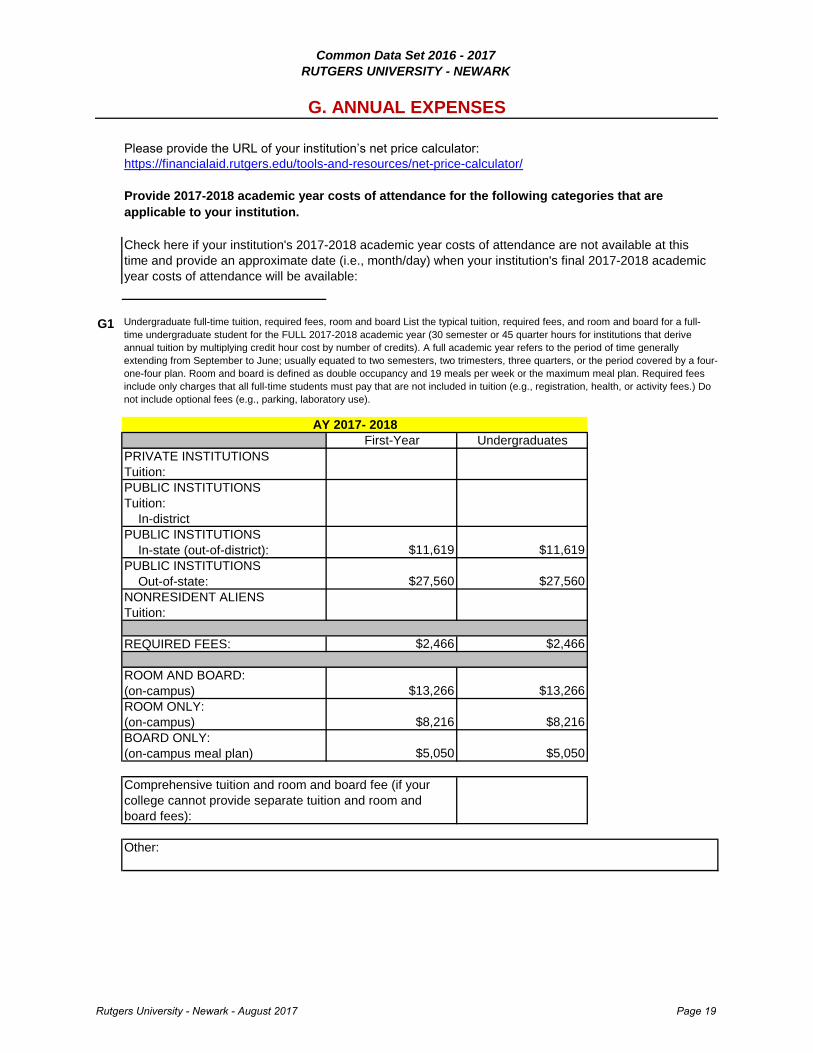
Please provide the URL of your institution’s net price calculator:
https://financialaid.rutgers.edu/tools-and-resources/net-price-calculator/
G1
First-Year Undergraduates
PRIVATE INSTITUTIONS
Tuition:
PUBLIC INSTITUTIONS
Tuition:
In-district
PUBLIC INSTITUTIONS
In-state (out-of-district): $11,619 $11,619
PUBLIC INSTITUTIONS
Out-of-state: $27,560 $27,560
NONRESIDENT ALIENS
Tuition:
REQUIRED FEES: $2,466 $2,466
ROOM AND BOARD:
(on-campus) $13,266 $13,266
ROOM ONLY:
(on-campus) $8,216 $8,216
BOARD ONLY:
(on-campus meal plan) $5,050 $5,050
G. ANNUAL EXPENSES
Provide 2017-2018 academic year costs of attendance for the following categories that are
applicable to your institution.
Comprehensive tuition and room and board fee (if your
college cannot provide separate tuition and room and
board fees):
Other:
AY 2017- 2018
Check here if your institution's 2017-2018 academic year costs of attendance are not available at this
time and provide an approximate date (i.e., month/day) when your institution's final 2017-2018 academic
year costs of attendance will be available:
Undergraduate full-time tuition, required fees, room and board List the typical tuition, required fees, and room and board for a full-
time undergraduate student for the FULL 2017-2018 academic year (30 semester or 45 quarter hours for institutions that derive
annual tuition by multiplying credit hour cost by number of credits). A full academic year refers to the period of time generally
extending from September to June; usually equated to two semesters, two trimesters, three quarters, or the period covered by a four-
one-four plan. Room and board is defined as double occupancy and 19 meals per week or the maximum meal plan. Required fees
include only charges that all full-time students must pay that are not included in tuition (e.g., registration, health, or activity fees.) Do
not include optional fees (e.g., parking, laboratory use).
Rutgers University - Newark - August 2017 Page 19

Common Data Set 2016 - 2017
RUTGERS UNIVERSITY - NEWARK
G2 Minimum Maximum
12 18
G3 No No
G4 Yes No
G5
ResidentsCommuters
(living at home)
Commuters
(not living at home)
Books and supplies $1,350 $1,350 $1,350
Room only
Board only
Room and board total (if your
college cannot provide separate
room and board figures for
commuters not living at home): $3,264 $18,386
Transportation $856 $3,111 $3,111
Other expenses $3,137 $3,137 $3,137
G6
PRIVATE INSTITUTIONS:
PUBLIC INSTITUTIONS
In-district:
PUBLIC INSTITUTIONS
In-state (out-of-district): $374.00
PUBLIC INSTITUTIONS
Out-of-state: $894.00
NONRESIDENT ALIENS:
Provide the estimated expenses for a typical full-time undergraduate student:
Undergraduate per-credit-hour charges (tuition only)
Number of credits per term a student can take for the
stated full-time tuition
Do tuition and fees vary by year of study (e.g., sophomore,
junior, senior)?
Do tuition and fees vary by undergraduate instructional
program?
If yes, what percentage of full-time undergraduates pay
more than the tuition and fees reported in G1?
Rutgers University - Newark - August 2017 Page 20

Common Data Set 2016 - 2017
RUTGERS UNIVERSITY - NEWARK
Please provide the URL of your institution’s net price calculator:
G1
First-Year Undergraduates
PRIVATE INSTITUTIONS
Tuition:
PUBLIC INSTITUTIONS
Tuition:
In-district
PUBLIC INSTITUTIONS
In-state (out-of-district): $11,408 $11,408
PUBLIC INSTITUTIONS
Out-of-state: $27,059 $27,059
NONRESIDENT ALIENS
Tuition:
REQUIRED FEES: $2,421 $2,421
ROOM AND BOARD:
(on-campus) $13,059 $13,059
ROOM ONLY:
(on-campus) $8,095 $8,095
BOARD ONLY:
(on-campus meal plan) $4,964 $4,964
ACADEMIC YEAR 2016 - 2017
Other:
G. ANNUAL EXPENSES
Provide 2016-2017 academic year costs of attendance for the following categories that are
applicable to your institution.
Check here if your institution's 2016-2017 academic year costs of attendance are not available at this
time and provide an approximate date (i.e., month/day) when your institution's final 2016-2017 academic
year costs of attendance will be available:
Undergraduate full-time tuition, required fees, room and board List the typical tuition, required fees, and room and
board for a full-time undergraduate student for the FULL 2016-2017 academic year (30 semester or 45 quarter hours
for institutions that derive annual tuition by multiplying credit hour cost by number of credits). A full academic year
refers to the period of time generally extending from September to June; usually equated to two semesters, two
trimesters, three quarters, or the period covered by a four-one-four plan. Room and board is defined as double
occupancy and 19 meals per week or the maximum meal plan. Required fees include only charges that all full-time
students must pay that are not included in tuition (e.g., registration, health, or activity fees.) Do not include optional
fees (e.g., parking, laboratory use).
Comprehensive tuition and room and board fee (if your
college cannot provide separate tuition and room and
board fees):
Rutgers University - Newark - August 2017 Page 21

Common Data Set 2016 - 2017
RUTGERS UNIVERSITY - NEWARK
G2 Minimum Maximum
12 18
G3 No No
G4 Yes No
G5
ResidentsCommuters
(living at home)
Commuters
(not living at home)
Books and supplies $1,350 $1,350 $1,350
Room only
Board only
Room and board total (if your
college cannot provide separate
room and board figures for
commuters not living at home): $3,126 $17,934
Transportation $856 $3,111 $3,111
Other expenses $3,013 $3,013 $3,013
G6
PRIVATE INSTITUTIONS:
PUBLIC INSTITUTIONS
In-district:
PUBLIC INSTITUTIONS
In-state (out-of-district): $367.00
PUBLIC INSTITUTIONS
Out-of-state: $878.00
NONRESIDENT ALIENS:
If yes, what percentage of full-time undergraduates pay
more than the tuition and fees reported in G1?
Provide the estimated expenses for a typical full-time undergraduate student:
Undergraduate per-credit-hour charges (tuition only)
Number of credits per term a student can take for the
stated full-time tuition
Do tuition and fees vary by year of study (e.g., sophomore,
junior, senior)?
Do tuition and fees vary by undergraduate instructional
program?
Rutgers University - Newark - August 2017 Page 22
Common Data Set 2016 - 2017RUTGERS UNIVERSITY - NEWARK
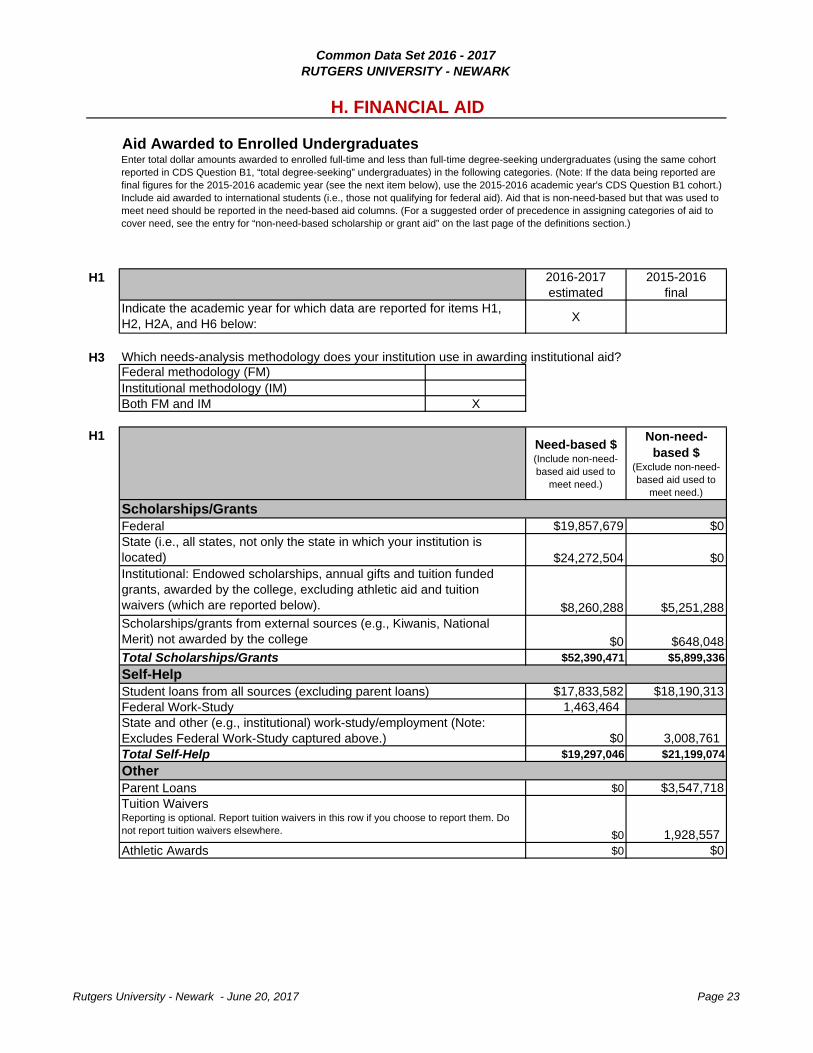
H1 2016-2017 estimated
2015-2016final
X
H3
X
H1Need-based $ (Include non-need-based aid used to
meet need.)
Non-need-based $
(Exclude non-need-based aid used to
meet need.)
$19,857,679 $0
$24,272,504 $0
$8,260,288 $5,251,288
$0 $648,048$52,390,471 $5,899,336
$17,833,582 $18,190,3131,463,464
$0 3,008,761 $19,297,046 $21,199,074
$0 $3,547,718
$0 1,928,557 $0 $0
Enter total dollar amounts awarded to enrolled full-time and less than full-time degree-seeking undergraduates (using the same cohort reported in CDS Question B1, “total degree-seeking” undergraduates) in the following categories. (Note: If the data being reported are final figures for the 2015-2016 academic year (see the next item below), use the 2015-2016 academic year's CDS Question B1 cohort.) Include aid awarded to international students (i.e., those not qualifying for federal aid). Aid that is non-need-based but that was used to meet need should be reported in the need-based aid columns. (For a suggested order of precedence in assigning categories of aid to cover need, see the entry for “non-need-based scholarship or grant aid” on the last page of the definitions section.)
Indicate the academic year for which data are reported for items H1, H2, H2A, and H6 below:
Tuition WaiversReporting is optional. Report tuition waivers in this row if you choose to report them. Do not report tuition waivers elsewhere.
Athletic Awards
State and other (e.g., institutional) work-study/employment (Note: Excludes Federal Work-Study captured above.)
FederalState (i.e., all states, not only the state in which your institution is located)Institutional: Endowed scholarships, annual gifts and tuition funded grants, awarded by the college, excluding athletic aid and tuition waivers (which are reported below).
Scholarships/grants from external sources (e.g., Kiwanis, National Merit) not awarded by the college
Total Scholarships/GrantsSelf-HelpStudent loans from all sources (excluding parent loans)Federal Work-Study
Total Self-HelpOtherParent Loans
H. FINANCIAL AID
Scholarships/Grants
Both FM and IM
Which needs-analysis methodology does your institution use in awarding institutional aid?Federal methodology (FM)Institutional methodology (IM)
Aid Awarded to Enrolled Undergraduates
Rutgers University - Newark - June 20, 2017 Page 23

Common Data Set 2016 - 2017RUTGERS UNIVERSITY - NEWARK
H2
First-timeFull-time
Freshmen
Full-timeUndergraduate
(Incl. Fresh.)
Less ThanFull-time
Undergraduatea) Number of degree-seeking undergraduate students
(CDS Item B1 if reporting on Fall 2014 cohort) 1,337 6,666 1,025
b) Number of students in line a who applied for need-based financial aid
1,072 5,473 431
c) Number of students in line b who were determined to have financial need
999 5,193 414
d) Number of students in line c who were awarded any financial aid
999 5,193 414
e) Number of students in line d who were awarded any need-based scholarship or grant aid
849 4,310 254
f) Number of students in line d who were awarded any need-based self-help aid
740 3,732 318
g) Number of students in line d who were awarded any non-need-based scholarship or grant aid
195 511 11
h) Number of students in line d whose need was fully met (exclude PLUS loans, unsubsidized loans, and private alternative loans)
27 55 6
i) On average, the percentage of need that was met of students who were awarded any need-based aid. Exclude any aid that was awarded in excess of need as well as any resources that were awarded to replace EFC (PLUS loans, unsubsidized loans, and private alternative loans)
60.0% 55.0% 38.0%
j) The average financial aid package of those in line d. Exclude any resources that were awarded to replace EFC (PLUS loans, unsubsidized loans, and private alternative loans)
$ 15,345 $ 14,141 $ 6,637
k)Average need-based scholarship and grant award of those in line e
$ 12,542 $ 11,814 $ 4,411
l) Average need-based self-help award (excluding PLUS loans, unsubsidized loans, and private alternative loans) of those in line f
$ 4,232 $ 4,763 $ 4,652
m) Average need-based loan (excluding PLUS loans, unsubsidized loans, and private alternative loans) of those in line f who were awarded a need-based loan $ 4,200 $ 4,771 $ 4,633
Number of Enrolled Students Awarded Aid: List the number of degree-seeking full-time and less-than-full-time undergraduates who applied for and were awarded financial aid from any source. Aid that is non-need-based but that was used to meet need should be counted as need-based aid. Numbers should reflect the cohort awarded the dollars reported in H1. Note: In the chart below, students may be counted in more than one row, and full-time freshmen should also be counted as full-time undergraduates.
Rutgers University - Newark - June 20, 2017 Page 24
Common Data Set 2016 - 2017RUTGERS UNIVERSITY - NEWARK
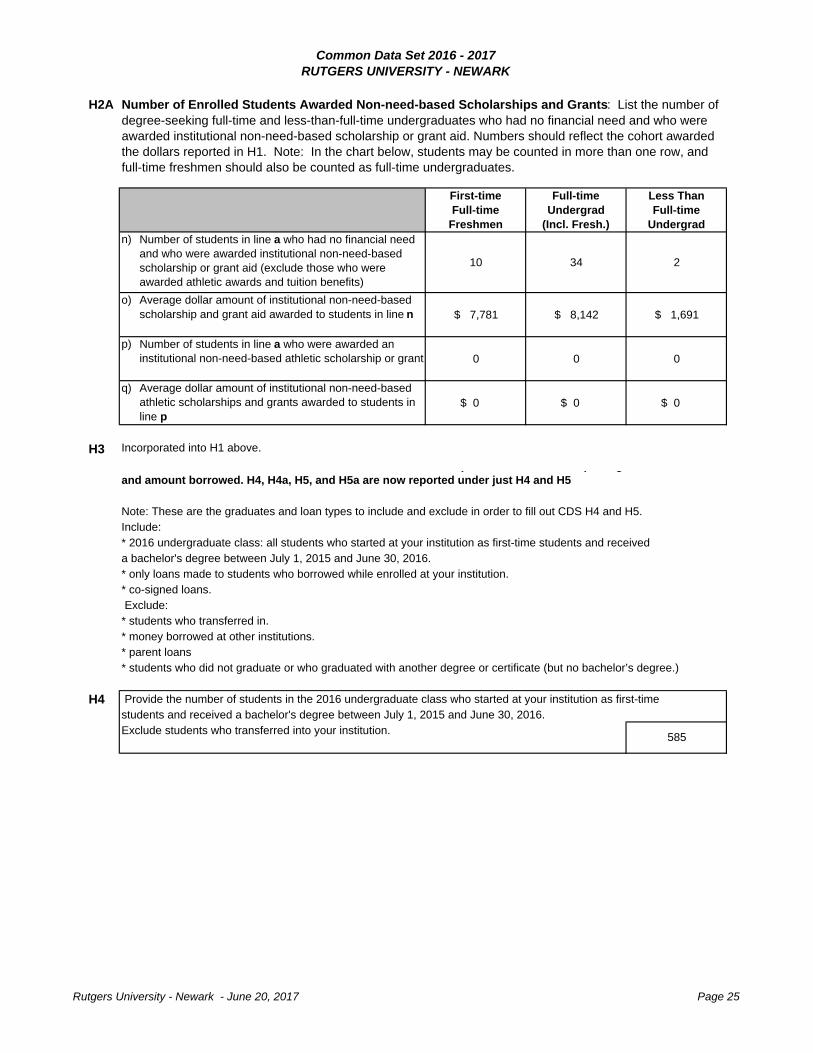
H2A
First-timeFull-time
Freshmen
Full-timeUndergrad
(Incl. Fresh.)
Less ThanFull-time
Undergradn) Number of students in line a who had no financial need
and who were awarded institutional non-need-based scholarship or grant aid (exclude those who were awarded athletic awards and tuition benefits)
10 34 2
o) Average dollar amount of institutional non-need-based scholarship and grant aid awarded to students in line n $ 7,781 $ 8,142 $ 1,691
p) Number of students in line a who were awarded an institutional non-need-based athletic scholarship or grant 0 0 0
q) Average dollar amount of institutional non-need-based athletic scholarships and grants awarded to students in line p
$ 0 $ 0 $ 0
H3 Incorporated into H1 above.
H4 Provide the number of students in the 2016 undergraduate class who started at your institution as first-time
Exclude students who transferred into your institution.
Number of Enrolled Students Awarded Non-need-based Scholarships and Grants: List the number of degree-seeking full-time and less-than-full-time undergraduates who had no financial need and who were awarded institutional non-need-based scholarship or grant aid. Numbers should reflect the cohort awarded the dollars reported in H1. Note: In the chart below, students may be counted in more than one row, and full-time freshmen should also be counted as full-time undergraduates.
* co-signed loans.
students and received a bachelor's degree between July 1, 2015 and June 30, 2016.
* students who did not graduate or who graduated with another degree or certificate (but no bachelor’s degree.)
* money borrowed at other institutions.
a bachelor's degree between July 1, 2015 and June 30, 2016.* only loans made to students who borrowed while enrolled at your institution.
* students who transferred in.
* parent loans
585
Note: These are the graduates and loan types to include and exclude in order to fill out CDS H4 and H5. Include:* 2016 undergraduate class: all students who started at your institution as first-time students and received
Exclude:
p p gand amount borrowed. H4, H4a, H5, and H5a are now reported under just H4 and H5
Rutgers University - Newark - June 20, 2017 Page 25
Common Data Set 2016 - 2017RUTGERS UNIVERSITY - NEWARK
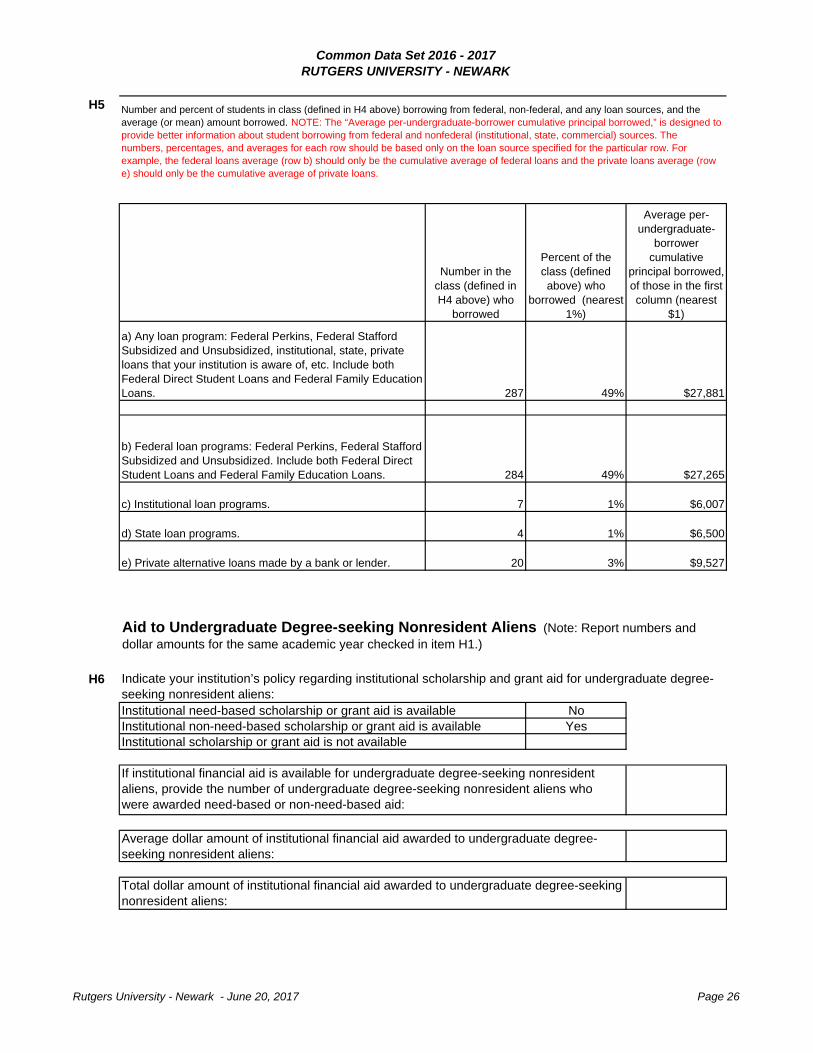
H5
287 49% $27,881
284 49% $27,265
7 1% $6,007
4 1% $6,500
20 3% $9,527
H6
NoYes
Number and percent of students in class (defined in H4 above) borrowing from federal, non-federal, and any loan sources, and the average (or mean) amount borrowed. NOTE: The “Average per-undergraduate-borrower cumulative principal borrowed,” is designed to provide better information about student borrowing from federal and nonfederal (institutional, state, commercial) sources. The numbers, percentages, and averages for each row should be based only on the loan source specified for the particular row. For example, the federal loans average (row b) should only be the cumulative average of federal loans and the private loans average (row e) should only be the cumulative average of private loans.
Institutional scholarship or grant aid is not available
Average dollar amount of institutional financial aid awarded to undergraduate degree-seeking nonresident aliens:
Institutional need-based scholarship or grant aid is availableInstitutional non-need-based scholarship or grant aid is available
Indicate your institution’s policy regarding institutional scholarship and grant aid for undergraduate degree-seeking nonresident aliens:
Aid to Undergraduate Degree-seeking Nonresident Aliens (Note: Report numbers and dollar amounts for the same academic year checked in item H1.)
If institutional financial aid is available for undergraduate degree-seeking nonresident aliens, provide the number of undergraduate degree-seeking nonresident aliens who were awarded need-based or non-need-based aid:
Total dollar amount of institutional financial aid awarded to undergraduate degree-seeking nonresident aliens:
e) Private alternative loans made by a bank or lender.
a) Any loan program: Federal Perkins, Federal Stafford Subsidized and Unsubsidized, institutional, state, private loans that your institution is aware of, etc. Include both Federal Direct Student Loans and Federal Family Education Loans.
b) Federal loan programs: Federal Perkins, Federal Stafford Subsidized and Unsubsidized. Include both Federal Direct Student Loans and Federal Family Education Loans.
c) Institutional loan programs.
d) State loan programs.
Average per-undergraduate-
borrower cumulative
principal borrowed, of those in the first column (nearest
$1)
Percent of the class (defined above) who
borrowed (nearest 1%)
Number in the class (defined in H4 above) who
borrowed
Rutgers University - Newark - June 20, 2017 Page 26

Common Data Set 2016 - 2017RUTGERS UNIVERSITY - NEWARK
H7X
N/AXX
Process for First-Year/Freshman Students
H8X
N/AN/AN/AN/AN/AN/A
H93/15N/A
X
H10a)
Yes Nob) Students notified on a rolling basis: X
If yes, starting date: 3/1
H11
X
Types of Aid AvailablePlease check off all types of aid available to undergraduates at your institution:
H12
XXX
XXXXX
Direct Unsubsidized Stafford LoansDirect PLUS Loans
College/university loans from institutional funds
Federal Perkins Loans
Students must reply by (date): or within ___4____ weeks of notification.
LoansFEDERAL DIRECT STUDENT LOAN PROGRAM (DIRECT LOAN)
Other (specify): Other Education loans
Direct Subsidized Stafford Loans
CSS/Financial Aid PROFILE
Check off all financial aid forms domestic first-year (freshman) financial aid applicants must submit:
Indicate reply dates:
Federal Nursing Loans
International Student’s Certification of FinancesOther (specify):
Students notified on or about (date):
Institution's own financial aid form
CSS/Financial Aid PROFILEInternational Student’s Financial Aid Application
FAFSA
Check off all financial aid forms nonresident alien first-year financial aid applicants must submit:Institution’s own financial aid form
No deadline for filing required forms (applications processed on a rolling basis):
Indicate notification dates for first-year (freshman) students (answer a or b):
State Loans
Indicate filing dates for first-year (freshman) students:Priority date for filing required financial aid forms:Deadline for filing required financial aid forms:
Business/Farm SupplementOther (specify):
State aid formNoncustodial PROFILE
Rutgers University - Newark - June 20, 2017 Page 27

Common Data Set 2016 - 2017RUTGERS UNIVERSITY - NEWARK
H13
XXX
N/AX
N/AXX
H14Non-Need Based Need-Based
X XX XX XX N/A
N/A N/AN/AX X
N/A N/AX X
N/A N/AX X
H15
Federal Nursing Scholarship
Scholarships and Grants
United Negro College Fund
Check off criteria used in awarding institutional aid. Check all that apply.
Federal PellSEOGState scholarships/grantsPrivate scholarshipsCollege/university scholarship or grant aid from institutional funds
Other (specify): Other Scholarships
NEED-BASED:
Minority status
AcademicsAlumni affiliationArt
Job skillsROTCLeadership
Athletics
If your institution has recently implemented any major financial aid policy, program, or initiative to make your institution more affordable to incoming students such as replacing loans with grants, or waiving costs for families below a certain income level please provide details below:
State/district residency
Music/dramaReligious affiliation
Rutgers University - Newark - June 20, 2017 Page 28
Common Data Set 2016 - 2017RUTGERS UNIVERSITY - NEWARK
I1
Full-time Part-timeExclude Include only if they
teach one or more non-clinical credit courses
Exclude Include if they teach one or more non-clinical credit courses
Exclude Include
Exclude Exclude
Include ExcludeExclude ExcludeExclude Include
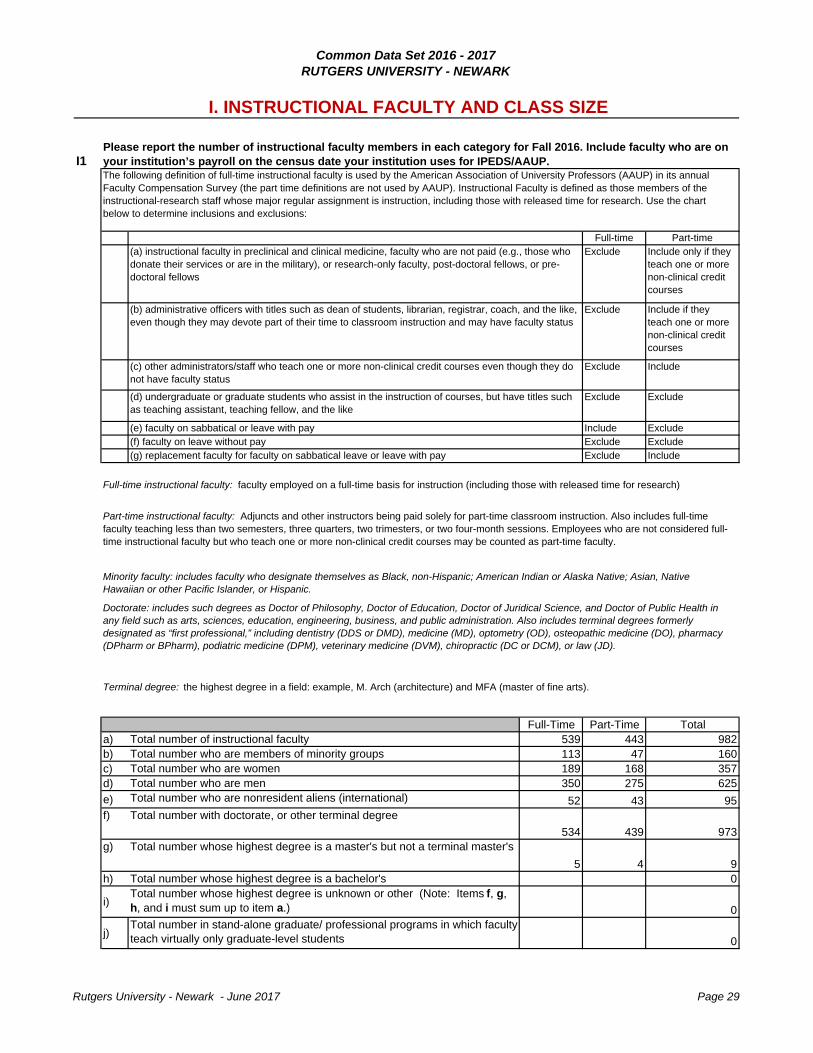
Full-Time Part-Time Totala) 539 443 982b) 113 47 160c) 189 168 357d) 350 275 625
e) 52 43 95f)
534 439 973g)
5 4 9h) 0
i)0
j)0
Total number who are nonresident aliens (international)
Total number who are members of minority groupsTotal number who are womenTotal number who are men
(b) administrative officers with titles such as dean of students, librarian, registrar, coach, and the like, even though they may devote part of their time to classroom instruction and may have faculty status
(c) other administrators/staff who teach one or more non-clinical credit courses even though they do not have faculty status
(d) undergraduate or graduate students who assist in the instruction of courses, but have titles such as teaching assistant, teaching fellow, and the like
(e) faculty on sabbatical or leave with pay(f) faculty on leave without pay (g) replacement faculty for faculty on sabbatical leave or leave with pay
Please report the number of instructional faculty members in each category for Fall 2016. Include faculty who are on your institution’s payroll on the census date your institution uses for IPEDS/AAUP.
Total number with doctorate, or other terminal degree
Total number whose highest degree is a master's but not a terminal master's
Total number whose highest degree is a bachelor'sTotal number whose highest degree is unknown or other (Note: Items f, g, h, and i must sum up to item a.)
Total number in stand-alone graduate/ professional programs in which faculty teach virtually only graduate-level students
I. INSTRUCTIONAL FACULTY AND CLASS SIZE
The following definition of full-time instructional faculty is used by the American Association of University Professors (AAUP) in its annual Faculty Compensation Survey (the part time definitions are not used by AAUP). Instructional Faculty is defined as those members of the instructional-research staff whose major regular assignment is instruction, including those with released time for research. Use the chart below to determine inclusions and exclusions:
Total number of instructional faculty
Full-time instructional faculty: faculty employed on a full-time basis for instruction (including those with released time for research)
Part-time instructional faculty: Adjuncts and other instructors being paid solely for part-time classroom instruction. Also includes full-time faculty teaching less than two semesters, three quarters, two trimesters, or two four-month sessions. Employees who are not considered full-time instructional faculty but who teach one or more non-clinical credit courses may be counted as part-time faculty.
Minority faculty: includes faculty who designate themselves as Black, non-Hispanic; American Indian or Alaska Native; Asian, Native Hawaiian or other Pacific Islander, or Hispanic.
Doctorate: includes such degrees as Doctor of Philosophy, Doctor of Education, Doctor of Juridical Science, and Doctor of Public Health in any field such as arts, sciences, education, engineering, business, and public administration. Also includes terminal degrees formerly designated as “first professional,” including dentistry (DDS or DMD), medicine (MD), optometry (OD), osteopathic medicine (DO), pharmacy (DPharm or BPharm), podiatric medicine (DPM), veterinary medicine (DVM), chiropractic (DC or DCM), or law (JD).
Terminal degree: the highest degree in a field: example, M. Arch (architecture) and MFA (master of fine arts).
(a) instructional faculty in preclinical and clinical medicine, faculty who are not paid (e.g., those who donate their services or are in the military), or research-only faculty, post-doctoral fellows, or pre-doctoral fellows
Rutgers University - Newark - June 2017 Page 29

Common Data Set 2016 - 2017RUTGERS UNIVERSITY - NEWARK
I2
11 to 1 (based on 7177 studentsand 678 faculty).
I3
2-9 10-19 20-29 30-39 40-49 50-99 100+ Total76 233 278 181 94 95 54 1011
2-9 10-19 20-29 30-39 40-49 50-99 100+ Total9 49 45 27 17 14 8 169
CLASS SUB-SECTIONS
Student to Faculty RatioReport the Fall 2016 ratio of full-time equivalent students (full-time plus 1/3 part time) to full-time equivalent instructional faculty (full time plus 1/3 part time). In the ratio calculations, exclude both faculty and students in stand-alone graduate or professional programs such as medicine, law, veterinary, dentistry, social work, business, or public health in which faculty teach virtually only graduate-level students. Do not count undergraduate or graduate student teaching assistants as faculty.
Fall 2016 Student to Faculty ratio
Undergraduate Class Size
Number of Class Sections with Undergraduates Enrolled
Undergraduate Class Size (provide numbers)
Class Sections: A class section is an organized course offered for credit, identified by discipline and number, meeting at a stated time or times in a classroom or similar setting, and not a subsection such as a laboratory or discussion session. Undergraduate class sections are defined as any sections in which at least one degree-seeking undergraduate student is enrolled for credit. Exclude distance learning classes and noncredit classes and individual instruction such as dissertation or thesis research, music instruction, or one-to-one readings. Exclude students in independent study, co-operative programs, internships, foreign language taped tutor sessions, practicums, and all students in one-on-one classes. Each class section should be counted only once and should not be duplicated because of course catalog cross-listings.
CLASS SECTIONS
Using the above definitions, please report for each of the following class-size intervals the number of class sections and class subsections offered in Fall 2016. For example, a lecture class with 800 students who met at another time in 40 separate labs with 20 students should be counted once in the “100+” column in the class section column and 40 times under the “20-29” column of the class subsections table.
Class Subsections: A class subsection includes any subsection of a course, such as laboratory, recitation, and discussion subsections that are supplementary in nature and are scheduled to meet separately from the lecture portion of the course. Undergraduate subsections are defined as any subsections of courses in which degree-seeking undergraduate students enrolled for credit. As above, exclude noncredit classes and individual instruction such as dissertation or thesis research, music instruction, or one-to-one readings. Each class subsection should be counted only once and should not be duplicated because of cross-listings.
In the table below, please use the following definitions to report information about the size of classes and class sections offered in the Fall 2016 term.
Rutgers University - Newark - June 2017 Page 30

Common Data Set 2016 - 2017RUTGERS UNIVERSITY - NEWARK
J1 Degrees conferred between July 1, 2015 and June 30, 2016
Category Bachelor’s CIP 2010 Categories to Include
Agriculture 1Natural resources and conservation 0.1 3Architecture 4Area, ethnic, and gender studies 0.4 5Communication/journalism 1.1 9Communication technologies 10Computer and information sciences 1.7 11Personal and culinary services 12Education 13Engineering 14Engineering technologies 15Foreign languages, literatures, and linguistics 0.6 16Family and consumer sciences 19Law/legal studies 22English 1.7 23Liberal arts/general studies 24Library science 25Biological/life sciences 7.2 26Mathematics and statistics 0.7 27Military science and military technologies 28 & 29Interdisciplinary studies 0.1 30Parks and recreation 31Philosophy and religious studies 0.4 38Theology and religious vocations 39Physical sciences 1.8 40Science technologies 41Psychology 12.8 42Homeland Security, law enforcement, firefighting, and protective services 12.2
43
Public administration and social services 8.7 44Social sciences 6.8 45Construction trades 46Mechanic and repair technologies 47Precision production 48Transportation and materials moving 49Visual and performing arts 2.1 50Health professions and related programs 1.4 51Business/marketing 38.4 52History 1.8 54OtherTOTAL (should = 100%) 100
For each of the following discipline areas, provide the percentage of diplomas/certificates, associate, and bachelor’s degrees awarded. To determine the percentage, use majors, not headcount (e.g., students with one degree but a double major will be represented twice). Calculate the percentage from your institution’s IPEDS Completions by using the sum of 1st and 2nd majors for each CIP code as the numerator and the sum of the Grand Total by 1st Majors and the Grand Total by 2nd major as the denominator. If you prefer, you can compute the percentages using 1st majors only.
J. DEGREES CONFERRED
Rutgers University - Newark - June 2017 Page 31