a gas-phase approach to the study of reaction mechanisms
TRANSCRIPT

A gas-phase approach to the study of reaction
mechanisms of biological and industrial
sustainable processes
Doctoral dissertation
Academic year 2016/2017
FACULTY OF MEDICINE AND PHARMACY
Department of Chemistry and Drug Technologies
PhD School of Pharmaceutical Sciences
XXX cycle
Candidate:
Chiara Salvitti
Supervisor:
Prof. Federico Pepi
PhD School Coordinator:
Prof. Antonello Mai

1

i
Table of contents
1. Introduction ...................................................................................................... 1
2. Monosaccharide decomposition reactions ....................................................... 8
2.1 Hexose acid-catalysed dehydration ............................................................ 15
2.2 D-fructose base-assisted dehydration .......................................................... 29
2.3 Pentose acid-catalysed dehydration ............................................................. 37
2.4 Discussion ................................................................................................... 53
3. L-Ascorbic acid decomposition reaction ....................................................... 62
3.1 Protonated L-Ascorbic acid structure and ion energetics ............................ 66
3.2 Protonated L-Ascorbic acid decomposition ................................................ 77
3.3 Discussion ................................................................................................... 84
4. Glycosylation reaction ................................................................................... 87
4.1 Structural characterization of the oxocarbenium ion intermediate.............. 99
5. Ion-molecule reactions ................................................................................. 108
5.1 Iron promoted C-C bond formation ........................................................... 112
5.2 SO2 promoted V-O activation ................................................................... 120
5.3 Discussion ................................................................................................. 128
6. Conclusions .................................................................................................. 133
7. Experimental methods ................................................................................. 136
7.1 Electrospray versus chemical ionization ................................................... 136
7.2 Collisionally activated dissociation ........................................................... 139
7.2.1 Energy resolved mass spectrometry ................................................... 140
7.2.2 Tandem MSn
mass spectrometry ......................................................... 143
7.3 Ion-trap kinetic experiments ...................................................................... 145
7.4 Neutralization-reionization mass spectrometry ......................................... 149

ii
7.5 Ion-mobility mass spectrometry ................................................................ 152
7.6 Superfluid helium nano-droplet infrared spectroscopy ............................. 155
7.7 Experimental details .................................................................................. 162
8. Bibliography ................................................................................................ 168

1
1. Introduction
Chemistry deals with fundamental matter transformations that continuously occur
throughout the Universe and deeply influence the human life. All chemical
reactions are characterized by a sequence of elementary processes where the
product of one reaction is the reactant of the next one, to eventually obtain a
thermodynamically stable compound. In the usual synthetic laboratory
procedures, the knowledge of the reaction mechanism is crucial to effectively
control the reaction outcome, optimize the product yields and reduce the
formation of side compounds. This goal can be achieved identifying the
intermediates and transition states of the reactions, which can be however a very
difficult task.
First of all, most reactions are a series of multistep and multicomponent
processes that involve a large number of intermediates. Indeed, many different
reactions are frequently used in combination to obtain a designed product and, in
some cases, negative synthesis outcomes can be ascribed to the lack for
mechanistic information. On the other hand, reaction intermediates are usually
high energy and highly-reactive species present at very low concentration in
solution and characterized by very short lifetimes. Therefore, only under
exceptional circumstances these elusive compounds can be isolated from the
reaction mixture and structurally identified. In most cases, the reaction
mechanisms and intermediates can only be hypothesized by theoretical
conjectures and thermochemical arguments.
According to these considerations, the main focus of the present thesis is the
study at the molecular level of important sustainable processes that can contribute
to the development of a “green” industry. In particular, the greatest challenge in
realizing a sustainable future is the control of the energy consumption and the
search for alternative sources of fuels and bulk chemicals.
Energy is essential for all the economic activities aimed at sustaining the
quality of life. During the last years, world energetic needs have increased by
about 60% and are expected to further grow by 50-60% by 2030.[1]
This trend is

2
driven by the population growth and the pursuit of improving living standards as
well as by a global infrastructure that has expanded to a massive scale.
Nowadays, non-renewable fossil fuels still represent the main global source of
energy, and continue to be responsible for pollution and climate change.
Considering only the Italian area, it has been estimated that the number of cars
amounts to around 37 millions, that means one vehicle for less than two people.[2]
Because of these environmental problems and the progressive depletion of the
petroleum supply, the transition from carbon resources to renewable bio-resources
has become increasingly urgent. Natural gas such as methane has played a
significant role in supporting the energy request, especially after the energy crisis
of the 1970s that followed the oil embargo of 1973 proclaimed by the
Organization of the Petroleum Exporting Countries (OPEC). In this regard, all the
reactions that lead to the activation of C-H, C-C and C-X (X=F, Cl, Br, I) bonds
have a great potential in this matter and have been the subject of many studies.
Moreover, the selective conversion of hydrocarbon compounds into more user-
friendly products are among the most exploited reactions in industrial field.
An alternative solution to the diminishing availability of crude oil is
represented by the use of lignocellulosic biomass as a source of energy.
Lignocellulosic biomass represents the main carbon source existing on Earth and
it is available for a direct use as fuel or fuel precursor.[3,4]
Consequently, over the
years, the processes allowing the utilization of carbohydrates from lignocellulosic
biomass have received great attention, and some goals have already been reached
for biomass utilization. For instance, the use of ethanol from sugarcan has greatly
reduced the need for imported oil in Brazil.[5]
Further to this, another important application field of the lignocellulosic
biomass is the chemical industry, where biomass represents a feedstock for
organic compounds and platform molecules. For example, ferrulic acid, a
precursor of numerous aromatic chemicals, is extracted directly from corn
fibres.[6]
Platform chemicals, such as 5-hydroxymethylfuraldehyde (5-HMF) and
2-furaldehyde (2-FA), or simpler molecules such as levulinic acid (LA) and
glyceraldehyde, are the products of the thermal acid-catalysed dehydration of
hexoses and pentoses.[3,4;7-9]
These compounds are important sustainable

3
intermediates in the preparation of a large variety of chemicals, pharmaceuticals
and furan-based polymers.[10]
In particular, the furan derivatives 5-HMF and 2-FA
are included in the “Top 10+4” list of the bio-based chemicals.[11,12]
Interestingly,
50 years ago the world production of 2-FA already ran to the order of 50.000 t per
year, ranking it 67th
in annual volume among major organic chemicals.[13]
Despite
the number of theoretical studies focused on the elucidation of the
monosaccharide dehydration mechanisms, the kinetics and thermodynamics of the
sugar conversion are still unknown. As anticipated, this is due to the intermediacy
of species with a short lifetime that makes difficult to derive a complete and
consistent mechanistic picture.
The experimental study of short-lived species in the condensed phase takes
advantage of spectroscopic techniques such as nuclear magnetic resonance
(NMR), ultraviolet-visible (UV) and infrared (IR) absorption spectroscopies.
Despite the efforts made in recent years to improve the high-speed capability of
these methods,[14,15]
their use is really advantageous only for the analysis of
compounds having light-sensitive chemical groups (chromophores, fluorophores,
ect.). Furthermore, these techniques are all characterized by scarce selectivity and
sensitivity, which prevents the direct identification of intermediates in the reaction
mixture without resorting to time-consuming isolation procedures. The absence of
selectivity causes the problem of band overlapping especially when substrates,
intermediates and products have similar structures. Hence, they cannot be
distinguished and monitored simultaneously. Besides, low sensitive methods
require a large amount of pure samples. In this regard, the high thermochemical
instability of reaction intermediates does not allow one to meet these mass and
purity requirements. Considering the ionic or radical nature of most transient
species, a promising approach is reproducing the reactions in the gas phase by
means of mass spectrometric techniques.
Gas-phase studies have long been devoted to the behaviour of ions and
molecules in the isolated state, providing kinetic, mechanistic and thermochemical
information. In particular, they have largely contributed to understand the
atmospheric composition of planets, satellites and interstellar medium, through
the identification of unknown transient species only observed under particular

4
conditions of temperature and pressure. Such an approach has also been applied to
the study of the reaction pathways occurring in the Earth’s atmosphere and
responsible for the pollution growth and pollutant formation.
The study of planetary and terrestrial atmospheres is not the only field of
application of gas-phase studies, because they are also largely used to support and
interpret evidence obtained from solution studies, building a bridge between the
gas and condensed phases. The most relevant aspect is the opportunity to study
intrinsic characteristics of charged species, such as structure and reactivity, in the
absence of solvent molecules and counter-ions. The possibility to exclude any
solvent contribution represents a significant achievement, since the reaction
medium is known to affect the substrate reactivity. This advantage also gives the
unique opportunity to compare experimental to theoretical data concerning
structure, reactivity and thermochemistry.
Furthermore, additional efforts made in the gas-phase ion chemistry field have
enabled the study of ionic reactions not only in the isolated state, but also within a
well-designed micro-solvated environment where charged species are coordinated
to a controlled number of solvent molecules (H2O, CH3OH etc.). This approach is
legitimized by the evidence that, in some cases, the reaction occurrence strictly
depends on the presence of the solvent, even if this is represented by a single
molecule or a few molecules. For instance, NO+ ion behaves in the gas phase as a
nitrating agent only in the presence of a single molecule of H2O or CH3OH,
whereas in the absence of solvent molecules it undergoes charge and oxygen atom
transfer to arenes.[16]
Finally, the gas phase represents the ideal medium where the
effects of the ionic charge on the reaction can be studied.
Mass spectrometry is the instrumental technique most often employed to
perform gas-phase studies. As shown in Figure 1, a mass spectrometer can be
viewed as a miniaturised laboratory where ionic species are reacted with neutrals
and analysed.
Compared to other analytical techniques, mass spectrometry boasts high-
sensitivity, selectivity and speed, being a more advisable alternative to NMR and
spectroscopy.

5
Figure 1: The main components of a mass spectrometer.
As regards the study of reaction mechanisms, these technical features are
essential to isolate and characterize short-lived intermediates, increasing the
throughput and reducing the analysis time. An example of these potentialities is
represented by the experimental detection of the HO3 radical, long suggested as a
possible sink for O2 and OH[17]
and more recently identified as a key intermediate
in the antibody-catalysed water-oxidation reaction.[18]
In fact, the HO3· formed
along this pathway shows an oxidant power that increases the efficiency of
bacterial killing. Owing to the short lifetime of this species, its existence has never
been experimentally proved until 1999 when the molecule was finally detected by
means of mass spectrometry in experiments based on neutralization-reionization
and neutralization-reionization/collisionally activated dissociation, starting from
protonated ozone (HO3+) as the charged precursor.
[19]
The great potential of mass spectrometry has been ultimately accepted with the
advent of soft ionization methods, first and foremost the Electrospray Ionization
(ESI) technique.[20]
The gentle and efficient manner by which an ESI source can
transfer intact ions from the solution directly to the gas phase has opened the way
to the study of biological macromolecules (proteins, carbohydrates, lipids and
nucleic acids)[21]
expanding mass spectrometry in the biochemical and medical
field. An additional application of ESI-mass spectrometry (ESI-MS) is indeed the
elucidation of reaction mechanisms occurring in solution. In this respect,
Eberlin[22]
and Santos[23]
were among the first to employ ESI-MS in the analysis
of the charged compounds at the gas phase/liquid phase interface. The so called

6
“fishing” technique takes advantage of the ESI capability to rapidly and
efficiently fish ionic reactants, intermediates and products directly from the
solution medium to the gas-phase environment of the mass spectrometer.[22]
This
unique feature allows one to control the reactions following the progress of
solution processes as a function of time. Mass and structural variation occurring
along the reaction coordinates can be monitored by sampling at regular intervals
small portion of the reaction mixture (Figure 2). The ultra-high sensitivity and
speed of ESI-MS are essential to detect and characterize even transient
intermediates. This approach has been successfully used to study a number of
unknown reaction mechanisms (organic, inorganic and organometallic).[23-29]
Several protocols have been recently developed, aimed at the progressive
diffusion of this method in the laboratory practice.[30]
Figure 2: Continuous reaction monitoring by ESI-MS.
Due to the undeniable benefits of the gas-phase approach, this was exploited in
the present work to highlight the reaction mechanisms of the carbohydrate
conversion to platform chemicals. Mass spectrometric techniques were employed
to structurally characterize the ionic intermediates and products of the dehydration
reactions involving D-hexose (glucose and fructose) and D-pentose (xylose,
arabinose and ribose) sugars arising from lignocellulosic biomass decomposition.
The knowledge of the sugar degradation pathways on a molecular level is indeed
a pivotal step for the development of a sustainable industry, allowing the design of

7
new reagents and catalysts that can increase the selectivity towards the formation
of 5-HMF and 2-FA.
The same experimental method was then utilized to study the mechanism of the
reactions involving other sugar substrates and molecules structurally correlated to
carbohydrates. In particular, the decomposition reaction of L-Ascorbic acid
(Vitamin C) has been investigated in order to identify the mechanisms leading to
the formation of furan derivatives in foods. These compounds are supposed to be
carcinogenic to humans,[31]
thus the knowledge of the reaction details could help
keeping the level of these products under the critical threshold, ensuring the
safeguard of the public health. In addition, the carbocationic intermediate formed
along the glycosylation pathway has been structurally characterized. This species
has never been isolated before and its conformational details may confirm a
reaction mechanism only theoretically predicted.
Finally, a part of the work has been devoted to a fundamental issue, the
activation of intrinsically inert bonds.[32]
In the gas phase, many elementary
reactions of metal-containing ions have been studied as they are good models for
catalytic or biochemical processes occurring at the active sites. In this thesis, an
unprecedented reactivity has been observed with two metal-centered reactants: the
iron-containing cation (η5-C5H5)Fe
+ has been found to undergo an unusual iron-
atom transfer and C-C coupling reaction; the doubly-charged vanadium hydroxide
anions, H2V2O72-
and HNaV4O122-
, have been found to perform unprecedented
bond-forming reactions by activation of V-O bonds.

8
2. Monosaccharide decomposition reactions
Lignocellulosic biomass is generated through a carbon fixation process that
converts inorganic carbon (CO2) to organic compounds. The primary products
arising from this assimilation reaction are C6- and C5-sugars, D-glucose and D-
xylose respectively. Each monosaccharide is the starting reactant unit for
condensation reactions that lead to two polymers, cellulose (obtained by the
polymerization of D-glucose) and hemicellulose (obtained by the polymerization
of D-xylose). Finally, a highly cross-linked polymer composed by substituted
phenols, known as lignin, represents the third component of the wood biomass.
Cellulose, hemicellulose and lignin are important structural components of the
primary cell wall of the green plants, providing the cell with both protection and
tensile strength (Figure 3).
Figure 3: Main components of the lignocellulosic biomass.
Among all biomass constituents, carbohydrates are a promising feedstock since
they represent a natural source of carbon. In particular, the removal of water,
exemplified by the dehydration of D-glucose (from cellulose) and D- xylose (from
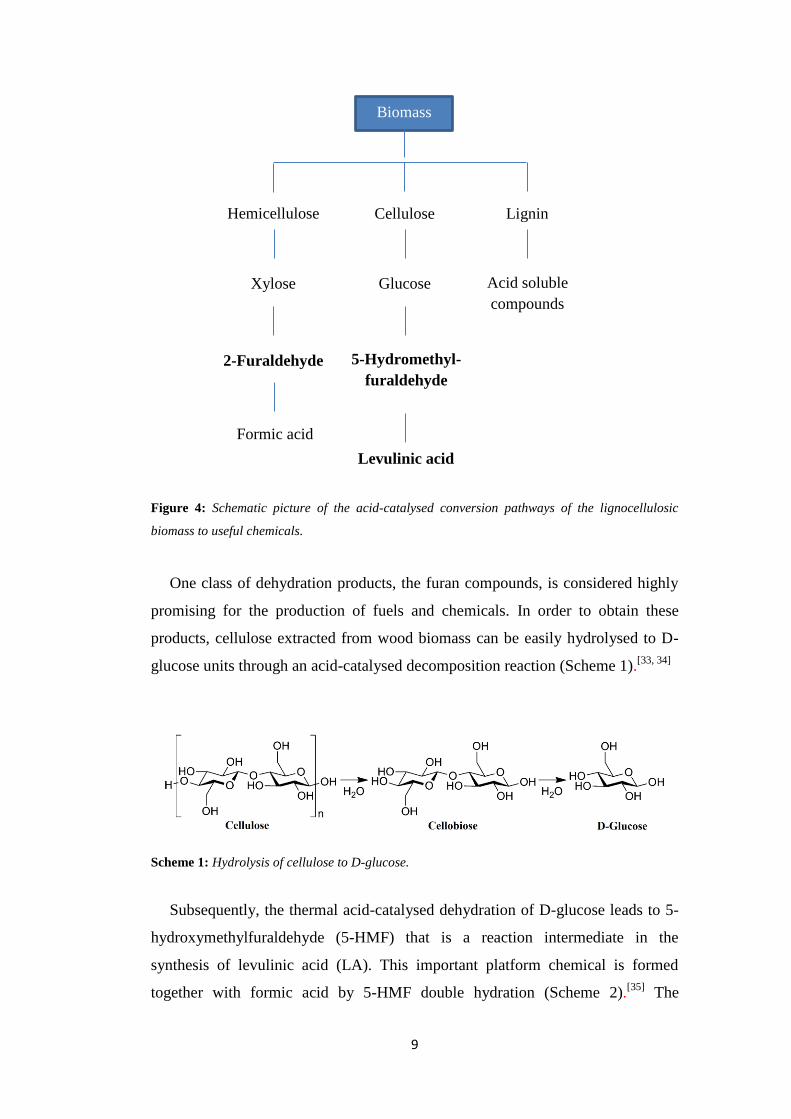
hemicellulose) leads to a wide variety of interesting compounds (Figure 4).
9
Figure 4: Schematic picture of the acid-catalysed conversion pathways of the lignocellulosic
biomass to useful chemicals.
One class of dehydration products, the furan compounds, is considered highly
promising for the production of fuels and chemicals. In order to obtain these
products, cellulose extracted from wood biomass can be easily hydrolysed to D-
glucose units through an acid-catalysed decomposition reaction (Scheme 1).[33, 34]
Scheme 1: Hydrolysis of cellulose to D-glucose.
Subsequently, the thermal acid-catalysed dehydration of D-glucose leads to 5-
hydroxymethylfuraldehyde (5-HMF) that is a reaction intermediate in the
synthesis of levulinic acid (LA). This important platform chemical is formed
together with formic acid by 5-HMF double hydration (Scheme 2).[35]
The
Biomass
Hemicellulose Cellulose Lignin
Xylose Glucose Acid soluble
compounds
2-Furaldehyde 5-Hydromethyl-
furaldehyde
Levulinic acid
Formic acid

10
apparent simplicity of Scheme 2 is complicated by the formation of side products,
in particular, insoluble polymeric materials named humins.
Scheme 2: Dehydration pathway of D-glucose leading to 5-HMF and levulinic acid.
Also another monosaccharide, D-fructose, is characterized by the dehydration
route reported for D-glucose. It has been demonstrated that in solution the 5-HMF
yield from the D-fructose dehydration is about 40 times higher than that obtained
from D-glucose (Table 1).[36]
A reasonable explanation for the scarce selectivity
found when using D-glucose as starting reactant could be the occurrence of
multiple reaction pathways, such as condensation, mutarotation, isomerization and
dehydration/degradation, that lead to the formation of many by-products.[37]
Table 1: D-glucose and D-fructose dehydration to 5-HMF in aqueous system. a) Heating by
microwave irradiation.
Sugar Conc.
(wt%)
Catalyst T
(C°)
time Yield
(%)
Conversion
(%)
Selectivity
(%)
Glucose[36]
2 H2SO4
50 wt%
200a 3-5
min
2 11 23
Fructose[36]
2 H2SO4
50 wt%
200a 3-5
min
47 97 48
Hence, the knowledge of the dehydration mechanism is essential to selectively
address the D-glucose conversion to 5-HMF and improve the final yields.
In the gas phase, a number of computational studies have provided detailed
information on the mechanism, kinetics and thermodynamics of sugar
conversion.[37-49]
Conversely, the lack for experimental data in solution is due to
the short lifetime of the intermediates, which prevents their isolation and

11
identification. For this reason the reaction pathways theoretically proposed have
never been confirmed by experimental evidence.
In particular, a debate exists concerning the mechanism of the D-glucose
conversion to 5-HMF. Two different routes have been suggested. The former,
named the “cyclic mechanism”, has been hypothesized by Antal (Scheme 3)[40,41]
and consists in the direct transformation of the D-glucose pyranosic ring to 5-
HMF furanosic ring, without the intermediacy of open-chain structures.
Scheme 3: The cyclic mechanism for the conversion of D-glucose to 5-HMF.
According to this mechanism after the first dehydration step a critical
intermediate, the Furanaldehyde (B), is formed. This species evolves into 5-HMF
through the subsequent release of two water molecules.
The latter alternative route (Scheme 4) has been proposed by Feather and
Harris[42]
and is known as the “fructose pathway”.
Scheme 4: The fructose pathway for the conversion of D-glucose to 5-HMF.

12
This mechanism involves the acyclic structure of glucose, which isomerizes to
fructose through a 1,2-enediol intermediate (Scheme 5) and undergoes cyclization
and subsequent dehydration leading to the formation of 5-HMF.
Scheme 5: glucose/fructose conversion mechanism.
In this regard, the glucose/fructose tautomerization could justify the higher
yields of 5-HMF obtained from fructose. Indeed, the acidic conditions required by
the glucose dehydration process hinder the glucose conversion into fructose, that
is instead promoted by an alkaline pH. The non-occurrence of the tautomerization
reaction may drive the glucose along other decomposition routes, increasing the
formation of side products.
By analogy with cellulose, the acid-catalysed hydrolysis of hemicellulose from
biomass produces the monosaccharide units of D-xylose (Scheme 6).[34]
Scheme 6: Hydrolysis of hemicellulose to D-xylose.
The subsequent thermal acid-catalysed dehydration of D-xylose and isomeric
pentose sugars (D-arabinose and D-ribose) leads to 2-furaldehyde (FA) (Scheme
7).[9,13]

13
Scheme 7: D-pentose sugars dehydration to 2-FA.
Like in the case of D-glucose, a debate exists in literature concerning the real
reaction route. Theoretical calculations also in this case have suggested two main
degradation pathways involving acyclic or cyclic forms of D-xylose. The acyclic
mechanism consists in an open-chain D-xylose tautomerization leading to 1,2-
enediol intermediate that subsequently undergoes three dehydration steps (Scheme
8).[13,50-52]
The alternative acid catalysed reaction sequence starts from the
pyranose form of D-xylose and, after protonation and loss of the first water
molecule, leads to a structure that rearranges to a furanose ring.
Scheme 8: The acyclic mechanism for the conversion of D-xylose to 2-FA.
The intermediate formed is prompt to release the remaining two water
molecules (Scheme 9, a and b).[37-39,41,53-55]
Antal et al.[41]
reported that the cyclic
mechanism is the most plausible. Theoretical calculations performed by Nimlos[38]

14
strongly supported the degradation pathway starting from D-xylose protonated at
C2-OH, whereas C1-OH protonation was excluded on the basis of the high
energetic barrier for the subsequent ring contraction to the furanose intermediate,
estimated to be 39.3 kcal mol-1
.
Scheme 9: The cyclic pathways for the conversion of D-xylose to 2-FA starting from C1-OH
protonation a) or C2-OH protonation b).
Owing to the strong impact of the lignocellulosic biomass utilization and the
absence of experimental evidence on this subject, the aim of this thesis has been
the investigation in the gas phase of the thermal dehydration mechanism that starts
from protonated D-hexoses (glucose and fructose) and D-pentoses (xylose,
arabinose and ribose) and leads to 5-HMF, levulinic acid and 2-FA.
In particular, the gas-phase approach has been utilized (i) to identify the ionic
precursors of the reactions, (ii) to structurally characterize the ionic intermediates
and products, (iii) to obtain mechanistic information on the monosaccharide
dehydration reactions with the aim of identifying preferential catalytic pathways.
In order to validate the mechanistic picture arising from the mass spectrometric
results, the collected data were compared with those obtained from quantum
mechanical calculations.

15
2.1 Hexose acid-catalysed dehydration
Figure 5 displays the ESI mass spectra of the D-fructose (panel a) and D-glucose
(panel b) H2O (0.1% HCOOH)/MeOH 1:1 solutions.
Figure 5: Comparison between the full scan mass spectra of 1x10⁻³
M solutions of D-glucose a)
and D-fructose b) both in H2O (0.1% HCOOH)/MeOH 1:1. In the inset the mass spectrum from
m/z 300 to 350 showing the reversion products.
As illustrated, the ionic population observed in the gas phase in both cases is
dominated by a characteristic peak at m/z 203, corresponding to the sodium

16
adduct (C6H12O6Na+). The metal ion Na
+ is a well-known solution contaminate,
unavoidably present in the gas phase. However, from the analysis of the adduct
fragmentation pattern it was found not to be the precursor of any dehydration
intermediate, thus justifying its high intensity and excluding the possible
interference in the present reaction mechanism study.
The ion at m/z 181, corresponding to the protonated sugar (C6H12O6H+), is
characterized by an extremely low intensity, especially if compared with that of
the sodium adduct. This feature could be due to its instability in the gas phase. It
is reasonable to assume that the energy deriving from its formation process
activates the dehydration reaction that leads to the product ions at m/z 163, 145
and 127. These ionic species in fact correspond to the consecutive losses of one,
two and three water molecules from protonated D-glucose and D-fructose
representing the ionic intermediates (m/z 163 and m/z 145) and product (m/z 127)
of the gas-phase D-hexose dehydration process.
In the high mass range of the spectrum, the ions at m/z 343 and 325
correspond to sugar reversion products. These species are formed by the
combination of a neutral D-glucose or D-fructose molecule and the corresponding
monohydrate intermediate (ion at m/z 343), which in turn can dehydrate giving
rise to the ion at m/z 325. The formation of these side products can prevent the
efficient industrial conversion of the two hexoses to useful chemicals and their
presence in the acidic reaction mixture was previously highlighted.[56]
The mass attribution of all the ionic species described was confirmed by exact
mass experiments performed with the ESI/Q-TOF mass spectrometer.
CAD experiments
In order to obtain more information on the hexose dehydration mechanisms, the
starting reactant ions, the intermediates and the final product were isolated and
analysed by CAD. Figure 6 shows the CAD mass spectrum of protonated D-
glucose at m/z 181. The main fragmentation products arising from the parent ion
dissociation effectively represent the dehydration intermediates (m/z 163 and m/z

17
145) and the final product (m/z 127) of the D-glucose acid catalysed
decomposition.
Figure 6: CAD mass spectrum of protonated D-glucose at m/z 181 recorded at 10 eV collision
energy.
Also the ionic intermediates at m/z 163 and 145 were investigated by CAD
experiments.
Figure 7: CAD mass spectra of the ionic intermediates at m/z 163 a) and m/z 145 b) arising from
D-glucose, recorded at a collision energy of 5 and 6 eV.
As reported in Figure 7, these ionic species fragment by releasing two and one
water molecules respectively giving rise to the final product ions at m/z 127.
Furthermore, all displayed CAD mass spectra show an intense ionic signal at m/z

18
85, an ionic fragment deriving from a cross ring bond cleavage characteristic of
cyclic carbohydrates.[57]
Other important information can be obtained by the fragment ion at m/z 117
observed in the product ion mass spectrum of the intermediate at m/z 163. This
ion formally corresponds to the protonated levulinic acid, one of the final products
of the D-glucose dehydration reaction. To probe this attribution, the CAD mass
spectrum of the ion at m/z 117 obtained from protonated D-glucose was compared
to that of a commercial levulinc acid sample (Figure 8). As a result, the
fragmentation patterns of the two protonated parent ions are almost
superimposable and hence the formation of this product in the gas phase was also
demonstrated.
Figure 8: Comparison between the CAD mass spectra of the m/z 117 ion obtained from the m/z
163 D-glucose dehydration intermediate (red bars) and the protonated standard levulinic acid
(blue bars).
In order to analyse the differences existing between the two hexose
dehydration pathways, Table 2 and 3 report the relative intensities of the
fragments arising from protonated D-fructose and D-glucose dehydration
intermediate ions at m/z 163 and 145, respectively. CAD mass spectra were
recorded at a laboratory collision energy of 15 eV using the same ESI mass
spectrometric conditions.
Fragmentation patterns of D-fructose and D-glucose ionic intermediates at m/z
163 are similar, but not completely superimposable. The main differences concern

19
the relative abundances of the fragment at m/z 145 obtained from the dehydration
channel and other minor fragments such as the ion at m/z 103, 101 and 69.
Table 2: CAD mass spectra of the ion at m/z 163 derived from protonated D-fructose and D-
glucose. Each reported value was obtained as average of three different analyses with standard
deviations of the fragment ion intensities around ±10%.
Parent ion (m/z)
163
D-fructose
(relative intensity)
D-glucose
(relative intensity)
145 22.9 32.0
127 25.3 20.6
117 0.5 2.3
115 4.8 6.8
109 1.4 1.1
103 1.5 4.5
101 6.0 2.5
99 3.2 3.4
97 3.2 3.2
91 0.9 2.1
85 18.9 16.8
73 3.0 3.1
71 1.0 _
69 3.0 1.6
61 1.4 _
57 1.9 _
55 1.1 _
Also the CAD mass spectra of the doubly dehydrated intermediates at m/z 145
highlight slight differences between the two monosaccharides.
Fragmentation channels leading to the ions at m/z 115, 109 and 73 are
observed only for D-fructose, whereas a different intensity of the main products at
m/z 127 emerges from the reported data.

20
Table 3: CAD mass spectra of the ion at m/z 145 derived from protonated D-fructose and D-
glucose. Each reported value was obtained as average of three different analyses with standard
deviations of the fragment ion intensities around ±10%.
Parent ion (m/z)
145
D-fructose
(relative intensity)
D-glucose
(relative intensity)
127 32.5 44.8
115 2.5 _
109 1.4 _
99 4.6 6.0
97 3.5 3.2
85 49.8 41.8
73 1.9 _
69 3.8 4.2
In order to verify the identity of the ion at m/z 127 arising from the dehydration
of protonated D-fructose and D-glucose its CAD mass spectrum was compared
with that of commercial 5-HMF using the same experimental conditions.
Figure 9: CAD mass spectra of the ions at m/z 127 obtained from the protonation of D-fructose
(red bars), D-glucose (blue bars) and standard 5-HMF (green bars) and recorded at collision
energy of 15 eV.

21
Figure 9 shows the comparison between the fragmentation patterns of the ions
at m/z 127 obtained from protonation of commercial 5-HMF and the ions at m/z
127 arising from the dehydration of protonated D-fructose and D-glucose,
respectively.
The main fragmentation channel of protonated 5-HMF (blue bars) is
represented by the ion at m/z 109 corresponding to the loss of a water molecule.
Conversely, the CAD mass spectrum of the ion at m/z 127 generated from
protonated D-glucose shows other significant fragment ions, as those arising from
the loss of CO (ion at m/z 99) and H2CO (ion at m/z 97). These species are absent
in the CAD mass spectrum of standard 5-HMF. In the case of the m/z 127 ions
obtained from protonated D-fructose the fragmentation pattern is dominated by
the ion at m/z 69 and shows minor fragments at m/z 97 and m/z 99. The intense
fragmentation leading to the ion at m/z 69 is peculiar of D-fructose m/z 127
product ion, whereas the relative intensities of the fragment ions at m/z 99 and 97
seem to be comparable to the corresponding fragmentation observed for D-
glucose.
These relevant differences demonstrate that in the gas phase protonated 5-
HMF does not represent the unique ionic product at m/z 127 obtainable from D-
glucose and D-fructose dehydration. It can be hypothesized that different isomers
or protomers of 5-HMF are formed.
To probe the possible formation of different 5-HMF protomers, the CAD
fragmentation pattern of the ions at m/z 127 obtained from protonation of
commercial 5-HMF under chemical ionization (CI) conditions has been analysed.
For this purpose, different protonating agents were selected to gradually increase
the exothermicity of the protonation process (Figure 10).
Under the soft protonating conditions of the H3O+ ions obtained from H2O/CI
(Figure 10 blue bars), the CAD mass spectrum of protonated 5-HMF is
comparable with the spectrum recorded under ESI conditions. Gradually
increasing the proton transfer exothermicity by using CH5+ ions from CH4/CI
(Figure 10 yellow bars) and H3+ from H2/CI (Figure 10 light blue bars) a new
fragment ion at m/z 97 is observed. Interestingly, the daughter ions at m/z 99 and
m/z 69, observed for the species at m/z 127 obtained under ESI conditions from

22
the hexose dehydration, are always absent in the CAD spectra of the
corresponding species generated under CI conditions from commercial 5-HMF.
Figure 10: CAD mass spectra of protonated 5-HMF generated from different chemical ionization
gases (H2O; CH4; H2O).
Energy-resolved CAD experiments
Triple quadrupole energy-resolved CAD spectra of D-glucose and D-fructose
dehydration intermediates allow the relative water loss dissociation energies to be
measured.
The measurement of the threshold energy associated to the first water loss was
prevented by the low intensity of the protonated ions at m/z 181.
Figure 11 displays the energy-resolved CAD mass spectra of the ions at m/z
163 deriving from protonated D-fructose (panel a) and D-glucose (panel b)
recorded at collision energies ranging from 0 to 5 eV (centre-of-mass collision
energy).
Focusing on the onset of the cross section curves, the loss of the second water
molecule leading to the ion at m/z 145 arises at collision energies close to the
nominal centre of mass energy of 0 eV. The dehydration of D-fructose is slightly
favoured respect to D-glucose as evidenced by the higher collision cross section
measured.

23
.
Figure 11: Energy-resolved CAD mass spectra of the ions at m/z 163 obtained from protonated D-
fructose a) and protonated D-glucose b). The reported collision cross sections concern only the
dehydration reaction leading to the ion at m/z 145.
The energetics of the third water loss from protonated D-fructose and D-
glucose was also investigated by the energy-resolved CAD mass spectra of the
ions at m/z 145 leading to the product ions at m/z 127 (Figure 12). The third water
loss from D-fructose (panel a) and D-glucose (panel b) is also characterized by a
threshold energy around 0 eV with the dehydration of D-fructose slightly

24
favoured respect to that of D-glucose as again evidenced by the higher collision
cross section measured.
Figure 12: Energy-resolved CAD mass spectra of the ions at m/z 145 obtained from protonated D-
fructose a) and protonated D-glucose b). The reported collision cross sections concern only the
dehydration reaction leading to the ion at m/z 127.

25
H/D exchange experiments
Isotopic labelling experiments allow one to obtain additional evidence on the gas
phase D-glucose and D-fructose dehydration mechanism.
When the two sugars are dissolved in D2O at room temperature, the
replacement of all the hydrogen atoms of the OH groups with deuterium occurs in
several minutes, obtaining the d5-hexose. (Scheme 10, panels a and b). The
deuteronated ESI parent ion shifts from m/z 181 to m/z 187
Scheme 10: D-glucose a) and D-fructose b) H/D exchange reactions.
This procedure permits to distinguish if the water loss involves the acidic
hydrogen atoms bound to the oxygen atoms or the non-acidic hydrogen atoms
bound to the carbon-ring.
The product ion mass spectrum of the ion at m/z 187 reports the loss of a D2O
molecule as the main fragmentation channel (Figure 13; panel a) and the same
result emerges from the CAD mass spectrum of the ion at m/z 167 where the D2O
loss leads to the fragment ion at m/z 147 (Figure 13; panel b).
On the contrary, the third dehydration step from the ionic intermediate at m/z
147 involves simultaneously the loss of a D2O and a HDO neutral counterparts
a)
b)
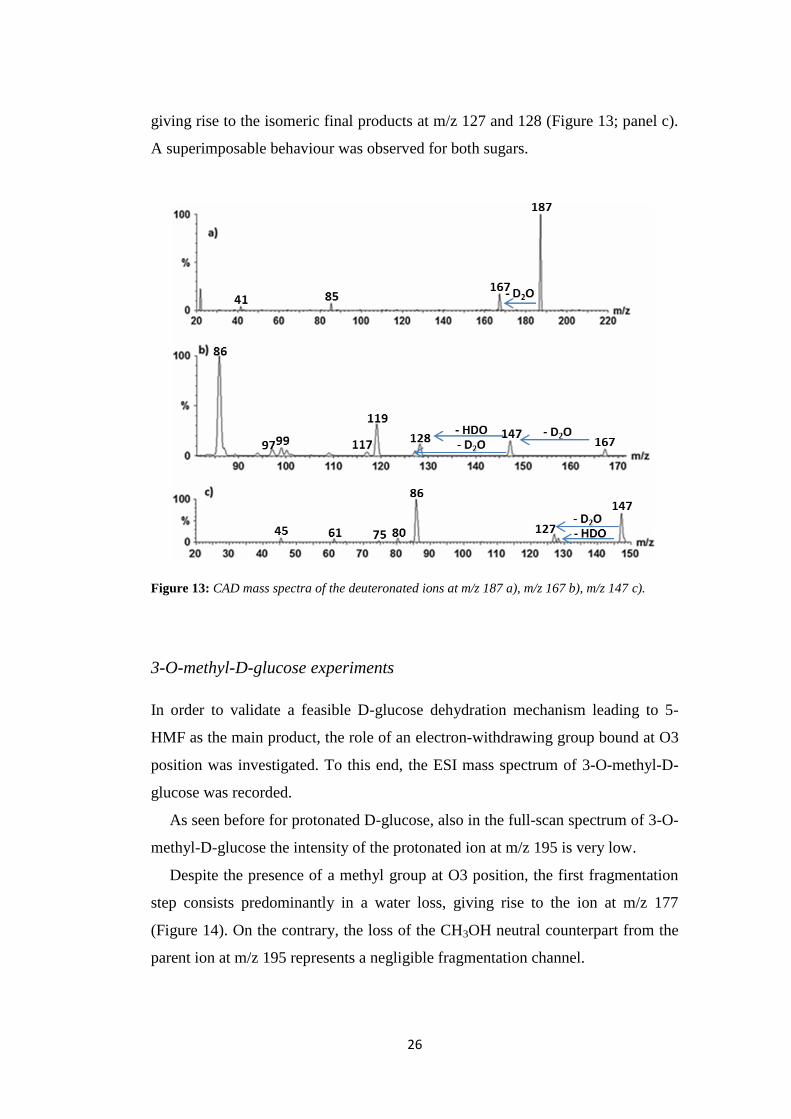
26
giving rise to the isomeric final products at m/z 127 and 128 (Figure 13; panel c).
A superimposable behaviour was observed for both sugars.
Figure 13: CAD mass spectra of the deuteronated ions at m/z 187 a), m/z 167 b), m/z 147 c).
3-O-methyl-D-glucose experiments
In order to validate a feasible D-glucose dehydration mechanism leading to 5-
HMF as the main product, the role of an electron-withdrawing group bound at O3
position was investigated. To this end, the ESI mass spectrum of 3-O-methyl-D-
glucose was recorded.
As seen before for protonated D-glucose, also in the full-scan spectrum of 3-O-
methyl-D-glucose the intensity of the protonated ion at m/z 195 is very low.
Despite the presence of a methyl group at O3 position, the first fragmentation
step consists predominantly in a water loss, giving rise to the ion at m/z 177
(Figure 14). On the contrary, the loss of the CH3OH neutral counterpart from the
parent ion at m/z 195 represents a negligible fragmentation channel.

27
Figure 14: Product ion mass spectrum of the ion at m/z 195, corresponding to protonated 3-O-
methyl-D-glucose.
The main fragmentation pathway of the ion at m/z 177 leads to the ionic
intermediate at m/z 145 resulting from the loss of methanol, while the ionic
species at m/z 159, resulting from the water loss, represents a secondary fragment.
Finally, as observed for D-glucose, the loss of the last water molecule gives rise to
the ion at m/z 127, also in this case the final product of the dehydration reaction.
The CAD mass spectrum of the ion at m/z 127 was compared to the mass
spectra of protonated standard 5-HMF and the ion at m/z 127 arising from the
protonated D-glucose dehydration (Figure 15).
As reported in Figure 15, the CAD mass spectrum of the m/z 127 dehydration
final product derived from protonated 3-O-methyl-D-glucose (green bars) is more
similar to the standard 5-HMF fragmentation pattern (blue bars) than the CAD
mass spectrum of the same ion derived from protonated D-glucose (red bars).
As in the case of D-glucose, H/D solution exchange experiments have been
performed for 3-O-methyl-D-glucose and the recorded CAD mass spectra show
the loss of D2O, CH3OD and finally HDO/D2O as main fragmentation channels.

28
Figure 15: Comparison between the CAD mass spectra of the ion at m/z 127 derived from
protonated 3-O-methyl-glucose (green bars), standard 5-HMF (blue bars) and D-glucose (red
bars).

29
2.2 D-fructose base-assisted dehydration
Figure 16 shows the ESI mass spectrum of a D-fructose solution prepared by
replacing formic acid with NH4Cl.
Figure 16: ESI mass scan of a 1x10⁻³
M solution of D-fructose in H2O (0.1% NH4Cl)/MeOH 1:1
(V/V).
The ionic population observed under these conditions drastically differs from
that observed by using formic acid as a protonating agent. The spectrum is
dominated by a peak at m/z 198, corresponding to the ammonium D-fructose
adduct (C6H12O6NH4+), and its dehydrated counterpart at m/z 180. The high NH4
+
affinity of D-fructose causes a decrease of the intensity of contaminant metal
adduct (C6H12O6Na+) reported above for 0.1% HCOOH solutions (Section 2.1,
Figure 5, panel a).
Interestingly, ions corresponding to the intermediates (m/z 163 and 145) and
product (m/z 127) of the D-fructose dehydration are still present, which points to
the possible involvement of the base NH3 in the activation of the dehydration
process. This hypothesis is reinforced by the absence of protonated D-fructose at
m/z 181. Indeed, it is reasonable to assume that the low-intensity peak at m/z 181
present in the spectrum corresponds to the 13
C-isotope of the ionic species at m/z
180, as confirmed by analysing the 180/181 ratio.
30
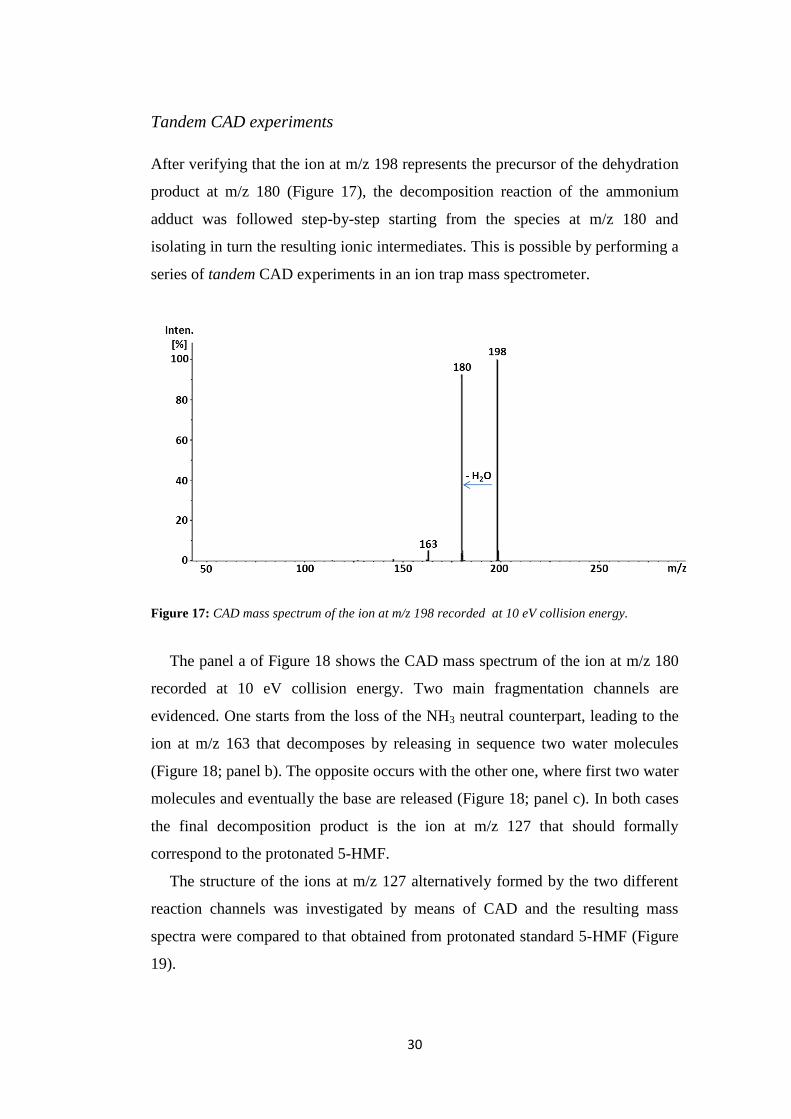
Tandem CAD experiments
After verifying that the ion at m/z 198 represents the precursor of the dehydration
product at m/z 180 (Figure 17), the decomposition reaction of the ammonium
adduct was followed step-by-step starting from the species at m/z 180 and
isolating in turn the resulting ionic intermediates. This is possible by performing a
series of tandem CAD experiments in an ion trap mass spectrometer.
Figure 17: CAD mass spectrum of the ion at m/z 198 recorded at 10 eV collision energy.
The panel a of Figure 18 shows the CAD mass spectrum of the ion at m/z 180
recorded at 10 eV collision energy. Two main fragmentation channels are
evidenced. One starts from the loss of the NH3 neutral counterpart, leading to the
ion at m/z 163 that decomposes by releasing in sequence two water molecules
(Figure 18; panel b). The opposite occurs with the other one, where first two water
molecules and eventually the base are released (Figure 18; panel c). In both cases
the final decomposition product is the ion at m/z 127 that should formally
correspond to the protonated 5-HMF.
The structure of the ions at m/z 127 alternatively formed by the two different
reaction channels was investigated by means of CAD and the resulting mass
spectra were compared to that obtained from protonated standard 5-HMF (Figure
19).

31
As previously observed (Section 2.1), protonated standard 5-HMF mainly
decomposes releasing a water molecule, forming a daughter ion at m/z 109
(Figure 19; panel a).
Figure 18: a) CAD mass spectrum of the ion at m/z 180; b)Tandem CAD mass spectrum of the
daughter ion at m/z 163 obtained as product of the NH3 loss from the ionic species at m/z 180; c)
Tandem CAD mass spectrum of the daughter ion at m/z 162 obtained as product of the loss of a
water molecule from the ionic species at m/z 180. In order to allow the mass spectrum
comparison, all CAD experiments were performed by applying a 10 eV collision energy.
When the NH3 base loss occurs from the first dehydrated intermediate at m/z
180, the [C6H6O3]H+
ionic population at m/z 127 thus arisen shows a
fragmentation pattern completely different from that obtained from protonated
standard 5-HMF (Figure 19, panel b). Conversely, when the NH3 base loss takes
place as the last reaction event, the ions at m/z 127 decompose by releasing a
water molecule. The CAD mass spectrum thus obtained (Figure 19; panel c) is

32
perfectly superimposable to that of protonated 5-HMF, highlighting the key role
played by the base in the dehydration process.
Figure 19: CAD mass spectra of a) protonated standard 5-HMF, b) ions at m/z 127 obtained after
a premature base loss and c) ions at m/z 127 arising when the base loss occurs as the last reaction
event. In order to allow the mass spectrum comparison, all CAD experiments were performed by
applying a 10 eV collision energy.
An alternative decomposition pathway consists in the loss of a CH2O neutral
counterpart occurring after the dehydration of the intermediate at m/z 162, as
reported in the panel c of Figure 18. The ionic product at m/z 114 derived from
this deformylation process formally corresponds to the adduct between NH4+ and
2-furaldehyde (2-FA). The identity of this ionic complex was confirmed by
comparing the CAD mass spectrum of the isolated ion at m/z 114 to the CAD

33
mass spectrum of the corresponding ionic species obtained from a solution of
standard 2-FA added with NH4Cl (Figure 20). Indeed, the strict match between
the two CAD spectra confirms the attribution of the ionic species at m/z 114.
Figure 20: CAD mass spectra of a) daughter ion at m/z 114 obtained from the fragmentation of
the dehydration intermediate at m/z 162, b) standard 2-FA ammonium adduct. In order to allow
the mass spectrum comparison, all CAD experiments were performed by applying a 10 eV
collision energy.
Isotopic labelling experiments
In order to acquire more information about the deformylation mechanism, 13
C1-
labelled D-fructose was analysed by ESI tandem mass spectrometry. As a result of
the isotopic labelling on C1, the m/z ratio of the ammonium D-fructose adduct

34
shifts from 198 to 199. Consequently, the m/z ratio of the doubly dehydrated
intermediate (the dehydration/deformylation precursor ion) shifts from 162 to 163.
As displayed in Figure 21 the loss of the CH2O neutral counterpart does not
involve the 13
C1 that is still present in the 2-FA molecular skeleton. Accordingly,
the deformylation reaction is probably obtained by rearrangement of the
methylenhydroxyl group bound at C5.
Figure 21: Tandem CAD mass spectrum of the daughter ion at m/z 163 obtained as ionic product
of the two water molecule loss from the ammonium 13
C1-D-fructose adduct at m/z 199.
Base replacement experiments
The possibility to generalize the decomposition pathways experimentally found
for the ammonium D-fructose adduct was evaluated by replacing NH4+ with the
conjugate acid of a series of nitrogen-containing bases (Table 4).
Considering that an efficient formation of 5-HMF has been recently obtained in
solution from fructose dehydration by developing a caprolactam hydrogen
sulphate ionic liquid catalyst,[58]
a set of bases structurally related to caprolactam
(12) was chosen. In particular, bases 2-4 and 8-10 show an amidic group whereas
bases 5,6,8 and 10,11 are characterized by a cyclic structure. Moreover, all these
compounds have proton affinity values in the range of 196.5 kcal mol-1
(base 2) to
225.3 kcal mol-1
(base 11).

35
Table 4: List of nitrogen-containing bases employed as complexation agent. The proton affinity
values are available on http://webbook.nist.gov/chemistry/. *Ref.[59].
Base Chemical Structure Molecular weight Proton affinity
(kcal mol-1
)
1 Ammonia 17 204
2 Formamide 45 196.5
3 Acetamide 59 206.4
4 Urea 60 208
5 p-F-aniline 111 208.1
6 Aniline 93 210.9
7 Glycine 75 211.9
8 Benzamide 121 213.2
9 Methylurea 74 213.4
10 δ-Valerolactam 99 218.6*
11 Imidazole 68 225.3
12 ε-Caprolactam 113 n.d.
When bases 1-4 are employed as complexation agent, the corresponding ionic
adduct, schematically represented as [C6H12O6-H-B]+, follows the same
decomposition routes previously observed for the ammonium complex. On the
other hand, when a base from 5 to 12 is chosen to form the precursor adduct, only
the first dehydration reaction occurs according to the CAD mass spectrum shown
NH3

36
in Figure 22. In this case, the main fragmentation channel consists in the loss of
D-fructose as neutral counterpart and the protonated base as the charged product.
Figure 22: CAD mass spectrum of the ionic adduct [C6H12O6-H-Aniline]+ recorded at collision
energy of 15 eV.

37
2.3 Pentose acid-catalysed dehydration
Figure 23 (panels a-c) displays the full scan mass spectra of D-xylose, D-ribose
and D-arabinose 10-3
solutions.
Figure 23: Positive IT ESI-MS spectra of H2O (0.1% HCOOH)/CH3OH (1:1, V/V) solutions of D-
xylose a), D-ribose b), D-arabinose c).
38
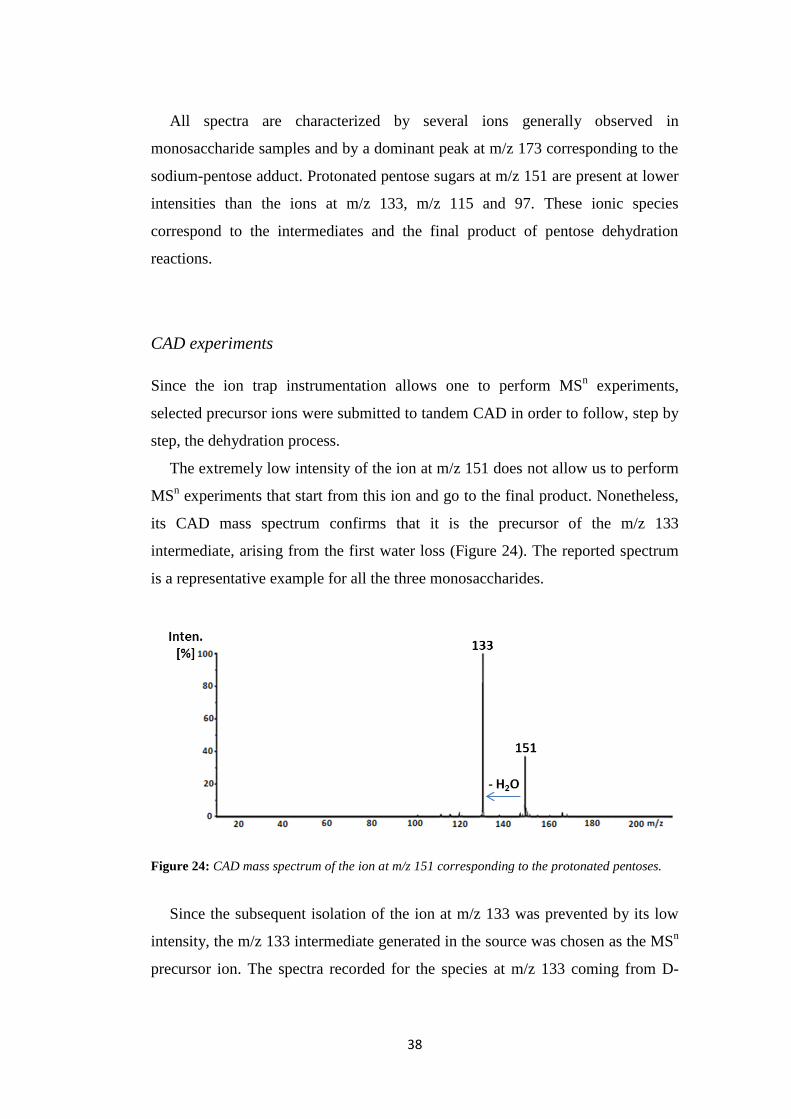
All spectra are characterized by several ions generally observed in
monosaccharide samples and by a dominant peak at m/z 173 corresponding to the
sodium-pentose adduct. Protonated pentose sugars at m/z 151 are present at lower
intensities than the ions at m/z 133, m/z 115 and 97. These ionic species
correspond to the intermediates and the final product of pentose dehydration
reactions.
CAD experiments
Since the ion trap instrumentation allows one to perform MSn experiments,
selected precursor ions were submitted to tandem CAD in order to follow, step by
step, the dehydration process.
The extremely low intensity of the ion at m/z 151 does not allow us to perform
MSn experiments that start from this ion and go to the final product. Nonetheless,
its CAD mass spectrum confirms that it is the precursor of the m/z 133
intermediate, arising from the first water loss (Figure 24). The reported spectrum
is a representative example for all the three monosaccharides.
Figure 24: CAD mass spectrum of the ion at m/z 151 corresponding to the protonated pentoses.
Since the subsequent isolation of the ion at m/z 133 was prevented by its low
intensity, the m/z 133 intermediate generated in the source was chosen as the MSn
precursor ion. The spectra recorded for the species at m/z 133 coming from D-

39
ribose are reported in Figure 25 (panels a and b), whereas the corresponding data
for D-xylose and D-arabinose are not shown since they give similar results.
Figure 25: D-ribose MSn spectra of the ion at m/z 133 a) and its product ion at m/z 115 b).
As shown, the first spectrum (Figure 25, panel a) is dominated by the ion at
m/z 115, arising from a water loss from the parent ion at m/z 133. This confirms
that the dehydration process represents the main fragmentation channel. The
product ion at m/z 115, obtained from the m/z 133 intermediate, was in turn
isolated. It mainly decomposes into the ion at m/z 97 (Figure 25, panel b), again
arising from the loss of a water molecule. All these results show that the
consecutive loss of three water molecules from the ion at m/z 151 leads to the
formation of the ion at m/z 97 as the final dehydration product. Its MSn CAD
mass spectrum recorded from the parent ion at m/z 133 is reported in Figure 26
and results perfectly superimposable to the CAD spectrum obtained from a

40
standard sample of protonated 2-furaldeyde (2-FA), as also reported in a previous
study undertaken in our laboratories.[60]
Triple quadrupole CAD mass spectrometry was used to investigate the
structure of the pentose dehydration intermediates and products generated in the
ESI source.
Figure 26: Comparison between the MSn CAD mass spectrum of the ion at m/z 97 obtained from
pentose dehydration reactions a) and the CAD mass spectrum of the protonated standard 2-
furaldeyde sample b).
Tables 5, 6 and 7 show the data extrapolated from the triple quadrupole CAD
spectra of the ion at m/z 133, m/z 115 and m/z 97 deriving from the
decomposition of protonated D-ribose, D-arabinose and D-xylose. The product
ion relative intensities were obtained from the average of three different CAD
experiments at nominal collision energy of 10 eV (laboratory frame).
The pentose isomeric ions at m/z 133 and m/z 115 show the same
fragmentation products, with small differences in the relative abundances of some

41
fragment ions. CAD mass spectra of monohydrate ions at m/z 133 mainly differ in
the relative intensities of the daughter ions at m/z 73, 57 and 55 (Table 5).
Conversely, the fragment ions at m/z 97, 85, 69 and 55 arising from the
intermediate at m/z 115 (Table 6) show relative intensities quite similar only
between D-ribose and D-arabinose.
Finally, the fragmentation patterns obtained from the ions at m/z 97 reported in
Table 7 are almost superimposable. This evidence confirms the MSn experiment
results, demonstrating that the three sugars dehydrate leading to the formation of
the same final compound corresponding to protonated 2-furaldeyde.
Table 5: CAD mass spectra of the ion at m/z 133 derived from protonated D-arabinose, D-ribose
and D-xylose. Each reported value was obtained as average of three different analyses with
standard deviations of the fragment ion intensities around ±10%.
Parent ion (m/z)
133
D-arabinose
(relative intensity)
D-ribose
(relative intensity)
D-xylose
(relative intensity)
115 2.9 3.4 2.5
97 2.1 4.1 3.4
87 1.6 2.1 1.3
85 6.5 8.3 8.0
73 50.8 29.5 40.0
71 1.1 4.0 1.7
69 5.3 9.3 7.6
61 5.3 4.6 4.0
59 3.7 4.6 1.6
57 11.8 15.1 26.2
55 4.8 9.5 0.8
45 2.1 1.8 1.7
43 1.6 2.8 0.8
41 0.5 0.9 0.4

42
Table 6: CAD mass spectra of the ion at m/z 115 derived from protonated D-arabinose, D-ribose
and D-xylose. Each reported value was obtained as average of three different analyses with
standard deviations of the fragment ion intensities around ±10%.
Parent ion (m/z)
115
D-arabinose
(relative intensity)
D-ribose
(relative intensity)
D-xylose
(relative intensity)
97 7.7 7.8 13.7
87 9.3 4.3 6.4
85 20.9 13.5 23.7
73 0.7 0.6 1.1
71 4.2 8.7 3.3
69 18.5 15.5 26.6
59 1.5 2.0 1.7
57 12.1 14.5 10.7
55 20.3 27.4 7.0
43 2.4 3.1 1.9
41 2.4 2.6 3.9
Table 7: CAD mass spectra of the ion at m/z 97 derived from protonated D-arabinose, D-ribose
and D-xylose. Each reported value was obtained as average of three different analyses with
standard deviations of the fragment ion intensities around ±10%.
Parent ion (m/z)
97
D-arabinose
(relative intensity)
D-ribose
(relative intensity)
D-xylose
(relative intensity)
71 3.2 5.3 2.1
69 51.4 50.8 52.5
55 2.2 1.6 1.2
43 5.1 4.8 3.1
41 38.1 37.5 40.1

43
Energy resolved CAD mass spectra (ERMS)
Triple quadrupole energy resolved CAD spectra of the ions at m/z 133 and m/z
115 allow one to measure the water loss dissociation energies of the pentose
sugars to be used as relative values to compare the dehydration behaviour of the
three monosaccharides. Also in this case, the very low intensity of the protonated
ions at m/z 151, due to the prompt dehydration under the ESI source conditions,
prevented us from recording the energy resolved CAD mass spectra. As a
consequence, the first dehydration energetic barrier cannot be measured. Figure
27 reports the energy-resolved product ion mass spectra of the ions at m/z 133,
arising from protonated D-ribose and D-arabinose recorded at collision energies
ranging from 0 to 3.8 eV (centre-of-mass).
Figure 27: D-ribose a) and D-arabinose b) energy resolved CAD mass spectra of the ions at m/z
133 leading to the intermediate at m/z 115.

44
The dehydration reaction leading to the ion at m/z 115 is characterized by
threshold energies of about 0.4 for D-ribose and 0.8 eV for D-arabinose.
Interestingly, in a previous work[60]
the same dehydration channel relevant to
D-xylose was found to be characterized by a threshold energy around 0 eV, which
indicates a lower dehydration barrier for the loss of the second water molecule
from protonated D-xylose with respect to the other two pentoses.
The loss of the third water molecule (Figure 28) seems to be slightly easier in
the case of D-arabinose, but in the range of 1.0-1.1 eV for both the sugars. These
values are in agreement with the threshold energy reported for the loss of the third
water molecule from D-xylose.[60]
Figure 28: D-ribose a) and D-arabinose b) energy resolved CAD mass spectra of the ions at m/z
115 leading to the final dehydration product at m/z 97.

45
Theoretical calculations
Computational studies were performed in order to clarify the dehydration
mechanisms of protonated pentoses.
The first dehydration step following protonation on C1-OH moiety of D-xylose
was preliminarily investigated by means of Carlo Parrinello quantum molecular
dynamics simulations, and then by M11/6-311++G(2d,2p) minimized
conformations.
Both approaches have evidenced that protonated α and β-pyranose forms of the
sugar easily evolve into a more stable loosely bound water cluster. As an example,
protonated D-xylose optimized water cluster is more stable than both α and β-
pyranose forms by about 10.0 kcal mol-1
. An “all equatorial” conformation
characterizes the hydroxyl groups in the protonated β-D-xylopyranose minimum
structure, whereas the minimization due to the “all axial” conformation leads to
the water removal. Hence, the protonated species obtained from the three
investigated sugars evolve to water adducts as the protonated hydroxyl group on
the anomeric carbon is in the axial position. According to the experimental
evidence, theoretical results confirmed the scarce stability of the protonated
pentose ions at m/z 151, characterized by a weakly bound water cluster structure.
Indeed, C1-OH protonated species lose the first water molecule through a
barrierless process assisted by the emiacetalic oxygen lone pair, which gives to
O5-C1 a partial double bond character (bond length = 1.24 Å).
The first dehydration step generates an oxonium ion B corresponding to the
ionic intermediate at m/z 133 observed in the ESI mass spectra. Figure 29 displays
the calculated geometry of D-xylose oxonium ion B, denoted as Bx, as well as
those obtained for dehydrated intermediates, transition states and final product.
The reaction pathways starting from these species are summarized in the
potential energy surfaces (PES) depicted in Figure 30.
After the first dehydration event, the oxonium ion Bx undergoes isomerization
in the bicyclic ion Cx through the nucleophilic attack of the O4 oxygen to the C1
anomeric carbon. This process is characterized by an energy barrier of 6.9 kcal
mol-1
and the isomerization reaction was confirmed by CPMD simulations.

46
Figure 29: 3D geometry of dehydrated intermediates, transition states and final product obtained
from protonated D-xylose dehydration calculated at the M11/6-311++G(2d,2p) level of theory.
Figure 30: Potential energy surfaces and reaction pathway of the unimolecular conversion of C1-
OH protonated D-xylose. The ΔH298 energies of minima and transition states were calculated at
the CCSD(T)/cc-pVTZ//M11/6-311++G(2d,2p) level of theory.

47
A proton shift from O4 to O2 leads to the formation of the ion Dx that is 9.0
kcal mol-1
less stable than Cx. NMR in situ spectroscopy of fructose acidic
solutions[61]
has recently demonstrated the existence of neutral intermediates
characterized by a bicyclic structure similar to Cx and Dx.
The emiacetalic O5 oxygen assists a ring contraction leading to the loss of the
second water molecule from C2 and the formation of the intermediate Ex.
The imaginary frequency inspection has indicated that transition state DETSx is
characterized by the simultaneous C2-O2 bond breakage and O5 transposition on
C2. Starting from the oxonium ion Bx the overall barrier relating to the loss of the
second water molecule is calculated to be 19.9 kcal mol-1
, a lower value than that
previously reported for the dehydration pathway that starts from C1-OH
protonation (39.3 kcal mol-1
).[38]
The calculated 19.9 kcal mol-1
energy barrier does not agree with the
experimental threshold energy of about 0 eV previously reported.[60]
The
discrepancy between experimental and theoretically calculated barriers for the
second water loss of D-xylose could be explained by assuming that the starting
reactant ions at m/z 133 are characterized by the Cx structure. The oxonium ion
Bx, excited by the ESI ionization process, could isomerize to the ionic species Cx
through a process that is characterized by a barrier of only 6.9 kcal mol-1
. Even if
this species is not trapped in a deep potential well and can back isomerize into the
ion Bx, its possible existence in the m/z 133 ionic population cannot be excluded.
The overall energy required for the second water loss starting from Cx is only
13.3 kcal mol-1
, an internal energy that can be reasonably owned by the ions
transmitted in the triple quadrupole mass spectrometer at nominal collision energy
of 0 eV, and moreover correctly lower than that measured for D-ribose in the
ERMS spectrum.
The bicyclic ion Ex, corresponding to the ionic intermediate at m/z 115,
evolves to the five terms carbocation Fx by breaking the bridged C4-O4 bond.
This rearrangement is assisted by an hydride shift from C5 to C4. The lone pair of
the adjacent heterocyclic oxygen atom stabilizes the carbocation Fx and the
barrier of the entire process is estimated to be 32.7 kcal mol-1
.

48
Finally, the last water molecule is released from Fx as a consequence of the
vicinal proton abstraction by the C3-OH group from C4 and characterized by a
barrier of 31.4 kcal mol-1
. Hence, the overall energy required for the third
dehydration from the ionic species Ex is 32.7 kcal mol-1
.
Regarding protonated D-ribose dehydration, the geometries identified for
intermediates, transition states and final product (Figure 31) are similar to those
calculated for D-xylose. A similar dehydration mechanism is summarized in the
potential energy surface (Figure 32).
Figure 31: 3D geometry of dehydrated intermediates, transition states and final product obtained
from protonated D-ribose dehydration calculated at the M11/6-311++G(2d,2p) level of theory.
According to the experimental results, the Br ion, as well as the intermediates
and transition states, are characterized by the same connectivity of the
corresponding species calculated for protonated D-xylose. As in the case of the
corresponding neutral pentose sugars, the only difference between xylose and
ribose concerns the orientation of OH groups.
The activation energy relating to the isomerization of the Br ion into the
bicyclic structure Cr, and the subsequent proton shift leading to Dr, is calculated

49
to be only 4.6 kcal mol-1
. Hence, it is reasonable to suggest that the ions at m/z
133 isolated in the ESI mass spectra assume both the Br and/or Dr conformations.
The PES profile relating to the D-ribose Br→Dr isomerization is lower in energy
than that obtained for D-xylose (Figure 30), and this is probably due to the
different hydroxyl group configurations. In particular, O2 and O3 were found in
cis configuration in D-ribose and in trans configuration in D-xylose.
Figure 32: Potential energy surfaces and reaction pathway of the unimolecular conversion of C1-
OH protonated D-ribose. The ΔH298 energies of minima and transition states were calculated at
the CCSD(T)/cc-pVTZ//M11/6-311++G(2d,2p) level of theory.
As a consequence, the intramolecular hydrogen bond between O2 and O3
enhances the stability of Cr.
Dr also presents this stabilization because the shifted proton on O2 is again
shared by O2 and O3. The energetic barrier of the second dehydration step from
Br is estimated to be 19.9 kcal mol-1
, the same value calculated for the second
water loss from Bx. This similar activation energy does not agree with the slightly
different experimental energy threshold measured in the ERMS spectra (0.0 eV
for xylose and 0.4 eV for ribose).

50
The ring contraction from Er to Fr occurs following the same mechanism
postulated for D-xylose. A proton abstraction by O3 from C4 promotes the third
water loss from the intermediate Fr. In this case the calculated energy profile
overlaps that of D-xylose and the overall activation barrier of 33.1 kcal mol-1
is in
agreement with the similar threshold energy experimentally measured for the last
dehydration of the two sugars.
Figure 33 displays the geometries of the dehydrated intermediates, transition
states and final product obtained from protonated D-arabinose, whereas PES and
hypothesized dehydration route are reported in Figure 34.
Figure 33: 3D geometry of dehydrated intermediates, transition states and final product obtained
from protonated D-arabinose dehydration calculated at the M11/6-311++G(2d,2p) level of
theory.
The proposed D-arabinose dehydration mechanism differs from the other two
sugar pathways especially for the loss of the second water molecule. The
activation energy relating to the conversion of the arabinose oxonium ion Ba into
the Ca is estimated to be 8.9 kcal mol-1
.
Concerning the D-arabinose second water loss, the 32.1 kcal mol-1
barrier is
higher than the corresponding value obtained for D-xylose and D-ribose, but in
agreement with the threshold energy experimentally measured. Moreover, the 0.4
eV experimental threshold energy difference between D-ribose and D-arabinose

51
perfectly agrees with the 12.2 kcal mol-1
difference between the calculated
barriers.
Figure 34: Potential energy surfaces and reaction pathway of the unimolecular conversion of C1-
OH protonated D-arabinose. The ΔH298 energies of minima and transition states were calculated
at the CCSD(T)/cc-pVTZ//M11/6-311++G(2d,2p) level of theory.
As reported in Figure 34, the second dehydration step occurs in a two sequence
mechanism characterized by two transition states, DD1TSa and D1ErTSa.
Compared to the analogue D-xylose and D-ribose transition states, DD1TSa and
D1ErTSa are endowed with higher energies (32.1 and 30.7 kcal mol-1
) and are
connected each other by the minimum D1a. This is characterized by an epoxy
function weakly interacting with the leaving water molecule.
The subsequent O5 transposition to C2 through the transition state D1ErTSa
allows the opening of the epoxy function and the ultimate removal of the water
molecule, as indicated by the calculated imaginary frequency. After the
isomerization of the D1a ionic species into the Er ionic intermediate, the
mechanism follows the same pathway calculated for D-ribose.
Finally, the energy barrier relating to the D-arabinose third dehydration step is
calculated to be 30.8 kcal mol-1
, in good agreement with the similar

52
experimentally measured threshold energies of D-xylose and D-ribose (1.0 and
1.1 eV).

53
2.4 Discussion
All the experimental and theoretical results aiming to the elucidation of the gas-
phase monosaccharide dehydration mechanisms suggest that protonation of the
sugars is a necessary step to convert them to platform chemicals.
For each monosaccharide analysed, protonated parent ions (m/z 181 for D-
hexoses, m/z 151 for D-pentoses) have been detected only at very low intensity.
On the contrary, the dehydration intermediates and products are always observed
as high-intensity peaks in the ESI mass spectra. It is reasonable to suppose that the
protonation occurs at the most basic site of these monosaccharides and that the
first dehydration barrier is sufficiently low to activate the dehydration process
directly in the mass spectrometer source.
With regard to D-glucose, a gas-phase DFT calculations performed at
B3LYP/6-311 +G(d,p) level of theory[49]
indicated the O1 as the most favourable
protonation site. The m/z 181 protomer thus obtained can easily head for the first
water molecule elimination leading to the ionic intermediate at m/z 163 as
described in Scheme 11. Therefore, the protonation and dehydration of glucose
C1-OH site result in the formation of a carbocation stabilized by the presence of
the pyranosic oxygen atom. For the reported entire process the associated
energetic barrier is estimated to be approximately 4 kcal mol-1
, an amount of
excitation energy reasonable owned by the ions in the ESI ionization process.
Scheme 11: D-glucose protonation and first water loss mechanism.

54
Also in the case of D-pentoses, the protonated sugars are not observed in the
ESI mass spectrum. Reasonably, these species easily lose the first water molecule,
through the same emiacetalic oxygen-assisted process observed for D-glucose.
Conversely to the theoretical calculations performed by Nimlos[38]
that predicted a
degradation pathway starting from D-xylose protonated at C2-OH, recent mass
spectrometric experiments[60]
demonstrated that gas phase D-xylose dehydration
reaction involves protonation on the OH group bound at C1 position. This
evidence has been obtained by undergoing CAD experiments on C1-OH and C2-
OH protonation model compounds, such as tetrahydro-2H-pyran-2-ol and
tetrahydro-2H-pyran-3-ol.[60]
Considering the small differences in the calculated proton affinity values of D-
xylose OH groups, the initial formation of other OH protonated isomers cannot be
excluded. Nevertheless, the C2-5-OH protonated species are all characterized by
higher first dehydration energies[38]
and hence should survive to water dissociation
and be observed in the mass spectra.
Concerning D-fructose protonation on the O2H most basic site, theoretical
studies[44,47,48]
calculated the first water loss to be only 6.0-8.5 kcal mol-1
endothermic.
Protonation at the other OH groups has been excluded since the dehydration
reactions of the corresponding protonated species are characterized by calculated
activation energy in the range of 25-40 kcal mol-1
. These energetic values are
excessively high to justify the low intensity of the m/z 181 ion observed in the
ESI mass spectrum.
Also in this case, the first water loss occurs in a process mediated by the
furanosic oxygen lone pair (Scheme 12).
As evidenced by Scheme 11 and Scheme 12 and from the full-scan mass
spectra reported in Section 2.1 (Figure 5), ions at m/163 represent the first
dehydration intermediates obtained from protonated D-glucose and D-fructose
conversion. The subsequent loss of an additional water molecule led to the
formation of the ionic intermediate at m/z 145.

55
Scheme 12: D-fructose protonation and first water loss mechanism.
Although CAD mass spectra can provide only limited information about the
minute structural details of the isolated ions, fragment at m/z 85 has resulted to be
structurally diagnostic for the characterization of these dehydration intermediates.
As previously reported,[57]
the presence of this fragment, corresponding to the loss
of the C2H4O2 neutral counterpart from the ionic intermediate at m/z 145, cannot
be attributed to an open-chain precursor ion but is a peculiar cross ring bond
cleavage of cyclic dehydrated sugars. This evidence confirms a cyclic structure
for the ions at m/z 163 and 145 arisen from the mono- and double-dehydration of
protonated hexose. As a consequence, the differences observed in the product ion
relative abundances between the two sugars cannot be related to a different
cyclic/linear connectivity, but to a different orientation of the diastereomeric
vicinal hydroxyl groups.
Small differences in the daughter ion relative intensities have been reported
also comparing the CAD mass spectra of the pentose ionic intermediates at m/z
133 and 115 (Table 5 and 6). Also in this case these differences can be ascribed to
the orientation of the OH groups, but in general the pentose dehydration
intermediates seem to be characterized by a common structure. This consideration
is reinforced by the intermediate structures predicted by theoretical calculations
and confirmed by the common ionic product obtained from the complete
dehydration of the three sugars. In fact, the loss of the third water molecule from
each ionic intermediate at m/z 115 has led to the daughter ion at m/z 97. This
species is characterized by the same structure for the three sugars and corresponds
to protonated 2-FA as verified by the comparison of the CAD mass spectra
reported in Figure 26. According to the outcome of the decomposition reactions

56
performed in solution, also in the gas phase the main product of pentose
dehydration reaction is the platform chemical 2-furaldehyde.
On the contrary, the gas-phase dehydration of D-glucose and D-fructose has
led to the formation of a mixed ionic population at m/z 127 not entirely composed
by protonated 5-HMF.
The main daughter ion at m/z 109 arising upon fragmentation of protonated
standard 5-HMF is also observed in the CAD mass spectra of the m/z 127 ions
obtained from protonated D-glucose and D-fructose. Nevertheless, the presence of
several additional fragment ions at m/z 97, 99 and 69, could account for a parent
ionic population containing a mixture of 5-HMF protomers and isomers. In
particular, daughter ion at m/z 97 can be considered as a diagnostic peak to
demonstrate the existence of different 5-HMF protomers. Indeed, this fragment
was observed when the fragmentation of protonated standard 5-HMF has been
performed under strongly exothermic chemical ionization (CI) conditions (Figure
10). Gradually increasing the proton transfer exothermicity it was possible to
access to energetically less preferred 5-HMF protonation sites leading to the
formation of different protonated species evidenced by the appearance of the ion
at m/z 97.
Moreover, the fragmentation into the ions at m/z 69 and m/z 99, never
observed under CI conditions, clearly points to the formation of isomeric
[C6H6O3]H+ ions with a different structure than 5-HMF. This assumption seems to
be in agreement with the results of a DFT study[49]
that has predicted the
formation of several dehydration products from C1-OH protonated D-glucose.
CAD mass spectra of the product ions at m/z 127 obtained from the
dehydration of protonated D-glucose and D-fructose are substantially different. In
particular, the CAD mass spectrum of the m/z 127 ion arising from protonated D-
fructose dehydration shows an intense fragment ion at m/z 69. This evidence
seems to confirm that the two sugars decompose following different dehydration
routes. Hence, even if the intermediacy of D-fructose in the D-glucose conversion
has been predicted by the “fructose” pathway,[42]
the differences experimentally
shown in the CAD mass spectra of the intermediate and product ions indicate that

57
the dehydration pathway mediated by the glucose/fructose tautomerization is not
the only mechanism occurring in the gas phase.
Besides, on the basis of the energetic barriers measured by ERMS experiments,
the second and third dehydration steps seem to be always thermodynamically
favoured in the case of D-fructose.
Experimental data discussed above allow us to corroborate the most feasible D-
glucose and D-fructose dehydration mechanisms among those predicted by
theoretical calculations. Furthermore, different catalytic strategies can be
proposed to increase the selectivity of the D-glucose and D-fructose conversion to
5-HMF.
In the case of D-glucose, the reported reaction pathway starting from C1-OH
protonation[38]
is perfectly in agreement with the results extrapolated from the gas-
phase H/D exchange experiments and can be used to describe the dehydration
mechanism of the 3-O-methyl-D-glucose model compound (Scheme 13). On the
basis of this mechanistic hypothesis, the protonation reaction at O1H position
prompts to lose the first water molecule leading to an oxocarbenium intermediate.
The subsequent O2-O3 proton transfer results in the opening of the cyclic
structure and the formation of a furanosic ring after the elimination of a methanol
molecule. The furanosyl intermediate can subsequently release the last water
molecule giving rise to the protonated 5-HMF by means of a proton transfer from
the ring.
Scheme 13: Hypothesized dehydration mechanism of 3-O-methyl-D-glucose leading to protonated
5-HMF.
Since the protonated 5-HMF is not the only product ion arising from the gas-
phase D-glucose dehydration, the mechanism proposed by theoretical calculations

58
represents one of the several possible routes for the D-glucose decomposition. On
the other hand, the data reported may be useful to clarify the key role performed
by an electron-withdrawing substituent eventually bound at O3 position. In fact,
the results obtained by the CAD mass spectrum of the ion at m/z 127 arising from
the dehydration of protonated 3-O-methyl-D-glucose suggest that the presence of
the methyl group at O3-position favours a specific dehydration mechanism
leading to protonated 5-HMF. This is due to the inductive effect carried out by the
methyl group that increases the O3 basicity and favours the O2-O3 proton
transfer. Although the O3 basicity is increased by the methyl substituent, O1 is
still the most basic site and the protonation reaction occurs at this position. This
hypothesis has been confirmed by the evidence that protonated 3-O-methyl-D-
glucose predominantly fragments by releasing a water molecule rather than a
methanol neutral counterpart (Figure 14). Indeed, the loss of CH3OH occurs only
after the first dehydration step according to the theoretical mechanism proposed.
With regard to D-fructose, the combination of experimental results and
theoretical unimolecolar mechanisms reported in literature[44,48]
has allowed us to
validate a possible D-fructose dehydration pathway leading to [C6H6O3]H+ ions
not corresponding to 5-HMF protonated at the aldehydic group (Scheme 14-16).
As previously reported, the protonation reaction occurs at the most basic sugar
site that in the case of D-fructose corresponds to the O2H group (Scheme 14).
Scheme 14: D-fructose gas-phase first dehydration mechanism.
The subsequent loss of a water molecule leading to the m/z 163 intermediate
(2) shows an energetic barrier of only 6.0-8.5 kcal mol-1
. This intermediate can
release the second water molecule after a proton transfer from the O1 to O3 and

59
the subsequent hydride shift from C1 to C2 leading to the species 3. The
calculated barrier for this rearrangement ranges from 29.9 to 31.2 kcal mol-1
and
the entire process generates an ionic structure that is prompt to lose the second
water molecule (Scheme 15). According to the theoretical data,[48]
the unstable
carbocation 4 can isomerize to the more stable ionic species 5, corresponding to
the ion at m/z 145, by the 1-2 hydride shift from C4 to C3. At this point, the
hemiacetalic oxygen lone pair can assist the hydride shift from C5 to C4 with the
subsequent formation of the ionic species 6 that is the key intermediate for the
loss of the third water molecule.
Scheme 15: D-fructose gas-phase second dehydration mechanism.
Species 6 can undergo a proton transfer from C3 to O4H arranging the
molecule for the last dehydration step (5→8). This route leads to the ionic species
8 that corresponds to 5-HMF protonated on the ring (Scheme 16, route a). The
overall activation energy for this process was calculated by Caratzoulas et al. to be
31.8 kcal mol-1
. It is worth of note that the calculated values for the second and
third dehydration steps are similar (31.2 versus 31.8 kcal mol-1
), in agreement
with the similar activation energy experimentally measured by the energy-
resolved mass spectra.
Furthermore, it can be hypothesized that the third water loss may follow the
alternative pathway 6→11, mechanistically reflecting the 2→3 step, that gives
rise to the formation of the dialdehyde 11, a gas-phase product strictly related to
2,5-diformylfuran, a 5-HMF oxidation product reported in water-free solutions[62]
(Scheme 16, route b). The ionic species 11 represents a good candidate as
precursor of the peculiar fragment ion at m/z 69 observed in the CAD mass
spectrum of the ion at m/z 127. In fact, this fragment can be formed by the

60
breakage of the bonds between C2-C3 and C5-O as well as between C4-C5 and
C2-O.
Scheme 16: D-fructose gas-phase third dehydration mechanisms.
The proposed dehydration mechanism reflects the results of the isotope-
labelling experiments showing that the first and second water loss involves only
proton bound to the OH groups, whereas the last dehydration reaction can occur in
parallel by shifting an hydrogen atom from the ring or by transferring the proton
between the two remaining OH groups.
Taking into account this evidence, the gas-phase selectivity of the D-fructose
conversion to 5-HMF has been increased by forming an ionic adduct with the
conjugate acid of a nitrogen-containing base. In particular, the ammonium ion,
employed as model acid, shows the unique characteristic to simultaneously act as
a protonating or a coordinating agent.
Experimental results have confirmed that when ammonium acts as a
protonating agent the loss of NH3 neutral counterpart performed by tandem CAD
occurs after the first dehydration step of the ionic adduct. The subsequent loss of
two water molecules leads to a m/z 127 ionic population very similar to that
arising from D-fructose dehydration in acidic medium.
On the other hand, when the ammonium acts as a coordination agent and
remains attached to D-fructose during the three dehydration reactions, the final
ionic population at m/z 127 results to be enriched in protonated 5-HMF (Figure
19). This result seems to account for the existence of a selective and effective

61
base-assisted dehydration mechanism that drives the D-fructose conversion to 5-
HMF. Simultaneously, the ammonium can assist also a double dehydration
followed by a deformylation reaction leading to a [2-FA··NH4]+ adduct. Hence, it
has been highlighted a novel D-fructose conversion mechanism to 2-FA never
observed in solution.
Replacing ammonia with other nitrogen bases, it has been demonstrated that
the reproducibility of this selective conversion mechanism strictly depends on the
proton affinity difference existing between the chosen base and the most basic site
of D-fructose. In this regard, the O2 proton affinity of D-fructose has been
estimated to be around 195 kcal mol-1
.[63]
Hence, comparing this value with those
of the nitrogen-containing bases reported in Section 2.2 (Table 4) a significant
trend has emerged. When the proton affinity difference ranges between 1.5-13
kcal mol-1
(bases 1-4 of Table 4) the chemical behaviour of the ionic adduct is
superimposable to that obtained by employing ammonium as a coordination
agent. On the contrary, when the proton affinity difference exceeds 13 kcal mol-1
(bases 5-12 of Table 4) the ionic adduct undergoes a single dehydration upon
fragmentation.
Theoretical calculations are in progress in order to elucidate the structures of
the starting reactant ion, those of the intermediates and to validate feasible
reaction mechanisms.

62
3. L-Ascorbic acid decomposition reaction
Furan is a heterocyclic organic molecule, consisting of a five-membered aromatic
ring and characterized by a low boiling point (31 °C). Chemical compounds
containing such rings are also referred to as furans.
Furan products had received increasing attention since 1995 when the
International Agency for Research on Cancer expressed the opinion that “furan
and its derivatives are carcinogenic in rats and mice” and classified them as
“possible carcinogenic to humans”.[4]
Although the mechanism of furan’s carcinogenesis is not well-understood,
several studies account for the fact that cis-2-butene-1,4-dial metabolite arising
from furan microsomal oxidation is responsible for the formation of diasteromeric
adducts with DNA.[64]
In 1979 Maga[65]
first reported that furan products are present in a number of
foods providing evidence that was confirmed only in 2004 by the European Food
Safety Authority (EFSA)[66]
and the Food and Drug Administration (FDA).[67]
These agencies calculated the average levels of furan considering an enlarged
range of food categories. Amounts over 100 μg/Kg were found especially in
coffee, baby food, sauces and soups.
Some research groups[68-71]
have demonstrated that these dangerous compounds
arise by decomposition reactions occurring upon food thermal treatment, such as
extreme thermal process by which glass and metal containers are sterilised.
Nevertheless, also non-thermal processing technologies such as ionizing radiation
can induce furan formation.[72]
Unsaturated lipids, reducing carbohydrates and specific amino acids are
indicated as the main classes of furan precursors in thermally processed food.
Among these molecules L-Ascorbic acid represents one of the major source of
furan derivatives.
L-Ascorbic acid, also known as Vitamin C, is a water-soluble nutrient present
in vegetables and fruits and required as part of the human diet owing to its
protective role in the body. Its reducing properties are used in the pharmaceutical
and food industry to protect foodstuffs against oxidation and prolong the shelf life
of drugs.

63
L-Ascorbic acid is very effective as antioxidant because it can be quantitatively
oxidized to dehydroascorbic acid in aqueous solution by different oxidizing agents
(Scheme 17).
On the other hand, the exposure of Vitamin C to oxygen, metals, humidity and
light can produce the degradation of this sensitive molecule.
Scheme 17: L-Ascorbic acid oxidation to dehydroascorbic acid.
The identification of L-Ascorbic acid degradation products and the knowledge
of the mechanisms through which these products are formed can be useful to
determine optimal storage and processing conditions for foodstuffs containing
vitamin C as preservative.
Considering the genotoxic potential of the furan products, the elucidation of the
pathways by which furan and furan derivatives are produced is a promising
approach for optimizing strategies aiming to control their formation. Indeed, the
safeguard of the public health can be ensured only keeping the level of the furan
products under the critical threshold.
As in the case of the monosaccharide decomposition reactions reported in this
thesis, controversial mechanistic hypotheses have been predicted by theoretical
studies concerning L-Ascorbic acid decomposition reaction. In this regard, Hirst
et al.[73]
first reported the formation of furfural (2-furaldehyde) from Vitamin C in
strong acidic media, whereas Mogol et al.[74]
investigated the effect of oxidizing
and reducing agents on the formation of furan from L-Ascorbic acid degradation
as a function of heating at elevated temperatures (˃100 °C). According to this
study, degradation of L-Ascorbic acid has been classified into two types of
reactions (non-oxidative and oxidative) and the main difference is represented by

64
the formation of dehydroascorbic acid in the first reaction step due to the
alternative presence of anaerobic or aerobic conditions (Scheme 18).
Scheme 18: Non-oxidative and oxidative decomposition pathways of L-Ascorbic acid proposed by
Mogol et al. Ref. [74].
Also the non-oxidative degradation mechanism proposed by Kurata[75]
has
suggested furfural as the main carbonyl product obtained in solution. This work
highlighted that the dehydration reaction of 3-deoxy-L-pentosone (3-D-P)
intermediate to 2-furaldehyde is accelerated by acid catalyst.
Anyway, it should be noted that most of the theoretical mechanisms consider
the bimolecular reaction between protonated L-Ascorbic acid and one or more
surrounding water molecules. On the contrary, the peculiar conditions of the gas-
phase studies allow one to consider only intramolecular processes leading to
charged intermediates in which solvent molecules are never involved. For this
reason, on the basis of our experimental data collected by means of the mass
spectrometric techniques, a new decomposition pathway has been suggested.
Contrary to the monosaccharide sugars previously investigated, no information
about the structure and ion energetics of protonated L-Ascorbic acid is available
in literature. Hence, the first step of the investigation was the measurement of L-

65
Ascorbic acid proton affinity (PA) and gas-phase basicity (GB). Subsequently,
starting from the gaseous reactant ions, the reaction intermediates and products
were structurally characterized and the conversion energetic barriers measured.
The whole picture emerging from the experimental and theoretical results allowed
us to draw a gas-phase Vitamin C decomposition reaction mechanism.

66
3.1 Protonated L-Ascorbic acid structure and ion energetics
Proton affinity (PA) and Gas Phase Basicity (GB) are two thermochemical
parameters defined as the negative of the standard enthalpy and standard Gibbs
free energy for the protonation reaction (1), respectively :
A + H+ → AH
+ (1)
The most common mass spectrometric approaches used to determine proton
affinities are the equilibrium method[76,77]
and bracketing method.[78,79]
Owing to the L-Ascorbic acid low vapour pressure and its pronounced
tendency to decompose at high temperature, the use of the above-mentioned
approaches was prevented. An advisable alternative to obtain this thermochemical
information is represented by the Cooks’s kinetic method.[80]
Figure 35: Characteristic fragmentation pathway and CAD mass spectrum of the proton-bond
dimer ions.

67
This approach consists in generating a proton-bond dimer between the
molecule of interest (A) and a reference base (B). Upon collisionally activated
dissociation (CAD) the dimers can subsequently fragment into the protonated
reference base or competitively to protonated molecule A (Figure 35).
The ratio of the two product ion abundances allows one to estimate the relative
affinity of both molecules to the H+ ion.
Thus, the selection of a set of suitable reference bases is a critical step for the
application of the method. First of all, the bases should have self-consistent
thermochemical values and in order to neglect entropic factors they should be
structurally similar to the analyte A. In the case of polydentate molecules, such as
L-Ascorbic acid, the protonation entropy differences existing between the analyte
and any selected reference base are significant, making necessary to apply the
“extended” kinetic method developed by Fenseleau and Wesdemiotis.[81,82]
On the basis of this approach, the PA of L-Ascorbic acid (PAA) can be
calculated using the Equation 1, where [AH+]/[BiH
+] represents the ratio of the
product ion intensities observed from collisionally activated dissociation of the
proton-bond dimers, PABi is the PA of each reference base used in the
determination of PAA, PAavg is the average PA of the set of reference bases and
Δ(ΔS) is the difference in protonation entropy between L-Ascorbic acid (AA) and
the bases.
(1)
The GB parameter can be derived from the PAA by using the Gibbs-Helmotz
equation (Equation 2).
(2)
To obtain the PAA value from Equation 1 two plots were constructed. In the
first diagram (Figure 36) the natural log of the experimentally determined
GB= PAA - TΔS
p
[AH+]
[BiH
+]
ln = - PA
Bi-PA
avg
RTeff
+
PAA-PA
avg
RTeff
-
Δ(ΔS)
R

68
[AH+]/[BH
+] ratio is plotted versus PABi-PAavg (where PAavg= 867.2 kJ mol
-1).
Each value of ln[AH+]/[BH
+] is obtained from averaging three different set of data
recorded in the same experimental conditions.
Figure 36: Plot of the ln([AH+]/[BH
+]) versus PABi-PAavg, taken at four different collision
energies (4, 6, 8 and 10 eV).
The reference bases used for the PAA measurement were opportunely chosen
on the basis of their structures; in fact, they are all associated with the L-Ascorbic
acid by the presence of a common carbonyl group. Besides, their thermochemical
parameters are well-known in literature[83]
and listed in Table 8.
Table 8: Thermochemical properties of the reference bases used. a) Data taken from Ref. [83].
Reference base Gba
(kJ mol-1
)
Paa
(kJ mol-1
)
ΔSp
(kJ mol-1
K-1
)
Acetylacetone 836.8 873.5 123.1
Acetophenone 829.3 861.1 106.7
Methylbenzoate 819.5 850.5 104.0
Hydroxyacetophenone 851.9 883.7 106.7

69
Neglecting the entropic effects and applying directly the “simple” Cooks’s
kinetic method, it is possible to obtain an apparent PAA value of about 874.2 kJ
mol-1
from the x-intercept PABi-PAavg=7.
The standard regression analysis allowed to define the best-fit lines to the data
of the first plot (Figure 36), having slopes (m) corresponding to 1/RTeff and y-
intercepts equal to [(PAA-PAavg)/RTeff-Δ(ΔS)/R].
Table 9 displays the slope m and y-intercept values obtained. Standard
deviations were calculated from the square root of the variance.
Table 9: Values obtained from the standard regression analysis
Collision energies
(eV)
m (1/RTeff) y-intercept
4.0 0.0763±0.01 0.4048±0.06
6.0 0.1167±0.002 0.7935±0.09
8.0 0.1268±0.02 0.8994±0.05
10.0 0.1645±0.05 1.0845±0.2
On the basis of these data a second diagram can be constructed plotting the m
values against the y-intercept. (Figure 37).
Figure 37: Plot of m values (1/RTeff) versus the y-intercepts ([(PAA-PAavg)]/RTeff-Δ(ΔS)/R].

70
A best-fit line having slope m of 7.7736 corresponding to PAA-PAavg can be
obtained from the second plot. Hence, the PA of AA can be extrapolate and
estimated to be 875.0 kJ mol-1
. An uncertainty of ±12 kJ mol-1
is attributed to the
measured value taking into account the error in the average PA of the reference
bases chosen (±7 kJ mol-1
) and the uncertainties in the data obtained from the first
diagram.
The y-intercept of the second diagram of Figure 37 corresponds to Δ(ΔS)/R
and considering a ΔSavg value of 110.1 J mol-1
K-1
for the reference bases, a ΔS
value for the protonation of AA can be calculated to be 108.9 ±2 J mol-1
K-1
.
Thus, a GB of 842.5 ±12 kJ mol-1
can be estimated at 298 K.
Finally, a standard enthalpy of formation of -509.6 ±12 kJ mol-1
for protonated
AA was obtained from the measured PA value of AA and its heat of formation,
ΔH°, reported by Wilhoit (-1164.6 kJ mol-1
).[84]
Quantum mechanical calculations
A systematic quantum mechanical (QM) study at the B3LYP/6-31 +G(d,p) level
of theory was carried out in order to support the mass spectrometric measurements
and highlight the structures of [C6H8O6]H+ ions experimentally investigated.
The first step of this study consisted in evaluating the potential energy surface
of neutral L-AA (C6H8O6) and led to the identification of several low energy
conformers of the considered species. This number of structures is certainly due to
the structural flexibility of the molecule and the possibility to form different intra-
molecular H-bonds. Each conformer was generated and, consequently named, as a
result of the rotation around the C4-C5 bond forming an angle O1-C4-C5-O5 of
60°, 180° and 300°, respectively. Starting from these three rotamers, the
subsequent rotation around the C5-C6 bond formed an O5-C5-C6-O6 angle of
60°, 180° and 300°, leading to the optimization of nine different conformers
displayed in Figure 38.
These rotamers are characterized by several H-bonds. In particular, all the
rotamers show two H-bonds on the lactone ring (O2-H1 and O3-H2) and two H-

71
bonds on the chain and between the chain and the ring; only AA_60_180 forms
one H-bond on the chain.
Figure 38: Geometries of the optimized conformers of L-AA and their energy difference from the
lowest energy structure.
The formation of each intramolecular H-bond involves an energy gain of about
12.5 kJ mol-1
influencing the relative stability of neutral AA.
Figure 39: Geometry of the AA_60_300 lowest energy conformer.

72
The evaluation of the energetic contents for each rotamers identifies the
conformer AA_60_300 as the most stable structure (Figure 39). This result is in
agreement with previous theoretical[85]
and experimental studies.[86,87]
Besides, the O1, C4, C5, C6, O6 and H6 atoms of AA_60_300 form a six-
membered ring structure with chair conformation that is absent in the other eight
conformers and accounts for its higher stability. All optimized geometrical
parameters are reported in Table 10.
Table 10: Geometrical parameters of AA_60_300 conformer.
Bond Å Dihedral angles Degree Angles Degree
O1-C1 1.379 O1-C4-C5-O5 -68.157 O1-C4-C5 110.163
C1-C2 1.458 O1-C4-C5-C6 55.909 C4-C5-C6 111.916
C2-C3 1.344 C4-C5-C6-O6 -79.013 C5-C6-O6 111.261
C3-C4 1.5 C4-C5-O5-H5 94.74 C6-O6-H6 108.477
C4-O1 1.452 C5-C6-O6-H6 65.989 O6-H6-O1 126.716
C1-O2 1.212 C6-O6-H6-O1 -38.132 H6-O1-C4 102.716
C2-O3 1.358 O6-H6-O1-C4 21.228 O1-C4-C3 103.835
C3-O4 1.346 O1-C4-C3-O4 -178.829 C4-C3-C2 109.469
C5-O5 1.413 O1-C4-C3-C2 1.745 C3-C2-C1 108.748
C6-O6 1.425 C4-C3-C2-O3 179.233 C2-C1-O1 108.376
C4-C5 1.544 C4-C3-C2-C1 -0.632 _ _
C5-C6 1.54 C4-C3-O4-H2 -175.624 _ _
O3-H1 0.971 C3-C2-C1-O2 179.504 _ _
O4-H2 0.969 C3-C2-C1-O1 -0.812 _ _
O5-H5 0.972 C3-C2-O3-H1 -178.718 _ _
O6-H6 0.97 O4-C3-C2-O3 -0.101 _ _
C4-H3 1.098 O3-C2-C1-O2 -0.368 _ _
C5-H5 1.098 _ _ _ _
C6-H6 1.093 _ _ _ _
C6-H7 1.099 _ _ _ _

73
The second step of this QM investigation was the elucidation of the protonated
structures. Since the L-AA shows six basic sites corresponding to the six oxygen
atoms, it was necessary to evaluate the GB and PA for each oxygen atom of the
most stable neutral conformer, obtaining six protomers named accordingly to the
protonated oxygen atom (AA_60_300_cat1; AA_60_300_cat2; AA_60_300_cat3;
AA_60_300_cat4; AA_60_300_cat5; AA_60_300_cat6). Among these, four
protomers are characterized by a stable structure, whereas all the optimization
procedures to obtain the lowest energy geometries for cat3 and cat5 led to the
isomerization into cat2 and cat6, respectively.
Figure 40 reports the optimized geometries and the relative energies of the four
optimized protomers, whereas in Table 11 the bond lengths of the neutral
AA_60_300 versus the protonated species are listed.
Figure 40: Optimized geometries and relative energies of the AA protomers.
Analysing the energetic parameters shown in Figure 40, it is clear that the most
stable conformer is AA_60_300_cat2 and consequently the L-AA is preferentially
protonated at the carbonyl oxygen.

74
Table 11: Bond lengths (Å) of neutral and protonated AA_60_300.
Bond AA_60_300 cat1 cat2 cat4 cat6
O1-C1 1.379 1.579 1.312 1.392 1.432
C1-C2 1.458 1.429 1.409 1.477 1.454
C2-C3 1.344 1.359 1.373 1.342 1.349
C3-C4 1.500 1.498 1.498 1.506 1.500
C4-O1 1.452 1.477 1.467 1.438 1.460
C1-O2 1.212 1.180 1.301 1.199 1.196
C2-O3 1.358 1.352 1.347 1.338 1.346
C3-O4 1.346 1.321 1.313 1.365 1.339
In this regard, Figure 41 displays the optimized structure of this species,
highlighting the intramolecular H-bonds, whereas Table 12 lists its geometrical
parameters.
Figure 41: Optimized geometry of the lowest energy protonated conformer, AA_60_300_cat2.
AA_60_300_cat2 shows a strong electron delocalization on the lactone ring
and on the neighbouring oxygen atoms (O2, O3 and O4) that can be justified by
the shortening of O1-C1, C1-C2, C2-O3 and C3-O4 bonds and from the
simultaneous elongation of C1-O2, C2-C3 and C4-O1 bonds respect to neutral
AA_60_300. Thus, the electronic stabilization is due to the protonation at O2 and

75
the consequent formation of a 5-alkyl-substituted 1,2,3-trihydrocyclopentadiene
structure of AA involving a cyclic diene π-electron system. Besides, the greater
stability of AA_60_300_cat2 (Figure 41) can also be attributed to the presence of
three hydrogen bonds (O1-H9, O2-H1 and O3-H2). In this context, comparing the
geometries of all protomers (AA_60_300_cat1, AA_60_300_cat2,
AA_60_300_cat4 and AA_60_300_cat6), only the conformer AA_60_300_cat2
shows a cage-like structure formed by a five atom ring (O1-C4-C5-C6-O6) with a
hydrogen bond (O6-H5, 2.13 Å) as a bridge.
Table 12: Geometrical parameters of AA_60_300_cat2.
Bond Å Dihedral angles Degree Angles Degree
O1-C1 1.312 O1-C4-C5-O5 -58.148 O1-C4-C5 110.571
C1-C2 1.409 O1-C4-C5-C6 67.74 C4-C5-C6 113.817
C2-C3 1.373 C4-C5-C6-O6 -76.777 C5-C6-O6 106.75
C3-C4 1.498 C4-C5-O5-H5 100.456 C6-O6-H6 110.191
C4-O1 1.467 C5-C6-O6-H6 -162.623 O6-H6-O1 _
C1-O2 1.301 C6-O6-H6-O1 _ H6-O1-C4 _
C2-O3 1.347 O6-H6-O1-C4 _ O1-C4-C3 102.526
C3-O4 1.313 O1-C4-C3-O4 -178.766 C4-C3-C2 110.058
C5-O5 1.404 O1-C4-C3-C2 3.047 C3-C2-C1 104.764
C6-O6 1.425 C4-C3-C2-O3 179.319 C2-C1-O1 108.376
C4-C5 1.556 C4-C3-C2-C1 -1.71 _ _
C5-C6 1.533 C4-C3-O4-H2 -176.426 _ _
O3-H1 0.969 C3-C2-C1-O2 179.702 _ _
O4-H2 0.974 C3-C2-C1-O1 -0.508 _ _
O5-H5 0.972 C3-C2-O3-H1 -178.718 _ _
O6-H6 0.966 O4-C3-C2-O3 -0.366 _ _
C4-H3 1.094 O3-C2-C1-O2 -1.409 _ _
C5-H5 1.098 _ _ _ _
C6-H6 1.096 _ _ _ _
C6-H7 1.098 _ _ _ _
O2-H9 0.976 _ _ _ _

76
AA_60_300_cat4 and cat6 are less stable than AA_60_300_cat2 by 73.6 and
36.8 kJ mol-1
respectively and retain a furan six-membered ring structure
resembling that of the neutral species. Finally, O1 protonation (AA_60_300_cat1)
implicate the ring opening leading to an isomer less stable by 56.8 kJ mol-1
.
Table 13 reports the computed PA values of all AA_60_300 protomers.
Comparing them, the carbonyl oxygen always results the preferentially protonated
atom and the corresponding structure (AA_60_300_cat2) is characterized by a PA
value of 861.6 kJ mol-1
and a GB of 833.9 kJ mol-1
. The inclusion of the
Grimme’s dispersion has not changed the PA value that is in good agreement with
the experimental result.
Table 13: Computed PA and GB of protonated AA_60_300.
PA
(kJ mol-1
)
GB
(kJ mol-1
)
AA_60_300_cat1 809.7 780.8
AA_60_300_cat2 861.6 833.9
AA_60_300_cat4 789.6 757.4
AA_60_300_cat6 827.3 795.1
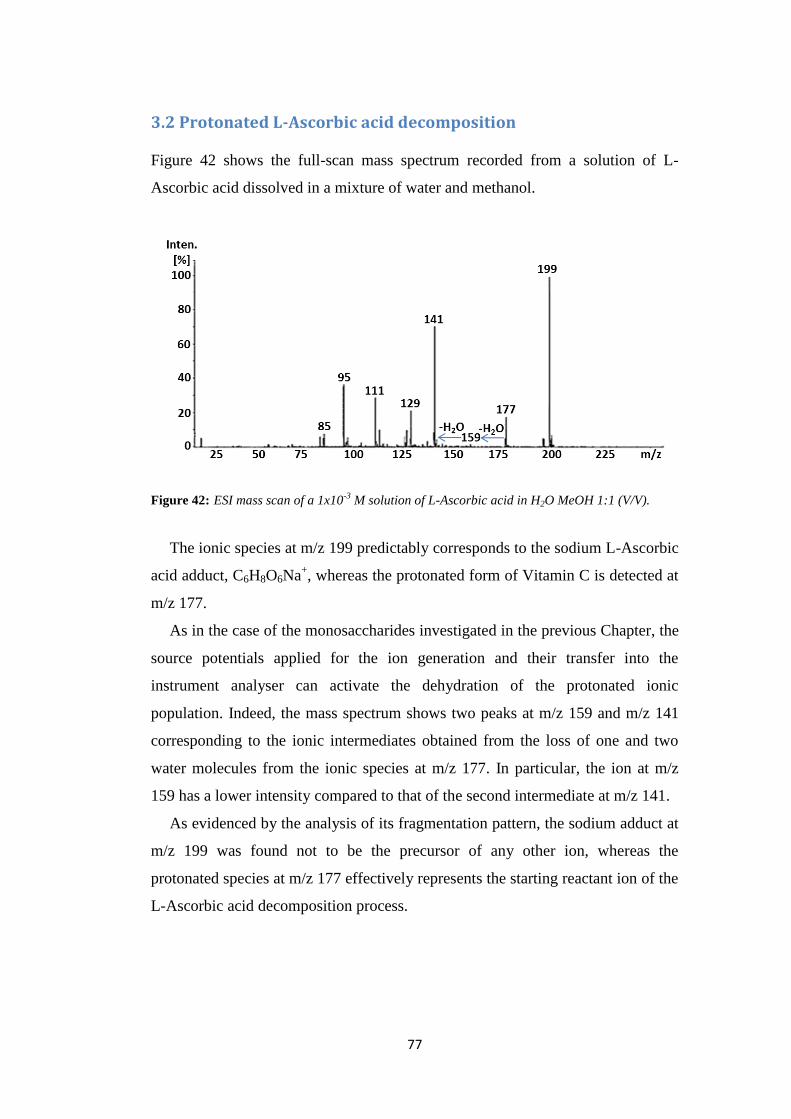
77
3.2 Protonated L-Ascorbic acid decomposition
Figure 42 shows the full-scan mass spectrum recorded from a solution of L-
Ascorbic acid dissolved in a mixture of water and methanol.
Figure 42: ESI mass scan of a 1x10⁻³
M solution of L-Ascorbic acid in H2O MeOH 1:1 (V/V).
The ionic species at m/z 199 predictably corresponds to the sodium L-Ascorbic
acid adduct, C6H8O6Na+, whereas the protonated form of Vitamin C is detected at
m/z 177.
As in the case of the monosaccharides investigated in the previous Chapter, the
source potentials applied for the ion generation and their transfer into the
instrument analyser can activate the dehydration of the protonated ionic
population. Indeed, the mass spectrum shows two peaks at m/z 159 and m/z 141
corresponding to the ionic intermediates obtained from the loss of one and two
water molecules from the ionic species at m/z 177. In particular, the ion at m/z
159 has a lower intensity compared to that of the second intermediate at m/z 141.
As evidenced by the analysis of its fragmentation pattern, the sodium adduct at
m/z 199 was found not to be the precursor of any other ion, whereas the
protonated species at m/z 177 effectively represents the starting reactant ion of the
L-Ascorbic acid decomposition process.

78
CAD experiments
The CAD mass spectrum of the ions at m/z 177 (Figure 43) demonstrates that the
dehydration of protonated L-Ascorbic acid occurs in two consecutive steps
leading to the ionic species at m/z 159 and 141, respectively.
Figure 43: CAD mass spectrum of the ion at m/z 177.
Moreover, the ionic peak at m/z 95 may formally correspond to the final
product of the L-Ascorbic acid decomposition reaction. This hypothesis has been
confirmed by the CAD mass spectrum of the ionic intermediate at m/z 141
reported in Figure 44.
Figure 44: CAD mass spectrum of the ion at m/z 141 obtained from protonated L-Ascorbic acid.

79
Indeed, the fragmentation of this ionic species produces a single daughter ion
at m/z 95 following the loss of a formic acid molecule as a neutral counterpart.
Energy resolved CAD experiments
Energy resolved CAD experiments have allowed us to measure the relative water
loss dissociation energies.
Figure 45: Energy-resolved CAD mass spectra of the ions a) at m/z 177 leading to the ion at m/z
159; b) at m/z 159 leading to the ion at m/z 141; c) at m/z 141 leading to the ion at m/z 95.

80
Figure 45 (panel a) shows the ER-mass spectrum of the ions at m/z 177
recorded at collision energies ranging from 0 to 5 eV (centre-of-mass collision
energy). Focusing on the onset of the cross section curves, the loss of the first
water molecule leading to the ion at m/z 159 arises at collision energies close to
the nominal centre of mass energy of 0.8 eV.
The threshold energy relating to the second water loss was also measured and
the energy-resolved CAD mass spectrum of the ions at m/z 159 is displayed in
Figure 45, panel b. The second water loss is activated at a collision energy around
0.6 eV, a lower value if compared to the first water loss.
Finally, panel c of Figure 45 displays the ER-mass spectrum of the ion at m/z
141 leading to the ionic species at m/z 95. As evidenced by the analysis of the
cross section curve onset, the loss of a formic acid molecule as a neutral
counterpart occurs at collision energies close to the nominal centre of mass energy
of 1.2 eV
Isotopic labelling experiments
In order to acquire more information about the reaction mechanism leading to the
ionic species at m/z 95, a tandem CAD analysis has been realized by using L-13
C-
Ascorbic acid. As a result of the isotopic labelling on the C2 carbon, the m/z ratio
of protonated L-Ascorbic acid shifts from 177 to 178. Consequently the m/z ratio
of the two dehydration intermediates shift from 159 to 160 and from 141 to 142,
respectively.
Interestingly, following step-by-step the decomposition of labelled L-13
C -
Ascorbic acid by tandem CAD experiments it is possible to observe that the final
loss of the formic acid molecule obtained from the ionic species at m/z 142
involves the 13
C carbon atom (Figure 46), an important result that must be
considered in order to validate a possible L-Ascorbic acid decomposition
mechanism.

81
Figure 46: Tandem CAD mass spectra of a) protonated L-13
C-Ascorbic acid at m/z 178;b)
daughter ion at m/z 160 obtained as ionic product of the first water loss from the ion at m/z 178; c)
daughter ion at m/z 142 obtained as ionic product of the second water loss from the ion at m/z 160
isolated in turn from the starting reactant ion at m/z 178.
Quantum mechanical calculations
Quantum mechanical calculations have allowed us to depict a reaction pathway
which is satisfactorily consistent with the experimental results.
According to the hypothesized mechanism reported in Scheme 19 and the
potential energy surfaces displayed in Figure 47, species 1 corresponding to the L-
Ascorbic acid protonated at O2 (protomer AA60_300_cat2) undergoes a ring
opening following an hydride shift from C6 to C5. This process leads to the
formation of ion 2 and is characterized by an energetic barrier of 20.9 kcal mol-1
(ΔG°(TS1)). The species 2 is 13.0 kcal mol-1
more stable than the starting reactant 1
and isomerizes to the ion 3 overcoming a barrier of 72.8 kcal mol-1
(ΔG°(TS2)) with
an energetic gain of 197.0 kcal mol-1
. Ion 3 undergoes a cyclization through the

82
nucleophilic attack of the O2 oxygen to the C5 carbon. This process leads to the
transition state TS3 which is prone to release the first water molecule forming the
ion 4. This ionic species formally corresponds to the ionic intermediate at m/z 159
and its formation from protonated L-AA dehydration is characterized by an
energetic barrier of 59.8 kcal mol-1
.
Scheme 19: Hypothesized decomposition mechanism of L-Ascorbic acid computed at the
B3LYP/6-31 + G(d,p) level of theory.
Ion 4 releases the second water molecule following a proton transfer from C4
to O3H in a process that is characterized by an energetic barrier of 43.5 kcal mol-1
(ΔG°(TS4)). The ion 5 is 15.2 kcal mol-1
more stable than the precursor species 4

83
and corresponds to the second dehydration intermediate at m/z 141. Ion 5
represents a resonant structure of the protonated 5-formyl-2-furoic acid (5bis) and
it can tautomerize into 6 by overcoming an energetic barrier of 64.1 kcal mol-1
(ΔG°(TS5)). The species 6 rearranges forming an open structure (TS6) and the
subsequent nucleophilic attack of the O6 oxygen to the C3 carbon produces ion 7.
An energetic barrier of 41.5 kcal mol-1
(ΔG°(TS6)) separates 6 from 7, but the
rearrangement 6→7 has an energetic gain of 4.0 kcal mol-1
. Finally, the ion 7
easily evolves to the species 8 by releasing a formic acid molecule in a 8.7 kcal
mol-1
exoergonic process characterized by an energetic barrier of 69.5 kcal mol-1
.
The loss of formic acid from the ion at m/z 141 is characterized by a barrier of
90.7 kcal mol-1
.
As a consequence, the hypothesized mechanism of the entire decomposition
reaction results exoergonic by -201.3 kcal mol-1
.
Figure 47: Geometries of the minima localized on the AA60_300_cat2 potential energy surface,
optimized at the B3LYP/6-31 + G(d,p) level of theory.

84
3.3 Discussion
The knowledge of the proton affinity and gas-phase basicity values of a molecule
in the gas phase is considered an ideal tool to detect its intrinsic molecular
properties in the absence of the solvent.
These thermochemical parameters have been experimentally obtained in this
work for L-Ascorbic acid and they are well comparable with the same values
reported for polyfunctional molecules containing a carbonyl group as the basic
site. As recently reviewed by Bouchoux,[88]
the proton affinity of unsaturated
lactones is around 840 kJ mol-1
and the effect of intramolecular hydrogen bonds
may enhance this value up to 40-50 kJ mol-1
.
In this regard, the joint application of the Cook’s kinetic method and quantum
mechanical calculations has allowed us to highlight the structure of gaseous
protonated L-Ascorbic acid, identifying the oxygen atom (O2) of the carbonyl
moiety as the most basic site and the AA_60_300_cat2 conformer as the most
stable species. Indeed, the presence of other protomers under the experimental
conditions has been reasonably excluded on the basis of energetic considerations.
The experimental PA value of 875.0 ± 12 kJ mol-1
results to be in agreement
with the value of 861.6 kJ mol-1
computed at the B3LYP/6-31 + G(d,p) level of
theory. Besides, a ΔpS value of 108.9 ± 2 J mol-1
K-1
and a GB of 842.5 ± 12 kJ
mol-1
at 298 K were also experimentally obtained by using the same approach.
The measurement of these fundamental parameters and the characterization of
protonated AA structure represent the first step towards the elucidation of AA
degradation mechanism to furan compounds in the gas phase.
Similarly to the dehydration of the sugars discussed in Chapter 2, the
protonation of L-Ascorbic acid is a process that activates the decomposition
reaction converting it to furan derivatives. This hypothesis is confirmed by the
presence in the ESI mass spectrum of acidic solution of L-Ascorbic acid of the
protonated ions at m/z 177 together with the ionic intermediates at m/z 159 and
141 arising from the loss of one and two water molecules respectively and a final
product at m/z 95.
Contrary to what was observed in the case of the sugars, protonated L-Ascorbic
acid at m/z 177 is stable and can be detected at sufficiently high intensity,

85
allowing us the characterization of the starting reactant ions by means of CAD
experiments. This evidence can be explained by a higher energetic barrier of the
first dehydration of L-Ascorbic acid compared to that calculated for the first
dehydration of the previously investigated protonated sugars. By analysing the
theoretical data, protonated L-Ascorbic acid loses the first water molecule
following a series of unimolecular rearrangements overcoming an energetic
barrier of 59.8 kcal mol-1
. As a consequence, the water loss occurs through an
open-chain intermediate resulting from an hydride shift and a subsequent
isomerization. On the contrary, the first dehydration of protonated sugars reported
in Chapter 2 is always assisted by the emiacetalic oxygen atom leading to a
carbocationic intermediate in a process that is only 4-8 kcal mol-1
endothermic.
Since protonated L-Ascorbic acid at m/z 177 can survive to the source
conditions, it has been submitted to energy resolved CAD experiments in order to
measure the relative dissociation energies. According to the experimental results,
the first water loss leading to the ionic species at m/z 159 occurs with an energetic
barrier higher than that relating to the second dehydration process forming the ion
at m/z 141 (0.8 eV versus 0.6 eV). This evidence has been confirmed by the
theoretical calculations predicting an energetic barrier of 59.8 kcal mol-1
for the
first water loss and 43.5 kcal mol-1
for the second dehydration reaction. This trend
reflects the relative ionic abundances observed in the ESI mass spectrum where
the ionic species at m/z 159 is detected at very low intensity whereas the
intermediate at m/z 141 shows a higher ion signal.
The ionic intermediate at m/z 141 decomposes by releasing a formic acid
molecule leading to the final product at m/z 95. The highest energetic barrier of
1.2 eV among those experimentally measured is associated to this last
decomposition event, in excellent agreement with the barrier theoretically
predicted.
Theoretical calculations have suggested that the final loss of a formic acid
molecule may occur from the ionic species at m/z 141 following a tautomerization
process and a subsequent rearrangement through an open structure transition state
(TS6). This mechanism is in good agreement with the results of the isotopic
labelling experiments performed on the L-13
C-Ascorbic acid. According to the

86
experimental and theoretical data, the release of a formic acid molecule as a
neutral counterpart involves the 13
C carbon and occurs through a proton shift from
C2 to the labelled carbon. The species at m/z 95 thus obtained results to be 201.3
kcal mol-1
more stable than the starting reactant ion at m/z 177 and shows a
structure strictly related to furfural.
This ion represents the final product of AA decomposition reaction, but it has
already been detected in the gas phase by Eberlin at al.[89]
According to this study,
the ionic species at m/z 95 is the stable product of a carbonylation reaction
between gaseous halocarbonyl cations and furan.

87
4. Glycosylation reaction
Chemical glycosylation is a coupling reaction that involves two sugar substrates
forming a new O-linkage, known as “glycosidic” bond.
In a typical glycosylation one building block, named glycosyl donor, is a
mono- or oligo-saccharide equipped with a suitable leaving group (LG) at the
anomeric position, whereas the other building block, termed glycosyl acceptor, is
a mono- or oligo-saccharide having an unprotected hydroxyl group acting as a
nucleophile. Generally, all other functional groups on both glycosyl donor and
acceptor counterparts are masked with temporary protecting groups (P) in order to
increase the chemoselectivity of the reaction.
Schemes 20 and 21 show the general mechanism of the chemical glycosylation.
Scheme 20: I step: Activation of the glycosyl donor.
The first step consists in the interaction between an activator (or promoter) and
the glycosyl donor resulting in the dissociation of the leaving group and the
formation of a carbocationic intermediate.
The simplest leaving group is the –OH group, naturally found in the
monosaccharides, and requires acid catalysis to be activated in order to promote
the loss of a water molecule from the anomeric position. This specific process is
known as Fischer glycosylation.
More effective leaving groups, such as halides, thioethers or imidates, are
commonly used in the glycosyl donors employed for the synthesis of glycosides.
Moreover, the leaving group needs to be activated by the use of a specific
promoter, as reported in Table 14.
After the formation of the carbocationic intermediate, the glycosyl acceptor can
perform a nucleophilic attack from the top or from the bottom face of the ring

88
resulting in the formation of a new stereogenic centre and therefore a mixture of
two compounds, (1,2 cis) α- and (1,2 trans) β-glycosides (Scheme 21).
Table 14: Typical glycosyl donors and respective activators.
Leaving group Activator (E-Nu)
Hydroxyl -OH H+
Halides -Br; -Cl; -I; -F Silver salts
Thioethers -SPh; -STol N-iodosuccinimide/triflic acid
Imidates
H+
The entire process can be ascribed to a nucleophilic substitution reaction,
following an SN1-like mechanism where the formation of the oxocarbenium ion
intermediate represents the rate-determining step (slow step) and the generation of
the final products corresponds to the fast step of the reaction. Nevertheless,
examples of SN2-like mechanism are also reported in literature.[90-92]
Scheme 21: II step: Nucleophilic attack performed by the glycosyl acceptor.

89
Both α- and β-glycosidic residues are equally found in a variety of natural
molecules according to their biological role and the therapeutic potential as lead
compounds for drug and vaccine discovery. Therefore, the study of carbohydrate-
containing chemicals is considerably challenging due to the low availability of
pure sample from natural sources. As a consequence, the only approach to provide
chirally pure material consists in resorting to chemical or enzymatic synthesis that
allow one to obtain either α- and β-glycosides with well-defined stereochemistry.
This represents the main reason why chemical O-glycosylation is still considered
a wide-open field of study in modern synthetic chemistry.
Over the years, it has become clear that the reactivity of the glycosyl donor is
directly correlated to the nature of the protecting groups. The concept of armed
and disarmed glycosyl donors was theorized by Bertram-Fraser Reid[93]
referring
to the increased reactivity of benzylated (armed) over benzoylated (disarmed)
glycosyl donors. This phenomenon, first observed in 1982,[94]
originates from the
greater electron-withdrawing capability of ester blocking groups over other ether
protecting groups. Later, Bols et al.[95]
have extended this notion to superarmed
glycosyl donor by realising that hydroxylic functional groups of carbohydrates are
less electron-withdrawing toward the anomeric centre when they are in axial
configuration than in equatorial. Hence, glycosyl donor conformers with more
axial function groups are generally more reactive toward the chemical
glycosylation. Figure 48 shows examples of disarmed, armed and superarmed
donors, respectively.
Figure 48: A series of glycosyl donor types. Ac: Acetyl group; Bn: Benzyl group; TBS: tert-
butyldimethyl silyl group.

90
Further achievements in this field concern the possibility to control the
stereochemical outcome of the glycosylation reaction that is strictly correlated to
the nature of the protecting groups, especially that bound at the neighbouring C2-
position.
The employment of a C2-partecipating group, typically equipped with a
carboxylic moiety, predominantly results in the formation of a β-glycosyde
(Scheme 22).
Scheme 22: Neighbouring group participation mechanism (ester protecting group at C2).
As previously reported, the first step of glycosylation allows for the
dissociation of the leaving group and the generation of the carbocationic
intermediate, known as the oxocarbenium ion. In the presence of an acetyl
protecting group bound at C2-position, the oxocarbenium ion can evolve to an

91
apparently more stable acetoxonium ion[96]
that blocks the attack from the bottom
face of the ring predominantly leading to the formation of the β-glycoside.
Alternatively, the absence of a C2-carboxylic participating group, as in the case
of benzylic blocking group (Scheme 23), allows for either attack from the bottom
or top face of the ring, but the formation of an α-glycoside usually predominates
since this product is favoured by the “anomeric effect”.
Scheme 23: Glycosylation mechanism in the case of ether protecting group at C2.
This phenomenon, first observed by Edward,[97]
is crucial for defining the
stereochemistry of processes taking place at the anomeric centre of sugars and
consists in a double stabilizing effect. First of all, the axial orientation of C1–OR
minimizes the repulsive interactions between the lone-pair electrons of the
anomeric substituent (O-1) and those of the ring oxygen (O-5). Secondly, an axial
substituent is stabilized through the hyperconjugation due to the periplanar
orientation existing between the anti-bonding orbital of C-1 and the non-bonding
orbital of O-5. This stabilization effect is absent in the case of β-anomers where

92
the two above-mentioned orbitals placed in different planes are unable to interact
(Figure 49).
Figure 49: The “anomeric effect”, β-anomer versus α-anomer.
Despite the two hypothesized pathways, a complete stereoselectivity control is
difficult to achieve. Although one of the two anomeric products is
thermodynamically favourable, small amounts of the other one are often obtained.
For this reason the structural characterization of the carbocationic intermediate
(oxocarbenium ion or acetoxonium ion) is crucial to confirm the postulated
reaction mechanisms.
As extensively discussed in the Introduction, the short life-time and low
concentration of the reaction intermediates may hinder their isolation and
identification in solution by means of X-ray crystallography, Nuclear Magnetic
Resonance (NMR) and IR spectroscopy techniques. Hence, considering the ionic
nature of the transient carbocationic species under investigation, the “gas-phase”
approach can represent a valid alternative.
The combination of sophisticated gas-phase methods and quantum mechanical
calculations has provided several strategies to study the structures of
carbohydrates in vacuo.
In particular, ion mobility mass spectrometry (IM-MS) and action spectroscopy
are two innovative structure-sensitive gas-phase approaches that can be efficiently

93
used to face the difficulties encountered in glycan characterization. Generally, the
structures of saccharides are harder to investigate than other biomolecular
compounds (peptides and oligonucleotides) owing to their complex regio- and
stereochemistry. The information achievable by using conventional mass
spectrometric methods is often limited to carbohydrate composition and
connectivity. Indeed, most sugars show the same elemental composition and they
cannot be distinguished according to their m/z ratio. As a consequence, isomers
only differing in the orientation of chemical substituents at the stereogenic centres
need to be chemically derivatised prior to be analysed.
Ion mobility spectrometry (IMS), first introduced by Cohen and Karasek[98]
in
1970 with the original name of plasma chromatography, is an analytical technique
able to highlight the gas-phase conformation of ionic species. In particular, IMS
measures the time that ions propelled by a weak electric field need to traverse a
cell through a counter-flowing neutral gas, such as argon, helium or nitrogen. As a
result, compact ions undergoing fewer collisions with the neutral gas cross the cell
faster than the ions having an extended structure.
This method coupled with mass spectrometry (IM-MS) allows one to
distinguish ions on the basis of their mass-to-charge ratio and subsequently to
separate species sharing the same m/z, but different shapes through the
measurement of their drift time.
Recently, the effectiveness of the IM-MS approach has been probed to
successfully separate connectivity and configurational isomers of
carbohydrates,[99]
demonstrating high resolution power and sensitivity to small
structural differences.
Another approach to structurally characterize carbohydrates consists in the
employment of laser spectroscopy.
Gas-phase infrared spectroscopic methods couple tandem mass spectrometry
and IR optical spectroscopy in order to investigate specific vibrational modes of a
mass-to-charge selected ion without the occurrence of interferences due to the
solution environment.[100-102]
In this regard, action spectroscopy is particularly
advantageous because structural details unavailable from more conventional
MS/MS methodologies can be obtained from an IR-spectrum. Simultaneously,

94
biological molecules can be vaporized, ionized and manipulated by using a variety
of effective gas-phase approaches (electrospray ionization-ESI, matrix-assisted
laser desorption ionization-MALDI), as alternatives to the conventional laser
desorption.[103]
The main experimental methods for the investigation of molecular vibration
modes in the gas phase are the messenger technique and the infrared multiple
photon dissociation (IR-MPD) technique, both based on the dissociation of
charged clusters or molecules induced by wavelength-selective absorption of IR
radiation. This phenomenon allows the reconstruction of a “surrogate” IR
spectrum from a series of mass spectra recorded by monitoring the fragmentation
yield as a function of different wavelength radiations emitted from a tunable laser.
The main problem of this strategy is the low energy associated to a single IR
photon, much lower than the threshold dissociation energy commonly reported for
most molecules. Therefore, an IR-photo dissociation spectrum can be recorded
employing two different approaches, by the generation of weakly bound clusters
having bond energies not exceeding a few tens of kJ mol-1
(messenger technique)
or by using a laser source sufficiently powerful to emit multiple photons (from ten
to hundreds) all absorbed by a single ion (IR-MPD technique).
The messenger spectroscopy, introduced in the 1980s by Y. T. Lee and co-
workers,[104]
can be eventually applied to the gas-phase study of biomolecules.
The main limitation of this technique lies in the fact that the supersonic expansion,
needed to achieve ions tagged with a small molecule or rare gas atom, does not
allow for a gently transfer of biological molecules to the gas phase. In fact, the
analytes undergoing this process are typically ionized by electron impact or by a
corona discharge that can damage biomolecules characterized by a fragile
structure. For this reason, IR-MPD technique has predominantly been used to
study the vibrational excitations of biomolecular ions.[100,102]
This method allows for the dissociation of covalent bonds within molecules
that can be routinely detected in a tandem mass spectrometer. However, the
requirement of multiple IR photons to activate the dissociation leads to highly
excited species, increasing the number of populated quantum states. The resulting

95
broadening and shifts in the position of absorption bands can hinder the
interpretation of the vibrational spectra.
Figure 50 displays the IR-MPD spectra of two monosaccharide epimers
derivatised with a C2H4NH2 and a C5H10NH2 linker, respectively.
Despite the structural differences existing between the two molecules, both
spectra share a broad absorption band in the range of 1000-1150 cm-1
and another
low-intensity absorption band around 1490 cm-1
. Hence, the general appearance of
the two spectra is very similar, reflecting the limited resolution achievable by
using IR-MPD methods.[105]
As a result, the two monosaccharide derivatives are
indistinguishable by their IR signatures preventing the acquisition of clear
information about the structural details of the species under study.
Figure 50: IR spectrum of a positively charged β-glucose derivative a). IR spectrum of a positively
charged β-galactose derivate b). Both spectra were recorded in the fingerprint region at room
temperature using the IR-MPD technique (data taken and adapted by Ref. [106]).
An effective strategy to overcome the scarce applicability of the IRMPD
technique consists in reducing the energetic contents of the molecules
implementing a cooling down process. This approach allows one to reduce the
number of freedom degrees and simultaneously the number of conformations the
molecules can assume at room temperature. As a consequence, the spectral
congestion is markedly reduced and the sharp absorption lines obtained promote
the unambiguous assignment of the spectral bands.

96
In this regard, cryogenic multipole ion traps have paved the way to the gas-
phase investigation of molecular ions at sub-Kelvin temperatures.
According to the Gerlich’s studies,[107]
ion temperatures around 6 Kelvin can
be reached by coupling an rf ion trap to the head of a closed-cycle He refrigerator.
The cold trap is usually placed between the two quadrupoles of a tandem mass
spectrometer and the ions stored are cooled down by the pulse of Helium gas.
Various action spectroscopy schemes have been designed combining cold ion
traps with tunable UV/vis and IR lasers.[108]
An alternative approach to study “cold” molecular structures in the gas phase is
represented by the employment of superfluid helium droplets as a sort of nano-
cryostats.[109-112]
According to this method, the ions of interest, embedded inside
nano droplets consisting of 103-10
10 atoms of superfluid helium, are allowed to
achieve an equilibrium temperature of ~0.37 Kelvin that drastically reduces their
internal energy.
Subsequently, the embedded species can be interrogated by an infrared
radiation and the absorption of resonant laser photons leads to the ejection of the
ions from the helium droplets. Monitoring the ejection yield as a function of the
wave-length of the emitted radiation allows one to obtain well-resolved infrared
spectra of ultra-cold molecules.
Such an apparatus has been developed at the Fritz Haber Institute of Berlin by
G. Von Helden et al.[113-115]
and it has been recently used to study the charge-
induced unzipping of proteins and to structurally characterize a series of isomeric
oligosaccharide ions.[116,117]
In both studies the vibrational fingerprint obtained for
these cooled biomolecular ions exhibits well-resolved absorption bands that are
diagnostic for minute structural variations.
In order to exemplify the unequivocal effectiveness of this method, Figure 51
reports the IR spectra of positively charged β-glucose (panel a) and β-galactose
(panel b) derivatives acquired at 0.37 Kelvin by using the helium droplet
approach.
The comparison of these two spectra with those recorded for the same
molecules by using IR-MPD technique (Figure 50) shows that IR spectra with
many well-resolved absorption bands can be obtained only by cooling down the

97
ions at sub-Kelvin temperature. In this case (Figure 51) the two monosaccharides
can unambiguously be distinguished by their distinct absorption patterns in the
spectral range between the wavelengths of 950 cm-1
and 1700 cm-1
. In sum, the
unprecedented resolving power of the cold-ion spectroscopy provides a spectral
fingerprint that is unique for each monosaccharide.
Figure 51: IR spectrum of a positively charged β-glucose derivative a). IR spectrum of a positively
charged β-galactose derivate b). Both spectra were recorded in the fingerprint region at 0.37
Kelvin by using the helium droplet approach (data taken and adapted by Ref. [106]).
These excellent results have also been obtained when glycans only differ in the
stereochemistry at single carbon atoms, highlighting the potential of helium
droplet approach to circumvent the impediments encountered over the years in
saccharide analysis.[117]
Additionally, classic and quantum mechanical
calculations can contribute to assign a precise structural conformation to the
carbohydrates under study through the generation of corresponding theoretical
infrared spectra.
Taking into account the unequivocal advantages of the ion mobility mass
spectrometry and ultra-cold spectroscopy techniques, both methods were applied

98
to structurally characterize the carbocationic intermediate arising along the
chemical glycosylation pathway. Owing to its transient nature the oxocarbenium
ion has never been isolated before and considering the key role played for the
positive outcome of the reaction, the investigation of its structural details
represents an extraordinary challenge.
In particular, the conversion of the oxocarbenium ion into the acetoxonium
form when the C2 is masked with a carbonyl-equipped protecting group is a
crucial step to control the glycosylation stereoselectivity and the final yield of the
entire reaction. For this reason, the experimental confirmation of the
oxocarbenium ion structure may contribute to elucidate reaction mechanisms that
to best of our knowledge are only theoretically hypothesized.

99
4.1 Structural characterization of the oxocarbenium ion
intermediate
A set of four glycosyl donors derivatised with different protecting groups
displayed in Figure 52 were analysed in this work.
Figure 52: Glycosyl donors 1) 4-Methylphenyl 2,3-di-O-acetyl-4,6-O-benzylidene-1-thio-β-D-
glucopyranoside; 2) 4-Methylphenyl 6-O-acetyl-2,3,4-tri-O-benzyl-1-thio-D-glucopyranoside; 3)
2,3,4,6-Tetra-O-benzyl-D-glucopyranose; 4) 2,3,4,6-Tetra-O-methyl-D-glucopyranose.
Carbohydrate 1 is a model of glycosyl donors equipped with a C2-carboxylic
participating group owing to the presence of an acetyl group bound at C2 position.
Conversely, glycoside 2 shows a C2-benzylic non-participating group and an
acetyl blocking group at C6 position. This specific compound was chosen in order
to verify the occurrence of a nucleophilic attack between the carbonylic oxygen of
the acetyl group and the C1 anomeric carbon.
Glycoside 3 is characterized by an ether protecting group bound at C6 position
in place of the acetyl group present in glycoside 2. Finally, glycoside 4 was
employed as a non-aromatic reference standard.
The possibility to effectively generate the carbocationic intermediate of interest
in the gas phase was evaluated by choosing samples equipped with different
leaving groups, the 4-methylphenyl thioether group for glycosides 1 and 2 and the
most common hydroxyl group for glycosides 3 and 4.
Figure 53 shows the full-scan mass spectrum obtained from a solution of
glycoside 1. The ionic population is dominated by two characteristic peaks at m/z
481 and 939, corresponding to the [(1)Na]+ and [(1)2Na]
+ sodium adducts,
respectively. The analysis of their fragmentation patterns has revealed that they
are not the precursor of any other ion, but all efforts aimed to reduce the sodium
concentration in solution have been proved to be useless.

100
Figure 53: nano-ESI mass scan of a 1x10⁻³
M solution of sample 1 in H2O (0.1% HCOOH)/MeOH
1:1 (V/V).
As reported for the monosaccharides discussed in Chapter 2 ion at m/z 459,
corresponding to the protonated glycoside 1, is present at very low intensity. It is
reasonable to suppose that also in this case the energy excess deriving from the
protonation may activate the reaction leading to the ion at m/z 335 that
corresponds to the carbocationic species of interest.
An almost superimposable behaviour has been observed from the analysis of
glycoside 2.
Conversely, the nano-ESI mass spectra of the glycosides 3 and 4 have
highlighted a progressive decrease in the intensity of the corresponding
carbocations, thus proving that the hydroxyl is a worse leaving group than the
thioether one for the gas-phase oxonium ion generation.
After isolating the oxonium ion, its collisional cross section (CCS) was
measured. Table 15 reports the CCS experimentally calculated for each
carbocation derived from the glycosides 1, 2 and 3, respectively. The CCS
measurement of the oxonium ion arising from glycoside 4 has been hindered by
an excessively low intensity under the source conditions.
As expected, the lowest collisional cross section value corresponds to the
oxonium ion obtained from glycoside 1 having the most compact structure. On the
other hand, the carbocationic species arising from glycoside 3 is characterized by

101
the highest CCS among the other samples owing to the steric hindrance of four
benzylic blocking groups.
Table 15: Collisional cross section measurements of the carbocationic species arising from each
glycosidic sample.
Glycoside Oxocarbenium ion CCS (Å)
1
108.9
2
145.76
3
156.55
4
_
Considering the effectiveness of ion mobility instrumentation in successfully
separating connectivity and configurational isomeric carbohydrates, the possibility
to discriminate between the oxocarbenium and the acetoxonium structures has
been probed. Indeed, in the presence of an acetyl protecting group bound at C2-
position, as in the case of glycoside 1, the oxocarbenium ion thus obtained can
evolve to an acetoxonium ion through the nucleophilic attack performed by the
carbonylic oxygen of the acetyl group to the anomeric carbon C1 (Scheme 24).

102
Scheme 24: Representation of the oxocarbenium-acetoxonium ion conversion.
Owing to the minute structural differences existing between these isomeric
ions, it wasn’t possible to distinguish the two conformers on the basis of their
arrival time distributions (ATD). As reported in Figure 54, a single drift peak was
derived after the ions at m/z 335 have traversed the ion mobility cell.
Figure 54: Arrival time distribution of the carbocation at m/z 335 obtained from glycoside 1.
This experimental evidence has also been confirmed by theoretical results that
calculated the same CCS value for both the oxocarbenium and the acetoxonium
structures.
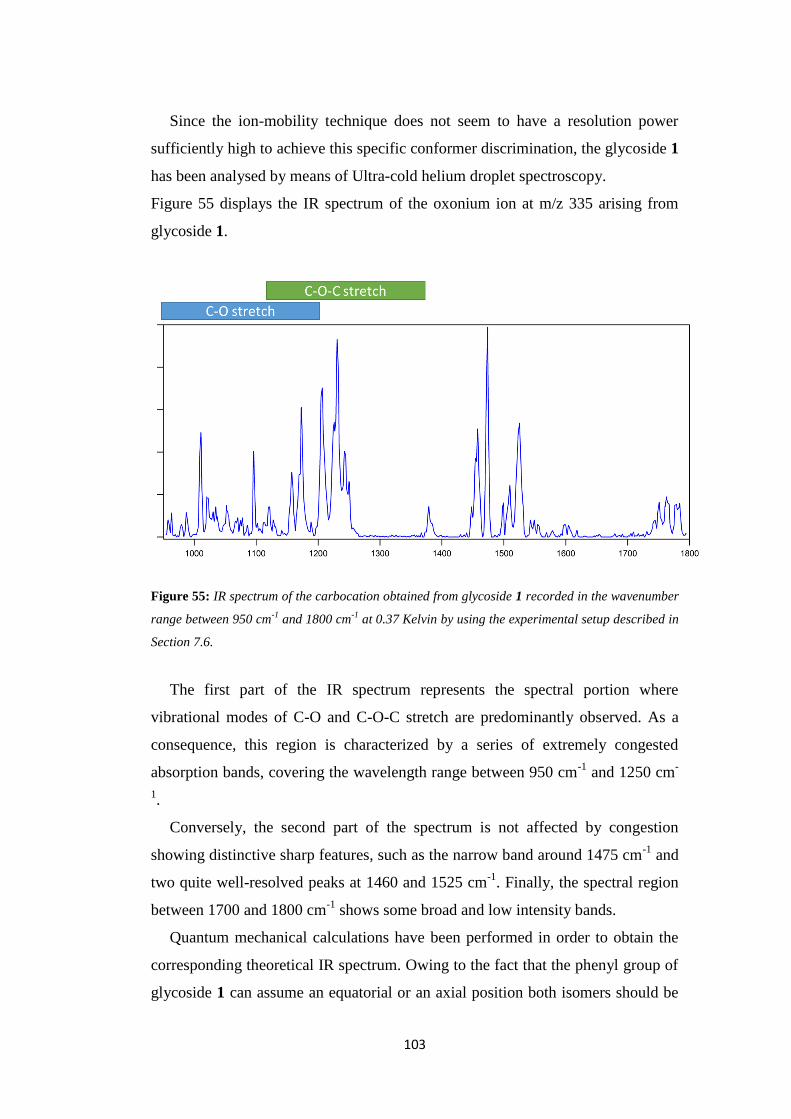
103
Since the ion-mobility technique does not seem to have a resolution power
sufficiently high to achieve this specific conformer discrimination, the glycoside 1
has been analysed by means of Ultra-cold helium droplet spectroscopy.
Figure 55 displays the IR spectrum of the oxonium ion at m/z 335 arising from
glycoside 1.
Figure 55: IR spectrum of the carbocation obtained from glycoside 1 recorded in the wavenumber
range between 950 cm-1
and 1800 cm-1
at 0.37 Kelvin by using the experimental setup described in
Section 7.6.
The first part of the IR spectrum represents the spectral portion where
vibrational modes of C-O and C-O-C stretch are predominantly observed. As a
consequence, this region is characterized by a series of extremely congested
absorption bands, covering the wavelength range between 950 cm-1
and 1250 cm-
1.
Conversely, the second part of the spectrum is not affected by congestion
showing distinctive sharp features, such as the narrow band around 1475 cm-1
and
two quite well-resolved peaks at 1460 and 1525 cm-1
. Finally, the spectral region
between 1700 and 1800 cm-1
shows some broad and low intensity bands.
Quantum mechanical calculations have been performed in order to obtain the
corresponding theoretical IR spectrum. Owing to the fact that the phenyl group of
glycoside 1 can assume an equatorial or an axial position both isomers should be

104
considered in the calculations, but the equatorial isomer was excluded by
calculating the theoretical CCS values. In fact, the theoretical CCS value of 110 Å
calculated for the axial isomer is in good agreement with the experimental CCS
value of 108 Å whereas is not consistent with the theoretical CCS value of 115 Å
obtained for the equatorial isomer.
Figure 56: Relative energy distribution as a function of the distance from C1 [Å] of open-chain
conformers (grey dots), O3-C1 closed conformers (red dots) and O2-C1 closed conformers (blue
dots).
Molecular dynamics approach has been used to find low energy conformers as
possible structure candidates. In particular, the energetic content of the
oxocarbenium structure versus the acetoxonium structure has been calculated.
Concerning the carbocationic species arising from glycoside 1 and having an
additional acetyl protecting group bound at C3 position, it was evaluated the
stability of closed conformers obtained from both the nucleophilic O2-C1 and
O3-C1 attacks.

105
The diagram displayed in Figure 56 reports the relative energy of all
geometries having an energetic content below 30 kcal mol-1
(y-axis) as a function
of the distance from C1 (x-axis).
From the analysis of the geometry distribution it is possible to highlight that
the stability of the conformers strictly depends on the distance from C1. As a
result, when the O2 distance from C1 shifts from 3.5 Å to around 1.6 Å the
energetic content of the system is drastically reduced. Hence, the O2-C1 ring
conformers are generally more stable than the corresponding open-chain
conformers. Conversely, the same effect is not observed for the O3-C1 ring
conformers having a relative energy comparable to that of the open-chain
structures. Therefore, the O2-C1 nucleophilic attack is thermodynamically
favoured compared to the O3-C1 nucleophilic attack.
Theoretical IR spectra have been calculated for the most stable open-chain and
O2-C1 ring conformers (Figure 57) in order to evaluate the match existing
between experimental and theoretical data.
The region between 1400 and 1800 cm-1
of the experimental IR spectrum
shows a series of well-resolved and high intensity features that could be
characteristic of a specific conformation. On the contrary, the area between 1000
and 1400 cm-1
is less diagnostic owing to the extremely congestion of the
absorption bands.
In particular, the absorption band at 1460 cm-1
present in the theoretical
spectrum of the O2-C1 ring conformer 4H5 and the absorption band at 1475 cm-1
present in the theoretical spectrum of the O2-C1 ring conformer E5 are both well-
reproduced by the experimental spectrum. This evidence seems to account for the
existence of a mixed population of conformations predominantly constituted by
closed conformers. Indeed, the simultaneous presence of multiple conformations
is quite common for sugars owing to the flexibility of their structures. Moreover,
the chemical bond O2-C1 of both hypothesized conformers shows a covalent
character. Such a structure has never been predicted and experimentally validate
until now.

106
Considering the promising results obtained by using the Ultra-cold
spectroscopy technique, the same approach has been employed to analyse the
carbocation species arising from glycosides 2, 3 and 4.
A good ion signal has been obtained under the source conditions for the
carbocationic species arising from glycoside 2, confirming the easy departure of
the 4-methylphenyl-thioether leaving group. On the other hand, a high level of
fragmentation has been reported after the oxonium ion isolation and its
accumulation into the ion trap, preventing from recording the corresponding IR
spectrum. This is probably due to the collisions with the buffer gas and the long
trapping time.
Figure 57: Comparison between the experimental IR spectrum obtained from the analysis of the
carbocation at m/z 335 arising from the glycoside 1 (grey) and the theoretical IR spectra (red)
calculated for the most stable open-chain conformer 4E and the two most stable O2-C1 closed
conformers 4H5 and E5. Theoretical spectra were obtained by using the B3LYP functional and
the def2TZVP basis set.

107
As expected from the ion mobility data, all attempts to acquire an IR spectrum
of the oxonium ions arising from glycosides 3 and 4 are failed owing to the
presence of the hydroxyl leaving group. The next step of this study will be the
replacement of the hydroxyl with the 4-methylphenyl-thioether leaving group by
the chemical synthesis of custom-made sugars.

108
5. Ion-molecule reactions
In the framework of the fundamental studies concerning the activation of inert
bonds, unprecedented reactions of ions containing metals like iron and vanadium
have been investigated. Iron and vanadium are two of the most common and
diffuse transition metals in the Earth’s crust. They play a major role in biology as
active centres of some enzymes. In particular, iron represents the metal ion at the
active site of important redox enzymes dealing with cellular respiration and
oxidation/reduction processes in plants and animals. On the other hand, vanadium
is predominantly present in the bromoperoxidase of ocean algae.[118]
Among the low-valent iron species, ferrocene (η5-C5H5)2Fe(II) is the
prototypical metallocene,[119]
a type of organometallic chemical compound
consisting of two cyclopentadienyl rings bound on opposite sides to a central
metal atom (Figure 58).
Figure 58: Schematic representation (on the left) and ball-and-stick model (on the right) of a
metallocene molecule. The purple ball in the middle represents the metal cation.
Owing to the characteristic position of the metal ion, these organometallic
species are also known as sandwich compounds.[120]
The excellent redox
properties of ferrocene have paved the way to the use of this compound in several
application fields. As an example, ferrocene has proved useful in the design of
bionsensors, dye-sensitized solar cells and drugs.[121]
In particular, the oxidized
charged form (η5-C5H5)2Fe
+ obtained from ferrocenium salt exhibits cytotoxic
properties,[122]
showing a promising activity as antitumor agent.

109
On the other hand, vanadium is predominantly employed as steel addictive in
metallurgic industry, whereas vanadium oxides are known to be catalysts of
important non-metallurgical processes, such as the production of sulphuric acid
and the reduction of nitrogen oxides.[123]
Finally, a novel application of vanadium
hydroxide H2V3O8 concerns its use as nanowires in Li-ion batteries.[124]
Considering the significant potential of ferrocene and vanadium hydroxydes,
the intrinsic features of these compounds and the elementary reactions involved in
the described processes have been extensively investigated in the gas phase at
molecular level.
In order to highlight the characteristics of the ligated iron, both (η5-C5H5)2Fe
+
and (η5-C5H5)Fe
+ ions have been the subjects of a number of studies. In particular,
the reactions of (η5-C5H5)Fe
+ with nucleophile ligands containing halogen atoms,
such as substituted pyridines PyX and methyl halides CH3X (X=F, Cl, Br), lead to
the loss of HX molecules giving rise to species that preserve the (C5H4)Fe
kernel.[125]
Generally, the features of the products arising from the reactions of
(η5-C5H5)Fe
+ demonstrate that the coordination of the iron with the carbon ring is
always preserved. This evidence is not influenced by the coordination site of the
added nucleophile. To the best of our knowledge the unique example of iron
extrusion is given by the reaction of ferrocene and ozone leading to hematite
(Fe2O3). This process has been studied by using the so called low-temperature
matrix-isolation/FT-IR technique[126]
consisting in the deposition of the reactant
species onto a cooled CsI window subsequently analysed by infrared irradiation.
On the other hand, examples of C-C bond formation are reported to be
catalysed by iron or bare Fe+ and Fen
+ cations in alkyl halides solution
reactions[127]
or in hydrocarbon reactions in the gas phase.[128]
Passing to vanadium compounds, the ion-molecule reactions (IMR) of several
homonuclear[129]
and heteronuclear[130]
vanadium oxide cations with hydrocarbons
have been studied in order to gain information on reaction paths, cluster size and
ligand effects. In this regard, several studies are available on singly-charged
vanadium anions. For instance, a number of vanadium oxide monoanions have
proved to be reactive with hydrocarbons, water and SO2.[131]
In particular, it has
been demonstrated that the vanadium-oxide kernel of the V4O10- anion can

110
effectively incorporated SO2[131e]
leading to a [V4O10,SO2]- complex showing a
square pyramidal structure (Figure 59), whereas neutral vanadium oxides only
give association intermediates or oxidation and reduction products by the reaction
with SO2.[132]
Figure 59: Scheme of the reaction of V4O10- with SO2 a); Structure of the inclusion complex
[V4O10 SO2]- assigned by means of IRMPD experiments and theoretical calculations b).
Conversely, the reactivity of multiply-charged vanadium cluster ions has not
completely unravelled, still representing a field of study only partially explored.
These species were first detected in a Penning trap and then analysed as oxides by
electrospray-ionization mass spectrometry.[133]
In this regard, positive doubly-
charged species, VO2+
, VOH2+
and VOH22+
, have been reported to be
thermochemically stable and further stabilized by water solvation.[133c]
Additionally, various doubly-charged polyoxovanadate and hydroxide anions
have been produced in the gas phase by electrospray of aqueous solutions of
metavanadate.[134]
a) V4O
10
-
+ SO2 → [V
4O
10 SO
2]
-
[V4O
10 SO
2]
-
b)

111
The known reactions of dianions are proton-transfer and
substitution/elimination (2-3), where the dianion is entirely included in the final
product. In contrast, dications undergo the so-called “bond-forming reactions”
where the simultaneous breakage and formation of chemical bonds give rise to
two singly-charged species and/or a new doubly-charged ion.[135]
(2)
(3)
Proton-transfer and substitution/elimination reactions of dianions have been
described in the gas phase[136]
but no evidence of bond-forming reactions have
been reported for these species.
Mass spectrometric techniques and quantum chemical calculations have
allowed us to study the gas phase reactions of ferrocene and doubly-charged
vanadium (V) anions with dichloromethane and SO2, respectively.
Ferrocene reaction led to the formation of ferrous chloride and protonated
benzenium ion, representing an interesting example of gas-phase iron extrusion
process. On the other hand, singly-charged products that do not contain the
reactant have arisen from the vanadium reactions, highlighting a bond-forming
reaction performed by doubly-charged anions in the gas phase.
Y2-
+ H3O
+ → YH
- + H
2O
-Z-Y
- + CH
3CH
2Br
Br- +
-Z-Y-CH
2CH
3
Br- +
-Z-YH + CH
2=CH
2

112
5.1 Iron promoted C-C bond formation
Millimolar solutions of ferrocene dissolved in a mixture of acetonitrile and water
were injected into a linear ion-trap mass spectrometer and analysed.
The positively-charged ions detected in the gas phase are the molecular cation
(η5-C5H5)2Fe
+ (m/z=186), (η
5-C5H5)Fe
+ (m/z=121) and Fe
+ (m/z=56). All the
reported m/z ratios refer to the most abundant 56
Fe isotope among the four iron
isotopic species. Under these experimental conditions, the ionic adducts [(η5-
C5H5)Fe-CH3CN]+ (m/z=162) and [(η
5-C5H5)Fe-H2O]
+ (m/z=139) are also
observed owing to the use of both acetonitrile and water as solvents.
Each ion characterized by the C5H5 moiety has been mass-selected and reacted
with CH2Cl2 that was separately admitted into the reaction cell of the modified
ion-trap mass spectrometer (for further details see Section 7.3). All the analysed
species are found to be unreactive, apart from (η5-C5H5)Fe
+ that yields an
abundant ion formally corresponding to C6H7+ (m/z 79) and plausibly formed by
the following reaction:
(η5-C5H5)Fe
+ + CH2Cl2 → C6H7
+ + [Fe, 2Cl] (4)
The kinetic profile of the reaction (4) demonstrates that it is fast and efficient,
but the analysis of the reaction is complicated by the concomitant formation of the
[(η5-C5H5)Fe-H2O]
+ adduct due to the presence of background water (5). Hence,
an accurate calibration procedure has been performed to subtract the background
water contribution and prevent the precursor ion loss.
(η5-C5H5)Fe
+ + H2O → [(η
5-C5H5)Fe-H2O]
+ (5)
Except for the formation of the water adduct, the reaction of (η5-C5H5)Fe
+ with
CH2Cl2 gives only one ionic product C6H7+. Figure 60 reports the kinetic plot
relating to the formation of C6H7+ occurring with a rate constant of k=7,1·10
-10
(± 30%) cm3
s-1
molecule-1
and an efficiency k ⁄kcoll=63% (kcoll = collision rate).

113
Figure 60: Kinetic plot and best-fit lines of the reaction of thermal (η5-C5H5)Fe
+ ions with
CH2Cl2. Pressure of CH2Cl2=4,9·10-7
Torr, • (η5-C5H5)Fe
+ (R
2 =0,9996)
▄ C6H7
+ (R
2 =0,9990),
▲ [(η5-C5H5)Fe-H2O]
+(R
2 =0,9991).
The reaction intermediate [(η5-C5H5)Fe-CH2Cl2]
+ at m/z 205 can be detected
only under high-pressure conditions. Accordingly, by ionization of a mixture of
ferrocene and CH2Cl2 in a ZabSpec mass spectrometer, [(η5-C5H5)Fe-CH2Cl2]
+
has been observed and stabilized. Its structural characterization has been achieved
by recording high-energy (8 kV) collisionally activated dissociation (CAD) mass
spectra of the isolated isotopomers [(η5-C5H5)Fe-CH2
35Cl2]
+ at m ⁄z 205 and [(η
5-
C5H5)Fe-CH235
Cl37
Cl]+
at m/z 207 (Figure 61).
The formation of an intense daughter ion at m/z 79 formally corresponding to
C6H7+ points to the intermediacy of the ionic species [(η
5-C5H5)Fe-CH2Cl2]
+ in
the C-C bond formation. On the other hand, the FeCl+ ions (m/z 91 or 91-93)
confirm that the iron transfer to chlorine is mediated by the intermediate [(η5-
C5H5)Fe-CH2Cl2]+. Finally the minor fragments formally corresponding to Fe-
CH2Cl2+ (m/z 140 or 142) account for the iron transfer from (η
5-C5H5)Fe
+ to
CH2Cl2.

114
Figure 61: CAD mass spectrum of [(η5-C5H5)Fe-CH2
35Cl2]
+ ions at m/z 205 with a partial
spectrum of [(η5-C5H5)Fe-CH2
35Cl
37Cl]
+ at m/z 207 in the inset.
Other abundant ionic fragments containing the C5H5Fe kernel are the ions at
m/z 156 and 121, corresponding to (η5-C5H5)Fe-Cl
+ and (η
5-C5H5)Fe
+ or its
dissociation product at m/z 167, corresponding to [(C2H3)Fe-CH2Cl2]+. Minor
peaks at m/z 38, 49, 56, 65, 94 are related to consecutive dissociations of the
C5H5Fe, C5H5 and CH2Cl2 moieties.
None structural information about the neutral products of the reaction can be
obtained by the conventional mass spectrometric approach used. Hence, the
possible reactions leading to the C6H7+ ionic species are reported below (6-9).
(η5-C5H5)Fe
+ + CH2Cl2 → C6H7
+ + FeCl2 (6)
(η5-C5H5)Fe
+ + CH2Cl2 → C6H7
+ + FeCl + Cl (7)
(η5-C5H5)Fe
+ + CH2Cl2 → C6H7
+ + Fe + Cl2 (8)
(η5-C5H5)Fe
+ + CH2Cl2 → C6H7
+ + Fe + 2 Cl (9)

115
For this purpose, NfR (Neutral Fragment Reionization) experiments have been
carried out in order to investigate the nature of the neutral species arising from the
carbon-carbon coupling reaction. This technique allows one to analyse the neutral
counterparts of the charged fragments produced from the dissociation of the [(η5-
C5H5)Fe-CH2Cl2]+ intermediate.
[137] In particular, all neutral species are separated
from the charged fragments and then reionized. The NfR spectra of isolated
isotopomers [(η5-C5H5)Fe-CH2
35Cl2]
+ and [(η
5-C5H5)Fe-CH2
35Cl
37Cl]
+ are
reported in Figure 62.
Figure 62: NfR spectrum of [(η5-C5H5)Fe-CH2
35Cl2]
+ with the partial NfR spectrum of [(η
5-
C5H5)Fe-CH235
Cl37
Cl]+
in the inset.
Both spectra show intense peaks at m/z 126 and 128 that are absent in the CAD
spectra of the ionic intermediate and correspond to the Fe35
Cl2+
and Fe35
Cl37
Cl+,
respectively. These ionic species can only be obtained by reionization of FeCl2,
the neutral counterpart of the C6H7+ ions obtained from the dissociation of the
[(η5-C5H5)Fe-CH2Cl2]
+ intermediate. According to this result, reaction (6) can be
assigned to the process leading to the C6H7+
ions. The other ions observed in the
NfR spectrum, such as the ionic species at m/z 91, do not account for the reaction

116
(7) leading to FeCl and Cl as neutral counterparts. Indeed, the ionic fragment
FeCl+ may arise from the dissociation of FeCl2 as a consequence of the re-
ionization process. Similarly, reactions (8) and (9) can be excluded because no
signal at m/z 70 corresponding to Cl2+ were observed in the NfR spectrum.
Finally, low-resolved peaks in the m/z range between 35 and 50 were obtained
from consecutive dissociations of fragments at higher m/z values.
In order to structurally characterize the ionic product at m/z 79 arising from
reaction (6), a series of CAD experiments have been performed.
The ions at m/z 79 may correspond to the bicyclic form of protonated fulvene
[(η5-C5H5)-CH2]
+ or to protonated benzene C6H7
+. These two isomeric ions have
been distinguished by comparing the CAD mass spectrum of the ion at m/z 79
obtained from the reaction (6) with the CAD mass spectrum of standard
benzenium ion. Protonated benzene has been obtained under chemical ionization
(CI) conditions by using CH4 as a protonating agent.[138]
Figure 63: CAD mass spectra obtained from standard protonated benzene a); product ions at m/z
79 arisen from the reaction (6) b); fragment ions at m/z 79 arisen from the dissociation of the ionic
intermediate [(η5-C5H5)Fe-CH2
35Cl2]
+ c).

117
The CAD mass spectra of the ions at m/z 79 are reported in Figure 63 (panel a
and b) and result to be superimposable, highlighting that the product ion at m/z 79
arising from the reaction (6) effectively corresponds to protonated benzene.
An additional confirmation of this hypothesis can be obtained by recording the
MS3 CAD spectrum of the fragmet ion at m/z 79 arising from the dissociation of
the ionic intermediate [(η5-C5H5)Fe-CH2
35Cl2]
+ at m/z 205 (Figure 63; panel c).
Also in this case, the CAD mass spectrum is superimposable to that obtained from
protonated standard benzene.
According to the experimental results, theoretical calculations have identified a
potential energy surface for the reaction (6). The energy profile and the
geometries of the corresponding minima and saddle points are illustrated in Figure
64 and 65, respectively.
Figure 64: Structures of the minima and saddle points reported on the [(η5-C5H5)Fe-CH2Cl2]
+
potential energy surface. Bond length in angstroms and angles in degrees. Energy values relating
to 1 (ΔH°, ΔG°) in kcal mol-1
.

118
As displayed in Figure 65, the barrierless interaction of the iron atom of the
[(η5-C5H5)Fe]
+ precursor ion with a chlorine atom of CH2Cl2 leads to the first
adduct 1 [(η5-C5H5)Fe Cl-CH2Cl]
+. The positive charge of the ionic species 1 is
predominantly placed on the CH2Cl2 moiety (0.72 e-) showing a long Fe-Cl bond.
The 1→2 isomerization occurs through the transition state TS1 by overcoming a
barrier of 25.8 (ΔG°=27.3) kcal mol-1
. This process allows the activation of the
first C-Cl bond and the insertion of the iron atom.
Figure 65: Schematic energy diagram of the [(η5-C5H5)Fe-CH2Cl2]
+ potential energy surface.
ΔH°(ΔG°) values in kcal mol-1
. The inset shows the likely rearrangement of protonated fulvene to
the benzenium ion.
In the [(η5-C5H5)Fe-(Cl) CH2Cl]
+ ion 2 structure, the chlorine atom interacting
with Fe is no longer bound to the CH2Cl group, whereas a new Fe-C bond is
formed leading to a three-coordinated iron atom. The ionic species 2 is separated
from the adduct 3 by a barrier of only 6.1 (ΔG°=7.3) kcal mol-1
(TS2). The ion 3
still displays a weak residual interaction between the iron atom and the η5-C5H5,
but in this step the CH2 moiety is carried from the iron to the carbon ring and the
new C-C bond is formed. As a result, the Fe-CH2 interaction is replaced by an
elongated Fe-Cl bond. Hence, the ion 3 dissociates into FeCl2 and [(η5-

119
C5H5)CH2]+, the bicyclic form of protonated fulvene. Owing to the exothermicity
of the whole process the [(η5-C5H5)-CH2]
+ ion
can isomerize to the more stable
benzenium ion.[139]

120
5.2 SO2 promoted V-O activation
Doubly-charged vanadium (V) hydroxoanions H2V2O72-
and HNaV4O122-
were
obtained in the gas phase by ESI ionization of aqueous NaVO3 solutions and their
reactivity towards sulphur dioxide was investigated by ion-molecule reactions
(IMR).
To this end, H2V2O72-
and HNaV4O122-
have been mass-selected and reacted
with SO2, separately flown into the reaction cell of the modified ion-trap mass
spectrometer.
Two reaction channels have been found for the H2V2O72-
anion; the major
channel (10) leads to singly-charged H2VO4- and VO3SO2
- product ions whereas
the minor channel (11) produces HV2O6- and HOSO2
-.
H2V2O72-
+ SO2 → H2VO4- + VO3SO2
- (10)
H2V2O72-
+ SO2 → HV2O6- + HOSO2
- (11)
Figure 66: Kinetic plot and best fit lines of the reactions of thermal H2V2O72-
ions with SO2, P SO2
= 2.7 • 10-7
Torr, R2 (H2V2O7
2-) = 0.9992, R
2 (H2VO4
- + VO3SO2
-) = 0.9992, R
2 (HOSO2
- +
HV2O6-) = 0.9630.

121
The kinetic profile of the H2V2O72-
ions is characterized by an overall rate
constant k(ov)= 1.21 • 10-9
(± 30%) cm3 s
-1 molecule
-1 at 298 K, an efficiency
k(ov)/kcoll (kcoll = collision rate) = 93 %, k10/k11 = 42/1 (Figure 66).
It is remarkable to observe that the reactant ion formally reported as H2V2O72-
may include the isomeric [V2O6-H2O]2-
complex and the pirovanadate form,
abundantly present in the sprayed solution. The ligated ion is the product of a gas-
phase reaction between V2O62-
and H2O.
In order to effectively prove the formation of the ionic [V2O6-H2O]2-
adduct,
ions at m/z 99 corresponding to V2O62-
have been isolated and reacted with H2O,
as shown in Figure 67.
Figure 67: ITMS spectrum of the reaction of isolated V2O62-
ions (m/z 99) with H2O. P H2O = 4.8
• 10-6
Torr. Isobaric VO3- ions are also present. Observed products: [V2O6-H2O]
2- at m/z 108 and
[VO3-H2O]- at m/z 117. The small signal * corresponds to V2O6
- (m/z 198) from the electron
detachment of V2O62-
.
Although the isobaric VO3-
ions have been mass-selected together with the
V2O62-
dianion, the obtained ionic product at m/z 108 confirms the formation of
the [V2O6-H2O]2-
complex.

122
On the other hand, when SO2 is admitted into the cell of the ion trap a H2O/SO2
mixture is formed and the abundance of the [V2O6-H2O]2-
adduct at m/z 108
significantly decreases due to the fastest reaction of V2O62-
with SO2 leading to
the [V2O6-SO2]2-
ionic complex (Figure 68). Hence, in the presence of sulphur
dioxide, the ion [V2O6-SO2]2-
at m/z 131 represents the reaction sink.
Figure 68: ITMS spectrum of the reaction of isolated V2O62-
ions (m/z 99) with H2O/SO2 ≈ 45/1. P
H2O = 4.3 • 10-6 Torr. The small ion * at m/z 262 comes from the reaction of V2O6- (m/z 198) with
SO2. Magnified kinetic profile at short reaction times is reported in the inset. The V2O62-
, [V2O6-
SO2]2-
and [VO3-H2O]- ions are out of scale, V2O6
- is not plotted.
Conversely, the [VO3-H2O]- ionic adduct at m/z 117 produced from the VO3
-
ionic species is still abundant in the spectrum owing to the large amount of water
(Figure 68).
The minor product at m/z 163 corresponds to the doubly-charged ion [V2O6-
(SO2)2]2-
obtained from the consecutive reaction of [V2O6-SO2]2-
with SO2
observed at longer reaction times. This peak has been assigned by the
characteristic sulphur isotopic pattern and by the CAD dissociation into [V2O6-

123
SO2]2-
(m/z 131) arising from the loss of the SO2 neutral counterpart, as displayed
in Figure 69 (panel a and b).
Low signals are detected at m/z 199 (HV2O6-) and m/z 81 (HOSO2
-).
Therefore, a signature of the reaction of [V2O6-H2O]2-
with SO2 is given by the
kinetic profile of the V2O62-
decay showing, at the shortest times, low abundances
of [V2O6-H2O]2-
together with the reaction products HV2O6- and HOSO2
-.
Figure 69: Isotopic patterns and CAD spectra of the isobaric peaks at m/z 163; a) Expected
isotopic pattern for the doubly-charged [V2O6-(SO2)2]2-
ion (m/z 163 ); b) Experimental isotopic
pattern of the ion at m/z 163 formed by reaction of V2O62-
with SO2. In the inset the CAD spectrum
showing the [V2O6-SO2]2-
fragment (m/z 131); c) Expected isotopic pattern for the singly-charged
VO3SO2- ion (m/z 163); d) Experimental isotopic pattern of the ion at m/z 163 formed by the
reaction of H2V2O72-
with SO2. In the inset the CAD spectrum showing the VO3- fragment (m/z 99).
Considering the above results, the k10/k11 value previously measured cannot be
considered indicative of the rate constant of the reaction (11).
Concerning the HNaV4O122-
species, this alkali-containing anion reacts with
SO2 leading to the NaV4O11- and HOSO2
- ionic products (12).
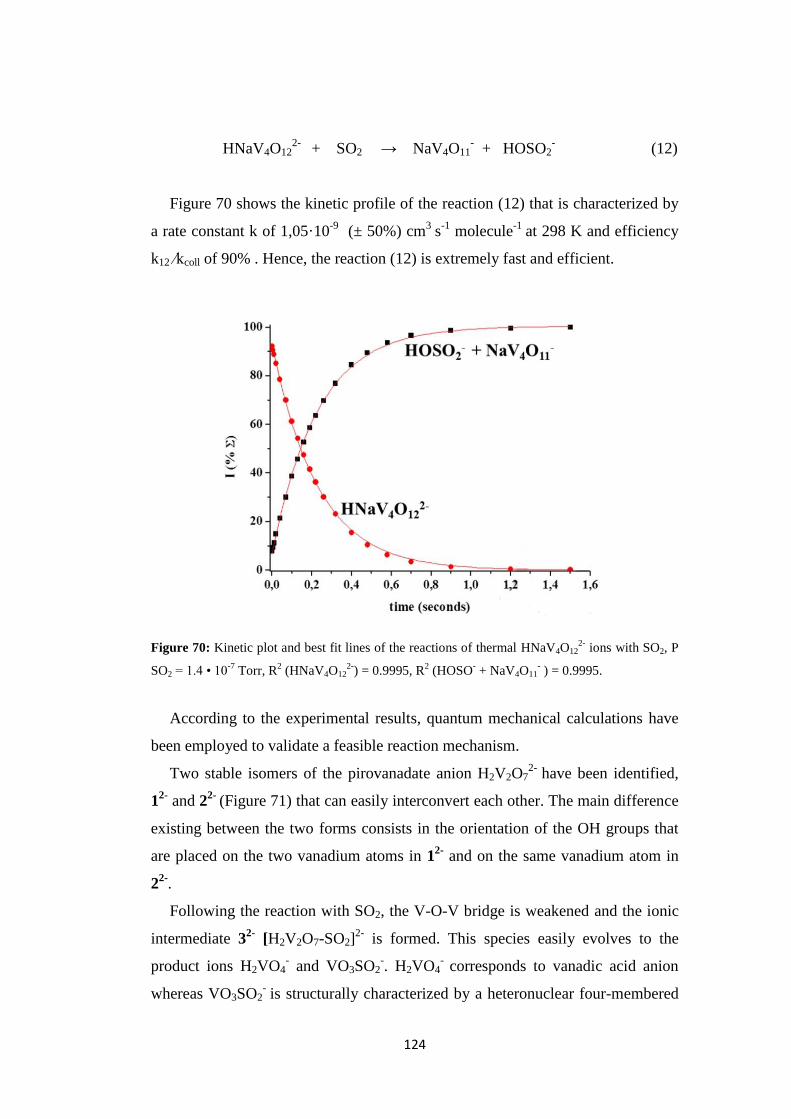
124
HNaV4O122-
+ SO2 → NaV4O11- + HOSO2
- (12)
Figure 70 shows the kinetic profile of the reaction (12) that is characterized by
a rate constant k of 1,05·10-9
(± 50%) cm3
s-1
molecule-1
at 298 K and efficiency
k12 ⁄kcoll of 90% . Hence, the reaction (12) is extremely fast and efficient.
Figure 70: Kinetic plot and best fit lines of the reactions of thermal HNaV4O122-
ions with SO2, P
SO2 = 1.4 • 10-7
Torr, R2 (HNaV4O12
2-) = 0.9995, R
2 (HOSO
- + NaV4O11
- ) = 0.9995.
According to the experimental results, quantum mechanical calculations have
been employed to validate a feasible reaction mechanism.
Two stable isomers of the pirovanadate anion H2V2O72-
have been identified,
12-
and 22-
(Figure 71) that can easily interconvert each other. The main difference
existing between the two forms consists in the orientation of the OH groups that
are placed on the two vanadium atoms in 12-
and on the same vanadium atom in
22-
.
Following the reaction with SO2, the V-O-V bridge is weakened and the ionic
intermediate 32-
[H2V2O7-SO2]2-
is formed. This species easily evolves to the
product ions H2VO4- and VO3SO2
-. H2VO4
- corresponds to vanadic acid anion
whereas VO3SO2- is structurally characterized by a heteronuclear four-membered
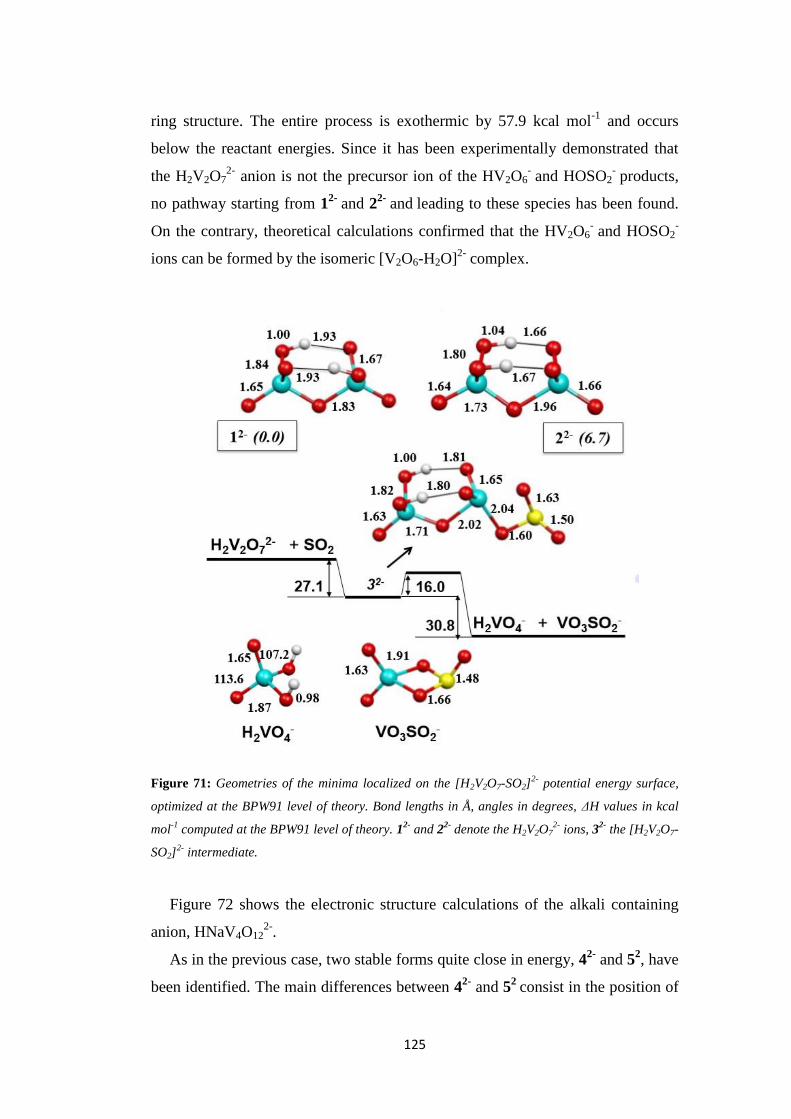
125
ring structure. The entire process is exothermic by 57.9 kcal mol-1
and occurs
below the reactant energies. Since it has been experimentally demonstrated that
the H2V2O72-
anion is not the precursor ion of the HV2O6- and HOSO2
- products,
no pathway starting from 12-
and 22-
and leading to these species has been found.
On the contrary, theoretical calculations confirmed that the HV2O6- and HOSO2
-
ions can be formed by the isomeric [V2O6-H2O]2-
complex.
Figure 71: Geometries of the minima localized on the [H2V2O7-SO2]2-
potential energy surface,
optimized at the BPW91 level of theory. Bond lengths in Å, angles in degrees, ΔH values in kcal
mol-1
computed at the BPW91 level of theory. 12-
and 22-
denote the H2V2O72-
ions, 32-
the [H2V2O7-
SO2]2-
intermediate.
Figure 72 shows the electronic structure calculations of the alkali containing
anion, HNaV4O122-
.
As in the previous case, two stable forms quite close in energy, 42-
and 52, have
been identified. The main differences between 42-
and 52
consist in the position of

126
the OH group and the interaction of the alkali metal. Moreover, 42-
is
characterized by two four-membered rings, whereas 52-
shows only one ring.
Since the HO group and the metal atom may occupy different positions, other
isomers have been highlighted; however, they have not been taken into account
because less stable and/or characterized by high barriers for the reaction 12.
Both the HNaV4O122-
ions have a structure consistent with the experimentally
observed CAD fragmentation into HV2O6- and NaV2O6
- and form two stable
complexes with sulphur dioxide, (62-
and 72-
) with a comparable energy gain of
ca. 15 kcal mol-1
(Figure 73).
Figure 72: Geometries of the minima localized on the [HNaV4O12-SO2]2-
potential energy surface,
optimized at the BPW91 level of theory. Bond lengths in Å, ΔH values in kcal mol-1
computed at
the BPW91 level of theory. 42-
and 52-
denote the HNaV4O122-
ions, 62-
and 72-
denote the
[HNaV4O12SO2]2-
intermediates.

127
After the formation of 62-
and 72-
, the reactions proceed along two pathways
that differ for the intermediate dissociation barriers and for the structure of the
products obtained (82-
and 92-
- Figure 73).
Figure 73: Schematic energy diagram of the reaction of HNaV4O122-
with SO2. Geometries of the
HOSO2-
and NaV4O11- product ions (8
- and 9
-) optimized at the BPW91 level of theory. Bond
lengths in Å, ΔH values in kcal mol-1
computed at the BPW91 level of theory.
The reaction of 42-
leading to the most stable NaV4O112-
ion 82-
is more
exothermic than that obtained from 52-
(ΔH° = -24.2 versus -11.0 kcal mol-1
); on
the contrary, the reaction of 52-
easily occurs below the reactant energy according
to the high efficiency of the process. As a consequence, it is not possible to
experimentally discriminate the two routes, but they are both feasible since the
most exothermic reaction of 42-
requires only 6 kcal mol-1
of vibrational energy
excess. However, a crucial role is played by the back dissociation in the reaction
of 42-
that significantly depletes the intermediate 62-
.

128
5.3 Discussion
Experimental results above reported have highlighted fast and efficient gas phase
chemical reactions.
Thermal (η5-C5H5)Fe
+ ions have been found to undergo an unprecedented
reaction with CH2Cl2 giving rise to FeCl2 and C6H7+ as exclusive products. On the
other hand, thermal doubly-charged vanadium hydroxoanions easily react with
sulphur dioxide, behaving as effective VO3- and OH
- donors to SO2.
In the first reaction a key role is played by the iron atom that promotes the C-C
coupling reaction, whereas in the second system sulphur dioxide effectively
activates the V-O bonds.
Experiments performed by means of a modified ion-trap mass spectrometer
allowed us to measure the kinetic constants of the investigated reactions
demonstrating that all the occurring processes are fast and effective. Conversely,
the employment of a ZabSpec mass spectrometer has been useful to characterize
the ionic (C6H7+) and neutral product (FeCl2) and the [(η
5-C5H5)Fe-CH2Cl2]
+ ionic
intermediate of the (η5-C5H5)Fe
+ reaction with CH2Cl2. Only by using this specific
mass spectrometer it is possible to perform NfR experiments assessing the
intrinsic features of neutral species and creating the high-pressure conditions that
favour the formation of ligated [(η5-C5H5)Fe-L]
+ ions. It is well-known that (η
5-
C5H5)Fe+ ion can rapidly react with various inorganic and organic nucleophiles
(L), whereas the (η5-C5H5)2Fe
+ ionic species was reported to be unreactive.
[140] In
particular, the reactions of (η5-C5H5)Fe
+ with L invariably lead to the ligated [(η
5-
C5H5)Fe-L]+ ions showing that the nucleophile is coordinated with the metal
rather than the carbon ring of the reactant; this hypothesis is in agreement to the
widely suggested mechanism. In the present study, the [(η5-C5H5)Fe-CH2Cl2]
+
ionic complex easily evolves to the reaction products and it is detected only under
certain conditions. Conversely, the ligated ions [(η5-C5H5)Fe-CH3CN]
+ and [(η
5-
C5H5)Fe-H2O]+, always observed under the experimental conditions, have been
revealed not to be the ionic intermediate of any reaction. In particular, the
structural characterization of the [(η5-C5H5)Fe-CH2Cl2]
+ ionic intermediate
demonstrated its crucial role in the formation of the final products.
129
The data obtained from the NfR experiments have confirmed that the neutral
counterpart of the reaction corresponds to FeCl2 (Figure 62). This result allowed
us to validate the reaction (6) as the most favourable process leading to the C6H7+
product ion. The other channels from (7) to (9) have been excluded on the basis of
the experimental results and on thermochemical considerations. Reaction (6) is
the only exothermic process (ΔH=60 kcal mol-1
), whereas reaction (7), (8) and (9)
are all endothermic (46.7, 65.6 and 107.7 kcal mol-1
), respectively.
Finally, the structure of the ionic product C6H7+ corresponding to protonated
benzene has been confirmed by both CAD mass spectra and quantum mechanical
calculations predicting a thermodynamically-favoured isomerization of the
bicyclic form of protonated fulvene [(η5-C5H5)-CH2]
+ to the more stable
benzenium ion.
In particular, quantum mechanical calculations depicted a mechanism
satisfactorily in line with the experimental evidence. According to the theoretical
results reported in Figure 65, a stepwise sequence is required for the formation of
the C-C bond and the rearrangement to FeCl2. Although this process is believed to
be entropically demanding, it occurs below the reactants energy leading to the
benzenium ion. The entire reaction has proved to be fast and exoergonic (ΔG°=-
59.8 kcal mol-1
). The calculated exothermicity, ΔH°=-60.5 kcal mol-1
, has resulted
to be in good agreement with the experimentally derived value, ΔH°=-61.8 kcal
mol-1
.[141]
As a consequence, the experimental and theoretical evidence accounts
for the occurrence of an iron-mediated C-C bond formation. The identity of the
ligand strictly influences the nature of the bonding and the multiplicity of L-Fe+
cationic adducts. For instance, (C6H6)Fe+ shows three unpaired electrons,
(C5H5N)Fe+ is ζ bound and has five unpaired electrons, whereas (η
5-C5H5)Fe
+ has
four unpaired electrons in its ground state.[142,143]
Hence, (η5-C5H5)Fe
+ can be
alternatively considered a covalently bound (η5-C5H5)-Fe(I)
+ ion or a complex
obtained from the electron transfer from Fe(I)+
to (η5-C5H5) and back donation to
the 4s, 4p, or 3d orbitals of Fe(II)2+
.[142]
Consequently, iron results to be three-
coordinated without change of multiplicity as a result of the Lewis acid properties
relating to this iron-containing ion and the spd hybridization (Figure 74).

130
Figure 74: Spin density plot a) and doubly occupied frontier molecular orbital (MO) of the
intermediate 2 b).
The interaction with the nucleophile in ion 1 is predominantly electrostatic
whereas in ion 2 the three-coordinated iron represents the carrier of the CH2
moiety from the halomethane to the (η5-C5H5) group. Both ions are more stable
than the reactant species and their presence within the ionic population has been
confirmed by the high-intensity fragment at m/z 156 (or 158) reported in Figure
61 and corresponding to the loss of the CH2Cl radical.
The (η5-C5H5)Fe
+ species is not reactive towards CH4 demonstrating that the
observed reaction effectively depends on the presence of the chlorine atom.
Interestingly, [Pt(bipy-H)]+ and other cyclometalated transition-metal complexes
react with CH2Cl2 giving PtCl2 loss.[144]
Passing to the doubly-charged vanadium hydroxoanions, H2V2O72-
and
HNaV4O122-
react with SO2 leading to singly-charged products that do not contain
the reactant. These processes represent a new example of bond-forming reactions
performed by doubly-charged anions in the gas phase.
Also in this case mass spectrometry and quantum mechanical calculations have
been combined to obtain a consistent reaction mechanism.
In particular, the experimental and theoretical results above reported demonstrate
that the breakage of V-O bonds and the formation of new V-O and S-O bonds are
the crucial steps of the bond-forming reactions involving the considered piro- and
polyvanadate dianions. These processes occur through the action of SO2 that

131
effectively favours the breakage of the stable V2O7 kernel of H2V2O72-
and the
terminal V-OH bond of HNaV4O122-
. As a consequence, H2V2O72-
acts as an
effective VO3- donor forming VO3SO2
-, whereas HNaV4O12
2- behaves as an
effective HO- donor leading to the bisulfite ion HOSO2-, respectively.
The structural differences existing between the two reactant ions account for
their different reactivity. For instance, the interaction of SO2 with the oxygen
atom is addressed by the HO groups of H2V2O72-
involved in hydrogen bonds.
Conversely, the interaction of HNaV4O122-
with SO2 is promoted by the HO group
and the alkali metal of the dianion that stabilize the V4O11 cage.
Considering that the dissociation of H2V2O72-
into VO3- shows a barrier of 36.6
kcal mol-1
, the formation of the product ion VO3SO2- is a notable process. To the
best of our knowledge, the VO3SO2- anion has never been detected before and it
has been observed for the first time in these experiments; Interestingly, its
calculated structure displayed in Figure 71 resembles that of the neutral VO3SO2,
the main product arising from the reaction of neutral vanadium oxide clusters with
sulphur dioxide.[132a]
The CAD spectrum of VO3SO2- does not show the SO3
-
fragment or fragments related to SO3 loss (Figure 69, panel d), which exclude the
occurrence of oxidation processes as also reported for neutral VO3SO2
species.[132a]
A charge separation process is involved in the formation of singly-charged
species from doubly-charged ions, causing the release of a large amount of kinetic
energy from Coulomb explosion. This event leads to mass discrimination effects
that however do not influence the results. Although the EA (electron affinity) of
H2V2O7- is calculated to be only 0.05 eV (EA of HNaV4O12
- = 1.26 eV), the
charge separation process does not occur by electron transfer to SO2 ((EA) = 1.10
eV),[145]
as one might suppose. The electron transfer is not even observed within
the intermediate [H2V2O7-SO2]2-
, where the negative charge is predominantly
placed on the H2V2O7 moiety (net charge = 1.70 e). It has been reported[146]
that
the factors influencing the stability of solvent-free dianions toward the electron
detachment and the fragmentation into singly-charged ions also govern the
probability of electron transfer from these species. The existence of a repulsive
Coulomb barrier associated with the charge separation process may indeed

132
prevent exothermic fragmentation or charge transfer processes.[146]
Other factors,
consisting in the spatial separation and delocalization of the excess charge, can
increase the stability of medium- and large- size dianions; indeed the negative
charges of H2V2O72-
and HNaV4O122-
are distributed over all the oxygen atoms, as
emerged from the charge analysis of this two ionic species. Accordingly, the
investigated dianions undergo charge separation exclusively as a result of the
chemical reaction with sulphur dioxide, whereas they are found to be stable
towards the fragmentation, electron detachment and electron transfer. Besides, the
permanent dipole moment of sulphur dioxide plays a crucial role in promoting the
ion-neutral bonding. This is due to the ion-dipole attractive forces that, operating
also at long distances, reduce the probability of electron transfer.[135d, g]

133
6. Conclusions
In this thesis the uncertain reaction mechanisms of important industrial, food and
synthetic processes were investigated by means of gas-phase studies.
To this end, the effectiveness of mass spectrometric techniques was probed and
the experimental results were compared with the data obtained from quantum
mechanical calculations. The major advantage of this approach has consisted in
the possibility to obtain an environment in which solvent and counter-ion effects
were completely avoided allowing the study of the intramolecular processes
occurring in a gaseous medium. As a consequence, information on the intrinsic
molecular properties of the ionic species involved in the reactions under
investigation was achieved.
On the basis of the results presented in this work a mechanistic picture of D-
hexose (glucose and fructose) and D-pentose (xylose, arabinose and ribose) acid-
catalysed dehydration was outlined.
In particular, the ionic gaseous precursors of the considered reactions were
identified by means of CAD experiments that were performed with electrospray
ionization triple quadrupole (ESI/TQ) and ion trap (ESI/IT) mass spectrometry.
The same techniques were also employed to structurally characterize the ionic
intermediates and products of the decomposition reactions.
Dehydration energetic barriers were measured by means of energy resolved
(ER) CAD experiments and additional mechanistic evidence was obtained by
using model molecules and isotopic labelling experiments.
The D-glucose dehydration picture arising from the experimental observations
resulted to be compatible with the theoretical mechanism proposed in literature
for the C1-OH protonation.[38]
According to this pathway, a key role was shown to
be played by the group bound at the C3 position. In fact, an increased selectivity
toward the formation of protonated 5-HMF was observed when an electron-
withdrawing group was bound at the C3 carbon of D-glucose.
Furthermore, the first dehydration intermediate obtained from protonated D-
glucose was identified as a possible precursor of protonated levulinic acid through
an alternative formation route other than the generally accepted pathway
involving the double hydration of 5-HMF. In this regard, further studies are in
134
progress in our laboratories to investigate the mechanism of this interesting LA
formation pathway.
Subsequently, a possible D-fructose dehydration route was hypothesized on the
basis of the experimental results and following the theoretical unimolecular
mechanisms reported in literature.[44,48]
According to the experimental and
theoretical evidence protonated D-glucose and D-fructose do not follow
superimposable dehydration pathways, but the dehydration of D-fructose is
always slightly favoured respect to that of D-glucose. Anyway, the decomposition
of protonated D-fructose showed a scarce selectivity towards the formation of
protonated 5-HMF.
In order to promote the use of gas-phase studies for planning strategies that
increase the reaction selectivity, a possible base-assisted decomposition process
was proposed for the conversion of D-fructose to 5-HMF and 2-FA. Theoretical
calculations are in progress in order to elucidate the structures of the starting
reactant ion and those of the intermediates and to validate a feasible reaction
mechanism.
The previously reported experimental study[60]
on protonated D-xylose was
extended to the gas-phase dehydration of D-ribose and D-arabinose. According to
the experimental and theoretical results a new mechanistic hypothesis on the
pentose sugar dehydration was proposed. These routes follow a common reaction
pathway leading to protonated 2-furaldehyde as final product. Interestingly, mass
spectrometric experiments demonstrated that in the gas phase the dehydration
reaction of D-pentoses involves protonation on the OH group bound at C1
position, conversely to the previously reported theoretical evidence.[38]
The approach combining mass spectrometry and quantum mechanical
calculations was also employed to investigate the gas-phase decomposition of L-
Ascorbic acid. To this end, the “extended” Cook’s kinetic method allowed us to
determine the unknown proton affinity and gas-phase basicity of L-Ascorbic acid
(AA) and to investigate the structure of gaseous protonated AA. Subsequently, the
decomposition reaction of Vitamin C was studied and a mechanistic pathway was
predicted. According to the hypothesized reaction mechanism the protonated L-
Ascorbic acid decomposes following two consecutive dehydrations and the loss of

135
a formic acid molecule as the last reaction event. A final product characterized by
a structure strictly related to furfural was identified.
Considering the increasing importance of mass spectrometric techniques in the
investigation of structural features of charged molecules, two novel structure-
sensitive gas-phase methods were proved to be effective for the structural
elucidation of the never-characterized carbocationic intermediate along the
glycosylation pathway. Ion Mobility mass spectrometry was used to obtain
absolute values of collisional cross section, whereas the Ultracold spectroscopy
allowed us to access the minute structural details of the transient intermediate
under investigation. This result represents the first experimental evidence in order
to confirm the glycosylation mechanism that has been supposed by theoretical
studies.
Finally, the reactivity of two model systems, the iron-containing cation (η5-
C5H5)2Fe+ and doubly-charged hydroxoanions H2V2O7
2- and HNaV4O12
2- was
probed respectively towards CH2Cl2 and SO2 by means of ion-molecule reactions.
These experiments were performed by using a modified Ion trap that allowed us
to measure the kinetic rate constants of the two processes. As a result, both
reactions resulted to be fast and efficient.
In the first case, the mechanism of the concerted iron extrusion, carbon-
chlorine bond activation and carbon-carbon formation showed the crucial role of
iron. In this regard, NfR (neutral fragments reionization) experiments have been
carried out allowing the analysis of the species associated with charged fragments
detected in the CAD spectrum of the reaction intermediate.
In the second system, the obtained results highlighted the role of sulphur
dioxide in promoting unprecedented bond-forming reactions that produce singly-
charged products by breaking the VxOy bone or a terminal V-O bond.

136
7. Experimental methods
7.1 Electrospray versus chemical ionization
Mass spectrometers equipped with electrospray ionization (ESI) sources were
predominantly employed in this work.
Since it was introduced in the late 1980s by John B. Fenn, electrospray
ionization technique has become a major tool for producing stable ions from polar
and low-volatility compounds, such as macromolecules. Owing to the capability
to form ionic species in the gas-phase environment without any fragmentation, it
is considered a “soft” ionization method.
The possibility to extract directly from the solution intact ions characterized by
a reduced content of energy is essential to obtain precursor reactants that are
representative of the species in solution. Only in this way it is achieved a
connection between the gas phase and the condensed phase. Also considering the
nature of the molecules analysed in this thesis (carbohydrates and organic
compounds) the choice of this ionization method seemed to be inevitable, but
additional information on the reaction mechanisms under study can be obtained
by using chemical ionization (CI) technique.
Figure 75: Schematic representation of an ESI-source.

137
The main differences between the two ionization processes are the following.
In the electrospray ionization the analyte dissolved in a polar solvent is sprayed
into a capillary where high voltage is applied with respect to a counter electrode,
known as skimmer (Figure 75).
Conversely, in the chemical ionization technique the pure analyte is introduced
into a low pressure ionization chamber where it interacts with a gaseous reactant
previously ionized by electron impact (Figure 76).
Figure 76: Schematic representation of a CI-source.
In both cases, the ionization process usually results in the formation of
protonated ions (MH+) with the only difference that by using alternative reactant
gases under chemical ionization conditions (Scheme 25), different amounts of
fragmentation can be observed from the same quasi-molecular ion. Hence,
chemical ionization is usually more energetic if compared to electrospray
ionization and this is because the amount of energy transferred to a sample
molecule on protonation depends on both the proton affinity of the sample and the
acidity of the reactant ion.
When the sample molecule is characterized by a single basic group the excess
energy after the protonation event is dissipated through the fragmentation. On the
contrary, when the molecule shows several basic groups, the energetic surplus
allows one to have access to higher proton affinity basic sites, leading to a mixture
of isomeric protonated ions. This second occurrence was exploited in this work to

138
prove the existence of different reaction channels that starting from the same
reactant ion can lead to an isobaric population of several isomeric protonated
products. In this way it was confirmed that the gas-phase dehydration of
protonated sugars (D-glucose and D-fructose) yields not only 5-
hydroxymethylfuraldehyde (5-HMF) protonated at the most basic site, but also a
series of isomeric products.
Scheme 25: Protonating agents from different neutral gaseous reactants. The exothermicity of the
protonation reaction increases moving from water to hydrogen.
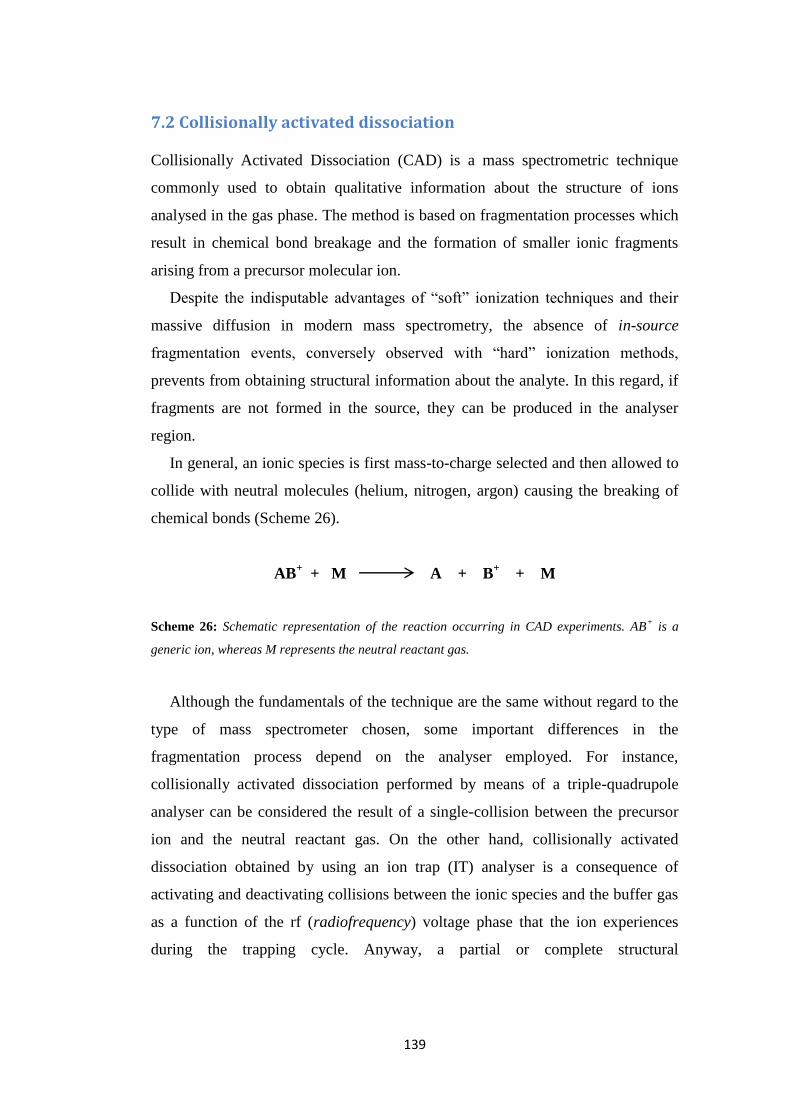
139
7.2 Collisionally activated dissociation
Collisionally Activated Dissociation (CAD) is a mass spectrometric technique
commonly used to obtain qualitative information about the structure of ions
analysed in the gas phase. The method is based on fragmentation processes which
result in chemical bond breakage and the formation of smaller ionic fragments
arising from a precursor molecular ion.
Despite the indisputable advantages of “soft” ionization techniques and their
massive diffusion in modern mass spectrometry, the absence of in-source
fragmentation events, conversely observed with “hard” ionization methods,
prevents from obtaining structural information about the analyte. In this regard, if
fragments are not formed in the source, they can be produced in the analyser
region.
In general, an ionic species is first mass-to-charge selected and then allowed to
collide with neutral molecules (helium, nitrogen, argon) causing the breaking of
chemical bonds (Scheme 26).
AB+ + M A + B
+ + M
Scheme 26: Schematic representation of the reaction occurring in CAD experiments. AB+ is a
generic ion, whereas M represents the neutral reactant gas.
Although the fundamentals of the technique are the same without regard to the
type of mass spectrometer chosen, some important differences in the
fragmentation process depend on the analyser employed. For instance,
collisionally activated dissociation performed by means of a triple-quadrupole
analyser can be considered the result of a single-collision between the precursor
ion and the neutral reactant gas. On the other hand, collisionally activated
dissociation obtained by using an ion trap (IT) analyser is a consequence of
activating and deactivating collisions between the ionic species and the buffer gas
as a function of the rf (radiofrequency) voltage phase that the ion experiences
during the trapping cycle. Anyway, a partial or complete structural

140
characterization of the molecular ions can be achieved by performing CAD
experiments.
In the present thesis CAD-mass spectrometry was employed to structurally
characterize the reactant ions, intermediates and final products arising from the D-
hexose, D-pentose and L-Ascorbic acid decomposition reactions.
For this purpose, a comparison between the CAD mass spectrum of the final
product obtained from the process under examination and the CAD mass
spectrum of the postulated product (standard compound) was useful to confirm or
reject a specific reaction mechanism hypothesized by theoretical calculations.
7.2.1 Energy resolved mass spectrometry
Over the years, CAD experiments have also been exploited for quantitative
purposes by measuring the minimum energy necessary for the dissociation of gas-
phase ions, known as critical energy (CE). In this regard, the disappearance of the
molecular ion of interest and appearance of a specific fragment ion is monitored
as a function of the energy required to excite the precursor ion.
Figure 77: Schematic representation of a triple-quadrupole mass spectrometer.
This technique, named energy-resolved mass spectrometry (ERMS), has been
successfully applied not only for the determination of dissociation critical energies
of water clusters,[147]
metal-containing ions[148,149]
and proton-bond dimers,[150]
but
also for isomer discrimination[151]
and investigation of gas-phase acidities.[152]

141
The instrument of choice for the measurement of critical energies by energy-
resolved collisional activation experiments is the triple-quadrupole mass
spectrometer.
As shown in Figure 77, precursor ions produced by an appropriate ionization
source (ESI, ect.) are mass-to-charge selected by the first quadrupole (Q1) acting
as an ion filter and then accelerated through the collision cell by applying a
constant or variable potential between the entrance and the exit of the second
quadrupole (q2). Subsequently, the kinetic translational energy acquired by the
ions during the acceleration is converted into internal energy as a consequence of
the collision occurring between the ions and a target neutral gas (argon or
nitrogen) previously introduced into the collision cell. Hence, the final event of
this process is the breakage of chemical bonds and the formation of ionic
fragments that are collected and analysed by the third quadrupole (Q3).
The present instrumentation is considered a suitable tool for the estimation of
the critical energy because it allows to control the kinetic energy of the ion beam
and may operate under single-collision conditions. This is a specific feature of
mass spectrometers equipped with analysers that separate and select ions “in
space”. Conversely, “in time” analysers, such as the ion trap (IT), operate in a
dynamic mode submitting ions to continuous acceleration and deceleration events
during the activation period. Thus, they are not able to recreate a single-collision
activation environment that is essential to obtain ions having an uniform
translational energy distribution.
As a result of each energy-resolved collisional activation experiment, a
diagram reporting collision cross section (CCS) versus the centre-of-mass energy
(ECM) is obtained (Figure 78). This graphic is constructed by measuring the
fragmentation of the precursor ion as a function of the progressive increase of its
translational energy, obtained by scanning the potential applied to the collision
cell (q2) from low to high values.
As shown in Figure 78, the centre-of-mass energy represents a measure of the
collision energy (x-axis) and it is calculated from the potential applied to the
quadrupole collision cell and the masses of the colliding species (precursor ions
and neutral gas molecules).

142
Figure 78: Typical diagram obtained by elaborating the energy-resolved collisional activation
experiment data.
In this way, the comparison between different precursor masses is possible. On
the other hand, the collision cross section (y-axis) is a parameter that depends on
the relative intensity of a specific product ion, corrected for the number of density
of the neutral gas into the collision cell and the effective gas cell length.
The onset of fragmentation obtained by linear extrapolation of the slope of the
breakdown curve to the baseline provides a relative measure of the energy needed
to break a specific chemical bond and hence the activation energy of that
fragmentation channel.
This method was applied in our studies to measure the threshold energies
associated to the dehydration reactions occurring in the gas phase for protonated
D-hexoses and D-pentoses. In order to obtain absolute fragmentation threshold
energy values, it is necessary to know exactly the ion-beam translational energy
and this goal can be achieved only by using home-built guided ion beam
instrument. On the other hand, our commercial triple quadrupole was used to
measure threshold energies as relative values. In particular, a comparison based on
these relative critical energies was carried out between the D-glucose and D-
fructose and among the three pentoses, D-xylose, D-ribose and D-arabinose.
Then, the same approach was employed to study the decomposition process of
protonated L-Ascorbic acid.

143
The knowledge of the dissociation energy barriers relating to the dehydration
reactions studied in this work represents a fundamental result in order to validate
the mechanism predicted by theoretical calculations.
7.2.2 Tandem MSn mass spectrometry
Tandem mass spectrometry, also known as MSn, is an experimental technique that
involves multiple steps of ion selection and subsequent fragmentation. Some mass
spectrometers allow one to isolate a fragment ion arising from the first
isolation/fragmentation cycle of the parent species and submit it in turn to CAD
experiments. Supposing to repeat this process in sequence it is possible to follow
step-by-step a specific fragmentation channel, progressively acquiring structural
information about the precursor ion.
Figure 79: Schematic representation of a quadrupole ion trap mass analyser.
In this contest, triple quadrupole are only able to perform a single
isolation/fragmentation event and this is due to the fact that the present analyser
spatially distinguishes ions. For this reason, a number of separation elements
physically separated and distinct would be required to approach tandem
experiments more than the MS/MS level. Thus, contrary to the energy-resolved

144
collisional activation experiments that need to be performed by using “in space”
analysers, the preferred method to carry out a tandem MS experiment is the use of
mass spectrometers equipped with analysers that temporally separate ions, such as
a quadrupole ion trap.
An ion trap is a device that can accumulate ions for an extended period of time
by applying an electric and/or magnetic fields (Figure 79).
Owing to its extraordinary capability to act as an ion store, quadrupole ion trap
has paved the way to modern application of mass spectrometry such as the
infrared multiphoton dissociation (IRMPD) technique.[153]
By performing mass spectrometry in time, the separation is accomplished with
ions trapped in the same place and the multiple separation steps occur over time.
Hence, only by using trapping instruments it is possible to have access to multiple
levels of analysis which are referred to MSn.
In this work tandem mass spectrometry was employed to follow step-by-step
the dehydration reactions under investigation.
Starting from a specific reactant ion the identity of the dehydration final
products was proved in respect of the considered fragmentation channel. This
approach was useful to verify the existence of a selective and effective D-fructose
base-assisted decomposition mechanism.

145
7.3 Ion-trap kinetic experiments
Chemical kinetics represent the investigation of rates of chemical processes,
including the study of different experimental conditions that may influence the
speed of a reaction. As a result, information about the reaction mechanism and the
structure of transition states can be gained allowing the construction of theoretical
models describing the single elementary steps of the considered process.
The experimental measurement of reaction rate constants (k) is usually
achieved by monitoring the concentration change of reactants and products over
the time. For instance, the concentration of a reactant can be measured by using
spectrophotometric techniques, but such an approach is suitable only for those
analytes having chemical groups that absorb light. Moreover, reactants and
products often share structural features causing band overlapping problems that
are responsible for the scarce selectivity of this method.
When reactions occur between a ionic reactant and a neutral gaseous species
taking at least several seconds, the rate of the process can be measured by means
of mass spectrometric techniques.
Kinetic studies of ion-molecule reactions have originally been performed by
using ion cyclotron resonance mass spectrometers (FT-ICR).
This instrumentation is characterized by a mass analyser that distinguish ions
on the basis of their cyclotron frequency in a fixed magnetic field.[154]
In
particular, the ions are stored in a Penning trap by the combination of a
homogeneous axial magnetic field and an inhomogeneous quadrupole electric
field. Subsequently the ionic species are isolated by using the so called “arbitrary
waveform” procedure and transferred to the cell containing the neutral reactant.
Here the ionic intensities of the isolated reactant ion and products are monitored
as a function of the time in order to obtain a diagram where the disappearance of
the reactant ion is directly related to the appearance of the products as shown in
Figure 80. Owing to the excess of neutral reagent compared to the reactant ion the
rate constant can be measured under pseudo-first order conditions, as verified by
the logarithmic plot of the reactant ion concentration versus the time. According
to the kinetic diagram, the reactant ion intensities fit the equation c=c0e-kobst where
c is the ion intensity at time t and kobs represents the pseudo-unimolecular decay

146
rate constant. On the other hand, the product intensities fit the equation
c=(kf/kobs)c0(1-e-kobst) where kf is the pseudo-unimolecular growth rate constant of
a given product. As a result, the bimolecular rate constants k (cm3s
-1molecule
-1)
can be obtained by kobs (or kf) and the neutral reactant density.
Figure 80: Kinetic diagram and best-fit lines of a model reaction obtained by plotting the ionic
intensities of the reactant ion and products (y-axis) versus the time (x-axis). The measurements
were performed by using an FT-ICR mass spectrometer. ■ Reactant ion; ● Product 1; ▼ Product
2; Product 3.
In this thesis the kinetic measurements of the ion-molecule reactions described
in Chapter 5 were performed by using an Ion trap mass spectrometer (IT-MS) that
is considered a device for the storage of charged particles, as well as the FT-ICR.
To this end, the mass spectrometer was partially modified to allow the
introduction of a reagent gas into the vacuum chamber. Hence, the rear plate of
the instrument was replaced by a custom-made plate with a 6.25 mm hole
equipped with a peek tube of 0.75 mm internal diameter (i.d.) (Figure 81). The
peek tube enters the vacuum region and contains two deactivated fused-silica
capillaries of 0.25 mm i.d., through which the neutral gases are separately
introduced. The capillaries are positioned coaxially to the rear hole of the trap.
The pressure of the buffer gas (helium) was measured by a Pirani APGL gauge

147
(Edwards), connected to a Teflon tube (4 mm i.d.) that passes through the hole of
the rear plate. The tube is just in contact with the metal plate of the trap, close to
the helium entrance.
Figure 81: Back side of the modified LTQ XL linear quadrupole ion-trap mass spectrometer
(Thermo Fischer Scientific).
The pressure of the neutral gases flowed into the trap is kept constant by a
Granville–Phillips leak valve and measured by a Granville–Phillips Series 370
Stabil Ion Vacuum Gauge (accuracy ±4% of reading). Owing to the position of the
Pirani gauge, the effective pressure of the neutral gases can be estimated by
calibrating the pressure readings through the known rate constant ion–molecule
reactions performed by FT-ICR, guided ion beam (GIB), and SIFT mass
spectrometers. The reactions of Pt+ (13) and FeO
+ (14) with CH4 reported below
were used as the reference reactions[155]
and the readings are further corrected for
individual response factors of the neutral reactants.[156]
Pt+ + CH4 PtCH2
+ + CH4 (13)
FeO+ + CH4 Fe
+ + CH3OH (14)
148
In the kinetic experiments performed by employing the above described
apparatus, the reactions occur in a helium buffer gas that typically ensures
pressures of the order of mTorr.[157]
This feature allows us to obtain rate constant
measurements at high pressure conditions that are in good agreement with the
same rate constants measured at the low FT-ICR pressures.
Another important difference between the two approaches consists in the
collision conditions. The rate constants are measured under multiple-collision
conditions by using the modified ion trap compared to the single-collision
condition obtained whit the FT-ICR. Such a difference could be responsible for a
greater collisional stabilization at the high pressure of ITMS. As a result, the
reaction is initiated by the same reactant ions regardless of the method employed,
but possible intermediates formed with excess energy are not effectively cooled in
ICR, whereas the opposite is true in ITMS.
Finally, the loss of some reactant ion can be caused by the water present in the
modified apparatus. Therefore, if the reactant ion reacts with the background
water an accurate calibration procedure is necessary to subtract this contribution.
149
7.4 Neutralization-reionization mass spectrometry
In conventional mass spectrometric techniques only charged molecules are
detected. For this reason, the neutral products formed from an ion-molecule
reaction typically represent the “blind” side of the reaction. However, the role of
this neutral counterpart is fundamental because in most cases represents the key
reactive species along the reaction pathway.
In 1966 Lavertu et al.[158]
discovered that fast ionic beams can undergo charge
exchange process by colliding with a neutral target gas and forming beams of
neutral molecules. This experimental evidence has paved the way to the study of
neutral species by mass spectrometry.
To this end, the technique of neutralization-reionization mass spectrometry
(NR-MS) has become a powerful tool to generate and identify neutral elusive
species.[159]
In particular, the potential of the method was probed by the studies of
McLafferty[160]
and others[161]
on polyatomic organic intermediates.
In this thesis the nature of the neutral counterpart arising from the carbon
coupling reaction of (η5-C5H5)Fe
+ with CH2Cl2 (Chapter 5) was assessed
performing NfR (neutral fragments reionization) experiments that can be
considered the direct descendant of NR-mass spectrometry. A schematic
representation of this technique is depicted in Figure 82.
According to this approach, the precursor ion of interest is generated in the
instrument source by choosing the appropriate ion preparation methods. The ionic
beam thus obtained is accelerated by applying a potential difference ranging
between 4 and 8 keV. After passing the first electric sector the ionic beam reaches
the magnetic sector where ions are mass-to-charge selected. The isolated ions
enter a first cell where undergo dissociation induced by the collision with a target
gas (such as Xe, Hg, NH3, NO, or organic neutralization agents). As a
consequence, the ions undergo a charge-exchange reaction leading to a mixed
beam of ionic fragments and their neutral counterparts. The neutral and ionic
molecules exit the collision cell and they are separated by charging an electrode
that deflects all ionic species from the mixture. The beam obtained is constituted
only by neutral molecules having the translational energy of their precursor ions.
At this stage, the neutral species enter a second cell where they are reionized

150
through a charge exchange process upon collision with an appropriate neutral gas,
such as oxygen. The reionized species are then analysed by using an additional
sector or can be subjected to further structural analysis.
As a whole, the entire process occurs in two collision cells placed along the
optical path, as a result of two in-time and in-space separated events. If, in the
mass spectrum obtained upon reionization of the neutral species, a signal
corresponding to a neutral counterpart is observed, this immediately demonstrates
that the neutral fragment formed upon CAD in the first collision cell remains
intact along the path to the second collision cell where it is reionized.

151
Figure 82: Schematic representation of the reaction events typically involved in a NfR experiments
performed by using a Zab Spec-oa-TOF mass spectrometer.

152
7.5 Ion-mobility mass spectrometry
Ion mobility mass spectrometry is a gas-phase analytical technique used to
separate ionized molecules sharing the same mass-to-charge ratio, but different in
size and shape.
The experimental apparatus employed in this work is shown in Figure 83 and it
was specifically developed and commercialized by Waters Coorporation to couple
the main components of a mass spectrometer with a mobility cell. This setup takes
advantage of ion generation and manipulation performed by using mass
spectrometric methods and the possibility to separate different ionic conformers
by using the ion mobility cell.
Figure 83: Scheme of the Synapt G-2S HDMS by Waters Coorporation.
According to this approach, the ion beam is gently produced from an analyte
solution using a nano-ESI source and collimated through a series of ion guides
after covering a trajectory that resembles a flattened Z-shape. In particular, the n-
ESI represents an evolution of conventional electrospray ionization useful to
reduce the analyte amount needed for the analysis. In this technique, the sample
solution is pumped into a Pt/Pd coated borosilicate needle with a small opening at
the tip. As a result, smaller droplets with a higher charge density can be formed

153
allowing for an earlier droplet disintegration and a larger portion of the analyte
molecules available for the MS measurements.
After passing the stepwave ion guide, the ions are selected by a quadrupole ion
filter according to their m/z. This represents the first step of separation before the
ions reach the ion mobility cell where they can be distinguished on the basis of
their shape and size.
The ion mobility cell is mainly constituted of a stainless steel chamber filled
with a counter-flowing buffer gas, such as argon, helium or nitrogen. When a
small voltage difference is applied between the entrance and exit of the chamber,
the ions are propelled through the IM cell and collide with the neutral gas
molecules along the path. As a consequence, ionic species characterized by
compact structures undergo fewer collisions with the buffer gas and traverse the
cell faster than ions showing a more extended conformation (Figure 84). Hence,
the separation of molecules with the same m/z and different shape is achieved.
Figure 84: Schematic representation of an IM separation. The diagram on the right reports the
measurement of the different times the same m/z ions need to traverse the cell as a function of their
shapes.
From the measurement of the time the ions need to cross the cell (drift time), a
collision cross section (CCS) value can be experimentally derived. CCS
represents a molecular property strictly related to the shape of the ions reflecting
the number of collisions between the ions and the buffer gas.
In this specific setup, the travelling wave IM (TW-IMS) cell commercially
designed for this instrument was replaced by a drift tube IM (DT-IMS) cell to

154
obtain CCS values completely independent of instrument parameters and suitable
to be stored in databases.
In the TW-IMS cell an inhomogeneous electric field is applied to the cell and
the ions are propelled through the cell by a traveling voltage wave, allowing a
good ion mobility separation even for short drift cells. However, the main
disadvantage lies in the fact that the CCS cannot be obtained as an absolute value,
but it is only estimated by calibrating the instrument using samples with known
CCS, increasing the propagation of the error associated to the measurement.
Additionally, the nitrogen typically used in standard Synapt instrument as drift gas
cannot be easily changed. Nitrogen is usually employed to provide a better result
in ion separation, but most theoretically CCS values are calculated for helium as
drift gas hindering a direct comparison between the experimental and theoretical
data.
On the contrary, in the DT-IMS the ions traverse the mobility cell under the
influence of a homogeneous electric field (Figure 85). According to this setup, the
voltage difference between the entrance and exit of the mobility cell drops linearly
along the drift tube. Hence, the CCS of an ion is directly obtained by measuring
the drift time as a function of the applied voltage.
Figure 85: Schematic representation of the voltages applied at the IMS cell. As reported by the
green line, the final voltage gradient linear decreases along the drift cell.

155
7.6 Superfluid helium nano-droplet infrared spectroscopy
Helium droplet spectroscopy is an experimental technique taking advantage of the
sub-kelvin temperature cooling process combining a helium droplet source with
mass spectrometry and infrared action spectroscopy. The present apparatus has
been custom-made assembled at the Fritz Haber Institute of Berlin by modifying a
Q-Tof Ultima (Water Corporation) as shown in Figure 86.
Figure 86: Schematic representation of the experimental apparatus. Ions are brought into the gas-
phase, mass-to-charge selected and accumulated into the ion trap. Helium droplets can pick up the
ions that are subsequently interrogated by the free-electron laser.
The generated ions are brought into the gas phase by using a nano electrospray
ionization source (Z-spray). A Pd/Pt coated capillary is loaded with the sample
and charged droplets are formed by applying a voltage of around 1 kV to the
capillary tip. After the complete solvent evaporation, the ions cover a Z-shaped
trajectory towards the skimmer and pass into the vacuum region. Here, the ionic
stream is collimated by a series of ion guides driving the ions through two
different pressure stages (from 14 mbar to 1.7 mbar).
Ionic species are then mass-to-charge selected by a quadrupole mass filter to
reach an hexapole collision cell. This device, originally installed in the
156
commercial Q-Tof instrument, was also kept in the present apparatus with the
only function to increase the ion transmission to a reflectron time-of-flight
analyser that allows for the ion signal monitoring. When the source conditions and
potentials are optimized, the ions can be deflected by 90° through a bender and
accumulated into a linear hexapole ion trap filled with helium buffer gas. The
doping region is the chamber where the ion trap is located and where the
improvement in the vacuum level is fundamental to suppress the unfavourable
formation of ion-water clusters inside the trap. For this reason the ion trap was
placed inside a stainless steel chamber increasing the vacuum level to pressures of
~10-8
mbar.
In order to achieve longitudinal confinement, the endcap electrodes at the
entrance and exit of the trap are kept at a small voltage over the DC offset.
The incoming ions have a well-defined energy of ~34 eV and during the
accumulation time the excess of kinetic energy is removed by the collisions with
the helium. This process thermalizes their internal energy to the temperature of
the buffer gas atoms. Furthermore, the ionic species can be cooled down to about
80 K because the trap is placed inside a copper housing refrigerated by a flow of
liquid nitrogen. After several seconds, the space-charge limit (106 ions cm
-3)
inside the trap is achieved and the buffer gas is removed. Typical values of the
accumulation can vary from ~3 s up to ~10 s, depending on the m/z ratio of the
ions and the efficiency of transmission.
The helium clusters are generated by the expansion of highly purified helium
gas from high pressure and low temperature into vacuum.
Compared to all other substances, helium is known to have the lowest boiling
point (4.2 K for 4He at atmospheric pressure)
[162] as a consequence of the weak
Van der Walls interactions existing between the atoms. The remarkable absence
of a triple point justifies the failed attempt to produce 4He solid and highlights the
extraordinary property of remaining liquid at absolute zero temperature and
ambient pressure. In particular, at the temperature of 2.17 Kelvin the isotope 4He
undergoes a unique transition phase, the so called λ transition, from the liquid
state named Helium I to the superfluid state known as Helium II.[163,164]
On the

157
contrary, 3He shows a superfluid behaviour only at much lower temperature (T=
2.6 mK).[165]
Superfluid state is characterized by a series of properties,[166]
such as the
absence of viscosity, an infinite thermal conductivity and the inability to absorb
light from the deep infrared to the far ultraviolet making the helium a suitable
cryogenic matrix for spectroscopic studies.[167]
Besides, these features allow the
superfluid helium to flow without frictions, circulating over the obstruction and
through the pores of containers that hold it.
In this work, superfluid helium nanodroplets are obtained from a source
consisting of a pulsed Even-Lavie valve cooled to temperature of a few kelvin by
a closed-cycle helium cryostat and operating at a repetition rate of 5-20 Hz. The
flux of helium droplets is controlled by the diameter of the orifice employed for
the expansion process, the stagnation pressure (65-68 bars), the opening time (~19
μs) and the temperature of the pulsed nozzle. In particular the nozzle temperature
can be changed in the range of 15-25 K, deeply influencing the size of the droplets
(from ~106 to ~10
4 helium atoms) and consequently the yield of the so called
pick-up process.[168]
When the valve is accurately aligned, the pulsed beam traverses the ion trap
and the collision occurring between a superfluid helium droplet and a ionic
species can cause the entrapment of the ion inside the nano-droplet.
This phenomenon is known as pick-up process and it can be approximately
described according to the physical model of the inelastic collision, in which the
internal energy (Eint) of the guest particle (dopant) and the collision kinetic energy
are transferred to the droplet. As a consequence, the total energy associated to the
pick-up is obtained from the Equation 3 where m and v are the masses and the
velocities of the dopant and the helium droplet (D), respectively.
(3)
Epick-up
= 1
2
mdopant
·mD
mdopant
+mD
(vdopant
-vD)2
Eint
+

158
Since the velocity (20-60 m s-1
) and the mass of the dopant particle are both
extremely lower compared to the velocity (400-500 m s-1
) and the mass of the
droplet, Equation 3 can be simplified as follows
(4)
After the occurrence of the pick-up, the Epick-up is dissipated into the helium
medium through the release of helium atoms from the droplet surface in a process
called evaporative cooling. The number of helium atoms released during this
thermalization phenomenon can be estimated to be around 1600 per 1 eV of the
pick-up energy. As a consequence, the starting size of the droplets decreases
reaching an equilibrium temperature that allow to cool down the captured ion to
~0.37 K.
Owing to the high kinetic energy (150-300 eV) associated to the helium
droplets, resulting from their large mass and high velocity, only the ions
embedded inside the nano-droplets can overcome the trapping potentials
achieving the detection region where they are interrogated by an IR radiation.
IR photons are generated in the mid-IR wavelength regime, covering the entire
fingerprint region (from 950 cm-1
to 1800 cm-1
) by a FEL (Free-Electron-Laser).
Such laser system operates according to the principle that accelerated electrons
produce a synchrotron radiation. Basically, the electrons emitted by an electron
gun and accelerated to velocities close to the speed of light are injected into a
magnetic periodic structure named wiggler or undulator (see Figure 86). The
periodic deflection of the electron beam performed by the undulator magnets leads
to the emission of a monochromatic radiation at each turning point in the
sinusoidal trajectory. This radiation is captured and accumulated in a laser cavity.
The interaction between freshly injected electron bunches with the high pulses
circulating in the cavity produces a self-amplification process creating an intensity
gain on each successive pass. Because of their curved trajectory, the electrons
cover a longer distance than the light beam and consequently coherent radiation is
Epick-up
= 1
2 m
dopantv
D
2 E
int +
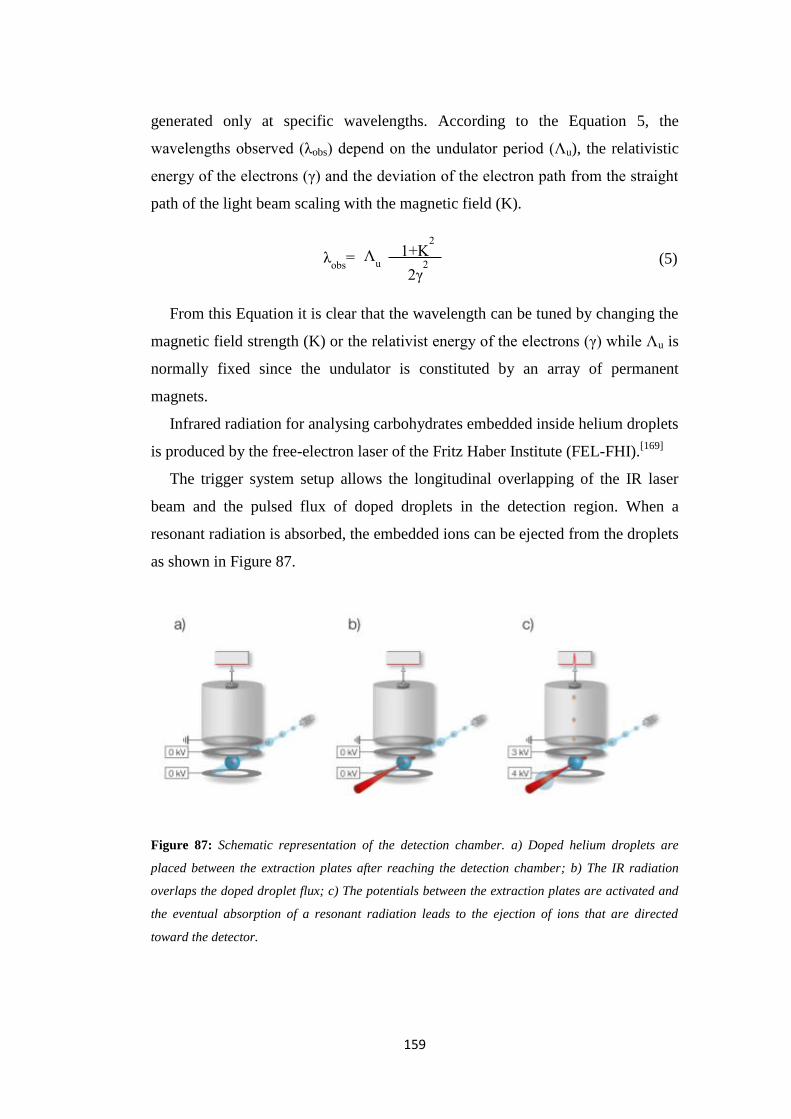
159
generated only at specific wavelengths. According to the Equation 5, the
wavelengths observed (λobs) depend on the undulator period (Λu), the relativistic
energy of the electrons (γ) and the deviation of the electron path from the straight
path of the light beam scaling with the magnetic field (K).
(5)
From this Equation it is clear that the wavelength can be tuned by changing the
magnetic field strength (K) or the relativist energy of the electrons (γ) while Λu is
normally fixed since the undulator is constituted by an array of permanent
magnets.
Infrared radiation for analysing carbohydrates embedded inside helium droplets
is produced by the free-electron laser of the Fritz Haber Institute (FEL-FHI).[169]
The trigger system setup allows the longitudinal overlapping of the IR laser
beam and the pulsed flux of doped droplets in the detection region. When a
resonant radiation is absorbed, the embedded ions can be ejected from the droplets
as shown in Figure 87.
Figure 87: Schematic representation of the detection chamber. a) Doped helium droplets are
placed between the extraction plates after reaching the detection chamber; b) The IR radiation
overlaps the doped droplet flux; c) The potentials between the extraction plates are activated and
the eventual absorption of a resonant radiation leads to the ejection of ions that are directed
toward the detector.
λobs
= 1+K2 Λ
u
2γ2

160
The physical principles ruling the ejection phenomenon have not completely
understood, but the process is actually object of further investigation at the FHI
laboratories. Nevertheless, the occurrence of the ejection is favoured by the
weakly interacting forces existing between the embedded ion and the helium
droplet.
The ejected ions are deflected towards a time-of-flight analyser by applying
high potentials to two extraction plates that the doped droplets reach during the
overlap period. As a result, an IR spectrum can be obtained by scanning IR
wavelengths in the range 950 cm-1
-1800 cm-1
and simultaneously monitoring the
ejection yield.
The orientation of a mirror can be modified during the analysis in order to
change the focus of the photon flux towards the doped droplets. This tuning
procedure allows one to obtain a good signal-to-noise ratio, but a photon flux
excessively focused can cause the undesirable fragmentation of the embedded
ions. Considering all the physical processes involved in this novel experimental
approach, Figure 88 well summarizes the main differences existing between the
IRMPD technique and the helium droplet method.
Figure 88: Schematic comparison between the fundamental principles of IRMPD and Helium
droplet spectroscopy.
In the IRMPD technique the absorption of resonant photons progressively
increase the internal energy of the ions. Therefore, the achievement of the

161
dissociation threshold finally results in the unimolecular fragmentation of the ion.
On the contrary, the energy excess of a ionic species embedded in a helium
droplet is dissipated into the helium medium allowing the ion to relax back into
the ground state and to reach a sub-kelvin temperature. Resonant photons can be
absorbed until the molecule is ejected from the droplet. As a consequence, in the
IRMPD approach the dissociation yield is the property monitored as a function of
the wavelength of the incident radiation, while in the case of helium droplet
method it results to be the ejection yield.

162
7.7 Experimental details
ERMS experiments
Energy resolved CAD mass spectra were acquired by means of a TSQ 700 triple
stage quadrupole mass spectrometer from Thermo Finnigan Ltd. Argon was
introduced in the triple quadrupole collision cell as the target gas at pressures of
about 0.1 mTorr. After the isolation, the selected ion was allowed to experience
collision energies values ranging from 0 to 40 eV (laboratory frame). An upper
limit of 2 eV for the kinetic energy of the reactant ion at nominal collision energy
of 0 eV (laboratory frame) and an ion-beam energy spread of about 1 eV were
estimated by using cut-off potentials. For comparison of different precursor
masses the laboratory ion energies (Elab) were transformed to centre-of-mass
collision energies according to Equation 6, where m and M are the nominal
masses of neutral reactant and the ionic reagent, respectively.
(6)
Experimental cross sections (ζtot) were calculated using Equation 7, where IR is
the intensity of the transmitted ion beam, Itot is the total intensities, n corresponds
to the number density of the neutral gas (3.5 1013
molecule cm-3
) and l is the
effective gas cell length (12 cm).
(7)
Individual product cross sections (ζp) were determined from the experimental
cross sections by the Equation 8, where Ip represents the intensity of the product
ion and Iptot the total product ion intensities.
(8)
ECM
=ELAB
m
(m+M)
σtot
= - ln(I
R/I
T)
nl
σp= σ
tot (I
p/I
ptot)

163
Tandem MSn experiments
Full scan and MSn mass spectra were recorded by using an AmaZon SL ion trap
instrument operating in the positive ion mode and equipped with an ESI source.
Each spectrum is obtained by averaging 50 scans and was obtained by direct
infusion of a fresh solution at a flow rate of 5 μL/min. Nitrogen was used as
nebulisation and desolvation gas at 5.0 psi and 2.5 L/min, respectively. During the
signal optimization procedures the potential applied on the capillary was ranged
between -4000/-4500 V and the plate offset between -400/-450 V. The source
temperature was kept at 200°C for all the experiments.
Mass spectrum acquisition and processing were carried out using the software
Compass DataAnalysisTM
version 4.0 supplied with the instrument.
Kinetic experiments
The kinetic experiments were performed on a modified LTQ XL linear ion trap
mass spectrometer and alternatively equipped with an electrospray ionization
(ESI) or an atmospheric pressure chemical ionization (APCI) source.
Sample compounds were dissolved in 1:1 water/acetonitrile and the obtained
10-3
M solutions were infused at a flow rate of 3-5 μL/min via a syringe pump
directly connected to the source. Nitrogen was used as sheath and auxiliary gas at
flow rate of 15-20 and 5 arbitrary units (a. u.~ 0.37 L/min). Typical experimental
ESI conditions were: source voltage 4-5 kV, capillary and vaporizer temperatures
200 °C and 80 °C, respectively. Concerning APCI source, capillary and vaporizer
temperatures were set to 150 °C and 60 °C respectively and the molecules were
ionized by applying a discharge current of 3-4 μA.
Neutrals were introduced into the trap by a metering valve, and their pressure
was read by a Granville-Philips series 370 Stabil Ion Vacuum Gauge, after
readings calibration.[170]
Ions under study were generated in the ESI or APCI
source, mass-selected with an isolation window of 1 m/z and reacted with the
neutral of interest (SO2; H2O or CH2Cl2) for different periods of time. Typical
pressures of neutrals ranged from 0.5·10-7
to 7.0·10-7
Torr.

164
Mass spectra were acquired by using the Xcalibur 2.0.6 software and recorded
for each reaction time using the full scan mode, with an injection time of 200 ms,
normalized energy set to 0 eV and the activation Q value optimized to ensure
stable trapping fields for all the ions. All the spectra are the average of 10 scans.
Rates were measured by varying the time delay between isolation of the reactant
ion and the analysis of its product ions. According to the logarithmic plot of the
reactant ion concentration versus time, all rate constants kobs fit the pseudo-first
order conditions. When a reaction between the reactant ions and the background
water present into the trap was observed, the rate constant of this reaction
kobs(background) was measured and subtracted from the kobs obtained for the reaction
of interest.
Bimolecular rate constants k (cm-3
s-1
molecule-1
) were calculated by dividing
the pseudo-first order rate constant by the concentration of neutral reagent in the
ion-trap. The reaction efficiency, expressed as the ratio of the bimolecular rate
constant k to the collision rate constant, was calculated according to the ADO
theory.[171]
The bimolecular rate constants k are the average of ca. 30 independent
measurements performed in different days for each precursor ion. All the rates
were measured over 5-fold neutral pressure range, showing linear correlation with
the neutral density. Standard deviations in the absolute rate constant were
typically <10%; however, a conservative estimate of error of 30% is given, due to
the uncertainties that affected the measurement of the neutral pressure.
Neutral fragment-reionization (NfR) experiments
NfR (Re-ionization of Neutral Fragments) and CAD experiments were carried out
by using a modified ZAB Spec-oa-TOF mass spectrometer (VG Micromass)
equipped with a chemical ionization (CI) source and five collision cells. Briefly,
the instrument has a EBE-TOF configuration where E, B stand for electric and
magnetic sectors respectively and TOF for orthogonal time-of-flight analyser.
Sample compounds were directly introduced into the source through a solid probe
whereas the neutral species were allowed to flow through a capillary column of
deactivated silica. Typical operating conditions were: accelerating voltage 8 kV,

165
source temperature 400 K, repeller voltage 0 V, emission current 1 mA, nominal
electron energy 50 eV, source pressure 0.05-0.08 Torr, as reported inside the
source block by a Magnehelic differential pressure gauge.
Ions of interest were mass-selected by the magnetic sector and CAD mass
spectra were recorded in the gas cell placed after the magnet in the second field-
free region. Helium was used as the target gas in the collision cell and its pressure
was chosen to provide 80% transmittance.
After recording a CAD mass spectrum, charged fragments were all removed at
the exit of the cell by applying a potential of 1 keV on a pair of high voltage
deflecting electrodes. As a result, a beam containing only neutrals reached the
second cell where it was ionized by collision with O2 and further analysed in the
TOF sector. No signal was obtained by switching the deflector on in the absence
of the re-ionizing gas. All NfR spectra were averaged over 200 acquisitions to
improve the signal-to-noise ratio.
MS3 spectra were recorded in a gas cell located in the TOF sector, by mass and
energy selection of the daughter ions coming from CAD fragmentations in the
second field-free region. All gases were admitted into the cells at such a pressure
to achieve a beam transmittance of 80%, under near single collision conditions.
IM-MS experiments
Full scan mass spectra were recorded using a modified Synapt G2-S HDMS by
Waters Corporation (Manchester, UK) operating in the positive ion mode and
equipped with a nano-ESI source. The source temperature was kept at 25 °C.
Helium was introduced in the drift tube and used as drift gas. At each helium
gas pressure the drift time (td) of an ion was measured at seven individual drift
voltages (Vd) in MS/MS-Mode. The ion mobility constant (K) was calculated
according to the Equation (9) where L is the drift tube length and t0 is the time
offset.
(9) td =
L2
K
1
Vd + t
0

166
By plotting drift times as a function of the quotient of the voltages, time offset
(t0) was obtained from the intercept and the mobility constant K from the slope of
the linear function. The constant K was employed to extrapolate the collision
cross section (CCS) through the Mason-Schamp equation (10) where q is the total
charge of the ion, kB is the Boltzmann constant, N is the number density of drift
gas and μ is the reduced mass (ion + drift gas molecule).
(10)
K0 represents the standard mobility constant and is derived from the calculated
K value by correlating the standard temperature and pressure (T0; P0) with the
drift gas temperature and pressure (T; P) according to the Equation 11.
(11)
Mass spectrum acquisition and processing were carried out using MassLynx
software version 4.1 supplied with the instrument and OriginPro 9.0.
Ultra-cold spectroscopy experiments
Infrared spectra of carbohydrate ions were acquired using the experimental setup
described in Section 7.6 and recorded in the wavenumber range from 950 cm-1
to
1800 cm-1
.
Using a variable focusing mirror different photon densities were applied over
the wavenumber range allowing to obtain a good signal for the ion ejection. In
particular, the spectral region between 950-1150 cm-1
was scanned by using a low
photon density that is sufficient to access large transition dipole modes, such as
CCS = 3q
16N
1
K0
2π
μKBT
1/2
K0=
P
P0
T0
T K

167
the C-O stretching. On the other hand, high intensity focus was necessary to
record the wavenumber range between 1150 and 1800 cm-1
.
A linear correction was performed dividing the absorption signals by the laser
power as a consequence of the fact that the peak intensities are strongly influenced
by the multiple-photon absorption process and the bands do not scale linearly with
the laser power and the absorption cross-section. Conversely, the absorption of
multiple-photon do not influence the band positions.
The shown infrared spectra represent the average of two individual scans
performed in order to minimize the effect of possible fluctuations in laser power
or ion intensity in the trap.
Radiation is emitted in macro and micro pulses by the FHI-FEL with a full
width at half maximum of about 0.3-0.5% of the corresponding wavelength.
Macro pulses have a length of up to 10 μs and contain micro pulses of 0.3 - 5 ps
length, spaced by 1 ns as the total energy can reach 100 mJ.
After the acquisition of each infrared spectrum, the laser power and several
wavelength points were calibrated employing a Cherny-Turner grating
spectrometer.

168
8. Bibliography
[1] Facing the hard truths about energy: Washington DC: U.S. National
Petroleum Council 2007.
[2] Analysis of the Italian total fleet; Statistical Yearbook 2016-ACI.
[3] A. J. Ragauskas, C. K. Williams, B. H. Davison, G. Britovsek, J. Cairney, C.
A. Eckert,W. J. Frederick Jr., J. P. Hallett, D. J. Leak, C. L. Liotta, J. R.
Mielenz, R. Murphy, R. Templer, T. Tschaplinski, Science 2006, 311, 484-489.
[4] A. Corma, S. Iborra, A. Velty, Chem. Rev. 2007, 107, 2411-2502.
[5] J. Goldemberg, Science 2007, 315, 808-810.
[6] D. R. Doods and R. A. Gross, Science 2007, 318, 1250-1251.
[7] A. Gandini, Polym. Chem. 2010, 1, 245-251.
[8] J. Ten Dam, U. Hanefeld, Chem. Sus. Chem. 2011, 4, 1017-1034.
[9] J. B. Binder, J. J. Blank, A. V. Cefali, R. T. Raines, Chem. Sus. Chem. 2010, 3,
1268-1272.
[10] F. M. A. Geilen, B. Engendahl, A. Harwardt, W. Marquardt, J. Klanlermayer,
W. Leitner, Angew. Chem. 2010, 122, 5642-5646.
[11] J. J. Bozell, G. R. Petersen, Green Chem. 2010, 12, 539.
[12] T. Werpy, G. Petersen, Top Value Added Chemicals from Biomass 2004, Vol.
I-Results of Screening for Potential Candidates from Sugars and Synthesis
Gas; NREL/TP-510-35523; National Energy Laboratory: Golden, CO.
[13] W. A. Bonner, M. R. Roth, J. Am. Chem. Soc. 1959, 81, 5454-5456.
[14] Y. T. Wang, K. J. Jin, S. H. Leopold, J. Wang, H. L. Peng, M. S. Platz, J.
Xue, D. L. Phillips, S. A. Glover, M. Novak, J. Am. Chem. Soc. 2008, 130,
16021-16030.

169
[15] K. R. Sawyer, J. F. Cahoon, J. E. Shanoski, E. A. Glascoe, M. F. Kling, J. P.
Schlegel, M. C. Zoerb, M. Hapke, J. F. Hartwig, C. E. Webster, J. Am. Chem.
Soc. 2010, 132, 1848-1859.
[16] M. Aschi, M. Attina, F. Cacace, A. Ricci, J. Am. Chem. Soc. 1994, 116,
9535.
[17] K. B. Mathisen, E. M. Siegbahn, Chem. Phys. 1984, 90, 225-230.
[18] P. Wentworth Jr., A. D. Wentworth, X. Zhu, I. A. Wilson, K. D. Janda, A.
Eschenmoser, R. A. Lerner, Proc. Natl. Acad. Sci. USA, 2003, 100 (4), 1490-
1493.
[19] F. Cacace, G. de Petris, F. Pepi, A. Troiani, Science 1999, 285, 81.
[20] M. Yamashita, J. B. Fenn, J. Phys. Chem. 1988, 20, 4451-4459.
[21] J. B. Fenn, M. Mann, C. K. Meng, S. F. Wong, C. M. Whitehouse, Science
1989, 246, 64-71.
[22] a) M. N. Eberlin, Eur. J. Mass Spectrom. 2007, 13, 19-28; b) F. Coelho, M.
N. Eberlin, Angew. Chem. 2011, 50, 5261-5263.
[23] a) L. S. Santos, Eur. J. Org. Chem. 2008, 235-253. b) L. S. Santos, L.
Knaack, J. O. Metzger, Int. J. Mass Spectrom. 2005, 246, 84-104. c) L. S.
Santos, J. Braz. Chem. Soc. 2011, 22 (10), 1827-1840.
[24] Y. Tian, J. K. Lee, J. Org. Chem. 2015, 80, 6831-6838.
[25] F. C. C. Moura, M. H. Araujo, I. Dalmázio, T. A. Alves, L. S. Santos, M. N.
Eberlin, R. Augusti, R. M. Lago, Rapid Comm. Mass Spectrom. 2006, 20,
1859-1863.
[26] G. B. S. Miller, E. Uggerud, Int. J. Mass Spectrom. 2017, 413, 150-162.
[27] C. Vincent, D. G. Gusev, ACS Catalysis 2016, 6 (5), 3301-3309.
[28] M. M. Cecchini, F. De Angelis, C. Iacobucci, S. Reale, M. Crucianelli, App.
Cat. A: General 2016, 517, 120-128.

170
[29] A. Simakov, G. B. S. Miller, A. J. C. Bunkan, M. R. Hoffmann, E. Uggerud,
Phys. Chem. Chem. Phys. 2013, 15 (39), 16615-16625.
[30] L. P. E. Yunker, R. L. Stoddard, J. S. McIndoe, J. Mass Spectrom. 2014, 49,
1-8.
[31] International Agency for Research on Cancer 1995, 63, 394-407. Lyon:
IARC.
[32] a) M. Schlangen, J. Neugebauer, M. Reiher, D. Schöder, J. P. López, M.
Haryono, F. W. Heinemann, A. Grohmann, H. Schwarz, J. Am. Chem. Soc.
2008, 130 (13), 4285-4295; b) D. Schöder, H. Schwarz, Int. J. Mass
Spectrom. 2004, 231, 139-146; c) U. Mazurek, D. Schröder, H. Schwarz,
Angew. Chem. Int. Edit. 2002, 41, 2538; d) J. Loos, D. Schröder, W.
Zummack, H. Schwarz, Int. J. Mass Spectrom. 2002, 217, 169; e) U.
Mazurek, H. Schwarz, Chem. Eur. J. 2002, 8, 2057; f) S. Barsch, D.
Schröder, H. Schwarz, P.B. Armentrout, J. Phys. Chem. A 2001, 105, 2005;
g) H. Schwarz, D. Schröder, Pure Appl. Chem. 2000, 72, 2319; h) M.
Brönstrup, C. Trage, D. Schröder, H. Schwarz, J. Am. Chem. Soc. 2000, 122,
699; i) G. Hornung, S. Barsch, D. Schröder, H. Schwarz, Organometallics
1998, 17, 2271; j) S. Shaik, M. Filatov, D. Schröder, H. Schwarz, Chem. Eur.
J. 1998, 4, 193; k) D. Schröder, C. Heinemann, W. Koch, H. Schwarz, Pure
Appl. Chem. 1997, 69, 273; l) G. Hornung, D. Schröder, H. Schwarz, J. Am.
Chem. Soc. 1997, 119, 2273.
[33] A. Onda, T. Ochi, K. Yanagisawa, Green Chem. 2008, 10, 1033-1037.
[34] H. Kobayashi, H. Kaiki, A. Shrotri, K. Techikawara, A. Fukuoka, Chem. Sci.
2016, 7, 692-696.
[35] a) B. Girisuta, L. P. B. M. Jansenn, H. J. Heeres, Chem. Eng. Res. Des. 2006,
84 (A5), 339-349; b) B. Girisuta, L. P. B. M. Jansenn, H. J. Heeres, Green
Chem. 2006, 8, 701-709.
[36] X. Qi, M. Watanabe, T. M. Aida, R. L. Smith Jr, Catal. Commun. 2008, 9
(13), 2244-2249.

171
[37] X. Qian, Top. Catal. 2012, 55, 218-226.
[38] M. R. Nimlos, X. Qian, M. Davis, M. E. Himmel, D. K. Johnson, J. Phys.
Chem. A 2006, 110, 11824-11838.
[39] X. Qian, J. Phys. Chem. 2011, 115, 11740-11748.
[40] M. J. Antal, W. S. L. Mok, G. N. Richards, Carbohydr. Res. 1990, 199, 91-
109.
[41] M. J. Antal Jr., T. Leesomboon, W. S. L. Mok, G. N. Richards, Carbohydr.
Res. 1991, 217, 71-85.
[42] D. W. Harris, M. S. Feather, Adv. Carbohydr. Res. 1973, 28, 161-224.
[43] X. Qian, J. Wei, J. Phys. Chem. B 2012, 116, 10898-10904.
[44] R. S. Assary, P. C. Redfern, J. Greeley, L. A. Curtiss, J. Phys. Chem. B 2011,
115, 4341-4349.
[45] R. S. Assary, L. A. Curtiss, Energy Fuels 2012, 26, 1344-1352.
[46] R. S. Assary, T. Kim, J. Greeley, L. A. Curtiss, Phys. Chem. Chem. Phys.
2012, 14, 16603-16611.
[47] R. S. Assary, P. C. Redfern, J. R. Hammond, J. Greeley, L. A. Curtiss, J.
Phys. Chem. B 2010, 114, 9002-9009.
[48] S. Caratzoulas, D. G. Vlachos, Carbohydr. Res. 2011, 346, 664-672.
[49] G. Yang, E. A. Pidko, E. J. M. Hensen, J. Catal. 2012, 295, 122-132.
[50] T. Ahmad, L. Kenne, K. Olsson, O. Theander, Carbohydr. Res. 1995, 276,
309-320.
[51] M. L. Wolfrom, R. D. Schuetz, L. F. Cavalieri, J. Am. Chem. Soc. 1949, 71,
3518-3523.
[52] M. S. Feather, Tetrahedron Lett. 1970, 11, 4143-4145.

172
[53] X. Qian, M. R. Nimlos, D. K. Johnson, M. E. Himmel, Appl. Biochem.
Biotechnol. 2005, 124, 989-997.
[54] H. Dong, M. R. Nimlos, M. E. Himmel, D. K. Johnson, J. Phys. Chem. A
2009, 113(30), 8577-8585.
[55] X. Qian, D. K. Johnson, M. R. Nimlos; Carbohydr. Res. 2010, 345, 1945-
1951.
[56] A. Thompson, K. Anno, J. Am. Chem. Soc. 1954, 76(5), 1309-1311.
[57] K. P. Madhusudanam, J. Mass Spectrom. 2006, 41, 1096-1104.
[58] P. Huang, A. Gu, J. Wang, Res. Chem. Intermed. 2015, 41, 5311-5321.
[59] G. Bouchoux, Mass Spectrom. Rev. 2015, 34, 493.
[60] A. Ricci, S. Picolella, F. Pepi, S. Garzoli, P. Giacomello, J. Am. Soc. Mass
Spectrom. 2013, 24,1082-1089.
[61] R. G. Akien, L. Qi, T. I. Horvath, Chem. Comm. 2012, 48, 5850-5852.
[62] G.A. Halliday, R.J. Young Jr, V.V. Grushin, Org. Lett. 2003, 5, 2003-2005.
[63] S. Feng, C. Bagia, G. Mpourmpakis, J. Chem. Phys. A 2013, 117, 5211-5219.
[64] a) M. C. Byrns, D. P. Predecki, L. A. Peterson, Chem. Res. Toxicol. 2002,
15(3), 373-379; b) M. C. Byrns, C. C. Vu, L. A. Peterson, Chem. Res.
Toxicol. 2004, 17(12), 1607-1613; c) M. C. Byrns, C. C. Vu, J. W. Neidigh,
J.-L. Abad, R. A. Jons. L. A. Peterson, Chem. Res. Toxicol. 2006, 19(3),
414-420.
[65] J. A. Maga, Crit. Rev. Food Sci. Nutr. 1979, 11(4), 355-400.
[66] a) EFSA-Report of Scientific Panel on Contaminants in the Food Chain on
provisional findings on furan in food, 2014; b) EFSA-Report of the
CONTAM Panel on provisional findings on furan in food, 2014.
[67] FDA-Exploratory data on furan in food, 2014.

173
[68] A. Limacher, J. Kerler, T. Davidek, F. Schmalzried, I. Blank, J. Agr. Food
Chem. 2008, 56, 3639-3647.
[69] A. Becalski, S. Seaman, J. AOAC Int. 2005, 88, 102-106.
[70] J. Maerk, P. Pollien, C. Lindinger, I. Blank, T. Maerk, J. Agr. Food Chem.
2006, 54, 2789-2793.
[71] L. C. Perez, A. Y. Varoujan, J. Agr. Food Chem. 2004, 52, 6830-6836.
[72] X. Fan, J. Agr. Food Chem. 2005, 53, 7826-7831.
[73] R. W. Herbert, E. L. Hirst, E. G. V. Percival, R. J. W. Reynolds, S. J. Smith,
Chem. Soc. 1933, 1270-1290.
[74] B. A. Mogol, V. Gökmen, J. Agr. Food Chem. 2013, 2005, 10191-10196.
[75] T. Kurata, Y. Sakurai, Agric. Biol. Chem. 1967, 31 (2), 170-176.
[76] D.H. Aue and M.T. Bowers, in M.T. Bowers (Ed.), Gas Phase Ion Chemistry,
Vol. 2, Academic Press, New York, 1979, Chap. 9.
[77] R. W. Davidson, M. T. Bowers, T. Su, D. H. Aue, Int. J. Mass Spectrom. and
Ion Phys. 1977, 24 (1), 83-105.
[78] M. Liu, M. Chen, S. Zhang, I. Yang, B. Buckley, J. K. Lee, J. Phys. Org.
Chem. 2011, 24, 929-936.
[79] A. Wiseman, L. A. Sims, R. Snead, S. Gronert, R. G. A. R. Maclagan, M.
Meot-Ner, J. Phys Chem. A 2015, 119, 118-126.
[80] a) R. G. Cooks, T. L. Kruger, J. Am. Chem. Soc. 1977, 99, 1279-1281; b) S.
A. McLuckey, D. Cameron, R. G. Cooks, J. Am. Chem. Soc. 1981, 103, 1313-
1317; c) R. G. Cooks, J. S. Patrick, T. Kotiaho, S. A. McLuckey, Mass
Spectrom. Rev. 1994, 13, 287-339.
[81] X. Cheng, Z. Wu, C. Fenselau, J. Am. Chem. Soc. 1993, 115, 4844-4848.
[82] C. Wesdemiotis, J. Mass Spectrom. 2004, 39, 998-1003.

174
[83] Standard Reference Database Number 69, Gaithersburg MD, 20899,
http://webbook.nist.gov (Eds. P. J. Linstrom, W. G. Mallard), 2005. Last
accessed on March 2016.
[84] D. Pramod, R. C. Wilhoit, Thermochim. Acta 1970, 1, 61-64.
[85] a) R. A. Yadav, P. Rani, M. Kumar, R. Singh, P. Singh, N. P. Singh,
Spectrochim. Acta A 2001, 84, 6-21; b) M. A. Mora, F. J. Melendez, J. Mol.
Struct. 1998, 454, 175-185.
[86] a) J. Hvoslef, Acta Cryst. B 1968, 24, 1431-1440; b) J. Hvoslef, Acta Cryst B
1969, 25, 2214-2223.
[87] J. Hvoslef, Acta Cryst. B 1968, 24, 23-25.
[88] G. Bouchoux, Mass. Spectrom. Rev. 2013, 1-20.
[89] L. L. da Rocha, R. Sparrapan, M. N. Eberlin, Int. J. Mass Spectrom. 2003,
228, 901-912.
[90] R. V. Lemieux, K. B. Hendriks, R. V. Stick, K. James, J. Am. Chem. Soc.
1975, 97, 4056-4062.
[91] N. K. Kochetkov, E. M. Klimov, N. N. Malysheva, A.V. Demchenko,
Carbohydr. Res. 1991, 212, 77-91.
[92] a) M. Huang, G. E. Garrett, N. Birlirakis, L. Bohe, D. A. Pratt, D. Crich,
Nature Chem. 2012, 4, 663-667; b) M. Huang, P. Retailleau, L. Bohe, D.
Crich, J. Am. Chem. Soc. 2012, 134, 14746-14749.
[93] D. R. Mootoo, P. Konradsson, U. Udodong, B. Fraser-Reid, J. Am. Chem.
Soc. 1988, 110, 5586-5584.
[94] H. Paulsen, Angew. Chem. Int. Ed. Engl. 1982, 155-173.
[95] H. H. Jensen, L. Lyngbye, M. Bols, Angew. Chem. Int. Ed. 2001, 40, 3447-
3449.

175
[96] T. Nukada, A. Berces, M. Z. Zgierski, D. M. Whitfield, J. Am. Chem. Soc.
1998, 120, 13291-13295.
[97] J. T. Edward, Chem. Ind. (London) 1955, 1102-1104.
[98] M. J. Cohen, F. W. Karasek, J. Chrom. Sci. 1970, 8, 330-337.
[99] J. Hofmann, H. S. Hehm, P. H. Seeberger, K. Pagel, Nature 2015, 526, 241-
244.
[100] N. C. Polfer, J. Oomens, Mass Spectrom. Rev. 2009, 28, 468-494.
[101] N. C. Polfer, Chem. Soc. Rev. 2011, 40, 2211-2221.
[102] A. M. Rijis, J. Oomens, Top. Curr. Chem. 2015, 364, 1-42.
[103] G. Meijer, M. S. Devries, H. E. Hunziker, H. R. Wendt, Appl. Phys. B-
Photophys. Laser Chem. 1990, 51 (6), 395-403.
[104] J. M. Lisy, J. Chem. Phys. 2006, 125, 132302.
[105] N. C. Polfer, J. J. Valle, D. T. Moore, J. Oomens, J. R. Eyler, B. Bendiak,
Anal. Chem. 2006, 78, 670-679.
[106] E. Mucha, Master Thesis, Freie Universität Berlin 2016.
[107] a) Gerlich D., Adv. Chem. Phys. 1992, 82, 1-176; b) Gerlich D., S. Horning,
Chem. Rev. 1992, 92, 1509-1539.
[108] T. R. Rizzo, O. V. Boyarkin, Top. Curr. Chem. 2015, 364, 43-98.
[109] S. Goyal, D. L. Schutt, G. Scoles, Phys. Rev. Lett. 1992, 69, 933-936.
[110] M. Hartmann, R. E. Miller, J. P. Toennies, A. F. Vilesov, Science 1996,
272, 1631– 1634.
[111] A. Lindinger, J. P. Toennies, A. F. Vilesov, J. Chem. Phys. 1999, 110,
1429-1436.
[112] J. P. Toennies, A. F. Vilesov, Angew. Chem. Int. Ed. 2004, 43, 2622-2648.

176
[113] F. Bierau, P. Kupser, G. Meijer, G. von Helden, Phys. Rev. Lett. 2010, 105,
133402-4
[114] F. Filsinger, D. Ahn, G. Meijer, G. von Helden, Phys. Chem. Chem. Phys.
2012, 14, 13370-13377.
[115] A. I. Gonzaléz Flórez, D.-S. Ahn, S. Gewinner, W. Schöllkopf, G. Von
Helden, Phys. Chem. Chem. Phys. 2015, 17 (34), 21902-21911.
[116] A. I. González Flόrez, E. Mucha, D. S. Ahn, S. Gewinner, W. Schöllkopf,
K. Pagel, G. Von Helden, Ang. Chem. 2016, 55, 3295-3299.
[117] E. Mucha, A. I. Gonzaléz Flórez, M. Marianski, D. A. Thomas, W.
Hoffmann, W. B. Struwe, H. S. Hahm, S. Gewinner, W. Schöllkopf, P. H.
Seeberger, G. Von Helden, K. Pagel, Angew. Chem. Int. Ed. 2017, 56, 1-5.
[118] C. Leblanc, H. Vilter, J. -B. Fournier, L. Delage, P. Potin, E. Rebuffet, G.
Michel, P. L. Solari, M. C. Feiters, M. Czjzek, Coord. Chem. Rev. 2015,
301-302, 134-146.
[119] a) T. J. Kealy, P. L. Pauson, Nature 1951, 168, 1039; b) S. A. Miller, J. A.
Tebboth, J. F. Tremaine, J. Chem. Soc. 1952, 632.
[120] a) P. L. Pauson, J.Organomet. Chem. 2001, 637-639, 3-6; b) A. F. Neto, A.
C. Pelegrino, V. A. Darin, Chem Inform. 2004, 35(43).
[121] a) K. Heinze, H. Lang, Organometallics 2013, 32, 5623; b)R. Sun, L.
Wang, H. Yu, Z. U. Abdin, Y. Chen, J. Huang, R. Tong, Organometallics
2014, 33, 4560; c) S. Takahashi, J.-I. Anzai, Materials 2013, 6, 5742; d) S.
S. Braga, A. M. S. Silva, Organometallics 2013, 32, 5626; e) T. Daeneke, T.
H. Kwon, A. B. Holmes, N. W. Duffy, U. Bach, L. Spiccia, Nat. Chem.
2011, 3, 211.
[122] a) P. Köpf-Maier, H. Köpf, E. W. Neuse, Angew.Chem. Int. Ed. Engl. 1984,
23, 456; b) P. Köpf-Maier, H. Köpf, E. W. Neuse, Angew.Chem. 1984, 96,
446.

177
[123] B. M. Weckhuysen, D. E. Keller, Catal. Today 2003, 78, 25.
[124] a) M. S. Whittingham, Chem. Rev. 2004, 104, 4271; b) C. Zhang, H. Song,
C. Zhang, C. Liu, Y. Liu, G. Cao, J. Phys. Chem. C 2015, 119, 11391; c) X.
Xu, M. Yan, X. Tian, C. Yang, M. Shi, Q. Wei, L. Xu, L. Mai, Nano Lett.
2015, 15, 3879.
[125] G. Innorta, S. Torroni, F. Basili, A. Di Fabio, J. Organomet.Chem. 2002,
650, 69.
[126] R. W. Kugel, L. F. Pinelo,B.S.Ault, J. Phys.Chem. A 2015, 119, 2371.
[127] E. Nakamura, N. Yoshikai, J. Org.Chem. 2010, 75, 6061.
[128] a) K. Eller, H. Schwarz, Chem.Rev. 1991, 91, 1121; b) L. Capron, H.
Mestdagh, C. Rolando, Coord. Chem. Rev. 1998, 178–180, 269; c) D. K.
Böhme, H. Schwarz, Angew.Chem. Int. Ed. 2005, 44, 2336; Angew.Chem.
2005, 117, 2388; d) M.Schlangen, H. Schwarz, Catal. Lett. 2012, 142, 1265.
[129] a) R. C. Bell, K. A. Zemski, K. P. Kerns, H. T. Deng, A. W. Castleman, Jr.
J. Phys. Chem. A 1998, 102, 1733; b) K. A. Zemski, D. R. Justes, A. W.
Castleman, Jr. J. Phys. Chem. A 2001, 105, 10237; c) S. Feyel, D. Schröder,
X. Rozanska, J. Sauer, H. Schwarz, Angew. Chem. Int. Ed. Engl. 2006, 45,
4677; d) S. Feyel, J. Döbler, D. Schröder, J. Sauer, H. Schwarz, Angew.
Chem. Int. Ed. Engl. 2006, 45, 4681; e) N. Dietl, M. Engeser, H. Schwarz,
Chem. Eur. J. 2010, 16, 4452; f) S. Zhou, J. Li, M. Schlangen, H. Schwarz,
Chem. Eur. J. 2016, 22, 7225
[130] a) Z.-C. Wang, X. N. Wu, Y. X. Zhao, J. B. Ma, X. L. Ding, S. G. He,
Chem. Phys. Lett. 2010, 489, 25; b) N. Dietl, R. F. Hockendorf, M.
Schlangen, M. Lerch, M. K. Beyer, H. Schwarz, Angew. Chem. Int. Ed.
Engl. 2011, 50, 1430; c) Z.-C. Wang, J.-W. Liu, M. Schlangen, T. Weiske,
D. Schröder, J. Sauer, H. Schwarz, Chem. Eur. J. 2013, 19, 11496; d) N.
Dietl, T. Wende, K. Chen, L. Jiang, M. Schlangen, X. Zhang, K. R. Asmis,
H. Schwarz, J. Am. Chem. Soc. 2013, 135, 3711; e) Z. Y. Li, H. F. Li, Y. X.
Zhao, S. G. He, J. Am. Chem. Soc. 2016, 138, 9437.

178
[131] a) R. C. Bell, A.W. Castleman, J. Phys. Chem. A 2002, 106, 9893; b) X.-N.
Li, B. Xu, X.-L. Ding, S.-G. He, Dalton Trans. 2012, 41, 5562; c) S. Li, A.
Mirabal, J. Demuth, L. Wöste, T. Siebert, J. Am. Chem. Soc. 2008, 130,
16832; d) Y.-X. Zhao, X.- N. Wu, J.-B. Ma, S.-G. He, X.-L Ding, J. Phys.
Chem. C 2010, 114, 1227; e) E. Janssens, S. M. Lang, M. Brümmer, A.
Niedziela, G. Santambrogio, K. R. Asmis, J. Sauer, Phys. Chem. Chem.
Phys. 2012, 14, 14344; f) A. Dinca, T. P. Davis, K. J. Fisher, D. R. Smith,
G. D. Willett, Int. J. Mass Spectrom. 1999, 182/183, 73; g) Z. Yuan, Z.-Y.
Li, Z.-X. Zhou, Q.-Y. Liu, S.-G. He, J. Phys. Chem. C 2014, 118, 14967.
[132] a) E. Jakubikova, E. R. Bernstein, J. Phys. Chem. A 2007, 111, 13339; b)
S.-G. He, Y. Xie, F. Dong, S. Heinbuch, E. Jakubikova, J. J. Rocca, E. R.
Bernstein, J. Phys. Chem. A 2008, 112, 11067.
[133] a) S. Krückeberg, P. Beiersdorfer, G. Dietrich, K. Lützenkirchen, L.
Schweikhard, C. Walther, Rapid Comm. Mass Spectrom. 1997, 11, 455; b)
Z. Parsons, C. Leavitt, T. Duong, G. S. Groenewold, G. L. Gresham, M. J.
Van Stipdonk, J. Phys. Chem. A 2006, 110, 11627; c) D. Schröder, M.
Engeser, H. Schwarz, J. N. Harvey, Chem. Phys. Chem. 2002, 3, 584; d) X.
Zhang, H. Schwarz, Chem. Eur. J. 2010, 16, 1163.
[134] a) D. K. Walanda, R. C. Burns, G. A. Lawrance, E. I. von Nagy-Felsobuki,
Inorg. Chem. Comm. 1999, 2, 487; b) D. K. Walanda, R. C. Burns, G. A.
Lawrance, E. I. von Nagy-Felsobuki, Inorg. Chim. Acta 2000, 305, 118; c)
N. M. Al Hasan, G. E. Johnson, J. Laskin, J. Am. Soc. Mass Spectrom. 2013,
24, 1385.
[135] a) Y. A. Ranasinghe, T. J. MacMahon, B. S. Freiser, J. Am. Chem. Soc.
1992, 114, 9112; b) S. Petrie, G. Javahery, J. Wang, D. K. Bohme, J. Am.
Chem. Soc. 1992, 114, 9177; c) S. D. Price, M. Manning, S. R. Leone, J.
Am. Chem. Soc. 1994, 116, 8673; d) J. Roithová, Z. Herman, D. Schröder,
H. Schwarz, Chem. Eur. J. 2006, 12, 2465; e) J. Roithová, D. Schröder, J.
Am. Chem. Soc. 2006, 128, 4208; f) J. Roithová, J. Žabka, Z. Herman, R.
Thissen, D. Schröder, H. Schwarz, J. Phys. Chem. A 2006, 110, 6447; g) J.
179
Roithová, D. Schröder, Phys. Chem. Chem. Phys. 2007, 9, 2341; h) J.
Roithová, D. Schröder, H. Schwarz, Chem. Eur. J. 2009, 15, 9995.
[136] a) A. Blades, M. Peschke, U. Verkerk, P. Kebarle, J. Phys. Chem. A. 2002,
106, 10037; b) A. E. Flores, S. Gronert, J. Am. Chem. Soc. 1999, 121, 2627;
c) S. Gronert, Acc. Chem. Res. 2003, 36, 848.
[137] a) C. A. Schalley, G. Hornung, D.Schröder, H.Schwarz, Chem. Soc. Rev.
1998, 27, 91; b) F. Cacace, G. de Petris, M. Rosi, A. Troiani, Angew.Chem.
Int. Ed. 2001, 40, 1938; Angew.Chem. 2001, 113, 1992; c) G. de Petris, G.
Angelini, O. Ursini, M. Rosi, A. Troiani, Angew.Chem. Int. Ed. 2012, 51,
1455; Angew.Chem. 2012, 124, 1484; d) G. de Petris, A. Troiani, M.Rosi,
G. Angelini, O. Ursini, ChemPlusChem 2013, 78,1065.
[138] a) M. T. Bowers, D. D. Elleman, R. M. O’ Malley, K. R. Jennings, J. Phys.
Chem. 1970, 74, 2583; b) S. G. Lias, P. Ausloos, J. Chem. Phys. 1985, 82,
3613.
[139] G. Bouchoux, M. Yanez, O. Mo, Int.J. Mass Spectrom. 1999, 185/ 187, 241.
[140] a) R. R. Corderman, J. L. Beauchamp, Inorg. Chem. 1978, 17, 68; b) V. I.
Baranov, G. Javahery, D. K. Böhme, Chem. Phys.Lett. 1995, 239, 339;c) V.
I. Baranov, D. K. Böhme, Int. J. Mass Spectrom. Ion Proc. 1995, 149/150,
543; d) R. Bakhtiar, D. B. Jacobson, J. Am. Soc.Mass Spectrom. 1996, 7,
938; e) R. K. Milburn, V. I. Baranov, A. C. Hopkinson, D. K. Böhme, J.
Phys. Chem. A 1998, 102, 9803; f) V. I. Baranov, D. K. Böhme, Int. J. Mass
Spectrom. 2001, 210/211, 303; g) V. I. Baranov, D. K. Böhme, Int. J. Mass
Spectrom. 2001, 204, 209; h) G. Innorta, S. Torroni, F. Basili, A. Di Fabio,
J. Organomet. Chem. 2002, 650, 69.
[141] a) Y. Huang, B. S. Freiser, J. Am. Chem. Soc. 1990, 112, 5085; b) NIST
Chemistry WebBook, NIST StandardReference Database Number 69,
Gaithersburg MD, 20899, http://webbook.nist. gov (Eds.P.J.Linstrom, W. G.
Mallard), 2005; c) E. Goos, A. Burcat, B. Ruscic,Active Thermochemical
Tables (ATcT) availableat:http://burcat.technion.ac.il/dir, 2015.
180
[142] M. Sodupe, C. W. Bauschlicher, Chem. Phys. Lett. 1993, 207,19.
[143] M. Diefenbach, C. Trage, H. Schwarz, Helv. Chim. Acta 2003, 86, 1008.
[144] B. Butschke, H. Schwarz, Int. J. Mass Spectrom. 2011, 306,108.
[145] P. J. Linstrom and W.G. Mallard, Eds., NIST Chemistry WebBook, NIST
Standard Reference Database Number 69, National Institute of Standards
and Technology, Gaithersburg MD, 20899, http://webbook.nist.gov,
(retrieved November 22, 2016).
[146] a) H.-G. Weikert, L. S. Cederbaum, F. Tarantelli, A. I. Boldyrev, Z. Phys. D
1991, 18, 299; b) M.K. Scheller, R. N. Compton, L. S. Cederbaum, Science
1995, 270, 1160; c) L.-S. Wang, C.-F. Ding, X.-B. Wang, J. B. Nicholas,
Phys. Rev. Lett. 1998, 81, 2667.
[147] N. F. Dalleska, K. Honma, P. B. Armentrout, J. Am. Chem. Soc. 1993, 115,
12125-12131.
[148] C-X. Su, D. A. Hales, P. B. Armentrout, Chem. Phys. Lett. 1993, 201, 199-
204.
[149] P. B. Armentrout, N. Adams, L. Babcock, Eds., Advances in Gas Phase Ion
Chemistry; JAI Press: Greenwich, CT, 1992, Vol.1, p. 83.
[150] C. E. C. A. Hop, T. B. McMahon, G. D. Willet, Int. J. Mass Spectrom. Ion
Processes 1990, 101, 191-208.
[151] J. S. Brodbelt, H. I. Kenttamaa, R. G. Cooks, Org. Mass Sperctrom. OMS
1988, 23, 6-9.
[152] S. T. Graul, R. R. Squires. J. Am. Chem. Soc. 1990, 112, 2517-2529.
[153] N. C. Polfer, Chem. Soc. Rev. 2011, 40, 2211-2221.
[154] A. G. Marshall, C. L. Hendrickson, G. S. Jackson, Mass Spectrom. Rev.
1998, 17 (1), 1-35.

181
[155] a) D. Schröder, H. Schwarz, D. E. Clemmer, Y. Chen, P. B. Armentrout, V.
Baranov, D. K. Bohme, Int. J. Mass Spectrom. Ion Proc. 1997, 161, 175; b)D.
Schröder, H. Schwarz, Can. J. Chem. 2005, 83, 1936.
[156] J. E. Bartmess, R. M. Georgiadis, Vacuum 1983, 33, 149.
[157] S. Gronert, Mass Spectrom. Rev. 2005, 24, 100.
[158] R.Lavertu, M. Catte, A.Pentenero, P. C. LeGoff, R. Seances Acad. Sci., Ser.
C 1966, 263, 1099.
[159] a) J. K. Terlouw, H. Schwarz, Angew. Chem., Int. Ed. Engl. 1987, 26, 805;
b) J. L. Holmes, Mass Spectrom. Rev. 1989, 8, 513; c) F. W. McLafferty,
Science 1990, 247, 925; d) F. W. McLafferty, Int. J. Mass Spectrom. Ion
Processes 1992,118/119, 221; e) F. Turecek, Org. Mass. Spectrom. 1992, 27,
1087.
[160] F. W. McLafferty, P. J. Todd, D. C. McGilvery, M. A. Baldwin, J. Am.
Chem. Soc. 1980, 102, 3360.
[161] P. C. Burgers, J. L. Holmes, A. A. Mommers, J. K. Terlouw, Chem. Phys.
Lett. 1983, 102, 1.
[162] G. Schmidt, W. H. Keeson, Physica 1937, 4(10), 963-970.
[163] P. Kapitza, Nature 1938, 141, 74.
[164] J. F. Allen, A. D. Misener, Nature 1938, 142, 643.
[165] T. A. Alvesalo, H. K. Collan, M. T. Loponen, O. V. Lounasmaa, M. C.
Veuro, J. Low Temp. Phys. 1975, 19, 1-37.
[166] K. K . Darrow, Rev. Mod. Phys. 1940, 12, 257-266.
[167] X. Zhang, N. B. Brauer, G. Berden, A. M. Rijs, M. J. Drabbels, Chem. Phys.
2012, 136, 044305–044310.
[168] a) A. Scheidemann, P. J. Toennies, J. A. Northby, Phys. Rev. Lett. 1990, 64,
1899–1902; b)

182
[169] W. Schöllkopf, S. Gewinner, H. Junkes, A. Paarmann, G. v. Helden, H.
Bluem, A. M. M. Todd, Proc. SPIE- Int. Soc. Opt. Eng. 2015, 9512, 95121L.
[170] G. de Petris, A. Cartoni, A. Troiani, V. Barone, P. Cimino, G. Angelini, O.
Ursini, Chem. Eur. J. 2010, 16, 6234.
[171] M. T. Bowers, T. Su, Interactions between Ions and Molecules, Plenum
Press, New York, 1975.

183

184
List of Publications
1) “Ab-initio and experimental study of pentose sugar dehydration
mechanism in the gas phase”
A. Ricci, S. Garzoli, L. Antonini, A. Troiani, C. Salvitti, P. Giacomello, R. Ragno,
A. Patsilinakos, B. Di Rienzo, F. Pepi, submitted.
2) “Vanadium hydroxide cluster ions in the gas phase: bond forming
reactions of doubly-charged negative ions by SO2-promoted V-O activation”
A. Troiani, M. Rosi, S. Garzoli, C. Salvitti, G. de Petris, Chemistry-A European
Journal 2017, 23(49), 11752-11756 (DOI:10.1002/chem.201702165).
3) “Synthesis and characterization of two new triads with ferrocene and C60
connected by triple bonds to the beta-positions of meso –
tetraphenylporphyrin”
F. Limosani, F. Possanza, E. Ciotta, F. Pepi, C. Salvitti, P. Tagliatesta, R.
Pizzoferrato, Journal of Porphyrins and Phthalocyanines 2017, 21(4-6), 364-370
(DOI: 10.1142/S1088424617500286).
4) “Vitamin C: an experimental and theoretical study on the gas phase
structure and ion energetics of protonated Ascorbic acid”
A. Ricci, F. Pepi, P. Cimino, A. Troiani, S. Garzoli, C. Salvitti, B. Di Renzo, V.
Barone, Journal of Mass Spectrometry 2016, 51(12), 1146-1151 (DOI: 10.1002/jms.3848).
5) “Characterization of naproxen-polymer conjugates for drug delivery”
G. Forte, I. Chiarotto, I. Giannicchi, M.A. Loreto, A. Martinelli, R. Micci, F. Pepi,
S. Rossi, C. Salvitti, A. Stringaro, L. Tortora, S. Vecchio Ciprioti, M. Feroci,
Journal of Biomaterials Science, Polymer Edition, 2015, 27(1), 69-85
(DOI:10.1080/09205063.2015.1108637).
6) “Iron-Promoted C-C bond formation in the gas phase”
A. Troiani, M. Rosi, S. Garzoli, C. Salvitti, G. de Petris, Angewandte Chemie,
International ed., 2015, 54 (48), 14359-14362 (DOI:10.1002/anie.201506932).
7) “A mass spectrometric study of the acid-catalysed D-fructose dehydration
in the gas phase”
F. Pepi, A. Ricci, S. Garzoli, A. Troiani, C. Salvitti, B. Di Rienzo, P. Giacomello,
Carbohydrate Research, 2015, 413, 145-150 (DOI:10.1016/j.carres.2015.05.013).
8) “All the 2p-block elements in a molecule: experimental and theoretical
studies of FBNCO and FBNCO+”
A. Troiani, S. Garzoli, F. Pepi, A. Ricci, M. Rosi, C. Salvitti, G. de Petris,
Chemical Communications 2014, 50 (90), 13900-13903
(DOI:10.1039/C4CC05217J).

185
9) “The oxidation of sulfur dioxide by single and double oxygen transfer
paths”
A. Troiani, M. Rosi, C. Salvitti, G. de Petris, ChemPhysChem 2014, 15 (13),
2723-2731 (DOI:10.1002/cphc.201402306).

186
Acknowledgments
“Quanti di voi hanno avuto un insegnante, in qualunque grado di istruzione, che
vi ha resi più entusiasti di essere al mondo, più fieri di essere al mondo, di quanto
credevate possibile fino a quel momento? Alzate le mani, per favore. Adesso
riabbassatele e dite il nome di questo insegnante ad un vostro vicino, e spiegategli
che cosa ha fatto per voi. Ci siamo? Cosa c’è di più bello di questo?”
Kurt Vonnegut
Si conclude dopo tre anni il mio percorso di dottorato e la fine di questa
esperienza porta con sé riflessioni inevitabili su quanto abbia contribuito a
cambiarmi.
Fortunatamente l’inestimabile valore letterario di uno scrittore come Kurt
Vonnegut viene in mio soccorso e mi offre lo spunto almeno per scrivere il
capitolo conclusivo di questa avventura. Mi perdonerà, dunque, se per rispondere
alla sua domanda non potrò esimermi dal fare più di un solo nome.
Ringrazio il Prof. Federico Pepi e la Prof.ssa Giulia de Petris per avermi accolto
nei loro laboratori, per essere sempre stati disponibili nei miei riguardi e non
essersi mai sottratti a qualsiasi occasione di confronto. Se dovessi materialmente
ripagarvi di tutto questo, probabilmente il mio sarebbe un debito troppo grande da
estinguere.
Ringrazio la Prof.ssa Andreina Ricci per avermi dato la possibilità di
approcciarmi ad una linea di ricerca così interessante e per essermi stata vicina
quando per la prima volta ho dovuto relazionare ad un congresso.
Ringrazio la Dott.ssa Anna Troiani e la Dott.ssa Stefania Garzoli per avermi
“praticamente” allevato, facendomi appassionare alla materia. Grazie per essere
state sempre un punto di riferimento oltre il lavoro; se in questi anni ho avuto
bisogno di un consiglio disinteressato, di una parola di supporto o di una semplice
chiacchierata ho sempre saputo a quale porta bussare.
Ringrazio il Prof. Kevin Pagel perché, pur non conoscendomi, mi ha ospitato con
entusiasmo nel suo laboratorio, permettendomi di vivere da berlinese per cinque
intensi mesi. Grazie ai suoi ragazzi che non mi hanno mai fatto sentire esclusa in

187
nessuna occasione e con i quali serbo tuttora dei ricordi che porterò sempre con
me.
Infine, volevo ringraziare la Prof.ssa Isabella Chiarotto e la Prof.ssa Marta Feroci
perché se ho scelto di proseguire la carriera accademica è anche merito loro e
perché ovunque io sia arrivata non dimenticherò mai da dove sono partita.