a “gap-model” based framework for online vvoip qoe measurement
TRANSCRIPT

1
A “GAP-Model” based Framework for OnlineVVoIP QoE Measurement
Prasad Calyam, Eylem Ekici, Chang-Gun Lee, Mark Haffner, Nathan Howes
Abstract: Increased access to broadband networks has led to afast-growing demand for Voice and Video over IP (VVoIP) appli-cations such as Internet telephony (VoIP), videoconferencing,andIP television (IPTV). For pro-active troubleshooting of VVoIP per-formance bottlenecks that manifest to end-users as performanceimpairments such as video frame freezing and voice dropouts, net-work operators cannot rely on actual end-users to report theirsub-jectiveQuality of Experience (QoE). Hence, automated andobjec-tive techniques that provide real-time or online VVoIP QoE esti-mates are vital. Objective techniques developed to-date estimateVVoIP QoE by performing frame-to-frame Peak-Signal-to-NoiseRatio (PSNR) comparisons of the original video sequence and thereconstructed video sequence obtained from the sender-side andreceiver-side, respectively. Since processing such video sequencesis time consuming and computationally intensive, existing objec-tive techniques cannot provide online VVoIP QoE. In this paper,we present a novel framework that can provide online estimates ofVVoIP QoE on network paths without end-user involvement andwithout requiring any video sequences. The framework featuresthe “GAP-Model”, which is an offline model of QoE expressed asa function of measurable network factors such as bandwidth, de-lay, jitter, and loss. Using the GAP-model, our online frameworkcan produce VVoIP QoE estimates in terms of “Good”, “Accept-able” or “Poor” (GAP) grades of perceptual quality solely from theonline measured network conditions.
Index Terms: Network management, user QoE, video quality.
I. Introduction
Voice and Video over IP (VVoIP) applications such as Internettelephony (VoIP), videoconferencing and IP television (IPTV)are being widely deployed for communication and entertain-ment purposes in academia, industry and residential commu-nities. Increased access to broadband networks and significantdevelopments in VVoIP communication protocols viz., H.323(ITU-T standard) and SIP (IETF standard), have made large-scale VVoIP deployments possible and affordable.
For pro-active identification and troubleshooting of VVoIPperformance bottlenecks, network operators need to performreal-time or online monitoring of VVoIP QoE on their opera-tional network paths on the Internet. Network operators cannotrely on actual end-users to report theirsubjectiveVVoIP QoEon an on-going basis. For this reason, they require measure-ment tools that use automated andobjectivetechniques whichdo not involve end-users for providing on-going online estimatesof VVoIP QoE.
Manuscript received May 15, 2007; approved for publicationby Eiji Oki, Oc-tober 30, 2007.
P. Calyam is with the Ohio Supercomputer Center, Email: [email protected];E. Ekici, M. Haffner and N. Howes are with The Ohio State University, Email:[email protected], {haffner.12,howes.16}@osu.edu; C. -G. Lee, the corre-sponding author, is with the Seoul National University, Email: [email protected]
Objective techniques [1] and [2] developed to-date esti-mate VVoIP QoE by performing frame-to-frame Peak-Signal-to-Noise Ratio (PSNR) comparisons of the original video se-quence and the reconstructed video sequence obtained from thesender-side and receiver-side, respectively. PSNR for a set ofvideo signal frames is given by Equation (1).
PSNR(n)db = 20log10
(
Vpeak
RMSE
)
(1)
where, signalVpeak = 2k - 1; k = number of bits per pixel (lu-minance component);RMSEis the mean square error of the Nth
column and Nth row of sent and received video signal framen. Thus obtained PSNR values are expressed in terms of end-user VVoIP QoE that is quantified using the widely-used “MeanOpinion Score” (MOS) ranking method [3]. This method ranksperceptual quality of an end-user on a subjective quality scaleof 1 to 5. Figure 1 shows the linear mapping of PNSR valuesto MOS rankings. The [1, 3) range corresponds to “Poor” gradewhere an end-user perceives severe and frequent impairmentsthat make the application unusable. The [3, 4) range corre-sponds to “Acceptable” grade where an end-user perceives inter-mittent impairments yet the application is mostly usable. Lastly,the [4, 5] range corresponds to “Good” grade where an end-userperceives none or minimal impairments and the application isalways usable.
Fig. 1. Mapping of PSNR values to MOS rankings
Such a PSNR-mapped-to-MOS technique can be termed as anoffline technique because: (a) it requires time and spatial align-ment of the original and reconstructed video sequences, which istime consuming to perform, and (b) it is computationally inten-sive due to its per-pixel processing of the video sequences.Suchoffline techniques are hence not useful for measuring real-timeor online VVoIP QoE on the Internet. In addition, the PSNR-mapped-to-MOS technique does not address impact of the jointdegradation of voice and video frames. Hence, impairments thatannoy end-users such as “lack of lip synchronization” [4] due tovoice trailing or leading video are not considered in the end-userQoE estimation.
1229-2370/03/$10.00c© 2007 KICS

2
To address these problems, we present a novel framework inthis paper that can provideonlineobjective estimation of VVoIPQoE on network paths: (a) without end-user involvement forquality rankings, (b) without requiring any video sequences,and (c) considering joint degradation effects of both voiceandvideo. Figure 2 shows our overall framework to produce on-line VVoIP QoE estimates. The framework is based on theoffline constructed, psycho-acoustic/visual cognitive model ofQoE called “GAP-Model”. For its construction, we use a novelclosed-network test methodology that asks human subjects torank QoE of streaming and interactive audio/video clips forawide range of network conditions. The collected human subjectrankings are fed into the multiple-regression analysis resultingin closed-form expressions of QoE as functions of measurablenetwork factors such as bandwidth, delay, jitter, and loss.Usingsuch an offline constructed GAP-model, our online frameworkcan estimate QoE of an online VVoIP session solely from (i) thecontinuously measured network conditions, and (ii) the VVoIPsession information. Prior to the VVoIP session establishment orwhile the session is ongoing, our framework can estimate QoEfollowing the flow of Figure 2. The VVoIP session informationrequest (t)specifies the test session’s peak video encoding rateand whether the session involvesstreamingor interactiveVVoIPstreams. A streaming session is comprised of one-way streamswhere an end-user passively receives audiovisual content froma source at the head-end (i.e., IPTV). In comparison, an inter-active session is comprised of bi-directional streams where end-users on both ends interact with each other (i.e., videoconfer-encing). The online network conditions are measured by testinitiation att using a VVoIP-session-traffic emulation tool called“Vperf” [5] that we have developed. After the test durationδtthat is required to obtain a statistically stable measurement, thenetwork condition measured in terms of network factors viz.,bandwidth (t+δt), delay (t+δt), jitter (t+ δt) and loss (t+δt) areinput to the GAP-Model. The GAP-Model then produces a testreport instantly with a VVoIP QoE estimateMOS (t+δt) in termsof “Good”, “Acceptable” or “Poor” (GAP) grades.
Fig. 2. Online VVoIP QoE Measurement Framework
The remainder of the paper is as follows: Section II presentsrelated work. Section III describes a VVoIP system and definesrelated terminology. Section IV explains the closed-networktest methodology. Section V discusses the GAP-Model basedframework implementation featuring the Vperf tool and its ap-plication. Section VI presents the performance evaluationandvalidation of the GAP-Model. Section VII concludes the paper.
II. Related Work
Objective techniques that use computational models to ap-proximate subjective QoE (MOS) have been widely studied forVoIP applications [6] [7] [8] [9]. The E-model [6] is one suchtechnique that has been repeatedly proven to be effective andthus has been widely adopted in measurement tools developedby industry (e.g., Telchemy’s VQMon [10]) and open-sourcecommunity (e.g., OARnet H.323 Beacon [11]). The primaryreason for E-model’s success is its ability to provide online esti-mates of VoIP QoE based on instantaneous network health mea-surements (i.e., packet delay, jitter and loss) for a given voice en-coding scheme. Before E-model, the only available techniqueswere offline techniques such as PESQ [7] that are not suited foronline monitoring of end-user VoIP QoE. The PESQ is an of-fline technique because it requires the source-side reference au-dio signal and its corresponding receiver-side audio signal thathas experienced degradation due to network conditions.
Although the E-Model is effective for online VoIP QoE mea-surements, the considerations used in the E-model are not per-tinent for VVoIP QoE measurements due to idiosyncrasies inthe video traffic encoding and impairment characteristics.TheE-Model considers voice traffic as Constant Bit Rate (CBR) en-coded with constant packet sizes and fixed data rates that areknown for a given voice codec with a set audio sampling fre-quency. In comparison, the video traffic is Variable Bit Rate(VBR) encoded with variable packet sizes and bursty data ratesthat depend upon the temporal and spatial nature of the videosequences. Also, E-model considers voice signals to be af-fected by impairments such as drop-outs, loudness and echoeswhereas, video signals are affected by impairments such asframe freezing, jerky motion, blurriness and tiling [12].
To estimate video QoE affected by network conditions, themost widely adopted technique is the PSNR-mapped-to-MOStechnique which is offline in nature as described in Section I.The traditional PSNR-mapped-to-MOS technique was proven tobe inaccurate in terms of correlation with perceived visualqual-ity in many cases due to non-linear behavior of the human visualsystem for compression impairments [13] [14] [15]. It is nowanestablished fact that end-user QoE and the pixel-to-pixel-baseddistances between original and received sequences consideredin the PSNR-mapped-to-MOS technique do not always match-up with one another. Hence, several modifications have beenmade to the traditional PSNR-mapped-to-MOS technique to im-prove its estimation accuracy. The improved PSNR-mapped-to-MOS technique has been ratified by communities such as theITU-T in their J.144 Recommendation [2] and the ANSI in theirT1.801.03 Standard [16]. It is relevant to note that there are sev-eral other objective techniques to measure VVoIP QoE such asITS, MPQM, and NVFM [35] that are all offline in nature andare comparable to the PSNR-mapped-to-MOS technique.
Recently, there have been attempts in works such as [17], [18]and [19] to develop a novel technique that can produce on-line VVoIP QoE estimates. In [17], video distortion due topacket loss is estimated using a loss-distortion model. Theloss-distortion model uses online packet loss measurements and takesinto account other inputs such as video codec type, coded bitrateand packetization to estimate online PSNR values. The limita-tion of this work is that the PSNR degradation was not com-
3
pared with subjective assessments from actual human subjectsand hence the approach effectiveness is questionable. In [18], aHuman Visual System (HVS) model is proposed that producesvideo QoE estimates without requiring reconstructed videose-quences. This study validated their estimation accuracy withsubjective assessments from actual human subjects, however,the HVS model is primarily targeted for 2.5/3G networks. Con-sequently, it only accounts for PSNR degradation for onlinemeasurements of noisy wireless channels with low video encod-ing bit rates. In [19], a random neural network (RNN) model isproposed that takes video codec type, coded bit rate, packetlossas well as loss burst size as inputs and produces real-time MOSestimates. All of the above models do not address end-user inter-action QoE issues that are affected by excessive network delayand jitter. Further, these studies do not address issues relatingto the joint degradation of voice and video frames in the end-user VVoIP QoE estimation. In comparison, our GAP-Modeladdresses these issues as well in the online VVoIP QoE estima-tion.
III. VVoIP System Description
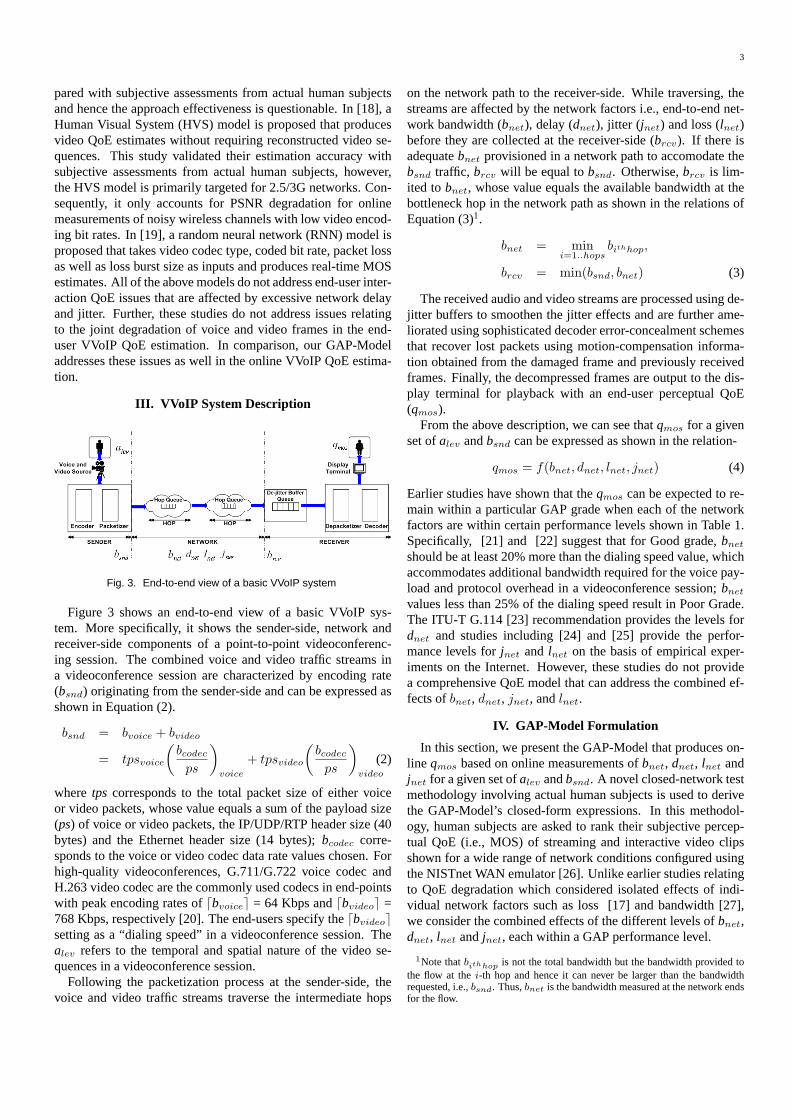
Fig. 3. End-to-end view of a basic VVoIP system
Figure 3 shows an end-to-end view of a basic VVoIP sys-tem. More specifically, it shows the sender-side, network andreceiver-side components of a point-to-point videoconferenc-ing session. The combined voice and video traffic streams ina videoconference session are characterized by encoding rate(bsnd) originating from the sender-side and can be expressed asshown in Equation (2).
bsnd = bvoice + bvideo
= tpsvoice
(
bcodec
ps
)
voice
+ tpsvideo
(
bcodec
ps
)
video
(2)
where tps corresponds to the total packet size of either voiceor video packets, whose value equals a sum of the payload size(ps) of voice or video packets, the IP/UDP/RTP header size (40bytes) and the Ethernet header size (14 bytes);bcodec corre-sponds to the voice or video codec data rate values chosen. Forhigh-quality videoconferences, G.711/G.722 voice codec andH.263 video codec are the commonly used codecs in end-pointswith peak encoding rates ofdbvoicee = 64 Kbps anddbvideoe =768 Kbps, respectively [20]. The end-users specify thedbvideoesetting as a “dialing speed” in a videoconference session. Thealev refers to the temporal and spatial nature of the video se-quences in a videoconference session.
Following the packetization process at the sender-side, thevoice and video traffic streams traverse the intermediate hops
on the network path to the receiver-side. While traversing, thestreams are affected by the network factors i.e., end-to-end net-work bandwidth (bnet), delay (dnet), jitter (jnet) and loss (lnet)before they are collected at the receiver-side (brcv). If there isadequatebnet provisioned in a network path to accomodate thebsnd traffic, brcv will be equal tobsnd. Otherwise,brcv is lim-ited tobnet, whose value equals the available bandwidth at thebottleneck hop in the network path as shown in the relations ofEquation (3)1.
bnet = mini=1..hops
bithhop,
brcv = min(bsnd, bnet) (3)
The received audio and video streams are processed using de-jitter buffers to smoothen the jitter effects and are further ame-liorated using sophisticated decoder error-concealment schemesthat recover lost packets using motion-compensation informa-tion obtained from the damaged frame and previously receivedframes. Finally, the decompressed frames are output to the dis-play terminal for playback with an end-user perceptual QoE(qmos).
From the above description, we can see thatqmos for a givenset ofalev andbsnd can be expressed as shown in the relation-
qmos = f(bnet, dnet, lnet, jnet) (4)
Earlier studies have shown that theqmos can be expected to re-main within a particular GAP grade when each of the networkfactors are within certain performance levels shown in Table 1.Specifically, [21] and [22] suggest that for Good grade,bnet
should be at least 20% more than the dialing speed value, whichaccommodates additional bandwidth required for the voice pay-load and protocol overhead in a videoconference session;bnet
values less than 25% of the dialing speed result in Poor Grade.The ITU-T G.114 [23] recommendation provides the levels fordnet and studies including [24] and [25] provide the perfor-mance levels forjnet and lnet on the basis of empirical exper-iments on the Internet. However, these studies do not providea comprehensive QoE model that can address the combined ef-fects ofbnet, dnet, jnet, andlnet.
IV. GAP-Model Formulation
In this section, we present the GAP-Model that produces on-line qmos based on online measurements ofbnet, dnet, lnet andjnet for a given set ofalev andbsnd. A novel closed-network testmethodology involving actual human subjects is used to derivethe GAP-Model’s closed-form expressions. In this methodol-ogy, human subjects are asked to rank their subjective percep-tual QoE (i.e., MOS) of streaming and interactive video clipsshown for a wide range of network conditions configured usingthe NISTnet WAN emulator [26]. Unlike earlier studies relatingto QoE degradation which considered isolated effects of indi-vidual network factors such as loss [17] and bandwidth [27],we consider the combined effects of the different levels ofbnet,dnet, lnet andjnet, each within a GAP performance level.
1Note thatbithhop is not the total bandwidth but the bandwidth provided tothe flow at thei-th hop and hence it can never be larger than the bandwidthrequested, i.e.,bsnd. Thus,bnet is the bandwidth measured at the network endsfor the flow.

4
Table 1. qmos GAP grades and performance levels of network factors for dbvideoe = 768 Kbps
Network Factor Good Acceptable Poorbnet (>922] Kbps (576-922) Kbps [0-576) Kbpsdnet [0-150) ms (150-300) ms (>300] mslnet [0-0.5) % (0.5-1.5) % (>1.5] %jnet [0-20) ms (20-50) ms (>50] ms
Although such a consideration reflects the reality of the net-work conditions seen on the Internet, modelingqmos as a func-tion of the four network factors in three different levels leadsto a large number of test cases (i.e., 34 = 81 test cases) per hu-man subject. The test cases can be ordered based on increas-ing network condition severity and listed as [< GGGG >,< GGGA >, < GGAG >, ..., < APPP >, < PPPP >],where each test case is defined by a particular sequence of thenetwork factor levels< bnet dnet lnet jnet >. For example,the < GGGG > test case corresponds to the network con-dition wherebnet, dnet, lnet and jnet are in their Good gradelevels. Administering all the 81 test cases per human subjectis an expensive process and also involves long hours of testingthat is burdensome and exhaustive to the human subject. Con-sequently, the perceptual QoE rankings provided by the humansubject may be highly error-prone.
To overcome this, we present a novel closed-network testmethodology that significantly reduces the number of test casesand hence the testing time for human subjects for providingrankings without compromising the rankings data required foradequate model coverage. We note that our test methodologycan be generalized for any voice (e.g. G.711, G.722, G.723) andvideo codec (e.g. MPEG-x, H.26x). For simplicity, we focusour testing to only the most commonly used codecs i.e., G.722voice codec and the H.263 video codec. These codecs are themost commonly used for business quality videoconferences asobserved from our experiences during routine videoconferenc-ing operations at the Ohio Supercomputer Center2. They arealso the most commonly used codecs on video file sharing sitessuch as MySpace and Google Video.
In the following subsections, we first explain the test case re-duction strategies of our novel closed-network test methodol-ogy. Next, we describe our closed-network testing with actualhuman subjects. Finally, we explain how theqmos rankings ob-tained from the human subjects are processed to formulate theGAP-Model’s closed-form expressions.
A. Test Case Reduction Strategies
To reduce the number of test cases per human subject forproviding rankings without compromising the rankings datare-quired for adequate model coverage, we use two strategies: (i)reduction based on network condition infeasibility and (ii) re-duction based on human subjects’ ranking inference.
2Majority of today’s videoconferencing end-points use the H.263 video codecand a small fraction of the latest end-points support the H.264 video codec,which is an enhanced version of the H.263 codec targeted mainly for improvedcodec performance at low bit rates.
Fig. 4. jnet measurements for increasing bnet
A.1 Reduction Based on Network Condition Infeasibility
For this strategy, we perform a network emulator qualificationstudy to identify any practically infeasible network conditionsi.e., test cases that do not exist in reality. The NISTnet WANem-ulator is connected in between two isolated LANs, each having ameasurement server with the Iperf tool [28] installed. Differentnetwork conditions are emulated with one factor as the controland the other factors as the response. For example, if we usebnet as the control, then the responses of the other three factorsdnet, lnet and jnet are measured and so on. All measurementsare from Iperf for 768 Kbps UDP traffic streams transferred be-tween the two LANs via NISTnet.
Figures 4 and 5 show the Iperf measurement results that in-dicate the infeasible network conditions. The results are av-eraged over 20 measurement runs of Iperf for each networkcondition configuration on NISTnet. From Figure 4 we cansee that there cannot be a network condition that has Goodjnet and Poorbnet simultaneously. Hence,< P ∗ ∗G > (=1x3x3x1 = 9) test cases cannot be emulated in reality. Note herethat we use our previously defined network condition notation< bnet dnet lnet jnet > and we assume ‘*’ can be substitutedwith either one of the GAP grades. Similarly, from Figure 5we can see that there cannot be network conditions that haveGood/Acceptablelnet and Poorbnet simultaneously. Hence,< P ∗G∗ >, < P ∗A∗ >, < A∗G∗ > and< A∗A∗ > (9x4 =36) test cases do not exist in reality. By considering all theinfea-sible network conditions, we can get rid of 39 test cases. Hence,we can reduce the number of test cases to 42 (39 subtracted from81) per human subject for adequate model coverage.
A.2 Reduction Based on Human Subjects’ Ranking Inference
In this subsection, we explain another strategy to further re-duce the number of test cases per human subject for providingrankings without compromising the data required for adequatemodel coverage. The basic idea of this strategy is to eliminatemore severe test cases during the testing based on the Poor rank-

5
Fig. 5. lnet measurements for increasing bnet
ings given by human subjects for relatively less severe testcases.For example, if a human subject ranked test case< GPPP >
with an extremely Poorqmos ranking (< 2), it can be inferredthat more severe test cases< APPP > and< PPPP > pre-sented to the human subject will also result in extremely Poorqmos. Hence, we do not administer the< APPP > and< PPPP > test cases to the human subject during testing butassign the same Poorqmos ranking obtained for< GPPP >
test case to the< APPP > and< PPPP > test cases in thehuman subject’s final testing results. To implement the abovetest case reduction strategy, we present the test cases within-creasing severity (< GGGG > to < PPPP >).
Fig. 6. (a) VF test case ordering (b) HF test case ordering
Further, the test case reduction strategy can be implementedby increasing the test case severity order in two ways: (i)Vertical-First (VF) or (ii) Horizontal-First (HF) - shown inFigure 6 (a) and (b), respectively. Using VF ordering, after< GGGA >, the next severe condition in the test case list ischosen as< GGGP > where the severity is increased verti-cally (note that< GGGA >, < GGAG > and< GAGG >
are equivalent severe conditions); whereas, using HF ordering,the next severe condition is chosen as< GGAA > where theseverity is increased horizontally. In the event that< GGAA >
test case receives an extremely Poorqmos ranking (< 2) by ahuman subject, 36 (= 3x3x2x2) test cases get eliminated usingthe inference strategy. Alternately, if< GGGP > test case re-ceives an extremely Poorqmos ranking, only 27 (= 3x3x3x1) testcases get eliminated. Hence, using the VF ordering, relativelylesser test cases are eliminated when an extremely Poorqmos
ranking occurs. Although HF ordering reduces the testing timecompared to the VF ordering, we choose the VF ordering in thehuman subject testing because it produces more data points andthus relatively better model coverage.
B. Closed-network testing
B.1 Test Environment Setup
Fig. 7. Test environment setup for the closed-network testing
Fig. 8. Screenshot of chat client application with quality assessmentslider
Figure 7 shows the test environment we setup that incorpo-rated the key considerations suggested in ITU-T P.911 [29] andITU-T P.920 [30] for streaming and interactive multimedia QoEassessment tests, respectively. An isolated LAN testbed wasused with no network cross-traffic whatsoever. The test stationat the human subject end was setup in a quiet room with suf-ficient light and ventilation. The test station correspondsto aPC that runs a chat client application (shown in Figure 8) anda videoconferencing end-point connected to a display terminal.The chat client application uses the “quality assessment slider”methodology recommended by [3] for recording human subjectrankings. The chat client application allowed the human sub-ject to: (a) communicate his/her test readiness using the “BeginTest” button, (b) indicate completion of his response during in-teractive test clips using the “Response Complete” button,and(c) submit subjective rankings using the “MOS Ranking” fieldat the end of each test case - to the test administrator present ina separate room. The videoconferencing end-point was used toview the streaming and interactive test clips.
The test administrator end was equipped with a PC that ranthe chat server application. The test administrator end wasalsoequipped with a videoconferencing end-point connected to adisplay terminal as well as a test clips source that had the stream-ing and interactive test clips. The test administrator controlledthe test clips source and the NISTnet through a control soft-ware embedded within the chat server application. The controlsoftware guided the test administrator through the different se-quential steps involved in the testing and automated core actionsto control the clips source and the NISTnet configurations. To

6
show how we addressed the difficult challenges in implementingthe interactive tests and made them repeatible through automa-tion, we present the pseudo-code of the control software fortheinteractive tests in the following:
Pseudo-code of the control software forinteractive tests
Input: 42 test cases list for interactive testsOutput: Subjective MOS rankings for the 42 test casesBegin Procedure1. Step-1: Initialize Test2. Preparej = 1. . . 42 test cases list with increasing network condition severity3. Initialize NISTnet WAN emulator by loading the kernel module and flushinginbound/outbound pipes4. Initialize playlist in interactive clip source5. Play interactive “baseline clip” for human subject no-impairment stimulusreference6. Step-2: Begin Test7. Enterith human subject ID8. loop for j test cases:if (Check for receipt ofjth “Begin Test” message)9. Flush NISTnet WAN emulator’s inbound/outbound pipes10. Configure the network condition commands on NISTnet WAN emula-tor for jth test case11. Play interactive test clip from clips source12. Pause interactive test clip at the time point where human subject re-sponse is desired13. if (Check for receipt of “Response Complete” message)14. Continue playing the interactive test clip from the clips source15. end if16. if (Check for receipt of “MOS Ranking” message)17. Reset interactive test clip in the clips source18. Saveith human subject’sjth interactive MOS ranking to database19. if (ith human subject’sjth interactive MOS ranking< 2)20. Removek corresponding higher severity test cases from testcase list21. for eachk22. Assignith human subject’sjth interactive MOS ranking23. end for24. end if25. Incrementj26. end if27. end loop28. Step-3: End Test29. Shutdown the NISTnet WAN emulator by unloading the kernelmodule30. Close playlist in interactive clip sourceEnd Procedure
B.2 Human Subject Selection
Human subject selection was performed in accordance withthe Ohio State University’s Institutional Review Board (IRB)guidelines for research involving human subjects. The guide-lines insist that human subjects should voluntarily participate inthe testing and must provide written consent. Further, the humansubjects must be informed prior about the purpose, procedure,potential risks, expected duration, confidentiality protection, le-gal rights and possible benefits of the testing. Regarding thenumber of human subjects for testing, ITU-T recommends 4 asa minimum total for statistical soundness [19].
To obtain a broad range of subjective quality rankings fromour testing, we selected a total of 21 human subjects evenly dis-tributed across three categories (7 human subjects per category):(i) Expert user, (ii) General user, and (iii) Novice user. AnEx-pert user is one who has considerable business-quality video-conferencing experience due to regular usage and has in-depthsystem understanding. A General user is one who has moderateexperience due to occasional usage and has basic system under-standing. A Novice user is one who has little prior business-
quality videoconferencing experience but has basic systemun-derstanding. Such a categorization allowed collection of sub-jective quality rankings that reflect the perceptual quality id-iosyncrasies dependent on a user’s experience level with VVoIPtechnology. For example, an Expert user considers lack of lip-synchronization as a more severe impairment than audio drop-outs, which happens to be the most severe impairment for aNovice user - while penalizing MOS rankings.
B.3 Video Clips
For test repeatability, each human subject was exposed to twosets of clips for which, he/she providedqmos rankings. Thefirst set corresponded to a streaming video clipStreaming-Kellyand the second set corresponded to an interactive video clipInteractive-Kelly, both played for the different network condi-tions specified in the test case list. These two video clips wereencoded at 30 frames per second in CIF format (352 lines x288 pixels). The duration of each clip was approximately 120seconds and hence provided each human subject with enoughtime to assess perceptual quality. Our human subject trainingmethod to rank the video clips is based on the “Double Stimu-lus Impairment Scale Method” described in the ITU-R BT.500-10 recommendation [31]. In this method,baselineclips of thestreaming and interactive clips are played to the human subjectbefore commencement of the test cases. These clips do not haveany impairment due to network conditions i.e.,qmos rankingfor these clips is 5. The human subjects are advised to ranktheir subjective perceptual quality for the test cases relative tothe baseline subjective perceptual quality.
B.4 Test Cases Execution
Before commencement of the testing, the training time perhuman subject averaged about 15 minutes. Each set of test casesper human subject for the streaming as well as interactive videoclips lasted approximately 45 minutes. Such a reasonable testingtime was achieved due to: (a) our test case reduction strategydescribed in Section IV that reduced the 81 possible test casesto a worst case testing of 42 test cases, and (b) our test casereduction strategy described in Section IV that further reducedthe number of test cases during the testing based on inferencefrom the subjective rankings.
For emulating the network condition as specified by a testcase, the network factors had to be configured on NISTnet toany values within their corresponding GAP performance lev-els shown in Table 1. We configured values in the performancelevels for the network factors as shown in Table 2. For exam-ple, for the< GGGG > test case, the NISTnet configurationwas< bnet = 960Kbps; dnet = 80ms; lnet = 0.25%; jnet =10ms >. The reason for choosing these values was that theinstantaneous values for a particular network condition config-uration vary around the configured value (although the averageof all the instantaneous values over time is approximately equalto the configured value). Hence, choosing the values shown inTable 2 enabled sustaining the instantaneous network conditionsto be within the desired performance levels for the test caseex-ecution duration.
7
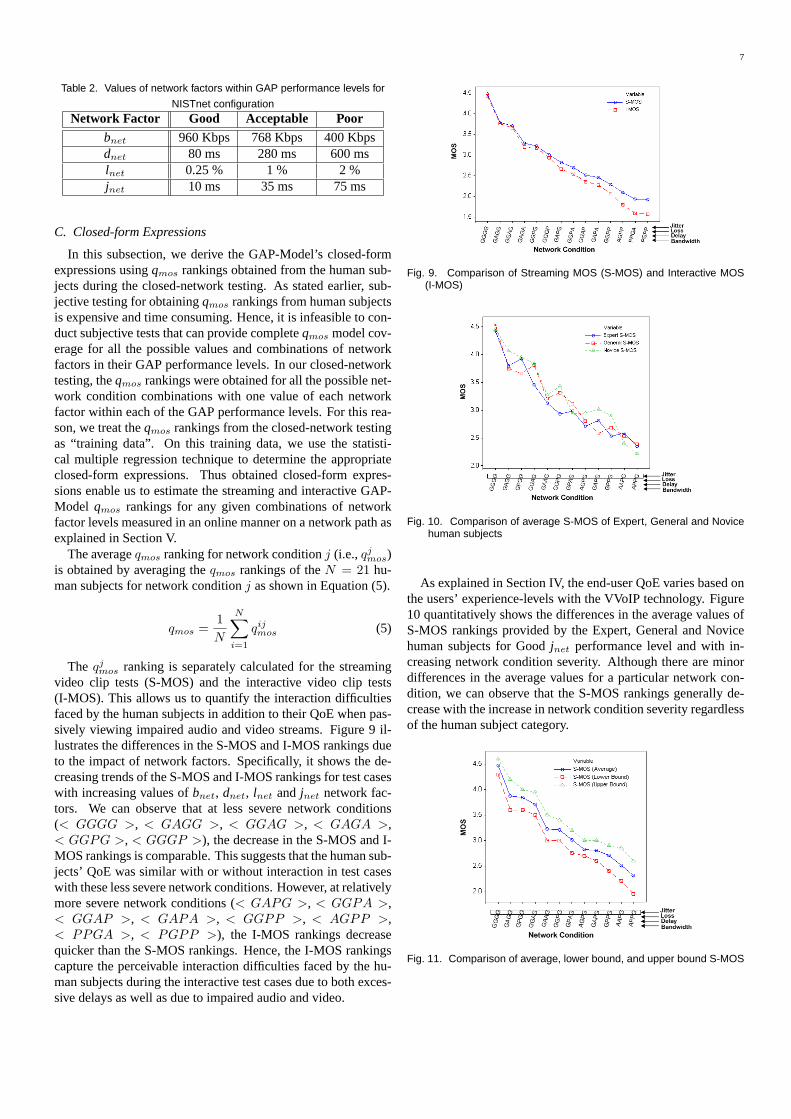
Table 2. Values of network factors within GAP performance levels for
NISTnet configurationNetwork Factor Good Acceptable Poor
bnet 960 Kbps 768 Kbps 400 Kbpsdnet 80 ms 280 ms 600 mslnet 0.25 % 1 % 2 %jnet 10 ms 35 ms 75 ms
C. Closed-form Expressions
In this subsection, we derive the GAP-Model’s closed-formexpressions usingqmos rankings obtained from the human sub-jects during the closed-network testing. As stated earlier, sub-jective testing for obtainingqmos rankings from human subjectsis expensive and time consuming. Hence, it is infeasible to con-duct subjective tests that can provide completeqmos model cov-erage for all the possible values and combinations of networkfactors in their GAP performance levels. In our closed-networktesting, theqmos rankings were obtained for all the possible net-work condition combinations with one value of each networkfactor within each of the GAP performance levels. For this rea-son, we treat theqmos rankings from the closed-network testingas “training data”. On this training data, we use the statisti-cal multiple regression technique to determine the appropriateclosed-form expressions. Thus obtained closed-form expres-sions enable us to estimate the streaming and interactive GAP-Model qmos rankings for any given combinations of networkfactor levels measured in an online manner on a network path asexplained in Section V.
The averageqmos ranking for network conditionj (i.e.,qjmos)
is obtained by averaging theqmos rankings of theN = 21 hu-man subjects for network conditionj as shown in Equation (5).
qmos =1
N
N∑
i=1
qijmos (5)
The qjmos ranking is separately calculated for the streaming
video clip tests (S-MOS) and the interactive video clip tests(I-MOS). This allows us to quantify the interaction difficultiesfaced by the human subjects in addition to their QoE when pas-sively viewing impaired audio and video streams. Figure 9 il-lustrates the differences in the S-MOS and I-MOS rankings dueto the impact of network factors. Specifically, it shows the de-creasing trends of the S-MOS and I-MOS rankings for test caseswith increasing values ofbnet, dnet, lnet and jnet network fac-tors. We can observe that at less severe network conditions(< GGGG >, < GAGG >, < GGAG >, < GAGA >,< GGPG >, < GGGP >), the decrease in the S-MOS and I-MOS rankings is comparable. This suggests that the human sub-jects’ QoE was similar with or without interaction in test caseswith these less severe network conditions. However, at relativelymore severe network conditions (< GAPG >, < GGPA >,< GGAP >, < GAPA >, < GGPP >, < AGPP >,< PPGA >, < PGPP >), the I-MOS rankings decreasequicker than the S-MOS rankings. Hence, the I-MOS rankingscapture the perceivable interaction difficulties faced by the hu-man subjects during the interactive test cases due to both exces-sive delays as well as due to impaired audio and video.
Fig. 9. Comparison of Streaming MOS (S-MOS) and Interactive MOS(I-MOS)
Fig. 10. Comparison of average S-MOS of Expert, General and Novicehuman subjects
As explained in Section IV, the end-user QoE varies based onthe users’ experience-levels with the VVoIP technology. Figure10 quantitatively shows the differences in the average values ofS-MOS rankings provided by the Expert, General and Novicehuman subjects for Goodjnet performance level and with in-creasing network condition severity. Although there are minordifferences in the average values for a particular network con-dition, we can observe that the S-MOS rankings generally de-crease with the increase in network condition severity regardlessof the human subject category.
Fig. 11. Comparison of average, lower bound, and upper bound S-MOS

8
To estimate the possible variation range around the averageqmos ranking influenced by the human subject category for agiven network condition, we determine additionalqmos typesthat correspond to the25th percentile and75th percentile ofthe S-MOS and I-MOS rankings. We refer to these additionalqmos types as “lower bound” and “upper bound” S-MOS andI-MOS. Figure 11 quantitatively shows the differences in theupper bound, lower bound and average values of S-MOS rank-ings provided by the human subjects for Goodjnet performancelevel and with increasing network condition severity. We ob-served similar differences in the upper bound, lower bound andaverageqmos rankings for both S-MOS and I-MOS under othernetwork conditions as well but those observations are not in-cluded in this paper due to space constraints.
Based on the above description of average, upper bound andlower boundqmos types for S-MOS and I-MOS rankings, werequire six sets of regression surface model parameters foron-line estimation of GAP-Modelqmos rankings. To estimate theregression surface model parameters, we observe the diagnos-tic statistics pertaining to the model fit adequacy obtainedbyfirst-order and second-order multiple-regression on the stream-ing and interactiveqmos rankings in the training data. The di-agnostic statistics for the first-order multiple-regression showrelatively higher residual error compared to the second-ordermultiple-regression due to lack-of-fit and lower coefficient ofdetermination (R-sq) values. Note that the R-sq parameter indi-cates how much variation of the response i.e.,qmos is explainedby the model. The R-sq values were less than 88% in the first-order multiple-regression and greater than 97% in the second-order multiple-regression. Hence, the diagnostic statistics sug-gest that a quadratic model better represents the curvatureinthe I-MOS and S-MOS response surfaces than a linear model.Table 3 shows the significant (non-zero) quadratic regressionmodel parameters for the six GAP-Modelqmos types, whosegeneral representation is given as follows:
qmos = C0 + C1bnet + C2dnet + C3lnet + C4jnet
+C5l2
net + C6j2
net + C7dnetlnet + C8lnetjnet (6)
V. Framework Implementation and its Application
The salient components and workflows of the GAP-Modelbased framework were described briefly in Section 1 using theillustration shown in Figure 2. We now describe the details ofthe framework implementation. The implementation basicallyfeatures the Vperf tool to which a test request can be input byspecifying the desired VVoIP session information. The VVoIPsession information pertains to the session’s peak video encod-ing rate i.e., 256, 384 or 768 Kbps dialing speed and the sessiontype i.e., streaming or interactive. Given a set of such inputs,Vperf initiates a test where probing packet trains are generatedto emulate traffic with the videoalev corresponding to the inputdialing speed. The probing packet train characteristics are basedon a VVoIP traffic model that specifies the instantaneous packetsizes and inter-packet times for a given dialing speed. Detailsof the VVoIP traffic model used in Vperf can be found in [5].If the test request is of streaming type, Vperf generates probingpacket trains only one-way (e.g., Side-A to Side-B in Figure2),
whereas, if the test request is of interactive type, Vperf generatesprobing packet trains both-ways i.e., between Side-A to Side-Band between Side-B to Side-A.
Based on the emulated traffic performance during the test,Vperf continuously collects online measurements of thebnet,dnet, lnet and jnet network factors on a per-second basis. Forobtaining statistically stable measures, the online measurementsare averaged over a test durationδt. After test durationδt,the obtained network factor measurements are plugged into theGAP-Model closed-form expressions. Subsequently, the onlineqmos rankings are instantly output in the form of a test report bythe Vperf tool. Note that if the test request is of streaming type,the test report is generated on the test initiation side withtheS-MOS rankings. However, if the test request is of interactivetype, two test reports are generated, one at Side-A and anotherat Side-B with the corresponding side’s I-MOS rankings. TheSide-A test report uses the network factor measurements col-lected on the Side-A to Side-B network path, whereas, the Side-B test report uses the network factor measurements collected onthe Side-B to Side-A network path.
The GAP-Model based framework can be leveraged in so-phisticated network control and management applications thataim at achieving optimal VVoIP QoE on the Internet. For ex-ample, the framework can be integrated into the widely-usedNetwork Weather Service (NWS) [32]. Currently, NWS is be-ing used to perform real-time monitoring and performance fore-casting of network bandwidth on several network paths simul-taneously for improving QoS of distributed computing. Withthe integration of our framework, NWS can be enhanced toperform real-time monitoring and performance forecastingofVVoIP QoE. The VVoIP QoE performance forecasts can be usedby call admission controllers that manage Multi-point ControlUnits (MCUs), which are required to setup interactive video-conference sessions involving three or more participants.TheMCUs combine the admitted voice and video streams from par-ticipants and generate a single conference stream that is mul-ticast to all the participants. If a call admission controller se-lects problematic network paths between the participants andMCUs, the perceptual quality of the conference stream couldbe seriously affected by impairments such as video frame freez-ing, voice drop-outs, and even call-disconnects. To avoid such aproblem, the call admission controllers can consult the enhancedNWS to find the network paths that can deliver optimal VVoIPQoE. In addition, the VVoIP QoE forecasts from the enhancedNWS can be used to monitor whether a current selection of net-work paths is experiencing problems that may soon degrade theVVoIP QoE severely. In such cases, the call admission con-trollers can dynamically change to alternate network pathsthathave been identified by the enhanced NWS to provide optimalVVoIP QoE for the next forecasting period. The dynamic se-lection of network paths by the call admission controller can beenforced in the Internet by using traffic engineering techniquessuch as MPLS explicit routing or by exploiting path diversitybased on multi-homing or overlay networks [33].
VI. Performance Evaluation
In this section, we evaluate the performance of our proposedGAP-Model for online VVoIP QoE estimation.

9
Table 3. Regression surface model parameters for the six GAP-Model qmos typesType C0 C1 C2 C3 C4 C5 C6 C7 C8
S-MOS 2.7048 0.0029 -0.0024 -1.4947 -0.0150 0.2918 0.0001 0.0004 0.0055S-MOS-LB 2.9811 0.0023 -0.0034 -1.8043 -0.0111 0.3746 0.0001 0.0005 0.0069S-MOS-UB 1.7207 0.0040 -0.0031 -1.4540 -0.0073 0.2746 0.0001 0.0004 0.0043
I-MOS 3.2247 0.0024 -0.0032 -1.3420 -0.0156 0.2461 0.0001 0.0002 0.0058I-MOS-LB 3.3839 0.0017 -0.0032 -1.3893 -0.0177 0.2677 0.0001 0.0002 0.0055I-MOS-UB 3.5221 0.0021 -0.0026 -1.3050 -0.0138 0.2614 0.0001 0.0001 0.0053
We first study the characteristics of the GAP-Modelqmos
rankings and compare it with theqmos rankings in the train-ing data under the same range of network conditions. Next,we validate the GAP-Modelqmos rankings using a new set oftests involving human subjects. In the new tests, we use net-work condition configurations that were not used for obtainingthe trainingqmos rankings and thus evaluate the QoE estimationaccuracy of the GAP-Model for other network conditions. Fi-nally, we compare the online GAP-Modelqmos rankings withtheqmos rankings obtained offline using the PSNR-mapped-to-MOS technique.
A. GAP-Model Characteristics
Given that we have four factorsbnet, dnet, lnet and jnet thataffect theqmos rankings, it is impossible to visualize the impactof all the factors on theqmos rankings. For this reason, we vi-sualize the impact of the training S-MOS and I-MOS rankingsusing an example set of 3-d graphs. The example set of graphsare shown in Figures 12 and 14 for increasinglnet andjnet val-ues. In these Figures, thebnet anddnet values are in the Goodperformance levels and hence their effects on theqmos rankingscan be ignored. We can observe that each of the S-MOS and I-MOS response surfaces are comprised of only nine data points,which correspond to the threeqmos response values for GAPperformance level values oflnet and jnet configured in the testcases. Expectedly, theqmos values decrease as thelnet andjnet
values increase. The rate (shown by the curvature) and magni-tude (z-axis values) of decrease ofqmos values with increase inthe lnet andjnet values is comparable in both the streaming andinteractive test cases. Figures 13 and 15 show the correspondingGAP-Model S-MOS and I-MOS rankings for increasing valuesof lnet andjnet in the same ranges set in the training test cases.We can compare and conclude that the GAP-Modelqmos ob-tained using the quadratic fit follow the trend and curvilinearnature of the trainingqmos noticeably.
To visualize the impact of the other network factors on theGAP-Model qmos, let us look at another example set of 3-dgraphs shown in Figures 16 and 17. Specifically, they show theimpact of lnet anddnet as well aslnet andbnet on the S-MOSrankings, respectively. Note that the 3-d axes in these graphs arerotated to obtain a clear view of the response surfaces. We canobserve from Figure 16 that the rate and magnitude of decreasein theqmos rankings is higher with the increase inlnet values asopposed to the decrease with the increase in thednet values. Incomparison, the rate of decrease in theqmos rankings with thedecrease in thebnet values as shown in Figure 17 is lower thanwith the increase in thelnet values.
We remark that the above observations relating to the impactof network factors on theqmos rankings presented in this sectionare similar to the observations presented in related works suchas [19] [24] [25].
B. GAP-Model Validation
As shown in the previous subsection, the GAP-Modelqmos
rankings are obtained by extrapolating the corresponding train-ing qmos rankings response surfaces. Given that the trainingqmos rankings are obtained from human subjects for a limitedset of network conditions, it is necessary to validate the per-formance of the GAP-Modelqmos rankings for other networkconditions that were not used in the closed-network test cases.For the validation, we conduct a new set of tests on the samenetwork testbed and using the same measurement methodologydescribed in Section 4.2. However, we make modifications inthe human subject selection and in the network condition con-figurations. For the new tests, we randomly select 7 human sub-jects from the earlier set of 21 human subjects. Recall, ITU-Tsuggests a minimum of 4 human subjects as compulsory for sta-tistical soundness in determiningqmos rankings for a test case.Also, we configure NISTnet with the randomly chosen values ofnetwork factors within the GAP performance levels as shown inTable 4. Note that these network conditions are different fromthe network conditions used to obtain the trainingqmos rank-ings. We refer to theqmos rankings obtained for the new testsinvolving theStreaming-Kellyvideo sequence as “Validation-S-MOS" (V-S-MOS). Further, we refer to theqmos rankings ob-tained for the new tests involving theInteractive-Kellyvideo se-quence as “Validation-I-MOS" (V-I-MOS).
Figures 18 and 19 show the average of the 7 human-subjects’V-S-MOS and V-I-MOS rankings obtained from the new testsfor each network condition in Table 4. We can observe that theV-S-MOS and V-I-MOS rankings lie within the upper and lowerbounds and are close to the average GAP-Modelqmos rankingsfor the different network conditions. Thus, we validate theGAP-Modelqmos rankings and show that they closely match the end-user VVoIP QoE for other network conditions that were not usedin the closed-network test cases.
Table 4. Values of network factors for GAP-Model validation
experimentsNetwork Factor Good Acceptable Poor
dnet 100 ms 200 ms 600 mslnet 0.3 % 1.2 % 1.65 %jnet 15 ms 40 ms 60 ms

10
Fig. 12. Training S-MOS response surface showing lnet and jnet
effectsFig. 13. GAP-Model S-MOS response surface showing lnet and
jnet effects
Fig. 14. Training I-MOS response surface showing lnet and jnet
effectsFig. 15. GAP-Model I-MOS response surface showing lnet and
jnet effects
Fig. 16. GAP-Model S-MOS response surface showing lnet anddnet effects
Fig. 17. GAP-Model S-MOS response surface showing lnet andbnet effects
Fig. 18. Comparison of S-MOS with Validation-S-MOS (V-S-MOS)
C. GAP-Model qmos Comparison with PSNR-mapped-to-MOSqmos
Herein, we compare the GAP-Modelqmos rankings with thePSNR-mapped-to-MOSqmos (P-MOS) rankings. For estimat-ing the P-MOS rankings, we use the NTIA’s VQM software [34]that implements the algorithm ratified by ITU-T in their J.144Recommendation [2] and the ANSI in their T1.801.03 Stan-dard [16]. The VQM P-MOS rankings only measure the degra-dation of video pixels caused due to frame freezing, jerky mo-tion, blurriness and tiling in the reconstructed video sequenceand cannot measure interaction degradation. Hence, we onlycompare the GAP-Model S-MOS rankings with the VQM P-MOS rankings for different network conditions. To obtain theP-MOS rankings, we use the same network testbed that was usedfor the closed-network test cases and configure it with the net-work conditions shown in Table 4. For each network condition,we obtain 7 reconstructedStreaming-Kellyvideo sequences.
11
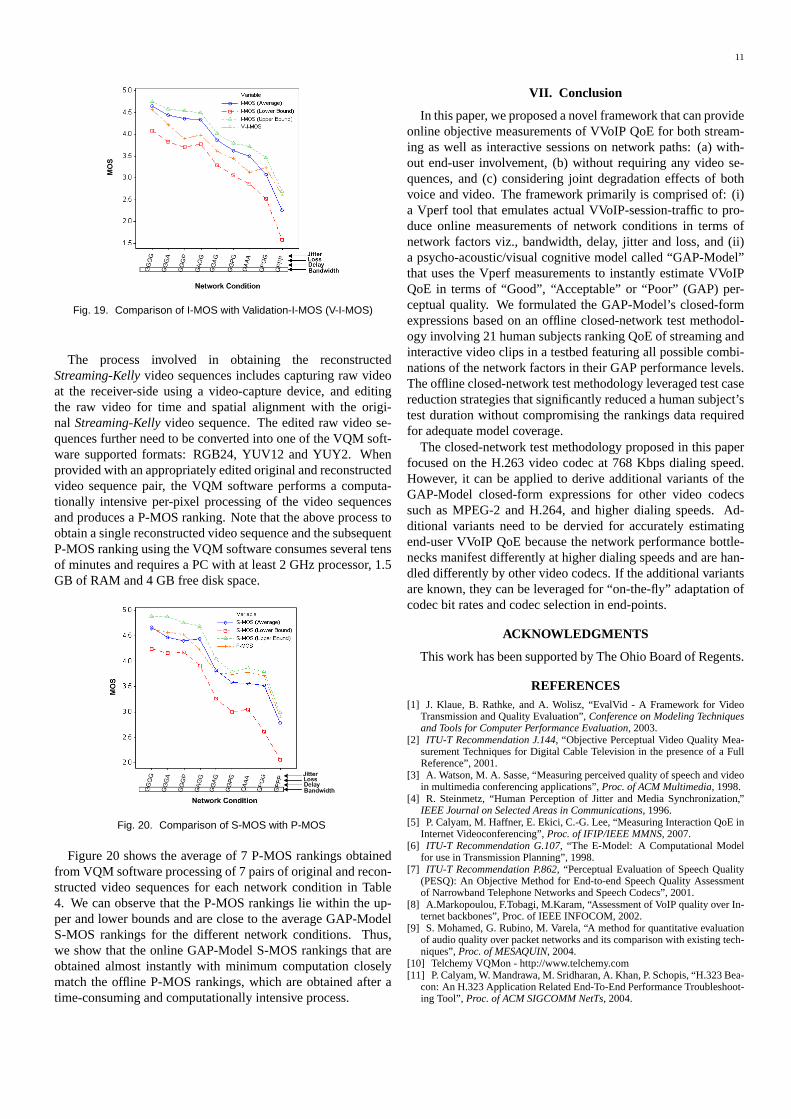
Fig. 19. Comparison of I-MOS with Validation-I-MOS (V-I-MOS)
The process involved in obtaining the reconstructedStreaming-Kellyvideo sequences includes capturing raw videoat the receiver-side using a video-capture device, and editingthe raw video for time and spatial alignment with the origi-nal Streaming-Kellyvideo sequence. The edited raw video se-quences further need to be converted into one of the VQM soft-ware supported formats: RGB24, YUV12 and YUY2. Whenprovided with an appropriately edited original and reconstructedvideo sequence pair, the VQM software performs a computa-tionally intensive per-pixel processing of the video sequencesand produces a P-MOS ranking. Note that the above process toobtain a single reconstructed video sequence and the subsequentP-MOS ranking using the VQM software consumes several tensof minutes and requires a PC with at least 2 GHz processor, 1.5GB of RAM and 4 GB free disk space.
Fig. 20. Comparison of S-MOS with P-MOS
Figure 20 shows the average of 7 P-MOS rankings obtainedfrom VQM software processing of 7 pairs of original and recon-structed video sequences for each network condition in Table4. We can observe that the P-MOS rankings lie within the up-per and lower bounds and are close to the average GAP-ModelS-MOS rankings for the different network conditions. Thus,we show that the online GAP-Model S-MOS rankings that areobtained almost instantly with minimum computation closelymatch the offline P-MOS rankings, which are obtained after atime-consuming and computationally intensive process.
VII. Conclusion
In this paper, we proposed a novel framework that can provideonline objective measurements of VVoIP QoE for both stream-ing as well as interactive sessions on network paths: (a) with-out end-user involvement, (b) without requiring any video se-quences, and (c) considering joint degradation effects of bothvoice and video. The framework primarily is comprised of: (i)a Vperf tool that emulates actual VVoIP-session-traffic to pro-duce online measurements of network conditions in terms ofnetwork factors viz., bandwidth, delay, jitter and loss, and (ii)a psycho-acoustic/visual cognitive model called “GAP-Model”that uses the Vperf measurements to instantly estimate VVoIPQoE in terms of “Good”, “Acceptable” or “Poor” (GAP) per-ceptual quality. We formulated the GAP-Model’s closed-formexpressions based on an offline closed-network test methodol-ogy involving 21 human subjects ranking QoE of streaming andinteractive video clips in a testbed featuring all possiblecombi-nations of the network factors in their GAP performance levels.The offline closed-network test methodology leveraged testcasereduction strategies that significantly reduced a human subject’stest duration without compromising the rankings data requiredfor adequate model coverage.
The closed-network test methodology proposed in this paperfocused on the H.263 video codec at 768 Kbps dialing speed.However, it can be applied to derive additional variants of theGAP-Model closed-form expressions for other video codecssuch as MPEG-2 and H.264, and higher dialing speeds. Ad-ditional variants need to be dervied for accurately estimatingend-user VVoIP QoE because the network performance bottle-necks manifest differently at higher dialing speeds and arehan-dled differently by other video codecs. If the additional variantsare known, they can be leveraged for “on-the-fly” adaptationofcodec bit rates and codec selection in end-points.
ACKNOWLEDGMENTS
This work has been supported by The Ohio Board of Regents.
REFERENCES[1] J. Klaue, B. Rathke, and A. Wolisz, “EvalVid - A Framework for Video
Transmission and Quality Evaluation”,Conference on Modeling Techniquesand Tools for Computer Performance Evaluation, 2003.
[2] ITU-T Recommendation J.144, “Objective Perceptual Video Quality Mea-surement Techniques for Digital Cable Television in the presence of a FullReference”, 2001.
[3] A. Watson, M. A. Sasse, “Measuring perceived quality of speech and videoin multimedia conferencing applications”,Proc. of ACM Multimedia, 1998.
[4] R. Steinmetz, “Human Perception of Jitter and Media Synchronization,”IEEE Journal on Selected Areas in Communications, 1996.
[5] P. Calyam, M. Haffner, E. Ekici, C.-G. Lee, “Measuring Interaction QoE inInternet Videoconferencing”,Proc. of IFIP/IEEE MMNS, 2007.
[6] ITU-T Recommendation G.107, “The E-Model: A Computational Modelfor use in Transmission Planning”, 1998.
[7] ITU-T Recommendation P.862, “Perceptual Evaluation of Speech Quality(PESQ): An Objective Method for End-to-end Speech Quality Assessmentof Narrowband Telephone Networks and Speech Codecs”, 2001.
[8] A.Markopoulou, F.Tobagi, M.Karam, “Assessment of VoIP quality over In-ternet backbones”, Proc. of IEEE INFOCOM, 2002.
[9] S. Mohamed, G. Rubino, M. Varela, “A method for quantitative evaluationof audio quality over packet networks and its comparison withexisting tech-niques”,Proc. of MESAQUIN, 2004.
[10] Telchemy VQMon - http://www.telchemy.com[11] P. Calyam, W. Mandrawa, M. Sridharan, A. Khan, P. Schopis, “H.323 Bea-
con: An H.323 Application Related End-To-End Performance Troubleshoot-ing Tool”, Proc. of ACM SIGCOMM NetTs, 2004.

12
[12] S. Winkler, “Digital Video Quality: Vision Models and Metrics”, JohnWiley and Sons Publication, 2005.
[13] O. Nemethova, M. Ries, E. Siffel, M. Rupp, “Quality Assessment forH.264 Coded Low-rate Low-resolution Video Sequences”,Proc. of Confer-ence on Internet and Information Technologies, 2004.
[14] Z. Wang, A. C. Bovik, H. R. Sheikh, E. P. Simoncelli, “Imagequalityassessment: From error visibility to structural similarity,” IEEE Transactionson Image Processing, 2004.
[15] K. T. Tan, M. Ghanbari, “A Combinational automated MPEG video qualityassessment model",Proc. of Conference on Image Processing and its Appli-cation, 1999.
[16] ANSI T1.801.03 Standard, “Digital Transport of One-Way Video Signals -Parameters for Objective Performance Assessment”, 2003.
[17] S. Tao, J. Apostolopoulos, R. Guerin, “Real-Time Monitoring of VideoQuality in IP Networks”,Proc. of ACM NOSSDAV, 2005.
[18] F. Massidda, D. Giusto, C.Perra, “No reference video quality estimationbased on human visual system for 2.5/3G devices”,Proc. of the SPIE, 2005.
[19] S. Mohamed, G. Rubino, “A Study of Real-Time Packet Video Quality us-ing Random Neural Networks”,IEEE Transactions on Circuits and Systemsfor Video Technology, 2002.
[20] “The Video Development Initiative (ViDe) Videoconferencing Cookbook”- http://www.vide.net/cookbook
[21] H. Tang, L. Duan, J. Li, “A Performance Monitoring Architecture for IPVideoconferencing”,Proc. of Workshop on IP Operations and Management,2004.
[22] “Implementing QoS Solutions for H.323 Videoconferencing over IP”,Cisco Systems Technical Whitepaper Document Id: 21662, 2007.
[23] ITU-T Recommendation G.114, “One-Way Transmission Time,” 1996.[24] P. Calyam, M. Sridharan, W. Mandrawa, P. Schopis, “Performance Mea-
surement and Analysis of H.323 Traffic”,Proc. of Passive and Active Mea-surement Workshop, 2004.
[25] M. Claypool, J. Tanner, “The Effects of Jitter on the Perceptual Quality ofVideo”, Proc. of ACM Multimedia, 1999.
[26] NISTnet Network Emulator - http://snad.ncsl.nist.gov/itg/nistnet[27] H. R. Wu, T. Ferguson, B. Qiu, “Digital video quality evaluation using
quantitative quality metrics”,Proc. of International Conference on SignalProcessing, 1998.
[28] A. Tirumala, L. Cottrell, T. Dunigan, “Measuring End-to-end Bandwidthwith Iperf using Web100”,Proc. of Passive and Active Measurement Work-shop, 2003.
[29] ITU-T Recommendation P.911, “Subjective Audiovisual Quality Assess-ment Methods for Multimedia Applications”, 1998.
[30] ITU-T Recommendation P.920, “Interactive test methods for audiovisualcommunications”, 2000.
[31] ITU-T Recommendation BT.500-10, “Methodology for the subjective as-sessment of quality of television pictures”, 2000.
[32] R. Wolski, N. Spring, J. Hayes, “The Network Weather Service: A Dis-tributed Resource Performance Forecasting Service for Metacomputing",Fu-ture Generation Computer Systems, 1999.
[33] J. Han, F. Jahanian, “Impact of Path Diversity on Multi-homed and Over-lay Networks",Proc. of IEEE DSN, 2004.
[34] M. Pinson, S. Wolf, “A New Standardized Method for Objectively Mea-suring Video Quality”,IEEE Transactions on Broadcasting, 2004.
[35] C. Lambrecht, D. Constantini, G. Sicuranza, M. Kunt, “Quality Assess-ment of Motion Rendition in Video Coding”,IEEE Transactions on Circuitsand Systems for Video Technology, 1999.
Prasad Calyamreceived the BS degree in Electricaland Electronics Engineering from Bangalore Univer-sity, India, and the MS and Ph.D. degrees in Electri-cal and Computer Engineering from The Ohio StateUniversity, in 1999, 2002, and 2007 respectively. Heis currently a Senior Systems Developer/Engineer atthe Ohio Supercomputer Center. His current researchinterests include network management, active/passivenetwork measurements, voice and video over IP andnetwork security.
Eylem Ekici received his BS and MS degrees in Com-puter Engineering from Bogazici University, Istanbul,Turkey, in 1997 and 1998, respectively. He receivedhis Ph.D. degree in Electrical and Computer Engi-neering from Georgia Institute of Technology, Atlanta,GA, in 2002. Currently, he is an Assistant Professor inthe Department of Electrical and Computer Engineer-ing of The Ohio State University, Columbus, OH. Dr.Ekici’s current research interests include wireless sen-sor networks, vehicular communication systems, andnext generation wireless systems, with a focus on rout-
ing and medium access control protocols, resource management,and analysisof network architectures and protocols. He is an associate editor of ComputerNetworks Journal (Elsevier) and ACM Mobile Computing and CommunicationsReview. He has also served as the TPC co-chair of IFIP/TC6 Networking 2007Conference.
Chang-Gun Leereceived the BS, MS and Ph.D. de-grees in Computer Engineering from Seoul NationalUniversity, Korea, in 1991, 1993 and 1998, respec-tively. He is currently an Assistant Professor in theSchool of Computer Science and Engineering, SeoulNational University, Korea. Previously, he was anAssistant Professor in the Department of Electricaland Computer Engineering, The Ohio State Univer-sity, Columbus from 2002 to 2006, a Research Sci-entist in the Department of Computer Science, Uni-versity of Illinois at Urbana-Champaign from 2000 to
2002, and a Research Engineer in the Advanced Telecomm. Research Lab., LGInformation and Communications, Ltd. from 1998 to 2000. His current researchinterests include real-time systems, complex embedded systems,ubiquitous sys-tems, QoS management, wireless ad-hoc networks, and flash memory systems.
Mark Haffner received the BS degree in ElectricalEngineering from University of Cincinnati in 2006.Currently, he is pursuing an MS degree in Electricaland Computer Engineering at The Ohio State Uni-versity. His current research interests include ac-tive/passive network measurements, RF circuit designand software-defined radios.
Nathan Howesis pursuing a BS degree in ComputerScience and Engineering at The Ohio State University.His current research interests include active/passivenetwork measurements and network security.