a fuzzy based service quality and performance evaluation...
TRANSCRIPT

0
A Fuzzy Based Service Quality and
Performance Evaluation Model: A Case Study in Hostel Mess
Thesis submitted in partial fulfillment of the requirements for the Degree of
Bachelor of Technology (B. Tech.)
In
Mechanical Engineering
By
PRAKASH SHAH Roll No. 109ME0538
Under the Guidance of
Prof. SAURAV DATTA
NATIONAL INSTITUTE OF TECHNOLOGY ROURKELA 769008, INDIA

1
NATIONAL INSTITUTE OF TECHNOLOGY ROURKELA 769008, INDIA
Certificate of Approval
This is to certify that the thesis entitled A Fuzzy Based Service Quality and Performance
Evaluation Model: A Case Study in Hostel Mess submitted by Sri Prakash Shah has
been carried out under my supervision in partial fulfillment of the requirements for the
Degree of Bachelor of Technology in Mechanical Engineering at National Institute of
Technology, NIT Rourkela, and this work has not been submitted elsewhere before for any
other academic degree/diploma.
------------------------------------------
Dr. Saurav Datta
Assistant Professor Department of Mechanical Engineering
National Institute of Technology, Rourkela Rourkela-769008
Date:

2
Acknowledgement
I would like to express my deep sense of gratitude and indebtedness to Dr. Saurav Datta,
Assistant Professor, Department of Mechanical Engineering, NIT Rourkela, my supervisor,
whose invaluable encouragement, suggestions, and support leads to make successful completion
of the thesis work. His meticulous guidance at each phase of this thesis has inspired and helped
me innumerable ways. I am feeling felicitous in deep of my heart to work under such a young,
dynamic, intelligent professor and his excellence of supervision.
I would also like to show my sincere thanks to Prof. K. P. Maity, Professor and Head of the
Department, Mechanical Engineering; Prof. S. S. Mahapatra, Professor and Prof. S. K. Patel,
Associate Professor, Department of Mechanical Engineering, NIT Rourkela, for their intellectual
support and paving me with their precious comments and creative ideas. I am indebted to all of
them.
Last, but not the least, I offer my regards and thanks to all of those, whose names have not been
explicitly mentioned, yet, have supported me in any respect during the completion of this report.
Prakash Shah

3
Abstract
Customer service satisfaction has become a major concern of modern service industry
competition. Accurate evaluation of customer service satisfaction is the basis to improve the
service quality. Since there is a causal relationship between customer satisfaction and service
quality and services literature and studies have shown that service quality is an antecedent of
customer satisfaction, the present work seeks to find out the service dimensions of service
quality, which lead to higher levels of customer satisfaction. This paper constructs the service
quality evaluation system of a hostel mess of National Institute of Technology, Rourkela, India,
based on the customer’s (students of the hostel) point of view, and put forward the questionnaire
of service quality in mess services in hostel, and set up the evaluating overall service quality and
performance extent. Apart from estimating overall service quality performance extent index, the
present study has been extended to identify ill-performing areas which require future
improvement. A fuzzy based service quality and performance appraisement module has been
reported in this work.
Keywords: Customer service satisfaction; mess services in hostel; overall service quality and
performance extent

4
Contents
Items Page Number
Title Page -
Certificate of Approval 01
Acknowledgement 02
Abstract 03
Contents 04
1. State of Art 05
2. Fuzzy Preliminaries 11
2.1 Definition of Fuzzy Sets 11
2.2 Definition of Fuzzy Numbers 12
2.3 Linguistic Variable 15
2.4 The Concept of Generalized Trapezoidal Fuzzy Numbers 15
2.5 Ranking of Generalized Trapezoidal Fuzzy Numbers 18
3. Proposed Appraisement Module 22
4. Numerical Illustrations 23
5. Managerial Implications and Conclusions 25
6. References 25
5
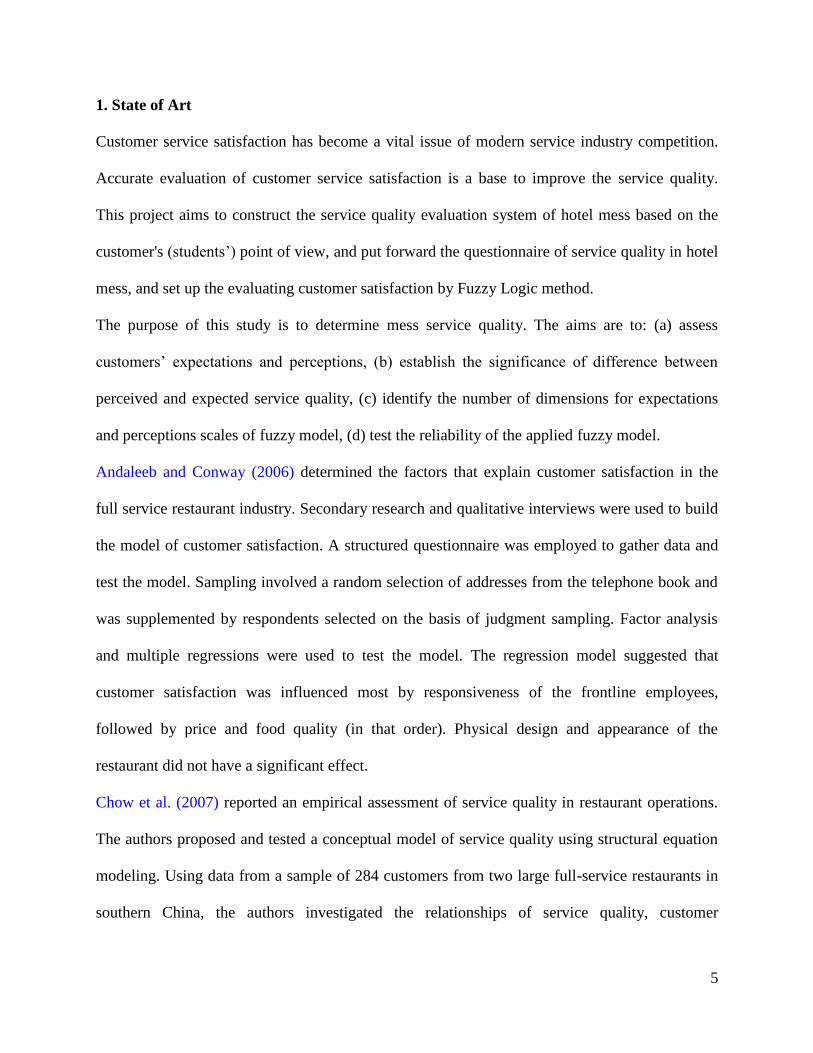
1. State of Art
Customer service satisfaction has become a vital issue of modern service industry competition.
Accurate evaluation of customer service satisfaction is a base to improve the service quality.
This project aims to construct the service quality evaluation system of hotel mess based on the
customer's (students’) point of view, and put forward the questionnaire of service quality in hotel
mess, and set up the evaluating customer satisfaction by Fuzzy Logic method.
The purpose of this study is to determine mess service quality. The aims are to: (a) assess
customers’ expectations and perceptions, (b) establish the significance of difference between
perceived and expected service quality, (c) identify the number of dimensions for expectations
and perceptions scales of fuzzy model, (d) test the reliability of the applied fuzzy model.
Andaleeb and Conway (2006) determined the factors that explain customer satisfaction in the
full service restaurant industry. Secondary research and qualitative interviews were used to build
the model of customer satisfaction. A structured questionnaire was employed to gather data and
test the model. Sampling involved a random selection of addresses from the telephone book and
was supplemented by respondents selected on the basis of judgment sampling. Factor analysis
and multiple regressions were used to test the model. The regression model suggested that
customer satisfaction was influenced most by responsiveness of the frontline employees,
followed by price and food quality (in that order). Physical design and appearance of the
restaurant did not have a significant effect.
Chow et al. (2007) reported an empirical assessment of service quality in restaurant operations.
The authors proposed and tested a conceptual model of service quality using structural equation
modeling. Using data from a sample of 284 customers from two large full-service restaurants in
southern China, the authors investigated the relationships of service quality, customer

6
satisfaction, and frequency of patronage. The results supported the significant links between
service quality and customer satisfaction, service quality and repeat patronage, but not customer
satisfaction and repeat patronage. The study provided important insights into service quality and
customer satisfaction in the field of restaurant operations.
Ko and Har (2008) highlighted an exploratory study of customer satisfaction of fine dining
restaurants in Singapore. Since there was a causal relationship between customer satisfaction and
service quality and services literature and studies were shown that service quality was an
antecedent of customer satisfaction, this paper seek to find out the service dimensions of service
quality, which lead to higher levels of customer satisfaction. This study suggested that the
service dimensions of assurance, empathy and tangibles were the most important to customers’
evaluation of service quality, and thus, might have a positive influence customer satisfaction.
The service aspects of each of these dimensions were discussed and recommendations were
made for restaurateurs to improve their service to ensure higher levels of customer satisfaction.
Xue et al. (2008) constructed the service quality evaluation system of fast food industry based on
the customer's point of view, and put forward the questionnaire of service quality in Fast Food
Restaurant (FFR), and set up the evaluating customer satisfaction by TOPSIS method Based on
an investigation on customers in China and US, and evaluated customer satisfaction of 4 FFRs in
China and 8 FFRs in US, and then sort. Through the evaluation and analysis of result of China
and US, this paper analyzed the core competence of fast food industry and the main factors that
influence competence, which could provide evidence for further enhancing enterprise
competitiveness.
Markovic et al. (2010) determined restaurant service quality. The aims were to: (a) assess
customers’ expectations and perceptions, (b) establish the significance of difference between

7
perceived and expected service quality, (c) identify the number of dimensions for expectations
and perceptions scales of modified DINESERV model, (d) test the reliability of the applied
DINESERV model. The empirical research was conducted using primary data. In order to meet
survey goals, descriptive, bivariate and multivariate (exploratory factor analysis and reliability
analysis) statistical analyses were conducted.
The empirical results showed that expectations scores were higher than perceptions scores,
which indicated low level of service quality. Furthermore, this study identified seven factors that
best explain customers’ expectations and two factors that best explain customers’ perceptions
regarding restaurant service. The results of this study would help management identify the
strengths and weaknesses of service quality and implement an effective strategy to meet the
customers’ expectations.
Shi and Wang (2011) studied evaluation method of service quality of restaurant. Based on
SERVQUAL, Evaluation system for restaurant was established. And empirical study was done
for a restaurant in Mianyang, china. Service quality of the restaurant was evaluated by the
restaurant’s service quality evaluation method based on SERVQUAL. Then according to current
service quality level of the restaurant, quality improvement method was discussed.
Khattab et al. (2011) studied was to measure hotels' service quality performance from the
customer perspective. To do so, a performance-only measurement scale (SERVPERF) was
administered to customers stayed in three, four and five star hotels in Aqaba and Petra. Although
the importance of service quality and service quality measurement was recognized, there was
limited research that addressed the structure and antecedents of the concept for the hotel
industry. The clarification of the dimensions was important for managers in the hotel industry as
it identifies the bundles of service attributes consumers find important. The results of the study
8
demonstrated that SERVPERF seemed as a reliable and valid tool to measure service quality in
the hotel industry. The instrument consists of five dimensions, namely "tangibles",
"responsiveness", "empathy", "assurance" and "reliability". Hotel customers are expecting more
improved services from the hotels in all service quality dimensions. However, hotel customers
have the lowest perception scores on empathy and tangibles. In the light of the results, possible
managerial implications were discussed and future research subjects are recommended.
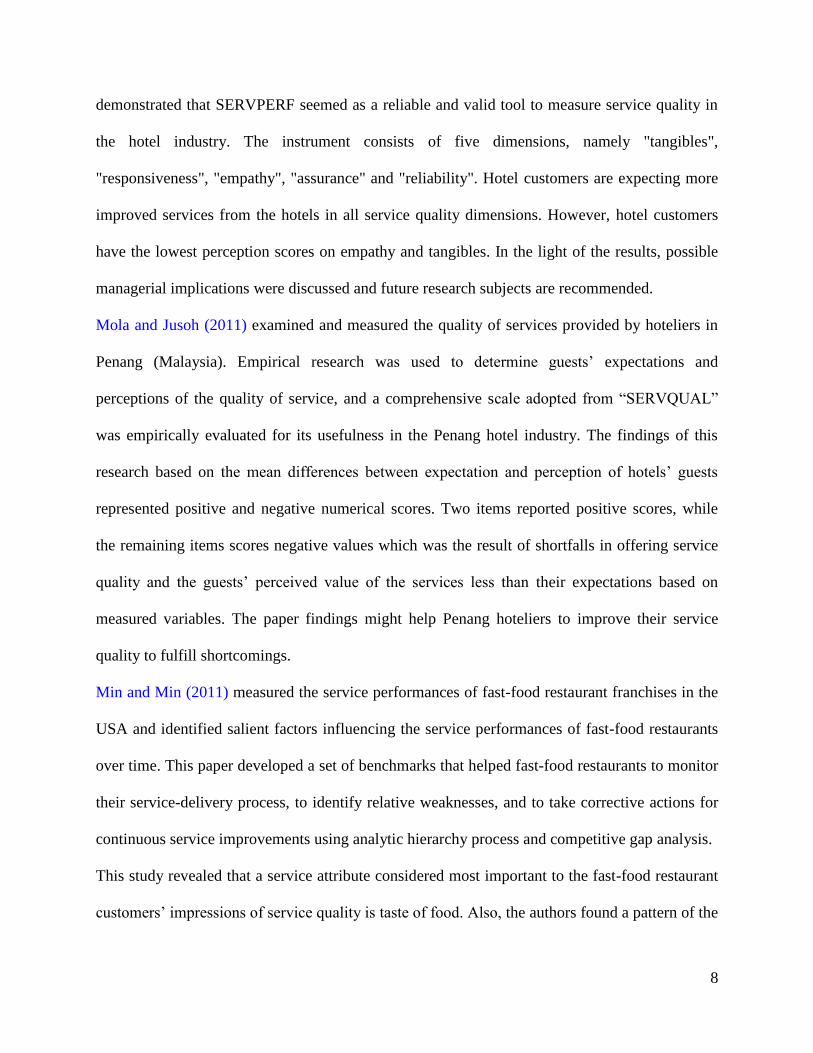
Mola and Jusoh (2011) examined and measured the quality of services provided by hoteliers in
Penang (Malaysia). Empirical research was used to determine guests’ expectations and
perceptions of the quality of service, and a comprehensive scale adopted from “SERVQUAL”
was empirically evaluated for its usefulness in the Penang hotel industry. The findings of this
research based on the mean differences between expectation and perception of hotels’ guests
represented positive and negative numerical scores. Two items reported positive scores, while
the remaining items scores negative values which was the result of shortfalls in offering service
quality and the guests’ perceived value of the services less than their expectations based on
measured variables. The paper findings might help Penang hoteliers to improve their service
quality to fulfill shortcomings.
Min and Min (2011) measured the service performances of fast-food restaurant franchises in the
USA and identified salient factors influencing the service performances of fast-food restaurants
over time. This paper developed a set of benchmarks that helped fast-food restaurants to monitor
their service-delivery process, to identify relative weaknesses, and to take corrective actions for
continuous service improvements using analytic hierarchy process and competitive gap analysis.
This study revealed that a service attribute considered most important to the fast-food restaurant
customers’ impressions of service quality is taste of food. Also, the authors found a pattern of the
9
correlation between the overall level of customer satisfaction with the fast-food restaurant and its
word-of-mouth reputation. Furthermore, they discovered that the customers tended to be more
favorable to easily accessible and national fast-food restaurant franchises than less accessible,
relatively new, and regional counterparts.
Haghighi et al. (2012) investigated the factors affecting customer loyalty in the restaurant
industry. Data was collected using questionnaire distributed in 10 randomly selected branches of
Boof Chain Restaurant in Tehran. In each branch, 40 customers were selected for the study.
Ultimately, the research sample consisted of 268 customers. Structured equation modeling was
used for data analysis and hypothesis testing. The obtained results showed that food quality,
service quality, restaurant environment, and perception of price fairness had a positive impact on
customer satisfaction, but the impact of restaurant location on customer satisfaction was not
confirmed. Also, food quality, service quality, and perception of price fairness had a positive
effect on customer trust. The results showed that food quality seemed the most important factor
affecting customer satisfaction and trust in Boof Chain Restaurants. Customer satisfaction had a
positive impact on customer loyalty, but the effect of customer trust on customer loyalty was not
confirmed.
Ali et al. (2012) examined the factors and sub-factors within the sector-specific measurement
scale that was known as model of service quality based on 342 responds gathered by the online
questionnaire method. These factors were listed and determined as highlighted in the literature.
The study defined the influencing factors for the food retail industry of Turkey, which
contributed to appropriate for the future strategies of the sector.
Nicolaides (2012) made an empirical assessment of customers’ perceptions and expectations of
service to measure service quality in three restaurants in a casino complex in Gauteng Province

10
in South Africa. The research helped to assess the levels of customer satisfaction with service
provision in three restaurants and identified factors that contributed to customer satisfaction and
dissatisfaction; It also determined the current status of service and compared and ranked three
restaurants service provision. Another importance was the aiding in the establishment of
customer service standards for the restaurants concerned. The tipping of waitrons was also used
as an indicator of customer satisfaction with service provision in general. A three-column
SERVQUAL instrument was used together with part of the Fishbein model. The study was able
to firstly determine and analyze service gaps that exist in the service delivery procedure to
measure service quality as well as general customer satisfaction and secondly, to evaluate
customers’ attitudes towards the service measure attributes of similar restaurants in the same
location. The findings offer implications to improve service quality in restaurant business in
general.
Yoo (2012) attempted to investigate the customers’ perceptions of restaurant cleanliness.
Understanding what customers consider when they evaluate a restaurant’s cleanliness could be
beneficial for hospitality managers who could use the information to increase their restaurant’s
quality and to satisfy their customers. In addition, this study was conducted with two different
cultural groups of customers: Westerners and Asians. Understanding how different cultures
perceive restaurant cleanliness could help hospitality managers who plan to expand their
business in the global market.
The results of this study indicated that the items of restroom personal hygiene, restroom
appearance and server’ behavior all had a positive relationship with customers’ restaurant quality
evaluations. The level of importance of restaurant cleanliness dimensions was found to be similar
between the Western and Asian samples. The server’s behavior, restroom appearance and

11
signage were found to be the most important dimensions for both groups. However, restroom
personal hygiene was found to be the only dimension ranked differently by the two groups in the
study. Westerners weighed the restroom personal hygiene as more important than did Asian
respondents. Asian groups were found to have higher expectations for overall restaurant
cleanliness dimensions than Western groups.
2. Fuzzy Preliminaries
To deal with vagueness in human thought, Zadeh (1965) first introduced the fuzzy set theory,
which has the capability to represent/manipulate data and information possessing based on
nonstatistical uncertainties. Moreover fuzzy set theory has been designed to mathematically
represent uncertainty and vagueness and to provide formalized tools for dealing with the
imprecision inherent to decision making problems. Some basic definitions of fuzzy sets, fuzzy
numbers and linguistic variables are reviewed from Zadeh (1975), Buckley (1985), Negi (1989),
Kaufmann and Gupta (1991).The basic definitions and notations below will be used throughout
this paper until otherwise stated.
2.1 Definitions of fuzzy sets:
Definition 1. A fuzzy set A~
in a universe of discourse X is characterized by a membership
function xA~ which associates with each element x in X a real number in the interval 1,0 .
The function value xA~ is termed the grade of membership of x in A
~(Kaufmann and Gupta,
1991).
Definition 2. A fuzzy set A~
in a universe of discourse X is convex if and only if
2~1~21~ ,min)1( xxxxAAA
(1)

12
For all 21, xx in X and all 1,0 , where min denotes the minimum operator (Klir and Yuan,
1995).
Definition 3. The height of a fuzzy set is the largest membership grade attained by any element
in that set. A fuzzy set A~
in the universe of discourse X is called normalized when the height
of A~
is equal to 1 (Klir and Yuan, 1995).
2.2 Definitions of fuzzy numbers:
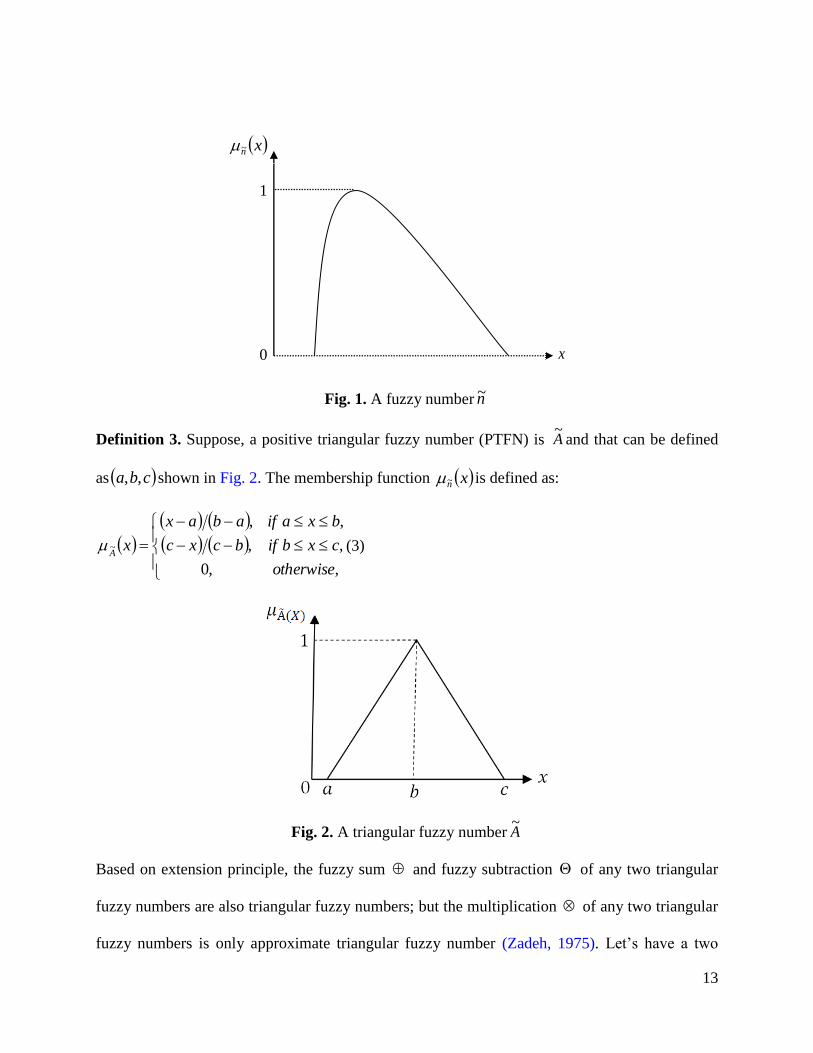
Definition 1. A fuzzy number is a fuzzy subset in the universe of discourse X that is both convex
and normal. Fig. 1 shows a fuzzy number n~ in the universe of discourse X that conforms to this
definition (Kaufmann and Gupta, 1991).
Definition 2. The -cut of fuzzy number n~ is defined as:
Xxxxn iini ,:~~ , (2)
Here, 1,0
The symbol n~ represents a non-empty bounded interval contained in X , which can be denoted
by ul nnn ,~ ,
ln and un are the lower and upper bounds of the closed interval, respectively
(Kaufmann and Gupta, 1991; Zimmermann, 1991). For a fuzzy number n~ , if
0ln and 1
un for all 1,0 , then n~ is called a standardized (normalized) positive fuzzy
number (Negi, 1989).
13
Fig. 1. A fuzzy number n~
Definition 3. Suppose, a positive triangular fuzzy number (PTFN) is A~
and that can be defined
as cba ,, shown in Fig. 2. The membership function xn~ is defined as:
,,0
,,
,,
~
otherwise
cxbifbcxc
bxaifabax
xA
(3)
Fig. 2. A triangular fuzzy number A~
Based on extension principle, the fuzzy sum and fuzzy subtraction of any two triangular
fuzzy numbers are also triangular fuzzy numbers; but the multiplication of any two triangular
fuzzy numbers is only approximate triangular fuzzy number (Zadeh, 1975). Let’s have a two
0
1
x
xn~

14
positive triangular fuzzy numbers, such as ,,~
11,11 cbaA and ,,,~
2222 cbaA and a positive
real number ,,, rrrr some algebraic operations can be expressed as follows:
21212121 ,,~~
ccbbaaAA (4)
,,,~~
21212121 ccbbaaAA (5) ,,,~~
21212121 ccbbaaAA (6)
,,,~
1111 rcrbraAr (7)
1
~A Ø ,,,
~2121212 acbbcaA (8)
The operations of (max) and (min) are defined as:
,,,~~
21212121 ccbbaaAA (9)
,,,~~
21212121 ccbbaaAA (10)
Here, ,0r and ,0,, 111 cba
Also the crisp value of triangular fuzzy number set 1
~A can be determined by defuzzification
which locates the Best Non-fuzzy Performance (BNP) value. Thus, the BNP values of fuzzy
number are calculated by using the center of area (COA) method as follows: (Moeinzadeh and
Hajfathaliha, 2010)
BNPi =
,,3
iaabac
(11)
Definition 4. A matrix D~
is called a fuzzy matrix if at least one element is a fuzzy number
(Buckley, 1985).
15
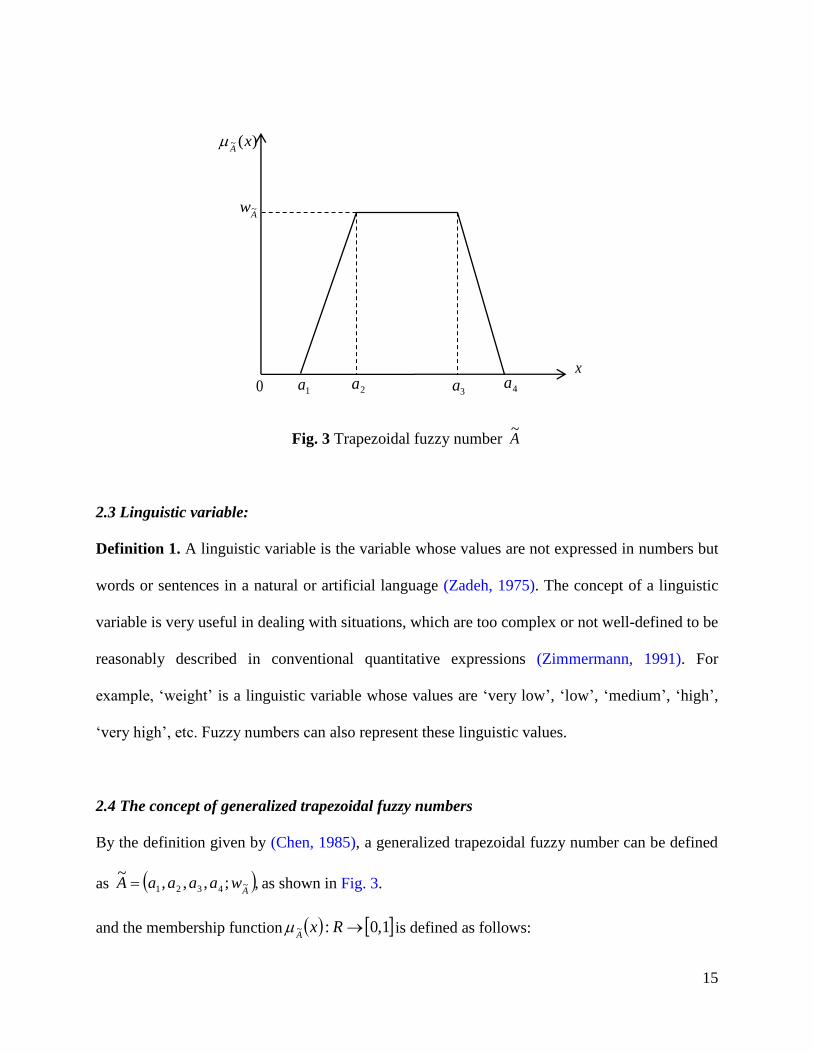
Fig. 3 Trapezoidal fuzzy number A~
2.3 Linguistic variable:
Definition 1. A linguistic variable is the variable whose values are not expressed in numbers but
words or sentences in a natural or artificial language (Zadeh, 1975). The concept of a linguistic
variable is very useful in dealing with situations, which are too complex or not well-defined to be
reasonably described in conventional quantitative expressions (Zimmermann, 1991). For
example, ‘weight’ is a linguistic variable whose values are ‘very low’, ‘low’, ‘medium’, ‘high’,
‘very high’, etc. Fuzzy numbers can also represent these linguistic values.
2.4 The concept of generalized trapezoidal fuzzy numbers
By the definition given by (Chen, 1985), a generalized trapezoidal fuzzy number can be defined
as ,;,,,~
~4321 AwaaaaA as shown in Fig. 3.
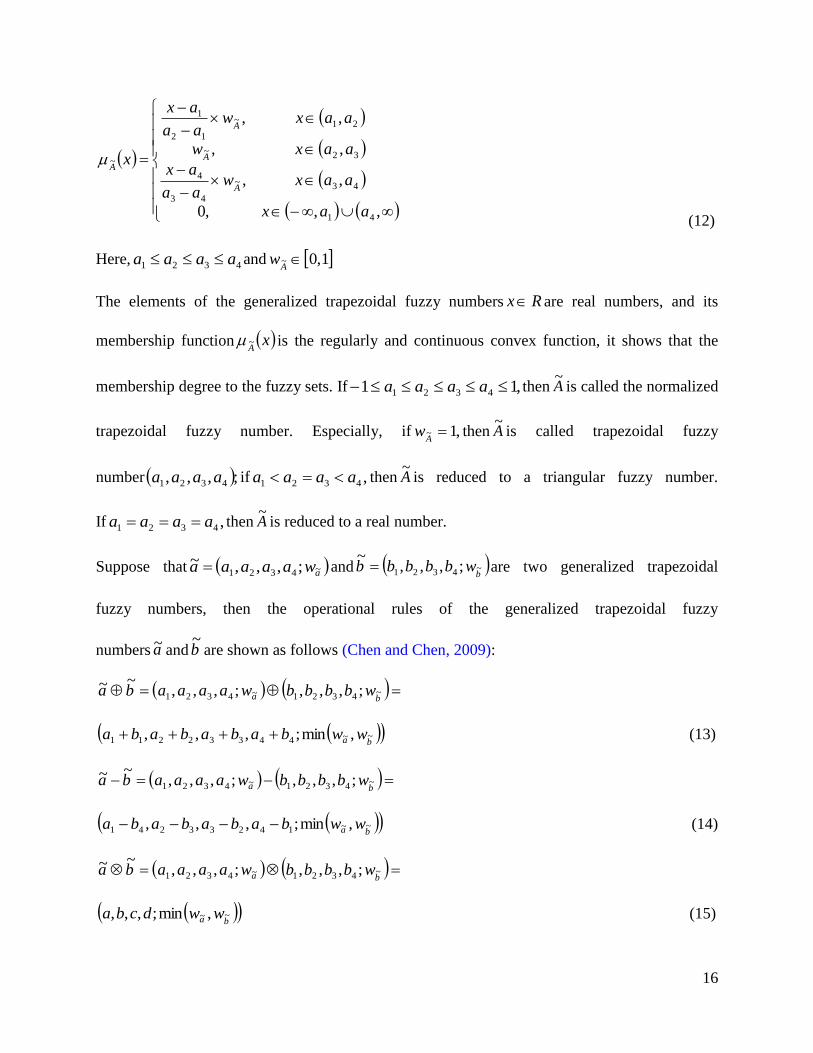
and the membership function 1,0:~ RxA
is defined as follows:
1a
0
2a
)(~ xA
x
4a
Aw~
3a
16
,,,0
,,
,,
,,
41
43~
43
4
32~
21~
12
1
~
aax
aaxwaa
ax
aaxw
aaxwaa
ax
x
A
A
A
A
(12)
Here, 4321 aaaa and 1,0~ A
w
The elements of the generalized trapezoidal fuzzy numbers Rx are real numbers, and its
membership function xA~ is the regularly and continuous convex function, it shows that the
membership degree to the fuzzy sets. If ,11 4321 aaaa then A~
is called the normalized
trapezoidal fuzzy number. Especially, if ,1~ A
w then A~
is called trapezoidal fuzzy
number ;,,, 4321 aaaa if ,4321 aaaa then A~
is reduced to a triangular fuzzy number.
If ,4321 aaaa then A~
is reduced to a real number.
Suppose that awaaaaa ~4321 ;,,,~ and b
wbbbbb ~4321 ;,,,~ are two generalized trapezoidal
fuzzy numbers, then the operational rules of the generalized trapezoidal fuzzy
numbers a~ and b~
are shown as follows (Chen and Chen, 2009):
ba wbbbbwaaaaba ~4321~4321 ;,,,;,,,
~~
ba wwbabababa ~~44332211 ,min;,,,
(13)
ba wbbbbwaaaaba ~4321~4321 ;,,,;,,,
~~
ba wwbabababa ~~14233241 ,min;,,,
(14)
ba wbbbbwaaaaba ~4321~4321 ;,,,;,,,
~~
ba wwdcba ~~ ,min;,,,
(15)
17
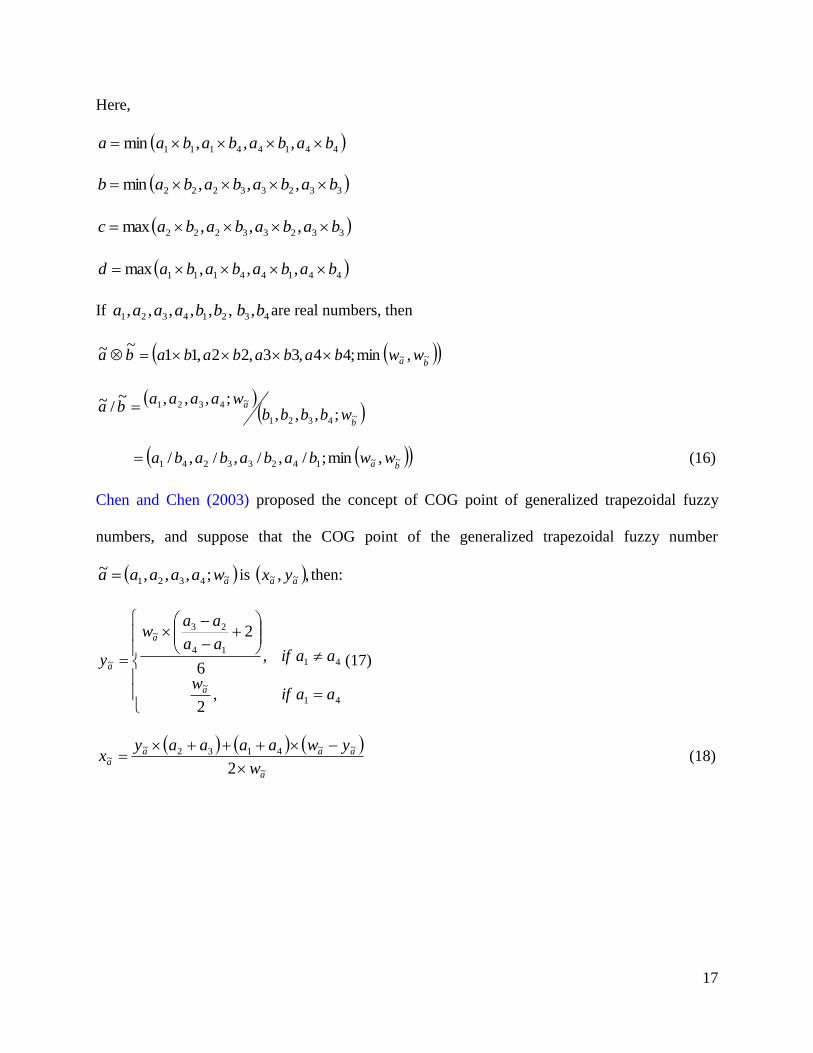
Here,
44144111 ,,,min babababaa
33233222 ,,,min babababab
33233222 ,,,max babababac
44144111 ,,,max babababad
If 43214321 ,,,,,,, bbbbaaaa are real numbers, then
ba wwbababababa ~~ ,min;44,33,22,11
~~
b
a
wbbbbwaaaa
ba~4321
~4321
;,,,;,,,~
/~
ba wwbabababa ~~14233241 ,min;/,/,/,/
(16)
Chen and Chen (2003) proposed the concept of COG point of generalized trapezoidal fuzzy
numbers, and suppose that the COG point of the generalized trapezoidal fuzzy number
awaaaaa ~4321 ;,,,~ is ,, ~~ aa yx then:
41
~
41
14
23~
~
,2
,6
2
aaifw
aaifaa
aaw
y
a
a
a (17)
a
aaaa
w
ywaaaayx
~
~~4132~~
2
(18)

18
Fig. 4. Trapezoidal Fuzzy Number [Thorani et al. (2012)]
2.5 Ranking of Generalized Trapezoidal Fuzzy Numbers [Thorani et al. (2012)]
The centroid of a trapezoid is considered as the balancing point of the trapezoid (Fig. 4). Divide
the trapezoid into three plane figures. These three plane figures are a triangle (APB), a rectangle
(BPQC), and a triangle (CQD), respectively. Let the centroids of the three plane figures be G1,
G2, and G3 respectively. The Incenter of these Centroids G1, G2 and G3 is taken as the point of
reference to define the ranking of generalized trapezoidal fuzzy numbers. The reason for
selecting this point as a point of reference is that each centroid point are balancing points of each
individual plane figure, and the Incentre of these Centroid points is a much more balancing point
for a generalized trapezoidal fuzzy number. Therefore, this point would be a better reference
point than the Centroid point of the trapezoid.
Consider a generalized trapezoidal fuzzy number ,;,,,~
wdcbaA (Fig. 4). The Centroids of the
three plane figures are ,3
,3
21
wbaG
2,
22
wcbG and
3,
3
23
wdcG respectively.
w
0 ( ,0)A a
( ,0)B b ( ,0)C c
( ,0)D d
( , )Q c w ( , )P b w
1G
3G
2G

19
Equation of the line 31GG is3
wy and 2G does not lie on the line .31GG Therefore, 21GG and 3G are
non-collinear and they form a triangle.
We define the Incentre 00~ , yxIA
of the triangle with vertices G1, G2 and G3 of the generalized
trapezoidal fuzzy number wdcbaA ;,,,~ as
323
,3
2
23
2
, 00~
wwwdccbba
yxIA
(19)
Here
6
23 22wdbc
3
222
badc
6
23 22wbac
As a special case, for triangular fuzzy number ,;,,,~
wdcbaA i.e. bc the incentre of Centroids
is given by
zyx
wz
wy
wx
zyx
dbzyb
bax
yxIA
323,
3
2
3
2
, 00~
(20)
Here
6
22 22wbd
x
20
3
2ad
y
6
22 22wab
z
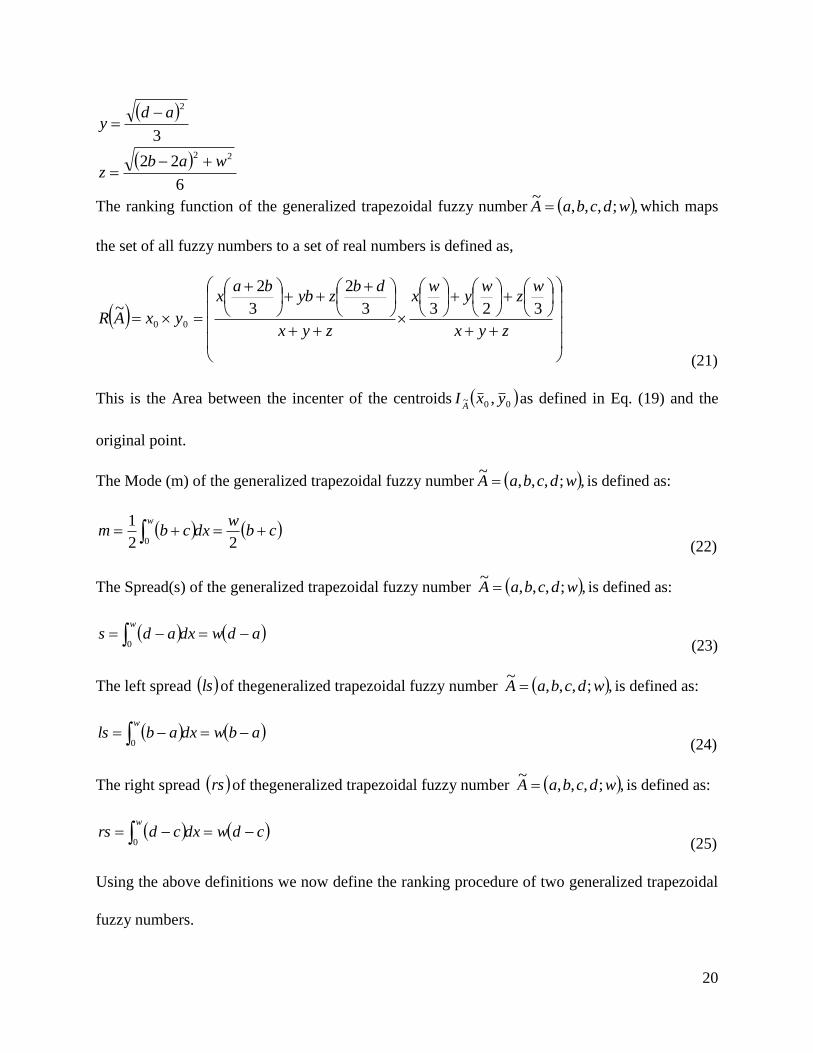
The ranking function of the generalized trapezoidal fuzzy number ,;,,,~
wdcbaA which maps
the set of all fuzzy numbers to a set of real numbers is defined as,
zyx
wz
wy
wx
zyx
dbzyb
bax
yxAR3233
2
3
2
~00
(21)
This is the Area between the incenter of the centroids 00~ , yxIA
as defined in Eq. (19) and the
original point.
The Mode (m) of the generalized trapezoidal fuzzy number ,;,,,~
wdcbaA is defined as:
cbw
dxcbmw
22
1
0 (22)
The Spread(s) of the generalized trapezoidal fuzzy number ,;,,,~
wdcbaA is defined as:
adwdxadsw
0 (23)
The left spread ls of thegeneralized trapezoidal fuzzy number ,;,,,~
wdcbaA is defined as:
abwdxablsw
0 (24)
The right spread rs of thegeneralized trapezoidal fuzzy number ,;,,,~
wdcbaA is defined as:
cdwdxcdrsw
0 (25)
Using the above definitions we now define the ranking procedure of two generalized trapezoidal
fuzzy numbers.

21
Let 11111 ;,,,~
wdcbaA and 22222 ;,,,~
wdcbaB be two generalized trapezoidal fuzzy numbers.
The working procedure to compare A~
and B~
is as follows:
Step 1: Find AR~
and BR~
Case (i) If BRAR~~
then BA~~
Case (ii) If BRAR~~
then BA~~
Case (iii) If BRAR~~
comparison is not possible, then go to step 2.
Step 2: Find Am~
and Bm~
Case (i) If BmAm~~
then BA~~
Case (ii)If BmAm~~
then BA~~
Case (iii) If BmAm~~
comparison is not possible, then go to step 3.
Step 3: Find As~
and Bs~
Case (i) If BsAs~~
then BA~~
Case (ii)If BsAs~~
then BA~~
Case (iii) If BsAs~~
comparison is not possible, then go to step 4.
Step 4: Find Als~
and Bls~
Case (i) If BlsAls~~
then BA~~
Case (ii)If BlsAls~~
then BA~~
Case (iii) If BlsAls~~
comparison is not possible, then go to step 5.
Step 5: Examine 1w and 2w
Case (i) If 21 ww then BA~~

22
Case (ii) If 21 ww then BA~~
Case (iii) If 21 ww then BA~~
3. Proposed Appraisement Module
A fuzzy based service quality and performance appraisement module proposed in this paper has
been present below. General hierarchy criteria (GHC) for evaluating overall service quality in
relation to the hostel mess, adapted in this paper has been shown in Table 1. It consists of two-
level index system; which aims at achieving the target to evaluate overall appraisement index. 1st
level lists out a number of evaluation indices: tangibility, reliability, responsiveness, assurance
and empathy; 2nd level comprises of various sub-indices. Procedural steps for quality and
performance evaluation have been presented as follows:
1. Selection of linguistic variables towards assigning priority weights (of individual evaluation
indices both at 1st as well as 2nd level) and appropriateness rating (performance extent)
corresponding to each 2nd level sub-indices.
2. Collection of expert opinion from a selected decision-making group (subjective judgment) in
order to express the priority weight as well as appropriate rating against each of the evaluation
indices.
3. Representing decision-makers’ linguistic judgments using appropriate fuzzy numbers set.
4. Use of fuzzy operational rules towards estimating aggregated weight as well as aggregated
rating (pulled opinion of the decision-makers) for each of the evaluation index.
5. Calculation of computed performance rating of individual 1st level evaluation indices and
finally overall performance index called Fuzzy Performance Index (FPI).

23
Appropriateness rating for each of the 1st level evaluation index iU (rating of thi 1st level index)
has been computed as follows:
ij
ijij
iw
wUU (26)
In this expression (Eq. 26) ijU is denoted as the aggregated fuzzy appropriateness rating
against thj sub-index (at 2nd level) which is under thi main index in the 1st level. ijw is the
aggregated fuzzy weight against thj sub-index (at 2nd level) which is under thi main index in 1st
level.
The Fuzzy Performance Index (FPI) has been computed as:
i
ii
w
wUFPIU (27)
In this expression (Eq. 27) iU is denoted as the computed fuzzy appropriateness rating (obtained
using Eq. 26) against thi at 1st level main index. iw is the aggregated fuzzy priority weight
against thi 1st level main index.
6. Investigation for identifying ill-performing areas those seek for future improvement.
4. Numerical Illustrations
The proposed appraisement module has been implemented in a hostel mess at NIT Rourkela,
India. The module encompasses of various evaluation indices at different levels. An evaluation
team has been deployed to assign priority weights (importance extent) against different
evaluation indices considered in the proposed appraisement model. A questionnaire has been
formed and circulated among the decision-makers (experts) to provide the required detail.
Collected data has been explored to investigate application feasibility of the proposed

24
appraisement platform. After critical investigation and scrutiny each decision-maker has been
instructed to explore the linguistic scale (Table 2) towards assignment of priority weight and
appropriateness rating against each evaluation indices. Appropriateness rating for 2nd level sub-
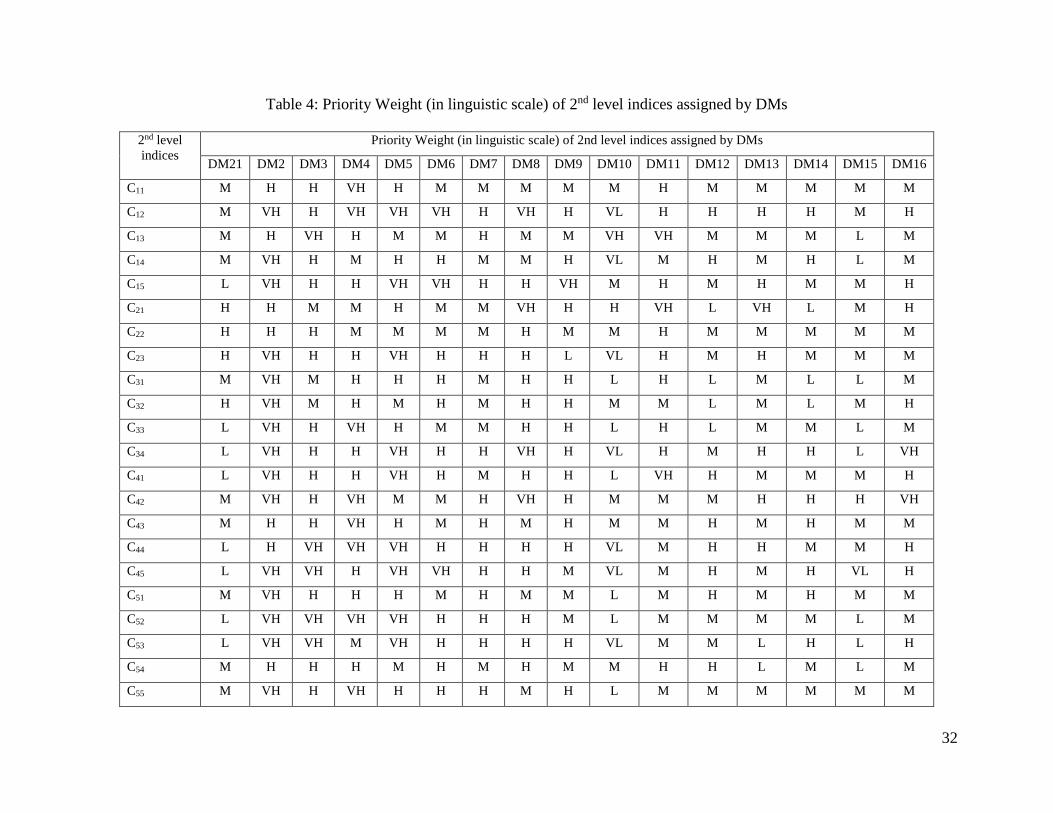
indices has been furnished in Table 3. Tables 4-5 provide subjective judgment of the evaluation
team members expressed through linguistic terms in relation to weight assignment against
various evaluation indices (both at 1st and 2nd level), respectively. These linguistic expressions
(human judgment) have been converted into appropriate generalized trapezoidal fuzzy numbers
as presented in Table 2. The method of simple average has been used to obtain aggregated
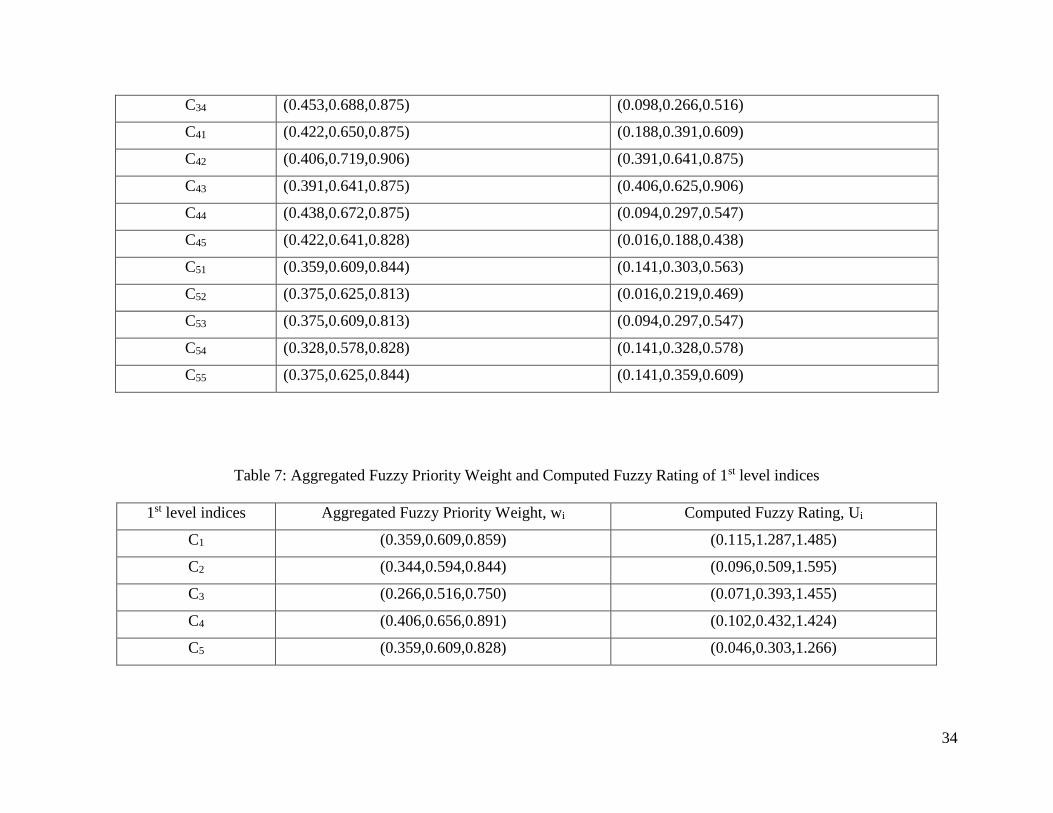
priority weights and aggregated ratings of 2nd level sub-indices (Tables 6). Computed fuzzy
performance ratings (obtained by using Eqs. 27) and aggregated fuzzy priority weight for 1st
level main indices and tabulated in Table 7. Finally, Eq. 28 has been used to obtain overall FPI.
Overall FPI thus becomes: (0.036, 0.589, 3.478).
The concept of ‘Ranking of fuzzy numbers’ [Thorani et al. (2012)] has been adapted here to
indentify ill-performing areas in relation to hostel mess service. 2nd level sub-indices have been
ranked based on their individual Fuzzy Performance Importance Index (FPII) [Lin et al., 2006].
It has been computed as follows:
ijijj UwFPII 1 (28)
Here jFPII is denoted as the Fuzzy Performance Importance Index of thj sub-index; whose
aggregated performance rating is ijU and aggregated priority weight ijw . The equivalent crisp
measure corresponding to IndividualFPIIR has been computed; thus, 2nd level sub-indices have
been ranked accordingly (Table 8).

25
5. Conclusions
The present work proposes to develop a service quality model in relation to a hostel mess, which
describes how the quality of services is perceived by customers. The work examines that quality
dimensions are interrelated and that the importance of image should be recognized.
The contribution of this research has been furnished below.
1. Development of fuzzy-based integrated service quality and performance appraisement
module in relation to a hostel mess. Industries/ enterprises/ service sectors can utilize this
appraisement module as a test kit to assess and improve overall performance extent.
2. Estimation of overall performance index; identification of ill-performing areas.
3. Based on estimated overall performance index; different service sectors (of similar type:
hostel mess in the present case) can be ranked accordingly (benchmarking).
6. References
1. S.S. Andaleeb and C. Conway, ‘Customer satisfaction in the restaurant industry: an
examination of the transaction-specific model’, Journal of Services Marketing, 20/1 (2006)
3–11.
2. I. Hau-siu Chow, V.P. Lau, T. Wing-chun Lo, Z. Sha, H. Yun, ‘Service quality in
restaurant operations in China: Decision- and experiential-oriented perspectives’,
Hospitality Management, 26 (2007) 698–710.
3. L. Ko, and K. Har, ‘Service dimensions of service quality impacting customer satisfaction
of fine dining restaurants in Singapore’, Master in Hospitality Administration, William F.
Harrah College of Hotel Administration, Graduate School, University of Nevada Las
Vegas, January 2008.
26
4. D. Xue, Q. Zhao, and X. Guo, ‘TOPSIS Method for Evaluation Customer Service
Satisfaction to Fast Food Industry’, ©2008 IEEE.
5. S. Markovic, S. Raspor, and K. Šegaric, ‘Does Restaurant Performance Meet Customers’
Expectations? An Assessment Of Restaurant Service Quality Using A Modified Dineserv
Approach’, Tourism and Hospitality Management, 16/2 (2010) 181-195.
6. Shi Yu-Qiang, Wang Jun-Jia ©2011 IEEE, ‘Evaluation of Service Quality of Restaurant
Enterprise Based on SERVQUAL’.
7. S.A. Al Khattab, J.S. Aldehayyat, ‘Perceptions of Service Quality in Jordanian Hotels’,
International Journal of Business and Management, 6/7 (2011) 226-233.
8. F. Mola and J. Jusoh, ‘Service Quality in Penang Hotels: A Gap Score Analysis’, World
Applied Sciences Journal 12 (Special Issue of Tourism & Hospitality), (2011) 19-24.
9. H. Min, and H. Min, ‘Benchmarking the service quality of fast-food restaurant franchises
in the USA: A longitudinal study’, Benchmarking: An International Journal, 18/2 (2011)
282 – 300.
10. M. Haghighi, A. Dorosti, A. Rahnama and A. Hoseinpour, ‘Evaluation of factors affecting
customer loyalty in the restaurant industry’, African Journal of Business Management,
6(14) (2012) 5039-5046.
11. A. Determinant Factors of
Perceived Service Quality in the Food Retail Industry of Turkey, 2012 International
Conference on Economics, Business Innovation IPEDR vol.38 (2012) © (2012) IACSIT
Press, Singapore.
27
12. A Nicolaides, Service quality provision in upmarket restaurants: a survey of diners in three
restaurants in a Gauteng casino complex, African Journal of Hospitality, Tourism and
Leisure Vol. 2 (2) - (2012), pp. 1-21.
13. Seung Ah Yoo, Customer Perceptions of Restaurant Cleanliness: A Cross Cultural Study,
Master of Science In Hospitality and Tourism Management, July 9, 2012, Blacksburg,
Virginia.
14. Zadeh, L.A., 1965, “Fuzzy sets, Information and Control”, Vol. 8, No. 3, pp. 338–353.
15. Zadeh, L.A., 1975, “The concept of a linguistic variable and its application to
approximate reasoning-I and II”, Information Sciences, Vol. 8, No. 3(I) 4(II), pp. 199–
249(I) 301–357(II).
16. Buckley, J.J., 1985, “Fuzzy hierarchical analysis”, Fuzzy Sets and Systems, Vol. 17, No.
3, pp. 233–247.
17. Negi, D.S., 1989, “Fuzzy analysis and optimization”, Ph.D. Dissertation, Department of
Industrial Engineering, Kansas State University.
18. Kaufmann, A., and Gupta, M.M., 1991, “Introduction to Fuzzy Arithmetic: Theory and
Applications”. Van Nostrand Reinhold Electrical/Computer Science and Engineering
Series, New York.
19. Klir, G.J., and Yuan, B., 1995, “Fuzzy Sets and Fuzzy Logic: Theory and Applications”,
Prentice-Hall Inc., USA.
20. Zimmermann, H.J., 1991, “Fuzzy Set Theory and its Applications”, second eds. Kluwer
Academic Publishers, Boston, Dordrecht, London.

28
21. Moeinzadeh, P., and Hajfathaliha, A., 2010, “A Combined Fuzzy Decision Making
Approach to Supply Chain Risk Assessment”, International Journal of Human and
Social Sciences, Vol. 5, No. 13, pp. 859-875.
22. Chen, S.H., 1985, “Ranking fuzzy numbers with maximizing set and minimizing set”,
Fuzzy Sets and Systems, Vol. 17, No. 2, pp. 113-129.
23. Chen, S.M., and Chen, J.H., 2009, “Fuzzy risk analysis based on ranking generalized
fuzzy numbers with different heights and different spreads”, Expert Systems with
Applications, Vol. 36, No. 3, pp. 6833-6842.
24. Chen, S.J., and Chen, S.M., 2003, “A new method for handing multi-criteria fuzzy
decision-making problems using FN-IOWA operators”, Cybernetics and Systems, Vol.
34, No.2, pp. 109-137.
25. Y. L. P. Thorani, P. Phani Bushan Rao and N. Ravi Shankar, Ordering Generalized
Trapezoidal Fuzzy Numbers, Int. J. Contemp. Math. Sciences, Vol. 7, 2012, no. 12, 555 –
573.
26. Ching-Torng Lin, Hero Chiu, Po-Young Chu, Agility index in the supply chain,
International Journal of Production Economics, Volume 100, Issue 2, April 2006, Pages
285–299.

29
Table 1: A Fuzzy Based Performance Appraisement Module for
Mess Service Quality Evaluation in Hostels
Goal 1st level main indices 2nd level sub-indices
Mess service quality
and performance, C
Tangibility, C1 Comfortable environment, C11
Dish tastes good (Food Quality: fresh, hot served, well cooked, well presented), C12
Reasonable charge, C13
Dishes quantity enough (Food Quantity), C14
Staff appearance clean and tidy/ Employee cleanliness and tidiness, C15
Reliability, C2 Timely perform commitment, C21
Staff is enthusiasm, C22
Service is appropriate, C23
Responsiveness, C3 Service time, C31
Speedy service, C32
Service initiative, C33
Prompt in meeting all promises, C34
Assurance, C4 Staff is polite (Employee politeness/ behavioral characteristic friendly and courteous), C41
Mess sanitation, C42
Mess safety, C43
Ability to recover mistakes, C44
Care about customer complaints, C45
Empathy, C5 Category of dishes enough (Product/ food variety), C51
Solve customer’s problem timely (Problem solving capability), C52
Understand customer (Customer understanding), C53
Business time is reasonable, C54
Employees are empowered to provide compensations for inaccurate service, C55

30
Table 2: Five-member linguistic terms and their corresponding fuzzy numbers
Linguistic terms for weight assignment Linguistic terms for ratings fuzzy numbers
Very low, VL Very poor, VP (0.0, 0.0, 0.25)
Low, L Poor, P (0.0, 0.25, 0.5)
Medium, M Medium, M (0.25, 0.5, 0.75)
High, H Satisfactory, S (0.5, 0.75, 1.0)
Very High, VH Extremely Satisfactory, ES (0.75, 1.0, 1.0)

31
Table 3: Appropriateness rating (in linguistic scale) of 2nd level indices assigned by DMs
2nd level
indices
Appropriateness rating (in linguistic scale) of 2nd level indices assigned by DMs
DM21 DM2 DM3 DM4 DM5 DM6 DM7 DM8 DM9 DM10 DM11 DM12 DM13 DM14 DM15 DM16
C11 M S S VP M M S M M M M VP M S M M
C12 S S M P P VP M M M P S P P P P P
C13 M P ES M VP P M M S VP ES P P P P S
C14 S P P S VP VP P M S VP P P M P M S
C15 P S M S M ES S S M M S S M S M M
C21 P S M M M P S S P M M S M S M M
C22 M M M P M S M M M M M M P P P P
C23 P M M P M M M S M M M M P P P P
C31 S P M VP M P P S P M S S P S M M
C32 P VP M P P P P S S P M M M M M S
C33 M P M P P M P S S P M P P VP M M
C34 P VP P M VP VP M S M VP M P P VP P P
C41 M VP M P VP VP VP S M VP M M M S M M
C42 S ES S S M M M M M M S S M S S M
C43 S S S P S M S S M S S S P S S S
C44 P P P VP VP M M M M VP P P M M P P
C45 P VP P VP P P M P P P VP VP P VP P P
C51 M VP VP S VP M P M P VP M P P VP S M
C52 P VP P VP P P P P P P P P M VP P P
C53 S P P VP VP M M M M VP P P P P P P
C54 M VP P S VP P P S M VP M VP M P P M
C55 M VP P VP P M M P M P M P M M M M
32
Table 4: Priority Weight (in linguistic scale) of 2nd level indices assigned by DMs
2nd level
indices
Priority Weight (in linguistic scale) of 2nd level indices assigned by DMs
DM21 DM2 DM3 DM4 DM5 DM6 DM7 DM8 DM9 DM10 DM11 DM12 DM13 DM14 DM15 DM16
C11 M H H VH H M M M M M H M M M M M
C12 M VH H VH VH VH H VH H VL H H H H M H
C13 M H VH H M M H M M VH VH M M M L M
C14 M VH H M H H M M H VL M H M H L M
C15 L VH H H VH VH H H VH M H M H M M H
C21 H H M M H M M VH H H VH L VH L M H
C22 H H H M M M M H M M H M M M M M
C23 H VH H H VH H H H L VL H M H M M M
C31 M VH M H H H M H H L H L M L L M
C32 H VH M H M H M H H M M L M L M H
C33 L VH H VH H M M H H L H L M M L M
C34 L VH H H VH H H VH H VL H M H H L VH
C41 L VH H H VH H M H H L VH H M M M H
C42 M VH H VH M M H VH H M M M H H H VH
C43 M H H VH H M H M H M M H M H M M
C44 L H VH VH VH H H H H VL M H H M M H
C45 L VH VH H VH VH H H M VL M H M H VL H
C51 M VH H H H M H M M L M H M H M M
C52 L VH VH VH VH H H H M L M M M M L M
C53 L VH VH M VH H H H H VL M M L H L H
C54 M H H H M H M H M M H H L M L M
C55 M VH H VH H H H M H L M M M M M M

33
Table 5: Priority Weight (in linguistic scale) of 1st level indices assigned by DMs
1st
level
indices
Priority Weight (in linguistic scale) of 1st level indices assigned by DMs
DM21 DM2 DM3 DM4 DM5 DM6 DM7 DM8 DM9 DM10 DM11 DM12 DM13 DM14 DM15 DM16
C1 M H H H M H H M M M H M M M M H
C2 H H M H L H M H H L H M H M M M
C3 M VH H H L H M H M L M L M L L M
C4 M H H VH M M H H M M H H M H M H
C5 H VH VH H L M H H H L H M L M M M
Table 6: Aggregated Fuzzy Priority Weight and Aggregated Fuzzy Rating of 2nd level indices
2nd level indices Aggregated Fuzzy Priority Weight, wij Aggregated Fuzzy Rating, Uij
C11 (0.344,0.594,0.828) (0.281,0.500,0.750)
C12 (0.516,0.750,0.922) (0.156,0.391,0.641)
C13 (0.375,0.625,0.828) (0.219,0.438,0.656)
C14 (0.344,0.578,0.813) (0.172,0.375,0.625)
C15 (0.469,0.719,0.906) (0.375,0.625,0.859)
C21 (0.406,0.656,0.859) (0.281,0.656,0.781)
C22 (0.328,0.578,0.828) (0.186,0.438,0.688)
C23 (0.406,0.641,0.859) (0.172,0.422,0.672)
C31 (0.313,0.563,0.797) (0.234,0.469,0.719)
C32 (0.344,0.594,0.828) (0.188,0.469,0.672)
C33 (0.328,0.578,0.797) (0.156,0.391,0.641)
34
C34 (0.453,0.688,0.875) (0.098,0.266,0.516)
C41 (0.422,0.650,0.875) (0.188,0.391,0.609)
C42 (0.406,0.719,0.906) (0.391,0.641,0.875)
C43 (0.391,0.641,0.875) (0.406,0.625,0.906)
C44 (0.438,0.672,0.875) (0.094,0.297,0.547)
C45 (0.422,0.641,0.828) (0.016,0.188,0.438)
C51 (0.359,0.609,0.844) (0.141,0.303,0.563)
C52 (0.375,0.625,0.813) (0.016,0.219,0.469)
C53 (0.375,0.609,0.813) (0.094,0.297,0.547)
C54 (0.328,0.578,0.828) (0.141,0.328,0.578)
C55 (0.375,0.625,0.844) (0.141,0.359,0.609)
Table 7: Aggregated Fuzzy Priority Weight and Computed Fuzzy Rating of 1st level indices
1st level indices Aggregated Fuzzy Priority Weight, wi Computed Fuzzy Rating, Ui
C1 (0.359,0.609,0.859) (0.115,1.287,1.485)
C2 (0.344,0.594,0.844) (0.096,0.509,1.595)
C3 (0.266,0.516,0.750) (0.071,0.393,1.455)
C4 (0.406,0.656,0.891) (0.102,0.432,1.424)
C5 (0.359,0.609,0.828) (0.046,0.303,1.266)

35
Table 8: Ranking order of 2nd level indices
2nd level indices FPII Crisp Value Ranking Order
C11 (0.184,0.203,0.129) 0.064 3
C12 (0.076,0.098,0.050) 0.029 18
C13 (0.137,0.164,0.113) 0.051 9
C14 (0.113,0.158,0.117) 0.048 11
C15 (0.199,0.176,0.081) 0.058 6
C21 (0.167,0.226,0.110) 0.068 2
C22 (0.125,0.185,0.118) 0.055 8
C23 (0.102,0.151,0.095) 0.045 12
C31 (0.161,0.205,0.146) 0.063 4
C32 (0.123,0.190,0.116) 0.056 7
C33 (0.105,0.165,0.130) 0.050 10
C34 (0.054,0.083,0.065) 0.025 20
C41 (0.109,0.137,0.076) 0.041 14
C42 (0.232,0.180,0.082) 0.062 5
C43 (0.247,0.224,0.113) 0.075 1
C44 (0.053,0.097,0.068) 0.029 19
C45 (0.009,0.067,0.075) 0.020 22
C51 (0.090,0.118,0.088) 0.036 16
C52 (0.010,0.082,0.088) 0.025 21
C53 (0.059,0.116,0.102) 0.036 17
C54 (0.095,0.138,0.099) 0.042 13
C55 (0.088,0.135,0.095) 0.040 15