a future of work programme report - nz … · the new zealand aged care workforce survey 2014 a...
TRANSCRIPT
THE NEW ZEALAND AGED CARE WORKFORCE SURVEY 2014A FUTURE OF WORK PROGRAMME REPORT
Katherine Ravenswood, Julie Douglas, Stephen Teo
‘Working a full day, 8 hours or longer but over a 12 hour day, receiving no compensation for working through
lunch and dinner times. Unreasonable travel pay does not recognise the costs of keeping a vehicle on the
road. When describing my job to people they are usually very surprised and amazed that anyone could work
like this in a Westernised country. I do this job for love. I appreciate your survey, take the results to those
who can make a difference’.
– home/community caregiver
Acknowledgements
First of all, thank you to all who took the time to complete the survey.
We would very much like to acknowledge the support of the New Zealand Work Research Institute and the AUT University
Faculty of Business & Law which has supported this survey.
The survey was developed in consultation with an industry reference group and we would like to thank the following
organisations for their input (alphabetical order):
• BUPA Care New Zealand Limited
• Care Association of New Zealand
• Careerforce
• Community and Home Health Association
• New Zealand Aged Care Association
• New Zealand Nurses’ Organisation
• New Zealand Service and Foodworkers’ Union
• Public Service Association
We were also assisted by a number of students and researchers along the way and we would also like to acknowledge their
contribution, especially that of Diep Nguyen:
• Ailine Autufuga
• Leah Brewster
• Pranita Anand
• Cythnia Fernandez Roich
• Hana Mose
• Vea Mamanu
• Annie Ng
• Margrette Pulotu
• Sally Tran
ISBN: 978-1-927184-28-8
Authored by Katherine Ravenswood, Julie Douglas and Stephen Teo
Contents
1. Introduction 01
2. Background 02
3. Our Approach 06
4. Home Care Workers 07
5. Residential Aged Care 19
6. Conclusions 27
Executive Summary
This report details findings from the New Zealand Aged Care Survey 2014, supported by the New Zealand Work Research
Institute and the AUT University Faculty of Business and Law. The survey questioned both employees and managers in
residential and home/community aged care about who is working, and what their experiences are. This report focuses on
employee responses, and specifically those of non-nursing direct care workers, referred to throughout as ‘caregivers’. Close to
600 participants in home/community aged care returned surveys and nearly 300 residential aged care employees returned
surveys.
There are a number of similarities across both residential and homecare aged caregivers’ work experiences. As expected, both
home/community and residential care are highly feminised and an older workforce. For both, key sources of job dissatisfaction
are low wages, high workload, abuse from clients/residents, and lack of support from managers. However, the issue of a high
workload was raised more by residential caregivers than home/community caregivers as a negative issue for their job.
Interactions with, and care for clients/residents was positive and important for both groups of caregivers in the survey. Good
and supportive workplace relationships with colleagues and managers are very important to residential and home/community
caregivers. Home/community care workers also liked the flexibility of their work and hours.
Most participants perceived that they had the skills and knowledge to carry out their jobs, and had worked in aged care for
some years. A significant proportion held national qualifications in aged care support. Residential based caregivers had more
managerial support for completing qualifications than those based in home/community work. Participants want to engage in
further training and career development.
While fewer in number, participants noted stress (from workload, negative workplace relationships, the emotional work of
caring for the aged and ill, situations resulting in death) and fatigue as negative issues, and health and safety concerns. There
was greater reporting of abuse from clients/residents among the residential based caregivers. Workload and stress was a more
significant issue for the residential aged care participants.

1
1. Introduction
The survey was inspired by the 2012 Australian Aged Care Census report. At that point there was no similar nationally based survey of the entire aged care workforce in New Zealand. There has been considerable research now into residential aged care work and the workforce in general, but still not as much in home/community caregivers in aged care.
We intended to capture the most complete data set as possible, given our resources, and knowing from discussions in
developing the survey that high response rates are often difficult in the aged care sector. We do not report here on responses
from managers as we feel there were too few responses to be able to report meaningful conclusions. However, there are
sector-wide initiatives underway using census data and also working with providers to gain a more accurate overall headcount
of caregivers. While we are not able to provide a ‘headcount’ of the sector, this first survey provides a realistic benchmark and
sound information on aged care workers’ experience of work in this sector. This is particularly so for community and home
health workers.
The release of this report is timely. It contributes to our knowledge of the sector at a time where we have seen Kristine
Bartlett succeed in the Equal Pay Act case1 in 2013. The Equal Pay Act case followed on from the Human Rights Commission
inquiry and Caring Counts report in 2012, and its associated aged care summits. There is now, perhaps enforced, recognition
that the aged care sector can no longer remain ‘under the radar’. In 2013 legal action by PSA members regarding travel time
between home care clients was the catalyst for negotiations between the Crown and unions, employers and funding agencies,
with the resulting agreement due to be ratified by key stakeholers in 2015. There is also work with key stakeholders in the
home and community health sector to develop more regularised work for employees. These all follow on from the Human
Rights Commission inquiry, and subsequent summits, led by Professor Judy McGregor in 2012, highlighting ongoing issues for
the workforce and its management. Another recent national initiative is that led by Careerforce and Health Workforce New
Zealand into Workforce planning for the total (not just aged care) unregulated care workforce.
In the following report we provide some background information from international research that has been carried out in
both residential and home/community aged care. We then present the findings from the survey. We focus on non-professional
carers in home and community health and in residential aged care. These are grouped around responses to the nature
of the work, who the respondents are, job satisfaction and retention, occupational health and safety, and skills, training
and qualifications. We have refrained from including recommendations because the purpose of this report is to provide
information that is publicly available to all interested parties to inform their planning and policy for the workforce. We hope it
is used constructively.
We will be running the New Zealand Aged Care Workforce survey again in 2016 and look forward to your participation in it.
1 Service and Food workers Union Nga Ringa Tota Inc v Terranova Homes and Care Limited [2013] NZEmpC 157 ARC 63/12

2
2. Background
It is widely accepted that our population, and those of other OECD countries, is aging in proportions we have not seen before. The aging population has led to us thinking about the relationship between work and the reality of an aging workforce2. It has also led to discussions about how we will care for the increasing number of older people, and who in an aging workforce will do that care. Projections indicate that we could face a significant labour shortage in aged care in the short, medium and long term future. Some of those shortages may be met with increased migrant workers, but how we manage the workforce will be important in order to be able to upskill them to meet future demands and requirements, but also to retain quality workers and keep them in the aged care workforce3. We focus here on the non-professional direct care workers, which we will refer to as caregivers (the role is also known as healthcare assistant or personal care assistant among other variations).
We therefore need to have a good picture of not only the numbers and demographics of workers in the aged care workforce,
but also what their perceptions and experiences of the work are. This ‘picture’ needs to be updated regularly so that we can
adjust and plan accordingly. The New Zealand Aged Care Workforce Survey 2014 provides the first, or benchmark, in what
we hope will be a series of surveys that will update what we know about the aged care workforce – across both residential and
home/community care settings.
There are several areas that are important to a positive work experience that have an impact on the retention of valuable and
skilled workers:
• what work are they doing
• how the work is organised into shifts and regular hours of work
• work conditions and the work environment
• qualifications, skills and training
• occupational health and safety
• job satisfaction and quitting intentions
Who is in the workforce?
Exact numbers are hard to identify, although we can get a good indication through Census data. There are also national
initiatives underway to provide data on total numbers in the aged care workforce. Callister et al. (2014) give an overall picture
of the New Zealand aged care workforce in residential services4 :
• the majority are women
• aged over 45
• approximately 31% born overseas (residential)
• original countries of birth most common among migrant workers in residential aged care: Pacific Islands,
Asia and the UK/Ireland
• of all caregivers, 68% European, 15% Maori, 14% Asian, 9% Pacific Peoples
2 For example, McLeod, L. and Bentley, T. (2015), Managing an Aging Workforce. Auckland: EEO Trust and the New Zealand Work Research Institute.
3 Nana, G. (2014) Health & Disability Kaiawhina workforce 2013 profile. Presented at the Careerforce Workforce Development Conference 2014, Wellington, New Zealand: Careerforce New Zealand. Retrieved 14 December from http://www.careerforce.org.nz/wordpress/wp-content/uploads/Presentation-Dr-Ganesh-Nana.pdf
4 Callister, P., Didham, R., & Badkar, J. (2014). Reliance on migrant caregivers, a 2014 update (Wellington, New Zealand). Callister & Associates. Retrieved from www.callister.co.nz
3
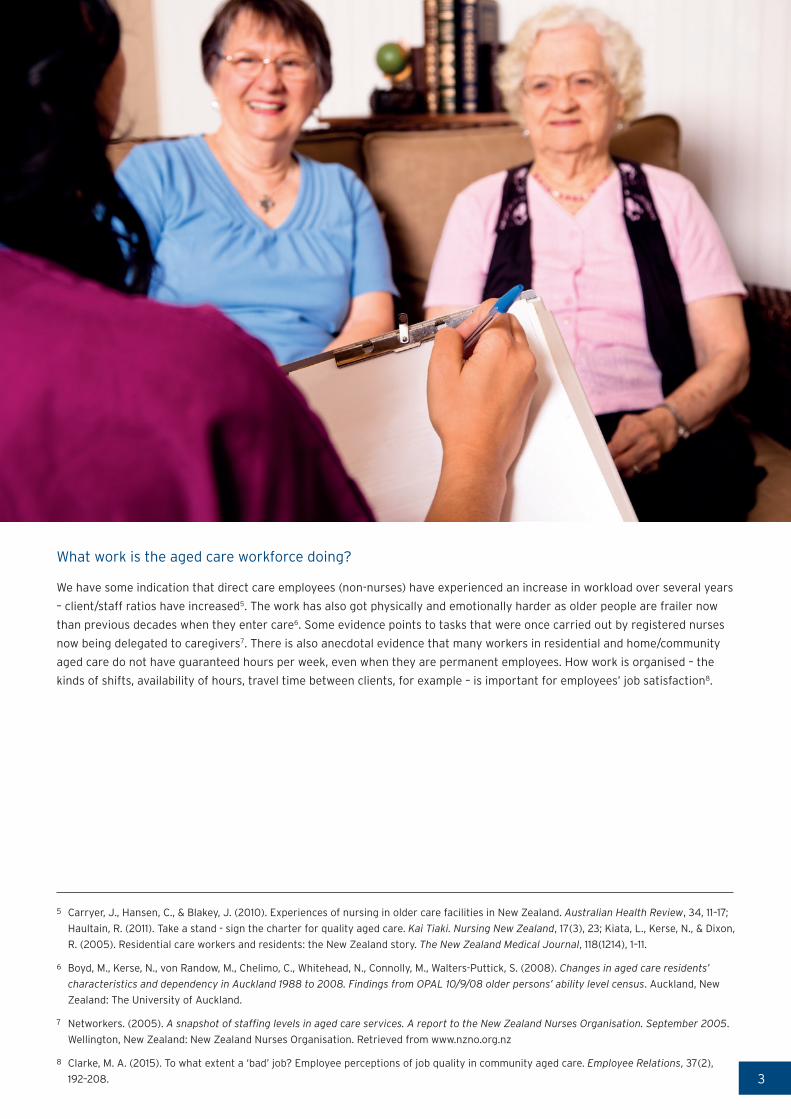
What work is the aged care workforce doing?
We have some indication that direct care employees (non-nurses) have experienced an increase in workload over several years
– client/staff ratios have increased5. The work has also got physically and emotionally harder as older people are frailer now
than previous decades when they enter care6. Some evidence points to tasks that were once carried out by registered nurses
now being delegated to caregivers7. There is also anecdotal evidence that many workers in residential and home/community
aged care do not have guaranteed hours per week, even when they are permanent employees. How work is organised – the
kinds of shifts, availability of hours, travel time between clients, for example – is important for employees’ job satisfaction8.
5 Carryer, J., Hansen, C., & Blakey, J. (2010). Experiences of nursing in older care facilities in New Zealand. Australian Health Review, 34, 11–17; Haultain, R. (2011). Take a stand - sign the charter for quality aged care. Kai Tiaki. Nursing New Zealand, 17(3), 23; Kiata, L., Kerse, N., & Dixon, R. (2005). Residential care workers and residents: the New Zealand story. The New Zealand Medical Journal, 118(1214), 1–11.
6 Boyd, M., Kerse, N., von Randow, M., Chelimo, C., Whitehead, N., Connolly, M., Walters-Puttick, S. (2008). Changes in aged care residents’ characteristics and dependency in Auckland 1988 to 2008. Findings from OPAL 10/9/08 older persons’ ability level census. Auckland, New Zealand: The University of Auckland.
7 Networkers. (2005). A snapshot of staffing levels in aged care services. A report to the New Zealand Nurses Organisation. September 2005. Wellington, New Zealand: New Zealand Nurses Organisation. Retrieved from www.nzno.org.nz
8 Clarke, M. A. (2015). To what extent a ‘bad’ job? Employee perceptions of job quality in community aged care. Employee Relations, 37(2), 192–208.

4
What are the work conditions like in aged care?
We can no longer dispute that wages are low in aged care in both residential and home/community care. Wages average little
more than the minimum wage which in 2014 was set at $14.25 per hour. As a comparison point, the New Zealand Living Wage
for 2014 was set at $18.809. In residential aged care, many caregivers are paid less compared to other occupations within
residential aged care. Indeed, this argument was made in the landmark case under the Equal Pay Act 1972, won by Kristine
Bartlett and the Service and Food Workers’ Union against her employer. Some describe the low wages in care work compared
to other occupations as ‘wage penalties’ 10.
The work environment and relationships between employees and managers is very important for aged care workers to feel
valued and appreciated. This includes managerial support, but also managers consulting with their aged care employees and
keeping them informed on what is happening in the workplace. Keeping workload at a reasonable level is also important – a
high workload and the resulting stress can influence employees to quit11.
One aspect of the work environment is the autonomy or freedom to make decisions about their work, with appropriate
managerial support, that employees have. Greater autonomy leads to greater satisfaction and retention among aged care
employees12.
Qualifications, skills and training
For a long time we have seen the aged care workforce and the work it does as unskilled. It is seen as a job that women who
have enjoyed caring for family members can easily transfer to and gain paid employment13. This view is being challenged, and
caregivers may not all view themselves as unskilled. The view that care work is unskilled may also be detrimental to the long
term sustainability of the workforce and the provision of quality care.
Recognition by management of caregivers’ skills, capabilities and knowledge results in caregivers feeling better supported and
then more likely to stay in their jobs. Caregivers also want to be encouraged in their training and to have career development
opportunities14. Of course, training opportunities and recognition does not just lead to improved retention but also,
importantly, improved quality of care15.
9 Kaine, S., & Ravenswood, K. (2013). Working in Residential Aged Care: A Trans-Tasman comparison. New Zealand Journal of Employment Relations, 38(2), 33–46. Living Wage Aotearoa http://www.livingwage.org.nz
10 Barron, D. N., & West, E. (2013). The Financial Costs of Caring in the British Labour Market: Is There a Wage Penalty for Workers in Caring Occupations? British Journal of Industrial Relations, 51(1), 104–123.McGregor, J. (2012). Caring Counts. Wellington, New Zealand: Human Rights Commission.
11 Brannon, D., Barry, T., Kemper, P., Schreiner, A., & Vasey, J. (2007). Job Perceptions and Intent to Leave Among Direct Care Workers: Evidence From the Better Jobs Better Care Demonstrations. The Gerontologist, 47(6), 820–829. Brooke, E., Goodall, J., Handrus, M. and Mawren, D. (2013), Applying workability in the Australian residential aged care context. Australasian Journal on Ageing, 32: 130–134; Clark, I. (2014). Health-care assistants, aspiration, frustration and job satisfaction in the workplace. Industrial Relations Journal, 45(4), 300–312.
12 King, A. I. I., Parsons, M., & Robinson, E. (2012). A restorative home care intervention in New Zealand: perceptions of paid caregivers.
Health & Social Care in the Community, 20(1), 70–79; King, D. (2012). It's frustrating! Managing emotional dissonance in aged care work.
Australian Journal of Social Issues, 47(1), 51-70,3.
13 England, P. (2005). Emerging Theories of Care Work. Annual Review of Sociology, 31(1), 381–399; Palmer, E., & Eveline, J. (2012). Sustaining low pay in aged care work. Gender, Work and Organization, 19(3), 254–275.
14 Chou, Y.-C., Fu, L., Kröger, T., & Ru-yan, C. (2011). Job satisfaction and quality of life among home care workers: a comparison of home care workers who are and who are not informal carers. International Psychogeriatrics, 23(05), 814–825; Dill, J. S., Morgan, J. C., & Marshall, V. W. (2013). Contingency, Employment Intentions, and Retention of Vulnerable Low-wage Workers: An Examination of Nursing Assistants in Nursing Homes. The Gerontologist, 53(2), 222–234.
15 Chester, H., Hughes, J., & Challis, D. (2014). Commissioning social care for older people: influencing the quality of direct care. Ageing & Society, 34(06), 930–950.
5
Job satisfaction and quitting intentions
It has often been assumed that ‘love of the job’ will compensate for the low wages caregivers receive in the aged care sector.
However, although enjoyment of the work itself goes a long way towards job satisfaction, external rewards such as pay rates
are now more significant for retaining caregivers. Another possible change in the aged care workforce is that individual
characteristics, such as being the primary breadwinner, are important measures of job satisfaction and retention.16 Other
important factors for job satisfaction and retention mentioned above include autonomy, recognition and career opportunities.
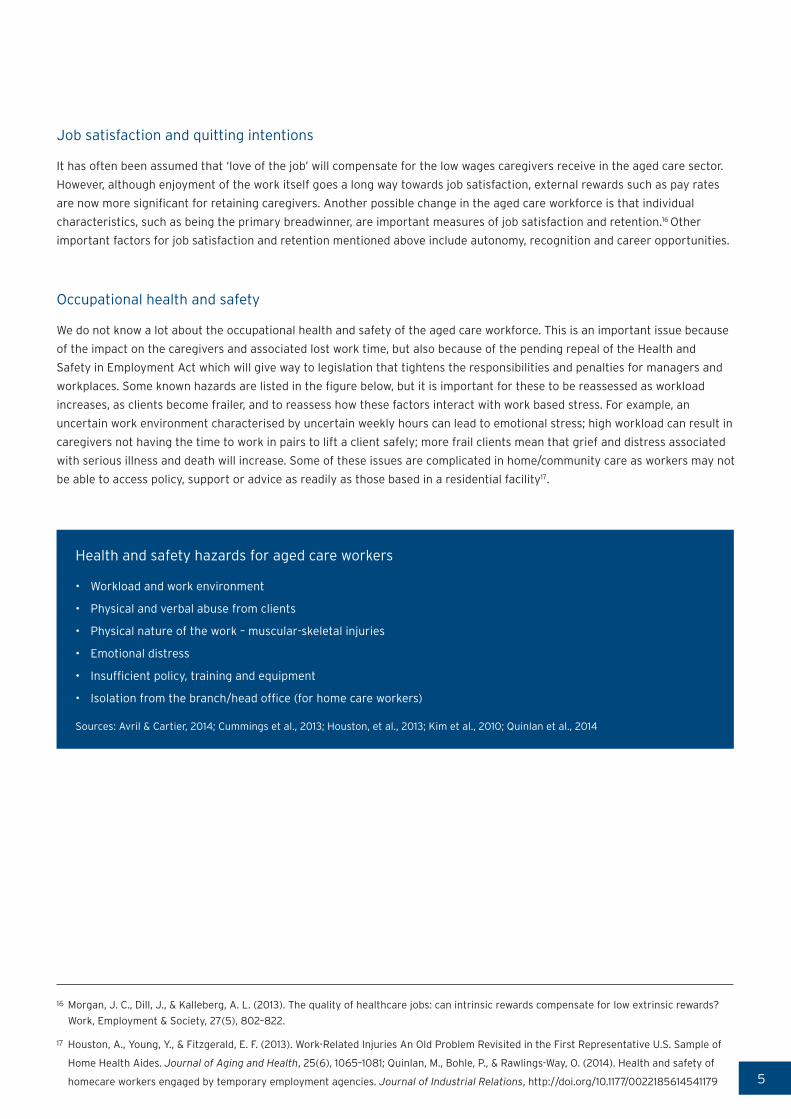
Occupational health and safety
We do not know a lot about the occupational health and safety of the aged care workforce. This is an important issue because
of the impact on the caregivers and associated lost work time, but also because of the pending repeal of the Health and
Safety in Employment Act which will give way to legislation that tightens the responsibilities and penalties for managers and
workplaces. Some known hazards are listed in the figure below, but it is important for these to be reassessed as workload
increases, as clients become frailer, and to reassess how these factors interact with work based stress. For example, an
uncertain work environment characterised by uncertain weekly hours can lead to emotional stress; high workload can result in
caregivers not having the time to work in pairs to lift a client safely; more frail clients mean that grief and distress associated
with serious illness and death will increase. Some of these issues are complicated in home/community care as workers may not
be able to access policy, support or advice as readily as those based in a residential facility17.
Health and safety hazards for aged care workers
• Workload and work environment
• Physical and verbal abuse from clients
• Physical nature of the work – muscular-skeletal injuries
• Emotional distress
• Insufficient policy, training and equipment
• Isolation from the branch/head office (for home care workers)
Sources: Avril & Cartier, 2014; Cummings et al., 2013; Houston, et al., 2013; Kim et al., 2010; Quinlan et al., 2014
16 Morgan, J. C., Dill, J., & Kalleberg, A. L. (2013). The quality of healthcare jobs: can intrinsic rewards compensate for low extrinsic rewards? Work, Employment & Society, 27(5), 802–822.
17 Houston, A., Young, Y., & Fitzgerald, E. F. (2013). Work-Related Injuries An Old Problem Revisited in the First Representative U.S. Sample of
Home Health Aides. Journal of Aging and Health, 25(6), 1065–1081; Quinlan, M., Bohle, P., & Rawlings-Way, O. (2014). Health and safety of
homecare workers engaged by temporary employment agencies. Journal of Industrial Relations, http://doi.org/10.1177/0022185614541179
6
3. Our Approach
The initial survey questions and approach were guided by the Australian Aged Care Census 2012. This allowed us to design a survey for both managers and employees in the residential and home/community based aged care sector in New Zealand. The managerial surveys were intended to gain an accurate measure of numbers and demographics of the aged care workforce. The employee surveys were designed to provide information on workforce trends such as skills, qualifications, experience, job satisfaction, health and safety and experience in the aged care sector.
Consultation with key stakeholders was important to our research approach. The surveys were validated by the reference
group (acknowledged in the front cover). The purpose of this was to gain feedback on the language used in questions, and to
identify questions from the Australian survey that were not applicable in New Zealand, and likewise to add questions that our
reference group thought were important for the New Zealand context. The reference group was also an important conduit for
information about the survey reaching potential respondents.
Through consultation with the reference group we decided that a paper survey, with an online option for managers, was the
best approach as there was insufficient information on internet and computer access among the aged care workforce. The
method we chose to distribute the surveys was primarily through requesting facility managers to randomly distribute the
surveys to their employees. Hard copy surveys were posted to all identified aged care providers. The potential distribution list
was developed from publicly available information on aged care providers from the Ministry of Health, the New Zealand Aged
Care Association, the Home and Community Health Association and Eldernet. After consultation, we also decided to distribute
surveys to home/community caregivers who were members of the Public Service Association as it was expected that home/
community caregivers would be the hardest to reach.
We also endeavoured to advertise the survey as widely as possible in the aged care sector and in addition to our reference
group disseminating information to their members, we had items in Kai Tiaki, INsite magazine and the Eldernet Gazette.
Any provider or caregiver who contacted us to request a survey (and some providers requested additional ones) were posted
surveys. Distribution, and responses, was on a nationwide basis.
A total of 3,767 surveys were distributed in home/community aged care with a total of 574 competed surveys received. In
residential aged care a total of 2,034 surveys were distributed with 266 completed responses received. This represents a
response rate of 15% in home/community aged care and 13% in residential aged care.
This research was approved by the AUT University Ethics Committee in 2014 (Ref 14/05). All surveys were anonymous, and
no responses can be traced back to the individual who completed the survey. The survey was administered from April to
June 2014. The data was entered into SPSS v22 for analysis. The qualitative data (from open ended questions) was analysed
manually.
7
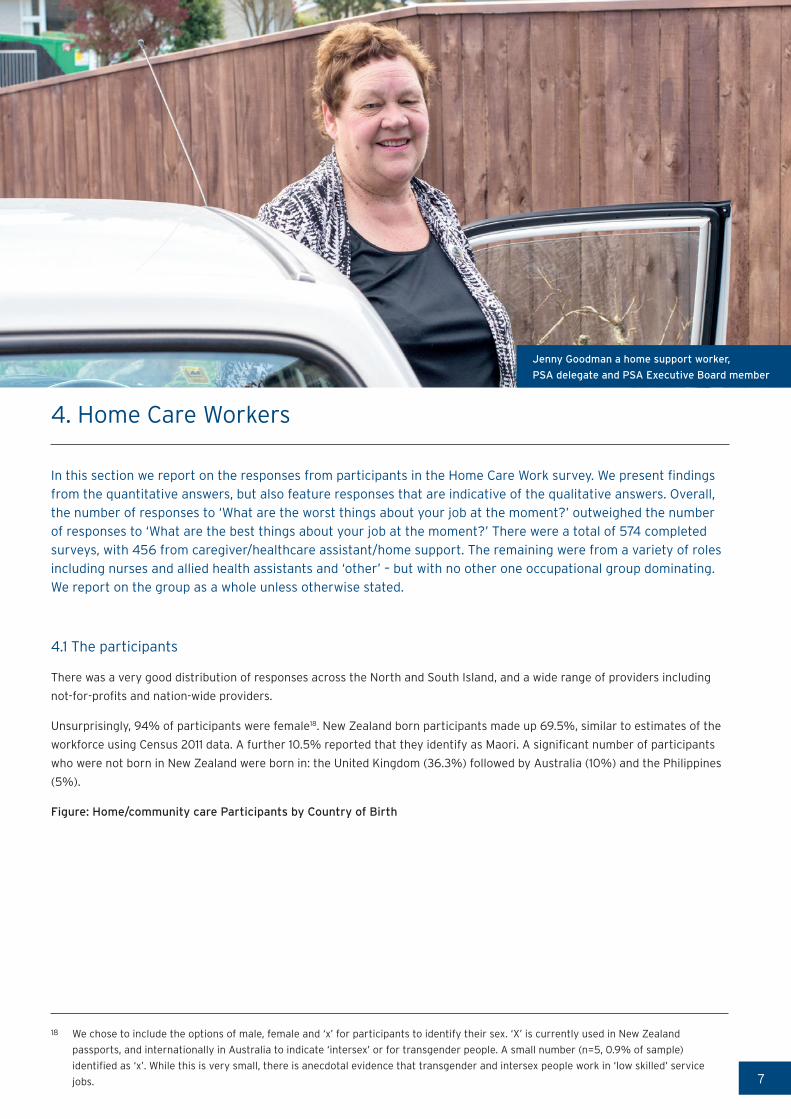
4. Home Care Workers
In this section we report on the responses from participants in the Home Care Work survey. We present findings from the quantitative answers, but also feature responses that are indicative of the qualitative answers. Overall, the number of responses to ‘What are the worst things about your job at the moment?’ outweighed the number of responses to ‘What are the best things about your job at the moment?’ There were a total of 574 completed surveys, with 456 from caregiver/healthcare assistant/home support. The remaining were from a variety of roles including nurses and allied health assistants and ‘other’ – but with no other one occupational group dominating. We report on the group as a whole unless otherwise stated.
4.1 The participants
There was a very good distribution of responses across the North and South Island, and a wide range of providers including
not-for-profits and nation-wide providers.
Unsurprisingly, 94% of participants were female18. New Zealand born participants made up 69.5%, similar to estimates of the
workforce using Census 2011 data. A further 10.5% reported that they identify as Maori. A significant number of participants
who were not born in New Zealand were born in: the United Kingdom (36.3%) followed by Australia (10%) and the Philippines
(5%).
Figure: Home/community care Participants by Country of Birth
18 We chose to include the options of male, female and ‘x’ for participants to identify their sex. ‘X’ is currently used in New Zealand passports, and internationally in Australia to indicate ‘intersex’ or for transgender people. A small number (n=5, 0.9% of sample) identified as ‘x’. While this is very small, there is anecdotal evidence that transgender and intersex people work in ‘low skilled’ service jobs.
Jenny Goodman a home support worker, PSA delegate and PSA Executive Board member
8
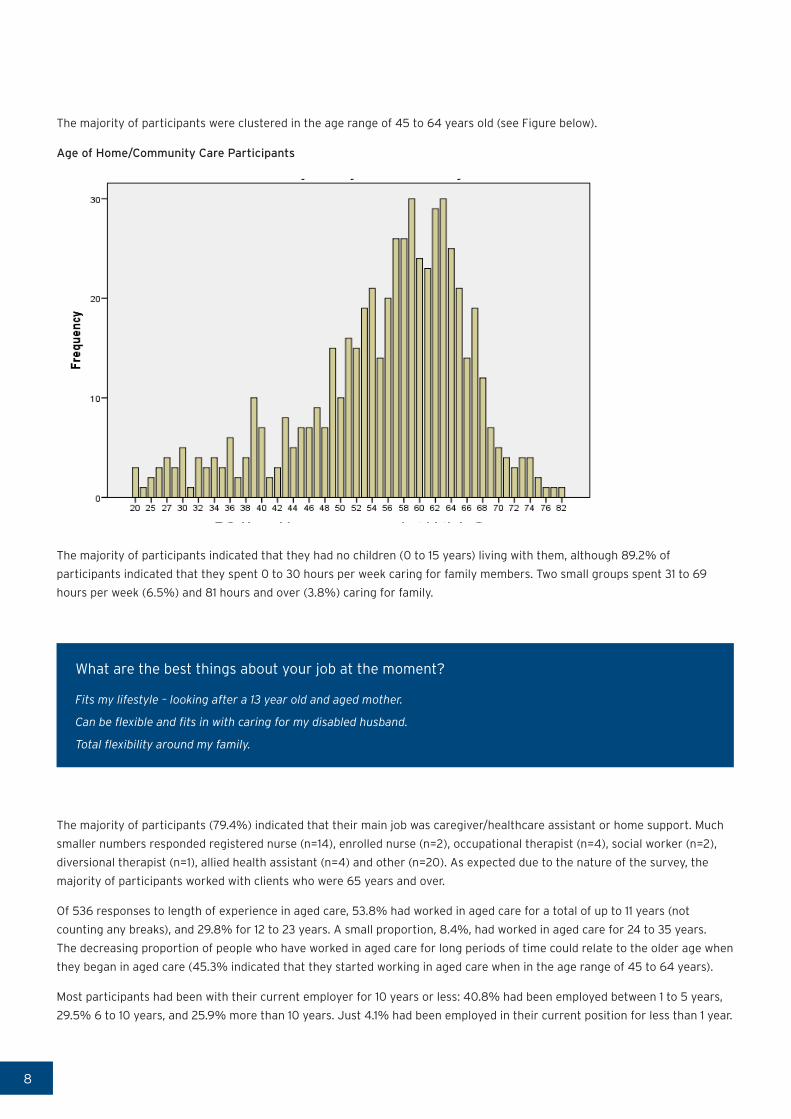
The majority of participants were clustered in the age range of 45 to 64 years old (see Figure below).
Age of Home/Community Care Participants
The majority of participants indicated that they had no children (0 to 15 years) living with them, although 89.2% of
participants indicated that they spent 0 to 30 hours per week caring for family members. Two small groups spent 31 to 69
hours per week (6.5%) and 81 hours and over (3.8%) caring for family.
What are the best things about your job at the moment?
Fits my lifestyle – looking after a 13 year old and aged mother.
Can be flexible and fits in with caring for my disabled husband.
Total flexibility around my family.
The majority of participants (79.4%) indicated that their main job was caregiver/healthcare assistant or home support. Much
smaller numbers responded registered nurse (n=14), enrolled nurse (n=2), occupational therapist (n=4), social worker (n=2),
diversional therapist (n=1), allied health assistant (n=4) and other (n=20). As expected due to the nature of the survey, the
majority of participants worked with clients who were 65 years and over.
Of 536 responses to length of experience in aged care, 53.8% had worked in aged care for a total of up to 11 years (not
counting any breaks), and 29.8% for 12 to 23 years. A small proportion, 8.4%, had worked in aged care for 24 to 35 years.
The decreasing proportion of people who have worked in aged care for long periods of time could relate to the older age when
they began in aged care (45.3% indicated that they started working in aged care when in the age range of 45 to 64 years).
Most participants had been with their current employer for 10 years or less: 40.8% had been employed between 1 to 5 years,
29.5% 6 to 10 years, and 25.9% more than 10 years. Just 4.1% had been employed in their current position for less than 1 year.
9
Home/community care participants' Length of time with current employer
In response to a question asking if they worked in other paid jobs, 74.6% responded that they did not have more than one
paid job. Of those who did have more than one paid job, the majority work either in residential aged care or in another home/
community care job.
4.2 What work are the participants doing?
This section looks at the tasks the participants carry out, as well as how their work is organised into shifts, and regular hours
of work.
Table 1 outlines the main tasks undertaken by those participants who identified themselves as caregiver/healthcare assistant
or home support worker.
Table 1: Main tasks undertaken by Home/community participants
Role Percent
Personal care 74.1%
Home care/ domestic assistance 21.4%
Respite care 0.8%
Home maintenance/ modification 0.8%
Meal preparation/ delivery 0.4%
Other 2.6%
Total 100%

10
Home/community care is clearly more focussed on care work rather than domestic assistance such as housework and
shopping.
Participants were asked if their role ‘involves managing or supervising direct care staff’, and out of the 557 participants to
this question, 417 (72.6%) responded that they were not. An interesting group, 13.8%, responded that they were involved in
managing or supervising direct care staff, but were not senior caregivers or a care manager/co-ordinator. No further detail
was gained on their role. The other options ‘yes, I am a senior caregiver’, and ‘Yes, I am a care manager/co-ordinator’ were
intended to capture participants who had a formal role in supervising/managing direct staff. It is possible that our group of
13.8% have an informal role in supervising, mentoring or training other direct care staff.
The majority of the participants, 67.1%, work a regular day time shift, with just 4% reporting working rotating shifts. Split
shift work arrangements were reported by 13.7% of participants and 10.1% having irregular shift arrangements. A very small
number of participants, 0.2%, worked on an on call basis. Perhaps not surprisingly, given the high percentage on regular day
time shifts, the majority of participants (87.6%) indicated they would prefer to keep their current working arrangements. Most
participants, as could be expected, worked shifts of 0 to 10 hours (90.9%).
Shortest shift last week - Home/community Care Participants
Figure 5. Shortest shift last week - Home/community Care Participants
However, it cannot be assumed that participants engage in regular full time work: approximately two thirds, 64.6%, of
participants worked on average up to 30 paid hours per week. This shows that part-time work is the norm among the majority
of the participants. Interestingly, a significant number of participants (n=549) indicated that they carry out unpaid work in
their role every week. This unpaid work represents hours worked when finishing late or starting early and not being paid for it.

11
Average hours worked per week - Home/community Care Participants
By far the majority, 82.6%, of participants were employed in permanent full or part time work. However, it must be noted
that a permanent contract does not necessarily entail guaranteed or regular hours. A reasonable proportion, 14.9%, were
employed on a casual basis. The number of participants on fixed term or in agency work was very low, 2.5% in total. Most who
identified as caregiver/healthcare assistant or home support worked 10 hours or less in the average week (43.1%), but with
significant proportions working 21 to 30 hours per week (26.4%) and 31 to 40 hours (17.4%).
4.3 Work conditions and the work environment
This section analyses responses to questions on wages and the work environment, including work load, autonomy and general
workplace relations.
The majority of participants are on low hourly rates: 73.3% were paid less than $15 per hour. In 2014 the national minimum
wage was set at $14.25. A further 20% of participants received $16 to $19 per hour. This is important in relation to the
response of participants that indicates that 56.9% are the main earners in their families, in other words their wages are not a
‘supplementary’ income to the family but the main income.
Generally, participants’ responses indicated a positive attitude towards their work environment and 70.2% indicated that they
were able to spend enough time with each client. However, there were still nearly a quarter of participants, 24.47%, who either
disagreed or strongly disagreed that they had enough time with clients. Over three quarters, 77.7%, of participants indicated
that they spent more than two thirds of their time at work undertaking care/clinical work.
Just over two thirds, 68.3%, indicated they had a lot of freedom in how they undertook their work and just 55.8% agreed
that they were acknowledged and respected by their employer. Participants largely indicated, 56.5%, that there were good
relations in the workplace between management and employees overall. It is worth noting here, that although the majority
report good perceptions of the work environment overall, that still leaves a significant percentage who do not experience a
good work environment. The importance of relationships with colleagues and management was borne out in the qualitative
answers to survey questions.
12
What are the best things at the moment about your job?
Appreciative bosses and clients.
A good relationship with all staff.
Having a good team to support you.
What are the worst things at the moment about your job?
Friction between carers and management. Very poor pay. Lack of respect. Being told what to do rather than consulted.
Being treated like children.
Poor communication between carer - nurses - coordinator and management. Too many chiefs
Communication with employer.
Questions relating to work-life balance are important as they can be indicators of the general work environment including
stress levels, workload and management support. Amongst our participants, although there was some interference in their
private life from work demands this did not to be a significant issue. A general question on how satisfied they were with the
balance between work and the rest of their lives showed that just over one third (38.7%) were very satisfied and 17.8% were
not very satisfied.
Table2: Level of satisfaction with balance between work and the rest of your life - Home/community participants
Level of Satisfaction
Mean SD Not at all satisfied
Not very satisfied
Neither satisfied nor dissatisfied
Very satisfied
Don’t know
Percent 3.20% 0.87% 3.0% 17.8% 37.6% 38.7% 2.8%
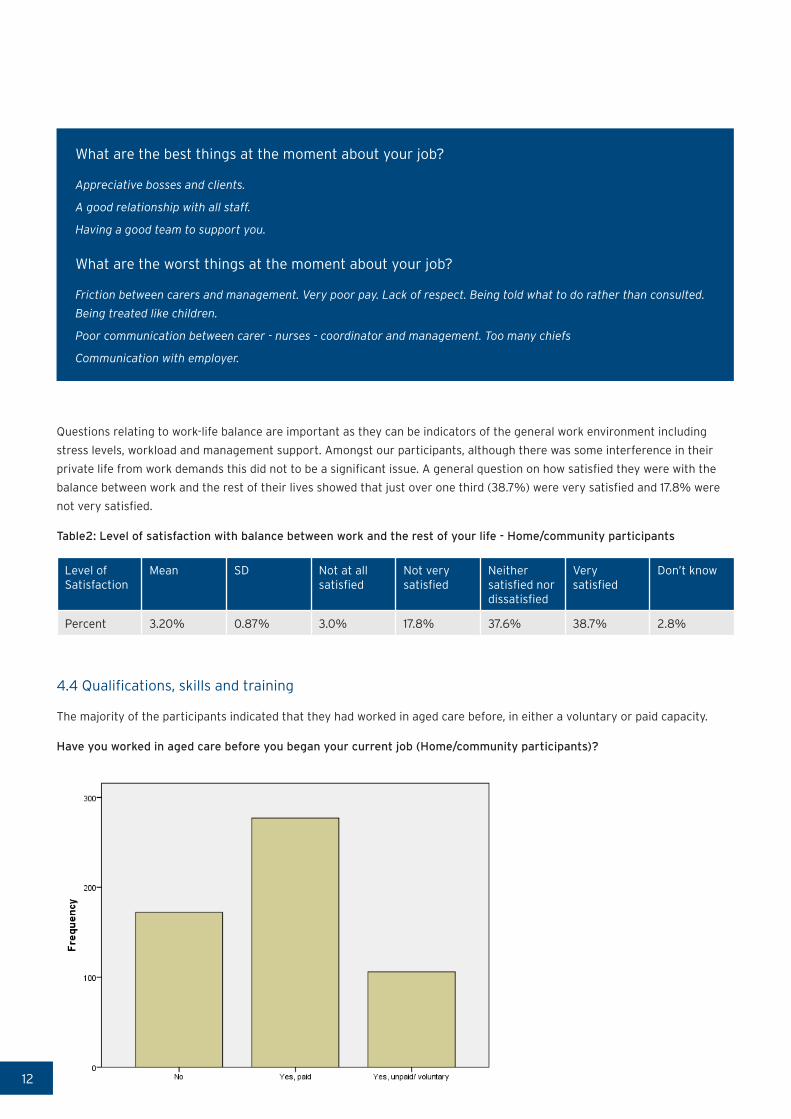
4.4 Qualifications, skills and training
The majority of the participants indicated that they had worked in aged care before, in either a voluntary or paid capacity.
Have you worked in aged care before you began your current job (Home/community participants)?

13
Participants indicated a very strong level of confidence in their skills and abilities. The majority of participants (60.4%)
strongly agreed that they ‘have the skills and abilities I need to do my job’. This was followed by 36.9% who agreed that they
have the skills and abilities they need to do their job. These numbers drop slightly when responding on whether they ‘use
many of my skills and abilities in my current job’: 52.2% strongly agreed with the statement and 38.8% agreed and somewhat
agreed. This is interesting for those considering the regulation and qualifications framework for the aged care sector, and
could reflect differing perceptions over whether the job requires specific, trained skills, or is a job that is unskilled or based on
inherent capabilities or personality.
What are the worst things about your job?
Receiving qualifications that don’t come with any payrise. In other words no recognition.
Analysis of questions on qualifications found that 78% of participants have completed a qualification since leaving school. The
qualifications identified were:
• Bachelor degree in nursing
• Bachelor degree in allied health profession
• Diploma in Enrolled nursing
• Other nursing qualification
• Postgraduate nursing qualification
• Postgraduate allied health qualification
Of those who responded to questions on the completion of National certification in health, disability and aged support (n=391),
the following had completed:
• Foundation skills (level 2) 69.8%
• Core competencies (level 3) 50.9%
• Residential (level 3) 15.9%
• Residential dementia (level 4) 8.2%
• Senior support (level 4) 6.4%
The high proportion who had completed basic national qualifications could contribute to participants’ perceptions that they
have the skills and abilities required for the job.
A small number (n=59) answered on management qualifications. Of those, 27.1% had a Diploma in Management; 22% had a
Bachelor degree in Management, and 8.5% a Postgraduate qualification in Management. These are similar percentages to the
number who identify that they manage or supervise direct care staff.
Similarly to participants’ perceptions of their skills and abilities, 63.4% were satisfied with the match between their
qualifications and work. Table 3 shows the percentage of participants according to the level of national qualification they have,
who agree that they have the ‘skills and abilities I need to do my job’.

14
Table 3: Level of Qualification and agreement that ‘I have the skills and abilities’ for the job (Home/community
participants)
Qualification Agree Somewhat Agree Strongly Agree
Foundation skills (level 2) 23.62% 13.28% 59.78%
Core Competencies (level 3) 16.16% 13.13% 67.68%
Residential (level 3) 19.35% 11.29% 66.13%
Dementia (level 3) 18.75% 9.375% 71.85%
Although there are reasonable numbers of participants with healthcare and aged care qualifications, and the majority of
participants responded that they do have the required skills and abilities for their jobs, there is less evidence that employers
are providing and supporting the training.
Only 14.4% were currently working towards a qualification and 84.2% of respondents had not ‘undertaken any training
provided by their employer in the last six months’. Of the few that had undertaken employer provided training, most of it was
compulsory training to get them started in their jobs (84.2%) or to improve their skills in their current job. Other reasons
given included (participants could choose multiple responses) ‘to maintain professional status/occupational standards’
(50.7%), ‘in order to meet accreditation standards’ (50.5%), and 30.4% for health and safety.
Generally, compulsory training was paid for by employers (81.3%), although 11.8% of participants paid for some of their
training which raises questions over a small, but significant, number of participants who are subsidising training that they
report is compulsory.
Most participants were satisfied with the match between their work and their qualifications (63.4%) but a significant 36.4%
were not satisfied with the match. There was not an overwhelming response to indicate that the training provided by
employers was very useful (See Table 4 below ‘to what extent do you think you can use the new skills you have acquired from
any of this training in your current job?’).
Table 4 To what extent do you think you can use the new skills acquired in your current job (Home/community
participants)?
Skills acquired Percent
Did not learn any new skills 7.7%
Not at all 6.5%
Only to a limited extent 19.3%
To a moderate extent 28.9%
To a great extent 23.1%
To a very great extent 14.5%
Of the 421 who responded to what area of training they would most need or like to undertake in the next 12 months, the
following areas were most significant:
• Dementia training 55.6%
• Palliative care 47%
• Mental health 30.3%
• Wound management 26%
• Management and leadership training 14%
15
A DAY AS A CARER
Each day as I arrive at your home, with a smile, a greeting and a happy tone.
A listening ear I have at hand, to hear your woes and stories sure can.
We chat and laugh at jokes unsaid, over a cuppa and a piece of bread.
I’m here to do your P.C. I read, is it P.C. computer, P.C. correctness,
I know, personal cares and clothes of need.
I hear your stories of days of old, of hardships, struggles and wisdom gained I’m told.
Out comes the cleaner and motor going, with mop duster, and a shine that’s glowing.
As I leave with a smile and a wave, I close the door and feel you’re brave.
Until the next time I come to care, I look forward to the stories we share.
For I have to reminisce, as to why I am doing this.
Is it the job that I love I ask, or the people that I care for, and the task.
May be one day I will find, someone else being just as kind.
I could be in those shoes of yours, someone looking after me, doing my cares and chores.
- Written by a home/community caregiver
16
4.5 Occupational health and safety
Many factors impact workers’ ability to undertake their tasks in a safe manner. As well as questions about workplace accidents
and injuries this survey asked how participants felt about the pressure and stress they experience to complete their work. Just
under half of the participants (42.9%) indicated they did not feel pressure to work harder in their job, and 35.3% indicated
that they did feel this pressure. Regarding stress in their jobs, 41.85% did not feel overly stressed while 36.7% indicated that
the job was more stressful than they had imagined it would be.
Focussing on work related injuries and illness there were 616 incidences of illness or injury in the 12 months prior to the survey
reported in the 574 total number of returned surveys. Although the severity of type of injury was not determined, the number
of incidents of each category is as follows: 104 incidents of strain/sprain; 103 incidents of bruising; 93 reports of back injuries;
80 of chronic joint or muscle issues; 77 responses of stress, then fewer numbers of cases of cuts, burns, fractures and other
minor injuries. Only 28.1% of these injuries resulted in time being taken off from the workplace.
Where time was taken off as a result of work related injuries and illness, 144 participants supplied information about the
length of time they were away from work. The most common amount of time required away from work was between 2 and 5
days (38.5%) then significantly 21.5% of incidents required between 6 and 15 days off work and 19.4% required more than 15
days off work.
What are the best things about your job at the moment?
As I am semi-retired, 12 hours work over 3 days has taken away the stress and injury I suffered last year.
Participants who responded that they had suffered a workplace injury, were then asked to indicate the cause of the injury, with
multiple responses allowed. The most common causes identified were:
• Lifting, pushing, pulling and bending movements (30.5%)
• Fatigue (13.4%)
• Repetitive movement with low muscle loading (9%)
• Exposure to mental stress (9%)
Non-specified causes accounted for 17.9% of injuries. Other causes were hitting or being cut by the person in their care, falls,
prolonged standing and vehicle accidents. A very small number cited exposure to chemicals and loud noises.
17
What are the worst things about your job at the moment?
Having clients swear at me all the time.
The drudgery and the boredom and how some clients expect you to be a commercial cleaner rather than a support
worker, and inappropriate personal comments.
Clients can be abusive and ungrateful for care. Coping with the abuse at work seven days a week. Feels like I could easily
burn out and not receive any concern from the employer at all.
In addition to physical injury and illness, the survey also questioned whether participants experienced physical or verbal abuse
from clients. Physical abuse does not appear to be a significant issue for caregivers with 70.3% having never experienced this
and 20.5% indicating this had happened rarely. However, figures on verbal abuse indicate this is a more common problem for
some caregivers. Of the participants who answered this question 19.5% were verbally abused sometimes, 32.3% rarely and
41.1% never. Although these figures appear low there still was 0.7% of participants who experienced verbal abuse all the time,
2.1% very often, and 4.2% often.
4.6 Satisfaction and quitting intentions
Of the completed surveys received 451 caregivers answered the question regarding their satisfaction with their pay. Of these
27.7(%) were totally dissatisfied with their total pay; 2.4% were totally satisfied with their pay indicating that most are not
satisfied with their pay.
What are the best things at the moment about your job?
Feeling of importance to clients who really need care. Making a client with no family and limited friends a brighter day
by being there.
I love the job as a whole and wish I had found it years ago. Wages are very poor.
What are the worst things at the moment about your job?
Very low hourly rate. This is the reason for having two jobs to survive.
I don't feel valued because of the low pay.
18
Overall, however 75.7% of participants were satisfied with their job. When asked about how satisfied they are with various
components of their job, there are some areas that might indicate issues that need to be addressed by management
(see Table 5).
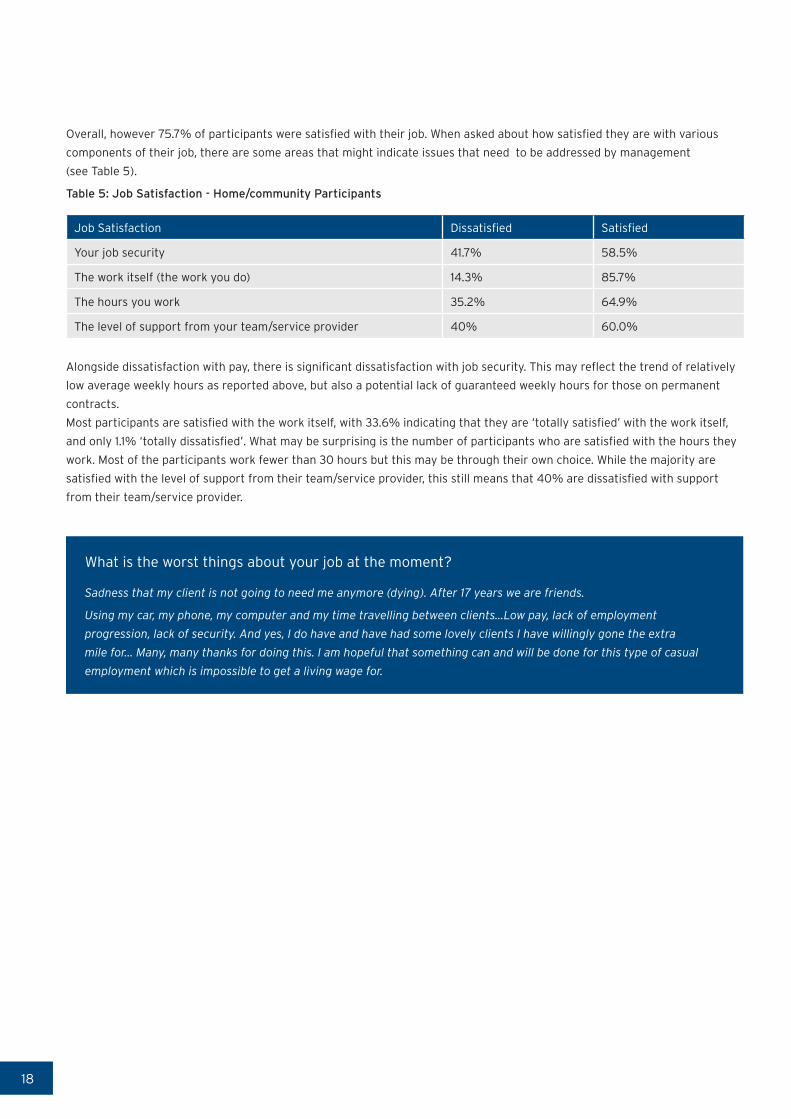
Table 5: Job Satisfaction - Home/community Participants
Job Satisfaction Dissatisfied Satisfied
Your job security 41.7% 58.5%
The work itself (the work you do) 14.3% 85.7%
The hours you work 35.2% 64.9%
The level of support from your team/service provider 40% 60.0%
Alongside dissatisfaction with pay, there is significant dissatisfaction with job security. This may reflect the trend of relatively
low average weekly hours as reported above, but also a potential lack of guaranteed weekly hours for those on permanent
contracts.
Most participants are satisfied with the work itself, with 33.6% indicating that they are ‘totally satisfied’ with the work itself,
and only 1.1% ‘totally dissatisfied’. What may be surprising is the number of participants who are satisfied with the hours they
work. Most of the participants work fewer than 30 hours but this may be through their own choice. While the majority are
satisfied with the level of support from their team/service provider, this still means that 40% are dissatisfied with support
from their team/service provider.
What is the worst things about your job at the moment?
Sadness that my client is not going to need me anymore (dying). After 17 years we are friends.
Using my car, my phone, my computer and my time travelling between clients...Low pay, lack of employment
progression, lack of security. And yes, I do have and have had some lovely clients I have willingly gone the extra
mile for... Many, many thanks for doing this. I am hopeful that something can and will be done for this type of casual
employment which is impossible to get a living wage for.
19
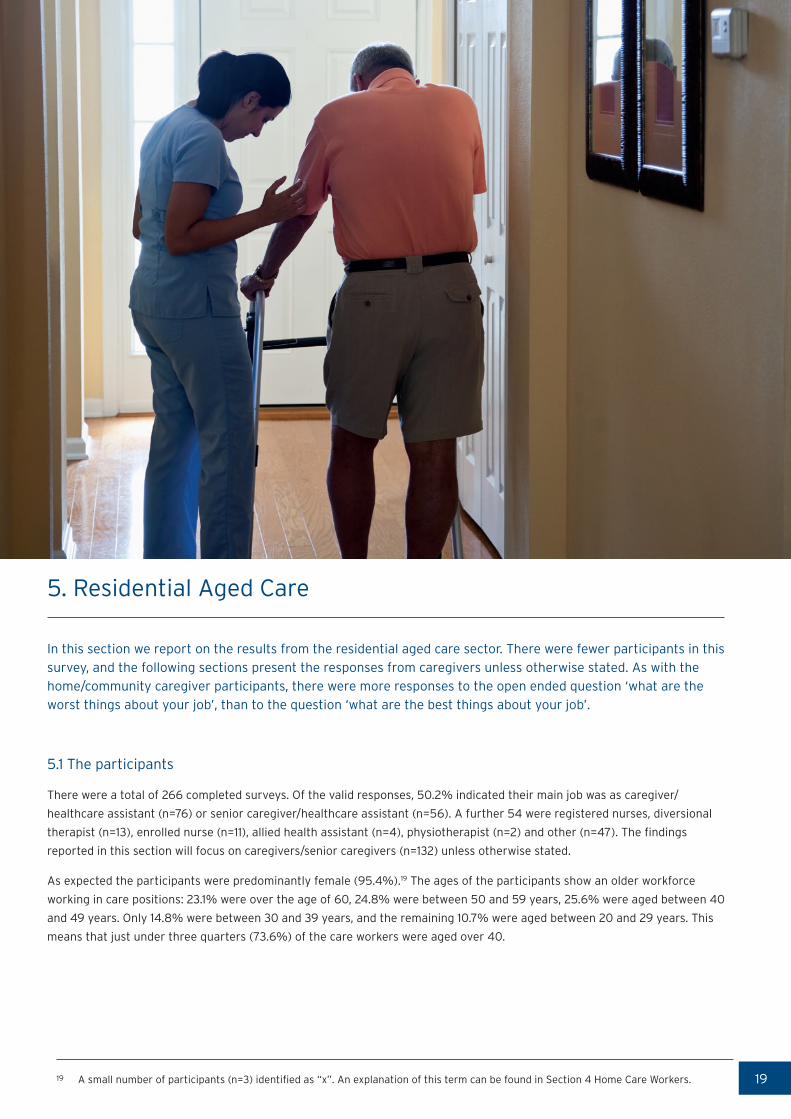
5. Residential Aged Care
In this section we report on the results from the residential aged care sector. There were fewer participants in this survey, and the following sections present the responses from caregivers unless otherwise stated. As with the home/community caregiver participants, there were more responses to the open ended question ‘what are the worst things about your job’, than to the question ‘what are the best things about your job’.
5.1 The participants
There were a total of 266 completed surveys. Of the valid responses, 50.2% indicated their main job was as caregiver/
healthcare assistant (n=76) or senior caregiver/healthcare assistant (n=56). A further 54 were registered nurses, diversional
therapist (n=13), enrolled nurse (n=11), allied health assistant (n=4), physiotherapist (n=2) and other (n=47). The findings
reported in this section will focus on caregivers/senior caregivers (n=132) unless otherwise stated.
As expected the participants were predominantly female (95.4%).19 The ages of the participants show an older workforce
working in care positions: 23.1% were over the age of 60, 24.8% were between 50 and 59 years, 25.6% were aged between 40
and 49 years. Only 14.8% were between 30 and 39 years, and the remaining 10.7% were aged between 20 and 29 years. This
means that just under three quarters (73.6%) of the care workers were aged over 40.
19 A small number of participants (n=3) identified as “x”. An explanation of this term can be found in Section 4 Home Care Workers.

20
Age of Residential caregivers
The majority of participants (56%) were born in New Zealand. Of the participants not born in New Zealand 42.7% were from
Asian countries, 33.3% were from European countries including the United Kingdom, and 25% were from Pacific countries.
Looking at ethnicity a similar proportion of participants indicated that they identified as Maori (17.5%) as was indicated in the
Census 2011 data. Of all the caregiver participants 11.7% were of Pacific descent.
More than half of the participants (65.2%) indicated that they are the main earner in their household. Just over one quarter
(27.3%) of the participants also had children (0 to 15 years old) to care for. Most participants (85.3%) were not employed in a
job other than their current residential aged care job. Only 15.7% had other employment: in aged care and ‘other’.
Over half, 56.3% (n=71) of the respondents came into care work when they were aged between 25 and 44 years. At ages 15 to
24 and 45 to 64, 22.2% and 20.6% respectively. Just over half 51.2% of participants had worked in aged care work for more
than ten years. The largest proportion of participants indicated that they had been with their current employer for 1 to 5 years
(38%); 20.9% had been employed for less than a year; 15.5% between 6 to 10 years and 25.6% for more than 10 years.
21
Length of time of residential caregivers with their current employer
5.2 What work are the participants doing?
This section looks at the tasks the caregiver participants carry out, as well as how their work is organised into shifts, and
regular hours of work.
Participants were asked if their work involved managing or supervising direct care staff and 64 of the 124 caregivers/senior
caregivers (51.6 %) indicated that they did have managing roles. The managing roles were: 11 were care managers, 27 were
care leaders, and 26 had indicated a managing or supervising role but did not have the job title of either manager or leader.
The majority of caregiver responses (55.7%) indicated that they worked a regular daytime shift; 13.1% worked a regular night
shift; 9.8% were on rotating shifts; 8.2% had irregular shift patterns; very few responded that they worked split shifts or
were on an on call basis. The remaining 8.2% of participants worked under a different shift arrangement. Significantly, 77.2%
indicated that they were happy with their current shift arrangements and would not want to change them. Of those who
responded that they would like to change their shifts nearly two thirds (62%) indicated they would prefer regular daytime
shifts.
Responses to questions on employment status showed that 84.4% were employed on a permanent full-time or part-time
basis. Another 12.5% were employed on a casual basis and just 4 participants were employed on fixed term contracts.
Responses to hours worked per week were that 69.9% worked in excess of 31 hours per week; 9.7% worked between 26 and
30 hours and 9.7% between 21 and 25 hours; 5.3% between 16 and 20 hours and 4.4% 11 to 15 hours. Of all caregivers/senior
caregivers 32% responded that they worked unpaid hours in their job as well. Of those who worked unpaid hours, 90.5%
indicated this unpaid work was between one and ten hours per week.
22
Average Paid Hours worked per week by Residential caregivers
The work the participants undertook in their shifts was generally focussed on residents. The majority, 60.5%, responded that
they spent more than two thirds of their time caring for residents, while 31.5% indicated they only spent between one and two
thirds of their time directly on resident care and 8.1% spent less than a third of their time with residents. Nearly even numbers
(52.4%) agreed that they generally had enough time to spend with each resident, 41.3% disagreeing that they had enough
time with each resident, and 6.4% neutral on the question.
5.3 Work conditions and the work environment
This section analyses responses to questions on wages and the work environment, including work load, autonomy and general
workplace relations.
Caregivers/senior caregivers who completed the survey earned less than $19.00 per hour, with 37.7% receiving an hourly rate
of less than $15.00 and the remaining 63 participants (59.4%) receiving between $15.00 and $19.00 per hour.
What are the worst things about your job?
Lack of staff! I work in a high dependency hospital wing and fear needs are not always being met. This also leads to high
mental and physical stress.
Physically tough, constant stress of surrounding environment, my pay rate does not reflect the responsibility I carry,
having to constantly train and orientate new staff due to high attrition rate.
Poorly Paid, Staffing levels, not spending enough time with each resident as too busy.
Not enough time, not enough staff.
23
Generally the participants felt they had a lot of freedom in determining how they worked. Of the 128 completed responses
57.1% agreed, somewhat agreed or strongly agreed with the statement. Less than a third (29.7%) disagreed and felt they
did not have a lot of freedom and 28.2% were neutral on the issue. Significantly 60% of these participants also felt they
received the respect and acknowledgement they deserved for their work and 60.2% expressed agreement that there was a
good relationship between management and employees. As with the home/community aged care sector, the importance of
relationships with colleagues and management was borne out in the qualitative answers to survey questions.
What are the best things about your job?
Management very approachable, lovely residents. Good Staff to work with.
Support from my boss while I'm studying and also the responsibilities my boss trusts me with.
Work life balance did not seem to be a significant issue for the participants with 37.1% neither satisfied nor dissatisfied with
work-life balance, 33.3% very satisfied, 22.7% not very satisfied and 4.5% were not at all satisfied.
5.4 Qualifications, skills and training
Most participants agreed that they had the skills and abilities to do their job (94.5% in total), with 60.9% strongly agreeing
with the statement. This was supported with 82.8% agreeing that adequate training was available in their workplace.
Most of the participants had undergone some form of training programme since leaving school, as indicated by 83.7%. The
majority (n=57) had completed some non-disclosed type of health related qualification, for 16 participants this was a non-
degree level nursing qualification and 8 had completed Bachelor degree courses in nursing. Most of the caregivers holding
nursing qualifications are migrants to New Zealand.
A large proportion of participants (82.6%) had completed some of the National certification in health, disability and aged
support as follows:
• Foundation skills (level 2) 45.9%
• Core competencies (level 3) 53.2%
• Residential (level 3) 31.2%
• Residential dementia (level 4) 39.5%
• Senior support (level 4) 11%
Nearly a quarter of the caregiver/senior caregiver participants, 22.1%, had also completed specialised qualifications in
palliative care. Overall when asked how satisfied they were with the match between their work and qualifications 62.3%
indicated they were satisfied, although only 16% felt totally satisfied; 37.7% were not satisfied with the match between their
skills and qualifications. Compulsory training offered by the employer over the last 12 months was taken by 40% of the
participants, and non-compulsory courses were taken by 23.5% of participants. The compulsory training was reported to be
mostly in order to improve skill levels and to meet the accreditation requirements of the facility. The employer paid for the
cost of this training in 79.4% of the cases, and over 80% of those who took the training felt that they used the newly acquired
skills in their job to varying degrees. Around a quarter, 24.6%, felt they used the new skills to a moderate extent; a further
quarter, 26.3%, to a very great extent; and around a third, 31.6% felt they used the skills to a great extent.

24
With regard to ongoing training and study 20.5% indicated they were currently studying for qualifications. The following areas
were identified by caregiver/senior caregiver participants when asked what training they felt they needed or wanted in the
next 12 months, participants indicated the following:
• 45.5% dementia training
• 33.3% wound management
• 32.6% palliative care
• 25.8% mental health
• 16.7% management and leadership training
A further 7.6% indicated unspecified allied health training.
5.5 Occupational health and safety
Caregiver/senior caregiver participants were asked a range of questions relating to health and safety and also about the
pressure and stresses that may be present in their work environment. While 16.6% were neutral on whether they were under
pressure to work harder, 28.2% said they were not under pressure. Significantly over half of the participants (55.6%) indicated
they did feel this pressure, among those 13.7% strongly agreed with the statement. Over half (53%) also felt that their job was
more stressful than they had imagined it would be.
In the 12 months prior to the survey there were 167 incidences of workplace injury or illness reported in the 132 completed
survey responses from caregivers and senior caregivers. The frequency of injuries and illnesses is as follows: 41 incidents
of bruising; 24 incidents of back injuries; 23 reports of sprains and strains; 18 reports of stress; 15 of chronic joint or muscle
conditions; 11 of cuts and open wounds, then fewer reports of burns and fractures. Only 25.7% of the most recent work related
injury or illness resulted in time being taken off work and the majority, 55.6%, took between 2 and 5 days away from work,
under a quarter, 22.2%, took just one day and only 7.4% needed to be away from the workplace for more than 15 days.
What are the worst things about your job?
Low pay, stress and physical strain on body.
Being yelled at, hit and being called names by residents.
Where participants did suffer a work related injury or illness they were asked to indicate what the cause was for the most
recent one, and multiple answers were allowed. The most common causes identified were:
• Lifting, pushing, pulling and bending movements, 43.5%
• Hitting, being hit or cut by person, object or vehicle, 23.9%
• Fatigue, 14.1%
• Repetitive movement with low muscle loading, 12%
• Exposure to mental stress, 7.6%
• Prolonged standing, working in cramped or unchanging positions, 7.6%
Non-specified causes accounted for 20.7% of injuries. A very small number cited falls, and long term exposure to sound.
25
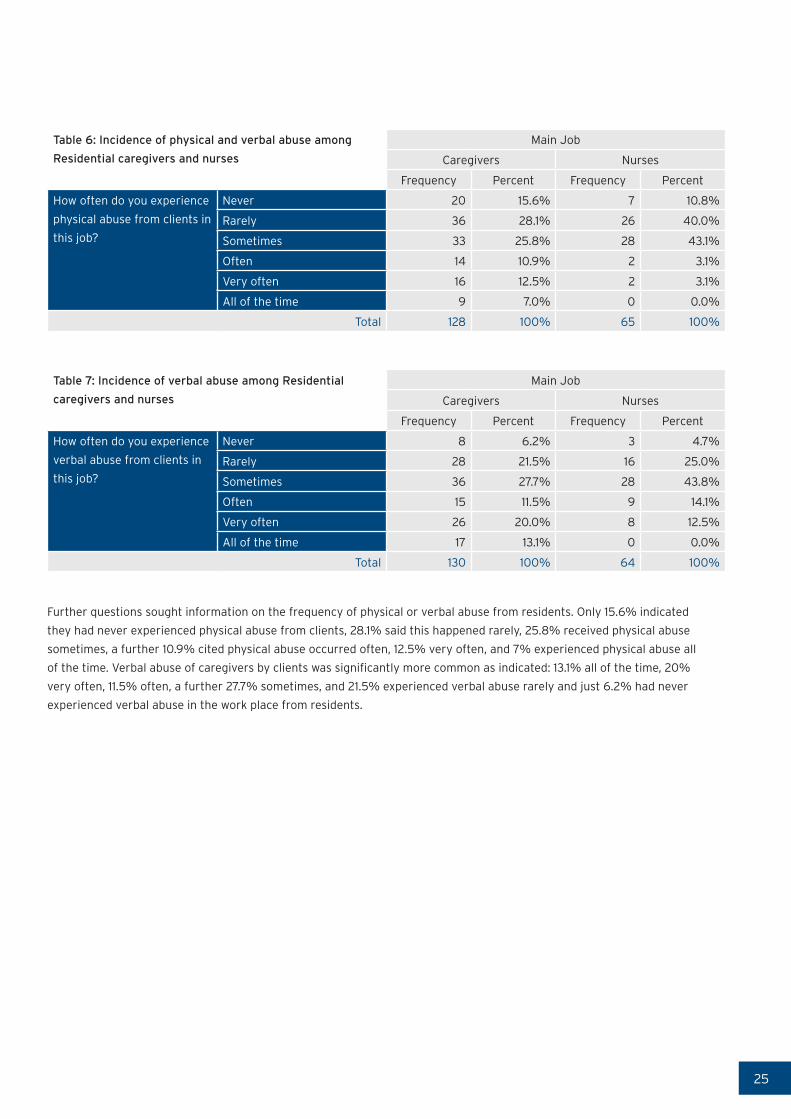
Table 6: Incidence of physical and verbal abuse among
Residential caregivers and nurses
Main Job
Caregivers Nurses
Frequency Percent Frequency Percent
How often do you experience
physical abuse from clients in
this job?
Never 20 15.6% 7 10.8%
Rarely 36 28.1% 26 40.0%
Sometimes 33 25.8% 28 43.1%
Often 14 10.9% 2 3.1%
Very often 16 12.5% 2 3.1%
All of the time 9 7.0% 0 0.0%
Total 128 100% 65 100%
Table 7: Incidence of verbal abuse among Residential
caregivers and nurses
Main Job
Caregivers Nurses
Frequency Percent Frequency Percent
How often do you experience
verbal abuse from clients in
this job?
Never 8 6.2% 3 4.7%
Rarely 28 21.5% 16 25.0%
Sometimes 36 27.7% 28 43.8%
Often 15 11.5% 9 14.1%
Very often 26 20.0% 8 12.5%
All of the time 17 13.1% 0 0.0%
Total 130 100% 64 100%
Further questions sought information on the frequency of physical or verbal abuse from residents. Only 15.6% indicated
they had never experienced physical abuse from clients, 28.1% said this happened rarely, 25.8% received physical abuse
sometimes, a further 10.9% cited physical abuse occurred often, 12.5% very often, and 7% experienced physical abuse all
of the time. Verbal abuse of caregivers by clients was significantly more common as indicated: 13.1% all of the time, 20%
very often, 11.5% often, a further 27.7% sometimes, and 21.5% experienced verbal abuse rarely and just 6.2% had never
experienced verbal abuse in the work place from residents.
26
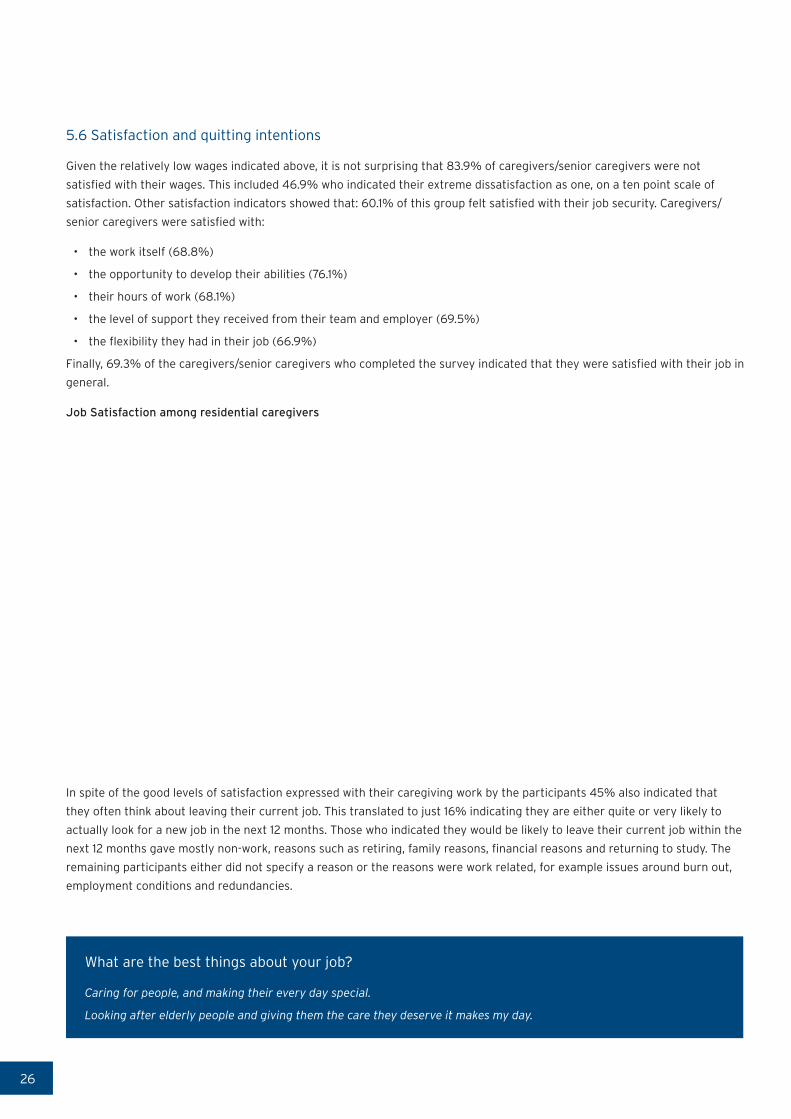
5.6 Satisfaction and quitting intentions
Given the relatively low wages indicated above, it is not surprising that 83.9% of caregivers/senior caregivers were not
satisfied with their wages. This included 46.9% who indicated their extreme dissatisfaction as one, on a ten point scale of
satisfaction. Other satisfaction indicators showed that: 60.1% of this group felt satisfied with their job security. Caregivers/
senior caregivers were satisfied with:
• the work itself (68.8%)
• the opportunity to develop their abilities (76.1%)
• their hours of work (68.1%)
• the level of support they received from their team and employer (69.5%)
• the flexibility they had in their job (66.9%)
Finally, 69.3% of the caregivers/senior caregivers who completed the survey indicated that they were satisfied with their job in
general.
Job Satisfaction among residential caregivers
In spite of the good levels of satisfaction expressed with their caregiving work by the participants 45% also indicated that
they often think about leaving their current job. This translated to just 16% indicating they are either quite or very likely to
actually look for a new job in the next 12 months. Those who indicated they would be likely to leave their current job within the
next 12 months gave mostly non-work, reasons such as retiring, family reasons, financial reasons and returning to study. The
remaining participants either did not specify a reason or the reasons were work related, for example issues around burn out,
employment conditions and redundancies.
What are the best things about your job?
Caring for people, and making their every day special.
Looking after elderly people and giving them the care they deserve it makes my day.
27
6. Conclusions
The survey findings confirm that aged care workers in New Zealand are predominantly women, and the majority are aged 45 years and above. The survey also highlights several issues for the long term sustainability of the aged care workforce. These relate to work conditions and the work environment; qualifications, skills and training; occupational health and safety and job satisfaction.
Overall, participants love the work that they do and the positive workplace relationships, but low wages, high workload
and lack of recognition impact negatively on their satisfaction with the job. Our participants feel that they have the skills,
capabilities and knowledge to do their job, and a significant number have completed aged care related national qualifications.
It is important to ensure that this is not overlooked, and is incorporated into discussions with caregivers, as both recognition
of their skills, and as part of career development opportunities, which are important for job satisfaction and retention. There
are some differences between home/community health and residential aged care with higher proportions attaining national
qualifications among residential caregiver participants than home/community health.
Over both the residential and home/community aged care workforce, there is significant dissatisfaction with low wages. This
has implications for the provision of care if enduring low wages become something that encourages people to leave aged care
work or prevents them entering the sector in the first instance. This finding is particularly relevant in light of the high number
of participants who identified as being the main earner in their household. As international research has indicated, although
many caregivers love their work, low wages and characteristics such as being the primary wage earner are more important
in their decision to stay in or quit their job. There are reasonable numbers of caregivers who have worked with their current
employer for 5 years or more, and it would seem sensible to have work conditions that encourage the retention of these
employees.
High workload is a concern for both residential and home/community caregivers, however it seems to be more significant
for residential caregivers. This has importance for job satisfaction, retention, health and safety as well as the quality of care.
One other important consideration for workload is health and safety, as high workload (and physically hard work) is linked
to greater incidences of workplace accident and injury, as well as stress. This has high impact on the caregivers themselves,
and also the delivery of quality of care. The findings show that while numbers citing stress and fatigue as health and safety
concerns are relatively small they are still worth noting and addressing. Physical and verbal abuse from clients is an ongoing
issue, particularly in residential aged care, but is one that was noted more in open ended comments from participants than in
other questions.
We will implement another survey in 2016, two years after this current survey. This will enable policy makers, providers and
unions to benchmark and note key trends in the workforce. The issues we highlight, such as job satisfaction, health and safety,
and the interaction between participants’ existing qualifications and their perceptions of being valued and supported are some
issues that will be tracked longitudinally.

New Zealand Work Research InstituteAUT University, Auckland, New Zealand
[email protected] | www.workresearch.aut.ac.nz