a framework to design and optimize chemical...
TRANSCRIPT

A FRAMEWORK TO DESIGN AND OPTIMIZE CHEMICAL FLOODING PROCESSES
Second Annual Report for the Period Sept. 1, 2004 � August 31, 2005
by Mojdeh Delshad, Gary A. Pope, Kamy Sepehrnoori
July 2005
Work Performed under Contract No. DE�FC-26-03NT15412
Rhonda L. Jacobs, Contracting officer
U.S. Dept of Energy National Petroleum Technology Office
One West Third Street, Suite 1400 Tulsa, OK 74103-3159
Prepared by Center for Petroleum and Geosystems Engineering
The University of Texas at Austin Austin, TX 78712

ii
DISCLAIMER
This report was prepared as an account of work sponsored by an agency of the United States Government. Neither the United States Government nor any agency thereof, nor any of their employees, makes any warranty, express or implied, or assumes any legal liability or responsibility for the accuracy, completeness, or usefulness of any information, apparatus, product, or process disclosed, or represents that its use would not infringe privately owned rights. Reference herein to any specific commercial product, process, or service by trade name, trademark, manufacturer, or otherwise does not necessarily constitute or imply its endorsement, recommendation, or favoring by the United States Government or any agency thereof. The views and opinions of authors expressed herein do not necessarily state or reflect those of the United States Government or any agency thereof.

iii
ABSTRACT
The goal of this proposed research is to provide an efficient and user friendly simulation framework for screening and optimizing chemical/microbial enhanced oil recovery processes. The framework will include (1) a user friendly interface to identify the variables that have the most impact on oil recovery using the concept of experimental design and response surface maps, (2) UTCHEM reservoir simulator to perform the numerical simulations, and (3) an economic model that automatically imports the simulation production data to evaluate the profitability of a particular design. Such a reservoir simulation framework is not currently available to the oil industry. The objectives of Task 1 are to develop three primary modules representing reservoir, chemical, and well data. The modules will be interfaced with an already available experimental design model. The objective of the Task 2 is to incorporate UTCHEM reservoir simulator and the modules with the strategic variables and developing the response surface maps to identify the significant variables from each module. The objective of the Task 3 is to develop the economic model designed specifically for the chemical processes targeted in this proposal and interface the economic model with UTCHEM production output. Task 4 is on the validation of the framework and performing simulations of oil reservoirs to screen, design and optimize the chemical processes.
iv
TABLE OF CONTENTS
DISCLAIMER .............................................................................................................. ii
ABSTRACT.................................................................................................................. iii
INTRODUCTION ........................................................................................................ 1
EXECUTIVE SUMMARY .......................................................................................... 1
EXPERIMENTAL........................................................................................................ 4
RESULTS AND DISCUSSION................................................................................... 4
Task 1: Development of Uncertainty Modules and Experimental Design Model......................................................................................................... 5
Task 2: Reservoir Simulation and Response Surface Model................................. 7
Task 3: Economic Analysis ................................................................................... 10
Task 4: Validation and Field Scale Studies ........................................................... 10
CONCLUSIONS........................................................................................................... 15
REFERENCES ............................................................................................................. 16
v
LIST OF TABLES
Table 1 Summary of Previous Work on the Design and Optimization of Surfactant Flood............................................................................................. 18
Table 2 State Parameters with Uncertainty................................................................. 18
Table 3 Design Variables............................................................................................ 19
Table 4 Other Economic Factors for Discounted Cash Flow Calculation.................. 19
Table 5 The Design Variables of Seven Highest NPV runs (Oil Price = $70/bbls; Pre-Waterflood = 1.0 PV; Surfactant Slug = 0.1 PV).................... 19
Table 6 Profitability for Barrel Oil Produced (Oil Price = $50/bbl)........................... 20

vi
LIST OF FIGURES
Fig. 1 IRSS - integrated reservoir simulation system............................................... 20
Fig. 2 UML class diagram of framework - UT_IRSP.............................................. 21
Fig. 3 Experimental design and optimization flowchart. ......................................... 22
Fig. 4 OptQuest flowchart. ....................................................................................... 22
Fig. 5 Definition of economic limit and investment efficiency. .............................. 23
Fig. 6 An example of the permeability realization................................................... 23
Fig. 7 Screening of nineteen factors with Plackett-Burman design. ........................ 24
Fig. 8 Response surface for surfactant concentration and adsorption...................... 24
Fig. 9 Net present value at the economic limit for 158 simulations from CCD. .............................................................................................................. 25
Fig. 10 Economic limit for 158 simulations from CCD............................................. 25
Fig. 11 Cumulative oil recovery of the 7 runs from 158 CCD simulations. .............. 26
Fig. 12 NPV of the best 7 among 158 CCD simulations. .......................................... 26
Fig. 13 Comparison of water flood and surfactant flood oil recovery for Run 134.................................................................................................................. 27
Fig. 14 Probability distribution for net present value in million dollars. ................... 27

1
INTRODUCTION
In this report, we detail our progress on Tasks 1 through 4 for the second year of
the project. We have continued our development of the framework with modules for
uncertainty and optimization of reservoir properties, well placement, chemical data, and
economics. We have performed several surfactant flooding simulations with different
permeability and permeability heterogeneities, surfactant concentration and slug size to
identify the key variables that control the project life and oil recovery using the
experimental design and a simple discounted cash flow analysis.
The experimental design module was then used to design the simulations varying
the primary variables such as reservoir permeability and heterogeneity, surfactant and
polymer concentration and slug size and the provided range for each.
EXECUTIVE SUMMARY
An efficient approach to obtain the optimum design under uncertainty for a wide
range of reservoir simulation applications has been developed and successfully
implemented. The approach discussed here significantly reduces the time required to
evaluate optimum designs for improved oil recovery (IOR) processes.
Determining the optimum combination of design variables for an IOR process is a
complex problem that depends on the crude oil price, reservoir and fluid properties,
process performance, and well specifications. Due to the large number of design
variables, numerical simulation is often the most appropriate tool to evaluate the
feasibility of such a process. However, because of the economical and geological

2
uncertainties, the optimum design should be expressed as a distribution to gauge the
uncertainties.
Our innovative simulation approach has the capability to determine an
economically optimum design that includes the following variables for
surfactant/polymer flooding projects.
• The duration of water injection prior to the surfactant flooding
• Surfactant concentration and slug size
• Polymer concentration injected with the surfactant
• The concentration and duration of the polymer drive
• The electrolytes concentration in different stages of the flood
The uncertain parameters considered in this study were Dykstra-Parsons
coefficient as a measure of formation heterogeneity, average reservoir permeability,
horizontal correlation length, ratio of horizontal to vertical correlation lengths, vertical to
horizontal permeability ratio, residual oil saturation, surfactant adsorption, price of crude
oil and chemicals, and discount rate.
In order to efficiently perform these complex design processes efficiently, a
platform that distributes multiple simulations on a cluster of computer processors has
been developed. The platform integrates several oil reservoir simulators, an economic
model, an experimental design and response surface methodology, and a Monte Carlo
algorithm with a global optimization search engine to identify the optimum design under
conditions of uncertainty.
The technique incorporates the following steps:
• Factorial design to find the most influential design and uncertain factors.

3
• Response surface methodology (RSM) design over those most influential
factors to fit a response surface using net present value (NPV) as the
objective function.
• Monte Carlo simulation over the response surface to maximize the mean of
the net present value and search for the optimum combination of the design
variables at the same time.
This approach is applied to a field-scale surfactant/polymer flood using the
UTCHEM simulator to find the optimal values of design variables that will maximize the
NPV.
The objectives of Task 1 are to develop three primary modules representing
reservoir, chemical, and well data. The modules are interfaced with an already available
experimental design model. The objective of the Task 2 is to incorporate UTCHEM
reservoir simulator and the modules with the strategic variables and developing the
response surface maps to identify the significant variables from each module. The
objective of Task 3 is to incorporate an economic model that automatically imports the
simulation production data to evaluate the profitability of a particular design. The
objective of the Task 4 is to perform a certain number of flow simulations using
UTCHEM in order to determine the "response surface" of the simulator in the space of
predominant uncertain parameters. The simulation results will then be analyzed and
recovery data as a function of designed variables will be stored. These simulation results
will then be ported to Design-Expert software to plot the responses versus each
parameter.
4
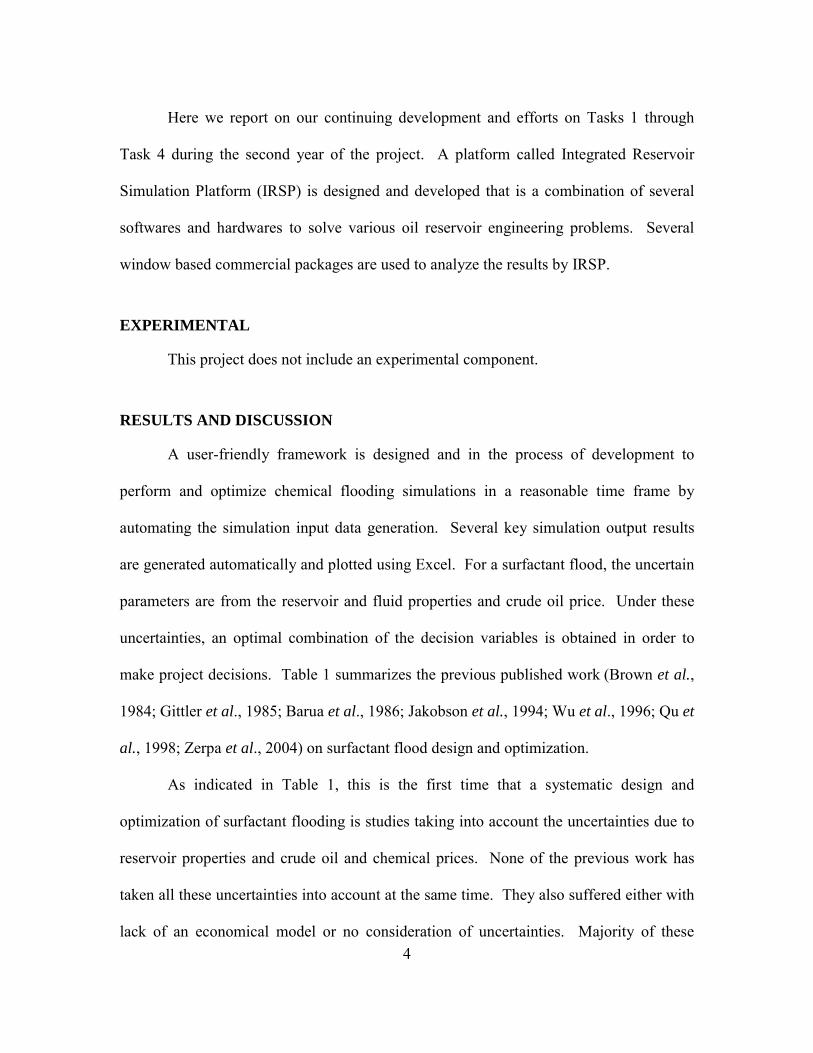
Here we report on our continuing development and efforts on Tasks 1 through
Task 4 during the second year of the project. A platform called Integrated Reservoir
Simulation Platform (IRSP) is designed and developed that is a combination of several
softwares and hardwares to solve various oil reservoir engineering problems. Several
window based commercial packages are used to analyze the results by IRSP.
EXPERIMENTAL
This project does not include an experimental component.
RESULTS AND DISCUSSION
A user-friendly framework is designed and in the process of development to
perform and optimize chemical flooding simulations in a reasonable time frame by
automating the simulation input data generation. Several key simulation output results
are generated automatically and plotted using Excel. For a surfactant flood, the uncertain
parameters are from the reservoir and fluid properties and crude oil price. Under these
uncertainties, an optimal combination of the decision variables is obtained in order to
make project decisions. Table 1 summarizes the previous published work (Brown et al.,
1984; Gittler et al., 1985; Barua et al., 1986; Jakobson et al., 1994; Wu et al., 1996; Qu et
al., 1998; Zerpa et al., 2004) on surfactant flood design and optimization.
As indicated in Table 1, this is the first time that a systematic design and
optimization of surfactant flooding is studies taking into account the uncertainties due to
reservoir properties and crude oil and chemical prices. None of the previous work has
taken all these uncertainties into account at the same time. They also suffered either with
lack of an economical model or no consideration of uncertainties. Majority of these

5
sensitivity studies were done by varying one design parameter at the time. Therefore, the
interactions between the factors were ignored. The simulations were run sequentially and
the results were analyzed manually. This made the study cumbersome and inefficient.
Here we present a practical, systematic, and efficient approach to design and
optimize a surfactant flood taking into account technical and economical uncertainties.
The platform integrates UTCHEM chemical flooding reservoir simulator (Delshad et al.,
2002), a discounted cash flow model, an experimental design and response surface
methodology, and a Monte Carlo algorithm with a global optimization search engine to
identify the optimum design under uncertainty (Zhang et al., 2005). The platform
distributes the multiple simulations on a cluster of computer processors to run
simultaneously. The post-processing utilities minimize the human involvement for
analysis of voluminous simulation output. The automated and user-friendly working
environment of the platform greatly increases the efficiency and accuracy for reservoir
simulation design and optimization studies.
These results will be fed to the economic package. Our progress on Tasks 1
through 4 is reported as discussed below.
Task 1: Development of Uncertainty Modules and Experimental Design Model
Integrated reservoir simulation system (IRSS) is a compilation of software and
hardware on a single processor running Linux or a cluster of processors to solve
numerous oil reservoir problems where multiple reservoir simulations are simultaneously
performed, either in sequential, distributed or parallel mode. The applications include
well placement, design, optimization, and economic analysis of chemical flooding
6
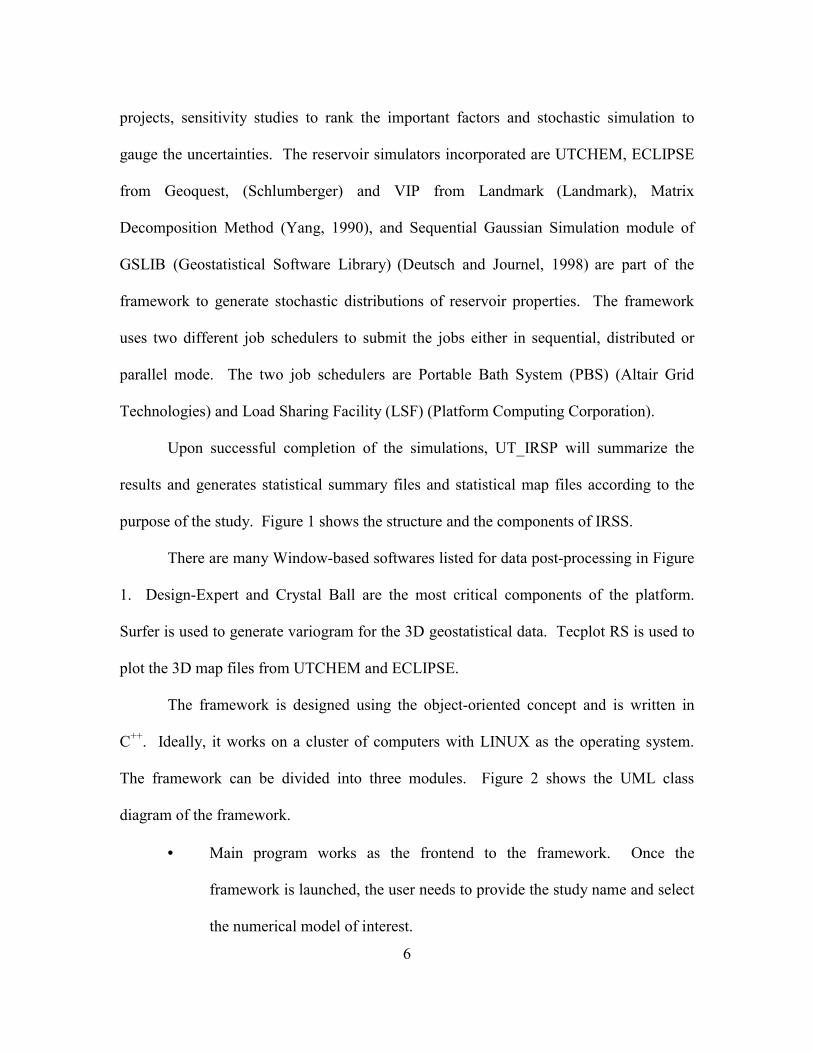
projects, sensitivity studies to rank the important factors and stochastic simulation to
gauge the uncertainties. The reservoir simulators incorporated are UTCHEM, ECLIPSE
from Geoquest, (Schlumberger) and VIP from Landmark (Landmark), Matrix
Decomposition Method (Yang, 1990), and Sequential Gaussian Simulation module of
GSLIB (Geostatistical Software Library) (Deutsch and Journel, 1998) are part of the
framework to generate stochastic distributions of reservoir properties. The framework
uses two different job schedulers to submit the jobs either in sequential, distributed or
parallel mode. The two job schedulers are Portable Bath System (PBS) (Altair Grid
Technologies) and Load Sharing Facility (LSF) (Platform Computing Corporation).
Upon successful completion of the simulations, UT_IRSP will summarize the
results and generates statistical summary files and statistical map files according to the
purpose of the study. Figure 1 shows the structure and the components of IRSS.
There are many Window-based softwares listed for data post-processing in Figure
1. Design-Expert and Crystal Ball are the most critical components of the platform.
Surfer is used to generate variogram for the 3D geostatistical data. Tecplot RS is used to
plot the 3D map files from UTCHEM and ECLIPSE.
The framework is designed using the object-oriented concept and is written in
C++. Ideally, it works on a cluster of computers with LINUX as the operating system.
The framework can be divided into three modules. Figure 2 shows the UML class
diagram of the framework.
• Main program works as the frontend to the framework. Once the
framework is launched, the user needs to provide the study name and select
the numerical model of interest.
7
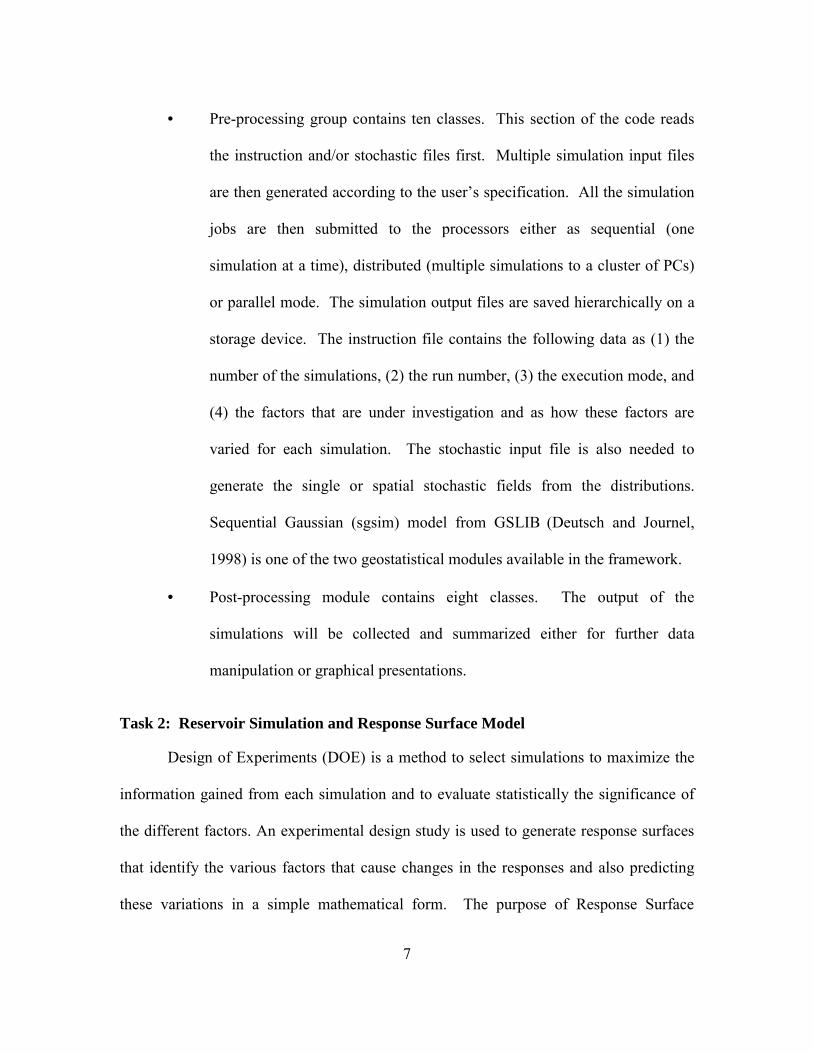
• Pre-processing group contains ten classes. This section of the code reads
the instruction and/or stochastic files first. Multiple simulation input files
are then generated according to the user�s specification. All the simulation
jobs are then submitted to the processors either as sequential (one
simulation at a time), distributed (multiple simulations to a cluster of PCs)
or parallel mode. The simulation output files are saved hierarchically on a
storage device. The instruction file contains the following data as (1) the
number of the simulations, (2) the run number, (3) the execution mode, and
(4) the factors that are under investigation and as how these factors are
varied for each simulation. The stochastic input file is also needed to
generate the single or spatial stochastic fields from the distributions.
Sequential Gaussian (sgsim) model from GSLIB (Deutsch and Journel,
1998) is one of the two geostatistical modules available in the framework.
• Post-processing module contains eight classes. The output of the
simulations will be collected and summarized either for further data
manipulation or graphical presentations.
Task 2: Reservoir Simulation and Response Surface Model
Design of Experiments (DOE) is a method to select simulations to maximize the
information gained from each simulation and to evaluate statistically the significance of
the different factors. An experimental design study is used to generate response surfaces
that identify the various factors that cause changes in the responses and also predicting
these variations in a simple mathematical form. The purpose of Response Surface

8
Methodology (RSM) (Myers and Montgomery, 1995) is to approximate a process over a
region of interest, often called operating region. The components of the operating region
include objectives, requirements, state parameters (with or without uncertainty), decision
variables, and constraints. An objective is the statement of the goal, and requirement can
be imposed. State parameters are those that cannot be controlled and most of the times
have uncertainties associated with them. They can be discrete or continuous. Discrete
parameters are also referred to as �scenarios�. Decision variables are those that are
controllable and are usually choices available to the decision-maker. Constraints are
boundary conditions, which restrict values available for the decision variables.
Engineers define objectives of the process called responses as the output and the
settings for the state parameters and decision variables as input. RSM provides tools for
(1) identifying the variables that influence the responses (screening) and (2) building
regression models relating the responses to the strategic variables (modeling). The final
models are used to make predictions of the process over the domain.
In order to compute the regression model, the process has to be sampled over the
operating region through experimentation. Design of Experiment is the use of
mathematical and statistical methods to determine the number and the location of the
experiments in order to get most information at the lowest experimental cost.
We will not describe the detailed mathematical and statistical theories behind
response surface and experimental design. More detailed information can be found in
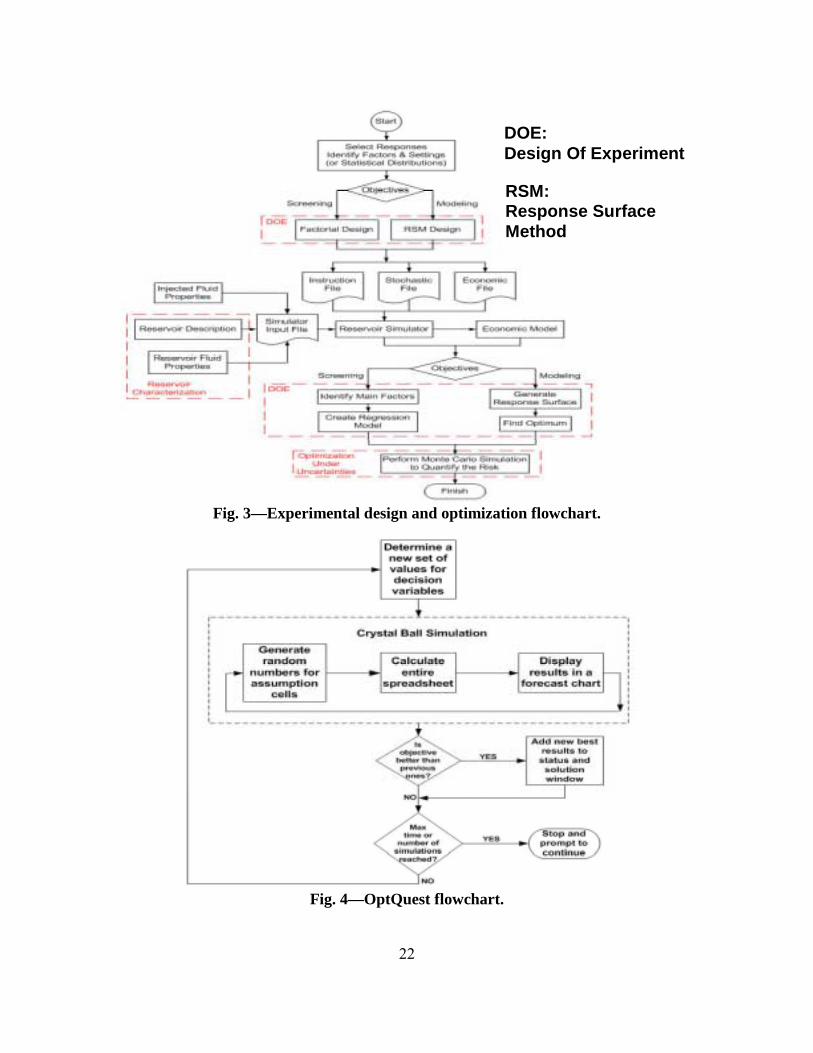
related literature (Myers and Montgomery, 1995). A flowchart showing the integration
of Design of Experiment and Response Surface in the framework is given in Figure 3. A

9
commercial package, Design-Expert from Stat-Ease, Inc., is used for performing
experimental design analysis.
The steps to perform RSM and DOE in conjunction with our framework are listed
as the following:
• Select the response and identify the settings for the state parameters and
decision variables.
• Select the corresponding method of DOE according to the study objective.
• Include the experimental plan from DOE in the instruction and/or
stochastic and/or economic file.
• Run the numerical simulations using the framework. The simulations are
executed sequentially, distributed or in a parallel mode.
• Export the results of the response to the DOE and perform statistical
analysis.
• Use the response model results to screen the factors and/or to perform
further optimization as discussed in the next section.
Traditional search methods work well when finding local solutions around a given
starting point with model data that are precisely known. These methods fail, however,
when searching for solutions to real world problems that contain significant level of
uncertainty. Recent developments in optimization have produced efficient search
methods capable of finding optimal solutions to complex problems involving elements of
uncertainty.
The optimization algorithm incorporates metaheuristics to guide its search
algorithm toward better solutions. The approach uses a form of adaptive memory to store

10
which solutions worked well before and recombines them into new improved solutions.
Since this technique does not use the hill-climbing approach of ordinary solvers, it does
not get trapped in local solutions, and it does not get thrown off course by noisy
(uncertain) model data. Scatter and tabu searches are used to globally search the solution
space. Neural network is used as a predictive model to help the system accelerate the
search by screening the reference points that are likely to have inferior objective function
values. The optimizer is described in detail in the references (April et al., 2003).
OptQuest from OptTek Systems, Inc. is the commercial optimizer that
implements the above stated optimization algorithm and has been integrated in Crystal
Ball, a risk analysis software package from Decisioneering, Inc. We use Crystal Ball and
OptQuest to perform the optimization under uncertainty. Figure 4 shows the workflow of
OptQuest in the Crystal Ball environment.
Task 3: Economic Analysis
A simple discounted cash flow model is implemented in the framework (Vaskas,
1996). The discounted cash flow (DCF) method of economic analysis allows individual
projects to be evaluated and/or compared with other projects. DCF analysis gives less
weight to future incomes by applying a discount rate to the predicted cash flows, thereby
taking into account the time value of money. The model defines economic limit (project
life) as the time when the cumulative discounted cash flow (net present value, NPV)
reaches a maximum as shown in Figure 5.

11
Task 4: Validation and Field Scale Studies
Our approach is applied to an actual onshore U.S. dolomite reservoir. The
reservoir is a potential candidate for surfactant flooding since it has already been
waterflooded to near its economic limit and is otherwise subject to abandonment. The
quarter-symmetry element of a 40-acre five-spot pattern is modeled. The quarter-five-
spot is 660 ft in both x and y directions with a thickness of 30 ft.
The simulation grid is 11 × 11 × 5 with an injector located at grid (1, 1) and a
producer at (11, 11). Both injection and production wells are completed over the entire
reservoir thickness with a constant injection pressure of 2500 psi and producing
bottomhole pressure of 300 psi. The permeability field is generated by matrix
decomposition method (Yang, 1990). A spherical variogram and a log-normal
permeability distribution are assumed. A Dykstra-Parsons coefficient of 0.75, a mean
permeability of 80 md, a correlation length of 200 ft in x and y directions and a
correlation length of 25 ft in z-direction are used to generate the permeability field for the
base case. The permeability distribution is isotropic with a vertical to horizontal
permeability ratio of 0.1 in the base case. Figure 6 shows an example of the permeability
field used in the simulations.
A constant porosity of 0.16 and a constant initial water saturation of 0.293 were
used. The reservoir pressure is about 1975 psi corresponding to a depth of about 4700 ft.
The reservoir temperature is 1000F. Water and oil viscosities are 0.7 and 5 cp
respectively. Based on the water analysis of the formation water, the initial electrolytes
are about 1.026 meq/ml of total anion (32,600 mg/l of Cl-) and 0.070 meq/ml of total
divalent cations (2100 mg/l of Ca++).
12
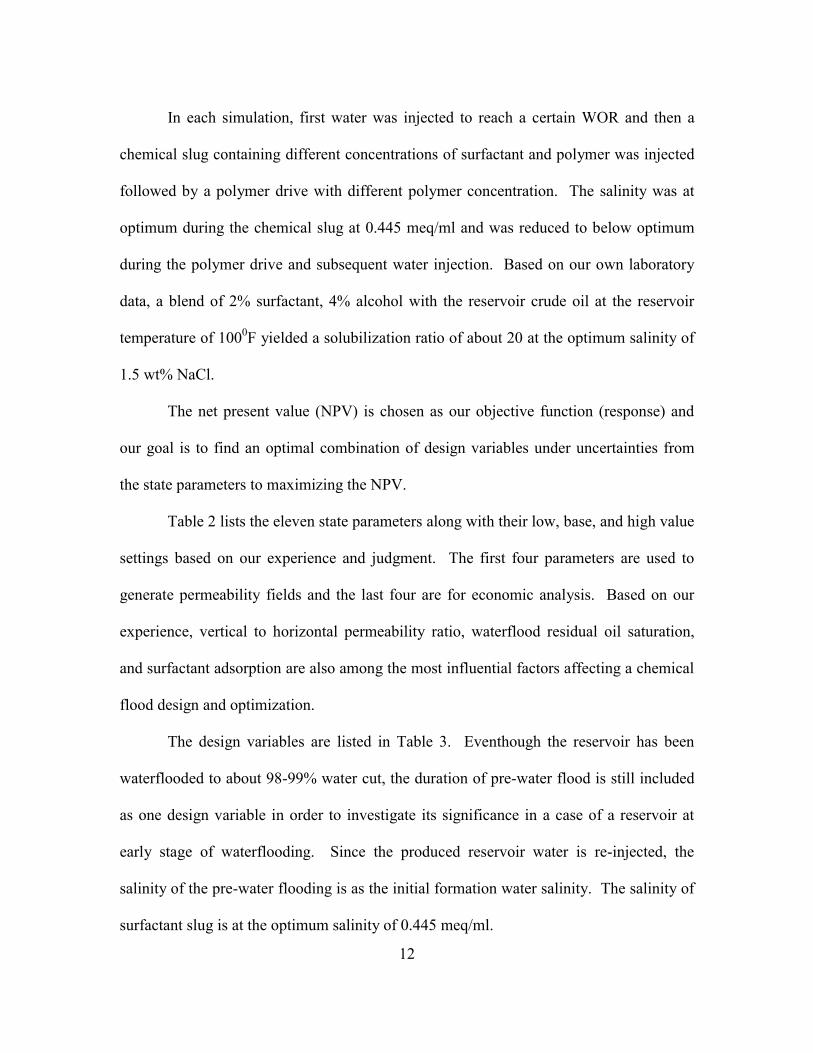
In each simulation, first water was injected to reach a certain WOR and then a
chemical slug containing different concentrations of surfactant and polymer was injected
followed by a polymer drive with different polymer concentration. The salinity was at
optimum during the chemical slug at 0.445 meq/ml and was reduced to below optimum
during the polymer drive and subsequent water injection. Based on our own laboratory
data, a blend of 2% surfactant, 4% alcohol with the reservoir crude oil at the reservoir
temperature of 1000F yielded a solubilization ratio of about 20 at the optimum salinity of
1.5 wt% NaCl.
The net present value (NPV) is chosen as our objective function (response) and
our goal is to find an optimal combination of design variables under uncertainties from
the state parameters to maximizing the NPV.
Table 2 lists the eleven state parameters along with their low, base, and high value
settings based on our experience and judgment. The first four parameters are used to
generate permeability fields and the last four are for economic analysis. Based on our
experience, vertical to horizontal permeability ratio, waterflood residual oil saturation,
and surfactant adsorption are also among the most influential factors affecting a chemical
flood design and optimization.
The design variables are listed in Table 3. Eventhough the reservoir has been
waterflooded to about 98-99% water cut, the duration of pre-water flood is still included
as one design variable in order to investigate its significance in a case of a reservoir at
early stage of waterflooding. Since the produced reservoir water is re-injected, the
salinity of the pre-water flooding is as the initial formation water salinity. The salinity of
surfactant slug is at the optimum salinity of 0.445 meq/ml.

13
Table 4 lists the economic factors that UT_IRSP takes into account. For this case
we perform a discounted cash flow calculation before tax and we assume there is no
initial capital cost.
The Plackett-Burman design was chosen to investigate the effects of the 19
factors (11 state parameters and 8 design variables). Twenty reservoir simulations were
designed using the Plackett-Burman design which is a two level design where the number
of runs is a multiple of four.
Figure 7 shows the results where the effect on the x axis represents the change in
the average response when a factor varies from its low to high value. The Design-Expert
identifies the top ten influential factors as given in Fig. 7. For the design factors and the
reservoir conditions studied, the order from most to least influential factors are the crude
oil price, the duration of water flooding prior to the chemical injection, salinity in the
polymer drive, correlation length in the x direction for permeability distribution,
surfactant slug size, formation heterogeneity (Dykstra-Parsons coefficient), price of
polymer, waterflood residual oil saturation, surfactant adsorption and average reservoir
permeability. These ten factors are then used to generate the quadratic model for the
process optimization. It should be noted that Design-Expert can only handle maximum
of ten continuous factors in its response surface designs. The remaining nine factors are
set to their base values.
The central composite design (CCD) is used to generate the response model and
158 simulations are performed. The CCD is the most common RSM design. It is divided
into three parts:
• Two-level full or fractional design (the core)

14
• Axial points (outside the core)
• Center points
The two-level factorial consists of all possible combinations of the +1 or -1 levels
of the factors. Axial points, often represented by stars, emanate from the center point,
with all but one of the factors set to zero.
Figure 8 shows the response surface generated for the surfactant slug size in PV
and surfactant adsorption in mg/g rock. The highest NPV is obtained when surfactant
adsorption is at the minimum and when the surfactant slug size is 0.1 PV with the
surfactant concentration of 0.02 volume fraction.
The NPV at the economic limit for all the 158 simulations is shown in Fig. 9. The
corresponding economic limit is given in Fig. 10. The simulations with no bar associated
with them represent those that were not economical. We chose the seven cases with NPV
greater than 4 million dollars and plot their cumulative oil recovery and NPV in Figures
11 and 12. The results emphasis the importance of coupling economic calculations to the
optimization process for the chemical flooding projects. Table 5 summarizes the design
variables for the seven best cases. Figure 13 compares the chemical oil recovery to that
of a continuous waterfood for simulation Case 134 which yielded the highest NPV.
Table 6 shows the results for a simulation in which the oil price is assumed to be
roughly the current oil price of $50/bbls. For this case all the uncertain parameters are set
to the base values and the three design variables are set to more favorable values. In
order to get a statistical quantification of the profitability under uncertainties, the
following optimization step is performed.
15
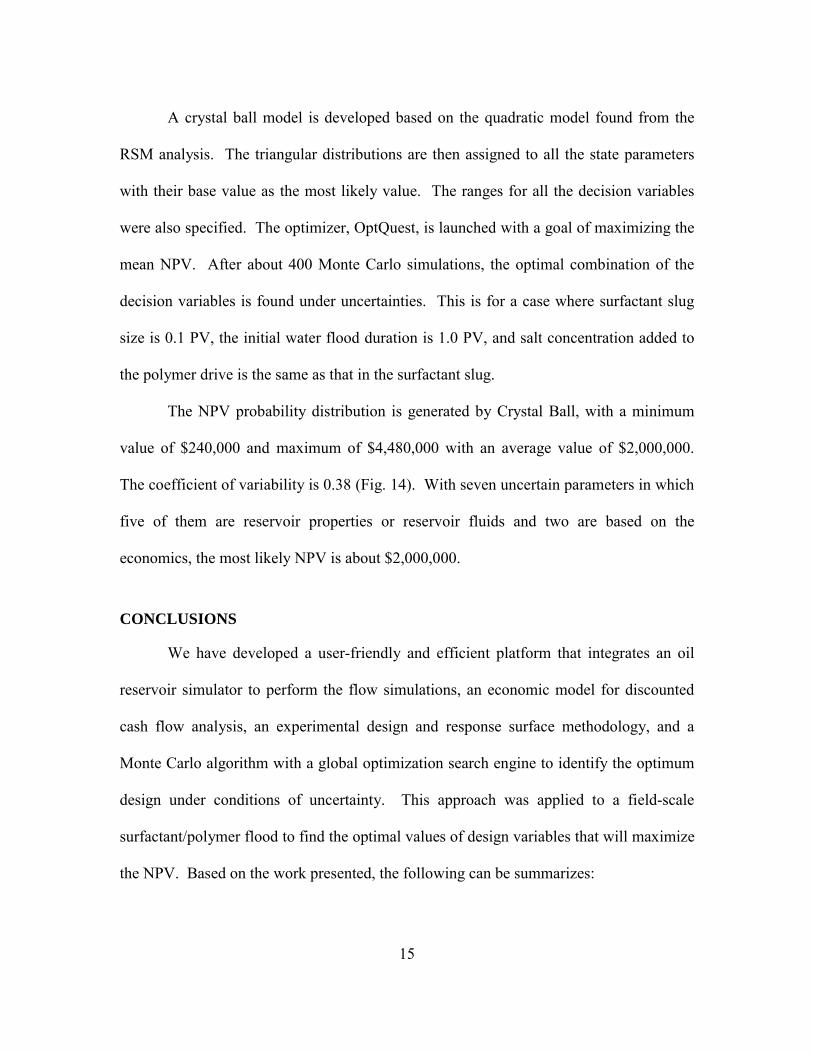
A crystal ball model is developed based on the quadratic model found from the
RSM analysis. The triangular distributions are then assigned to all the state parameters
with their base value as the most likely value. The ranges for all the decision variables
were also specified. The optimizer, OptQuest, is launched with a goal of maximizing the
mean NPV. After about 400 Monte Carlo simulations, the optimal combination of the
decision variables is found under uncertainties. This is for a case where surfactant slug
size is 0.1 PV, the initial water flood duration is 1.0 PV, and salt concentration added to
the polymer drive is the same as that in the surfactant slug.
The NPV probability distribution is generated by Crystal Ball, with a minimum
value of $240,000 and maximum of $4,480,000 with an average value of $2,000,000.
The coefficient of variability is 0.38 (Fig. 14). With seven uncertain parameters in which
five of them are reservoir properties or reservoir fluids and two are based on the
economics, the most likely NPV is about $2,000,000.
CONCLUSIONS
We have developed a user-friendly and efficient platform that integrates an oil
reservoir simulator to perform the flow simulations, an economic model for discounted
cash flow analysis, an experimental design and response surface methodology, and a
Monte Carlo algorithm with a global optimization search engine to identify the optimum
design under conditions of uncertainty. This approach was applied to a field-scale
surfactant/polymer flood to find the optimal values of design variables that will maximize
the NPV. Based on the work presented, the following can be summarizes:

16
The proposed approach is practical and can greatly increase the efficiency and
productivity for reservoir simulation studies.
• UT_IRSP in conjunction with Design-Expert and Crystal Ball can
systematically and efficiently solve sensitivity and optimization under
uncertainties.
• An integrated cost analysis model is crucial to design and optimize
surfactant floods.
• With optimal design variables for the case studied, the mean NPV is $2
million with the coefficient of variability of 0.38. This is with the oil price
of $30/bbls to $70/bbls.
• For the case and reservoir conditions we studied, the most critical factors
that affect the surfactant/polymer floods are: (1) oil Price, (2) duration of
waterflood prior to the chemical injection, (3) salt concentration in the
polymer drive, and (4) the horizontal correlation length.
REFERENCES
Altair Grid Technologies, LLC: Altair® PBS Pro� User Guide 5.4, 2004.
April, J., Glover, F., April, J., Glover, F., Kelly, J., and Laguna, M., �A New Optimization Methodology for Portfolio Management,� paper SPE 84332 presented at the SPE Annual Technical Conference and Exhibition, Denver, Colorado, Oct 5 - 8, 2003.
April, J., Glover, F., Kelly, J., Laguna, M., Erdogan, M., Mudford, B., and Stegemeier, D., �Advanced Optimization Methodology in the Oil and Gas Industry: The Theory of Scatter Search Techniques with Simple Examples,� paper SPE 82009 presented at the SPE Hydrocarbon Economics and Evaluation Symposium, Dallas, TX, April 5 - 8, 2003.

17
Barua, J., Prescott, T. and Haldorsen, H.H.: �Financial and Technical Decision Making for Surfactant Flooding,� paper SPE 15074 presented at the 56th California Regional Meeting of the Society of Petroleum Engineers held in Oakland, CA, April 2-4, 1986.
Brown, C.E., and Smith, P.J.: �The Evaluation of Uncertainty in Surfactant EOR Performance Prediction,� paper SPE 13237 presented at the 59th Annual Technical Conference and Exhibition, Houston, Sept. 1984.
Delshad, M., Asakawa, K., Pope, G.A. and Sepehrnoori, K.: �Simulations of Chemical and Microbial Enhanced Oil Recovery Methods,� paper SPE 75237 presented at the SPE/DOE Improved Oil Recovery Symposium held in Tulsa, OK, April 13-17, 2002.
Deutsch, C.V. and Journel, A.G.: GSLIB, Geostatistical Software Library and User’s Guide, Oxford University Press, Second Edition, New York 1998.
Gittler, W.E. and Krumrine, P.H.: �A Novel Approach for Risk Assessment in Chemical EOR Projects,� paper SPE 13767 presented at the SPE 1985 Hydrocarbon Economics and Evaluation Symposium, held in Dallas, Texas, March 14-15, 1985.
Jakobson, S.R. and Hovland, F.: �Surfactant Flooding: Technical and Economical Conditions To Succeed,� paper SPE 27824 presented at the SPE/DOE 9th Symposium on Improved Oil Recovery held in Tulsa, Oklahoma, April 17-20, 1994.
Landmark Graphics Corporation: VIP 2003.4 Technical Reference.
Myers, R.H. and Montgomery, D.C.: Response Surface Methodology - Process and Product Optimization Using Designed Experiments, John Wiley & Sons, New-York, 1995.
Platform� Computing Corporation: Running Jobs with Platform LSF® 5.1, 2003.
Qu, Z., Zhang, Y., Zhang, X. and Dai, J.: �A Successful ASP Flooding Pilot in Gudong Oil Field,� paper SPE 39613 presented at the 1998 SPE/DOE Improved Oil Recovery Symposium held in Tulsa, OK, April 19-22, 1998.
Schlumberger, ECLIPSE Reference Manual 2003A_1.
Vaskas, A.J.: �Optimization of Surfactant Flooding: An Economic Approach,� Master�s thesis, University of Texas at Austin (May 1996).
Wu, W., Vaskas, A., Delshad, M., Pope, G.A. and Sepehrnoori K.: �Design and Optimization of Low-Cost Chemical Flooding,� paper SPE 35355 presented at the 1996 SPE/DOE 10th Symposium on Improved Oil Recovery held in Tulsa, OK, April 21-24, 1996.
Wu, W.: �Optimization of Field-Scale Chemical Flooding Using Numerical Modeling,� Ph.D. dissertation, University of Texas at Austin (May 1996).
Yang, A.P.: �Stochastic Heterogeneity and Dispersion,� Ph.D. dissertation, University of Texas at Austin (Dec. 1990).
Zerpa, L.E., Queipo, N.V., Pintos, S. and Salager, J.: �An Optimization Methodology of Alkaline-Surfactant-Polymer Flooding Processes Using Field Scale Numerical Simulation and Multiple Surrogates,� paper SPE 89387 presented at the 2004

18
SPE/DOE 14th Symposium on Improved Oil Recovery held in Tulsa, OK, April 17-21, 2004.
Zhang, J., Delshad, M. and Sepehrnoori, K.: �A Framework to Design and Optimize Surfactant Enhanced Aquifer Remediation,� paper SPE 94222 to be presented at the 2005 SPE/EPA/DOE Exploration & Production Environmental Conference, Galveston, Texas, March 7 - 9, 2005.
Table 1—Summary of Previous Work on the Design and Optimization of Surfactant Flood
Surfactant Flood Mathematical Model
Sensitivity and RSM Study Optimization Objective Function
Authors Parameter Simulator Simplified
Model Manual Systematic Manual Automatic Oil Recovery
Econ. Model
Brown et al. (1984)
Residual oil saturation to water and surfactant; Surfactant adsorption; Surfactant relative permeability
√ √ with some uncertainty
√
Gittler et al. (1985)
Oil Recovery; Oil Price; Facility cost; Chemical cost
√ CEES
√ with some economic
uncertainty
√
Barua et al. (1986)
Surfactant concentration, slug size; Polymer slug size; Number of infill wells; Dykstra-Parsons coefficient; IFT; Oil price; Surfactant cost
√ CFPM
√ √ with some uncertainty
√
Jakobsen et al. (1994)
Surfactant concentration, slug size; IFT; Surfactant adsorption; Critical capillary number; Oil price; Surfactant cost; Discount rate; Operating cost; Well pattern
√ ECLIPSE
√ with some uncertainty
√
Wu et al. (1996)
Chemical concentration, slug size; Polymer concentration; Vertical to horizontal permeability ratio; Permeability realizations; Oil, surfactant and polymer price; Discount rate; Operating cost
√ UTCHEM
√ with
economic uncertainty
√ √ external Excel model
Qu et al. (1998)
Chemical concentration and slug size; Chemical flood starting time
√ UTCHEM
√ √
Zerpa et al. (2004)
Chemical concentration, slug size √ UTCHEM
√ √
Zhang et al. (present work)
Surfactant concentration and slug size; Polymer concentration in surfactant drive and concentration and slug size in polymer drive; Salt concentration in every stage of the flood; Surfactant flood starting time; Dykstra-Parsons coefficient; Mean permeability; X-correlation length; Ratio of X to Z correlation length; Vertical to horizontal permeability ratio; Residual oil saturation; Surfactant adsorption; Prices of oil, surfactant and polymer; Discount rate
√ UTCHEM
√ with
reservoir, fluid and economic
uncertainty
√ with
reservoir, fluid and economic
uncertainty
√ internal
C++ model
Table 2—State Parameters with Uncertainty
Parameters Base Value Low High Dykstra-Parsons Coeff 0.75 0.6 0.8 Mean Permeability (md) 80 40 100 X-Correlation Length (ft) 200 130 320
Permeability Field
Generation X/Z Correlation Length 8 1 10
Vertical to Horizontal Permeability Ratio 0.1 0.01 0.5 Residual Oil Saturation 0.33 0.25 0.4 Surfactant Adsorption (mg/g) 0.3 0.1 1
Factors for Crude Oil Price ($/bbl) 50 30 70

19
Surfactant Price ($/lb) 1.5 1 2 Polymer Price ($/lb) 1.5 1 2
Discount Rate (%) 15 10 20
Table 3—Design Variables Variables Base Low High
Pre-Water Flood Duration (PV) 1.8 1 2 Surfactant Slug Size (PV) 0.25 0.1 2 Surfactant Concentration (vol. fraction) 0.02 0.005 0.04 Polymer Drive Slug (PV) 0.5 0 2 Polymer Slug Concentration (wt %) 0.075 0 0.1 Polymer Drive Concentration (wt %) 0.075 0 0.1 Polymer Drive Salinity (meq/ml) 0.34 0.2 0.44 Post-Water Flush Salinity (meq/ml) 0.04 0.04 0.44
Table 4—Other Economic Factors for Discounted Cash Flow Calculation
Economical Variables Suggested Value Water-flood Operating Cost ($/month) 21250 Chemical Slug Injection Cost ($/bbl) 0.2 Polymer Drive Injection Cost ($/bbl) 0.1 Produced Water Cost ($/bbl) 0.03 Oil Treatment Cost ($/bbl) 0.5
Operating Cost
Overhead Cost Rate (%) 15 Royalty Rate (%) 12 Tax Rate (%) 0 Inflation Rate (%) 2 Oil Price Escalation (%) 3 Chemical Price Escalation (%) 0
Tax and Economical Rates
Operating Cost Escalation (%) 2 Work-over Cost ($) 0 Development Drilling Cost ($) 0 Facility and Equipment Cost ($) 0 Leasehold Cost ($) 0
Capital Cost
Intangible Drilling Cost ($) 0
Table 5—The Design Variables of Seven Highest NPV runs (Oil Price = $70/bbls; Pre-Waterflood = 1.0 PV; Surfactant Slug = 0.1 PV)
Sim No Poly Drive Salt (meq/ml)
X-Correl Length (ft)
DP Coeff
Polymer Price ($/lb)
Sor
Surf Adsorp (mg/g rock)
Mean Perm (md)
7 0.2 320 0.6 1 0.25 0.1 100 9 0.2 320 0.8 1 0.25 0.1 40
85 0.44 130 0.6 2 0.25 0.1 100 121 0.44 320 0.8 2 0.25 1 100 129 0.2 320 0.8 2 0.4 0.1 40 133 0.2 320 0.6 2 0.4 0.1 100 134 0.44 130 0.6 1 0.4 0.1 100

20
Table 6—Profitability for Barrel Oil Produced (Oil Price = $50/bbl)
Profitability/bbl No discount ($/bbl) With discount ($/bbl) Revenue 50 50 Royalty 6 6 Capital Cost 0 0 Operating Cost 12.1027 11.3593 Chemical Cost 10.7745 13.3975 Taxes 0 0 Profit 21.1228 19.2432
UTCHEM
ECLIPSE
JobScheduler
VIP
GeoStat
InputFile
InstFile
Stoc File
Surfer
Tecplot RSPHDWin
MS Office
MS SQL
Crystal Ball DesignExpert
MATLAB
Basic Output Files
StatistMap Files
StatistSumma
Files
FTP the data back to PC for post-processing
Data Storage
UT_IRSP
ClusterEconomic File
Fig. 1—IRSS - integrated reservoir simulation system.

21
Fig. 2—UML class diagram of framework - UT_IRSP.
22
DOE: Design Of Experiment
RSM: Response Surface Method
Fig. 3—Experimental design and optimization flowchart.
Fig. 4—OptQuest flowchart.

23
Time
Cum
ulat
ive
disc
ount
ed c
ash
flow
Investment efficiency = P / | I |
Economic limit
P
I
0
+
Fig. 5—Definition of economic limit and investment efficiency.
iinnjjeeccttoorr
pprroodduucceerr
Fig. 6—An example of the permeability realization.

24
TToopp FFoouurr LLiisstt:: 11.. OOiill PPrriiccee 22.. PPrreeWWaatteerrPPVV 33.. PPoollyyDDrriivveeSSaalltt44.. XX--CCooll LLeennggtthh
1
10
9 8
7
6
5
4
3
2
Fig. 7—Screening of nineteen factors with Plackett-Burman design.
Fig. 8—Response surface for surfactant concentration and adsorption.

25
0
0.5
1
1.5
2
2.5
3
3.5
4
4.5
5
5.5
6
1 9 17 25 33 41 49 57 65 73 81 89 97 105 113 121 129 137 145 153
Simulation Number
NPV
@Ec
onom
ic L
imit
(mill
ion
$)
Fig. 9—Net present value at the economic limit for 158 simulations from CCD.
0
1
2
3
4
5
6
7
8
9
10
11
12
1 9 17 25 33 41 49 57 65 73 81 89 97 105 113 121 129 137 145 153
Simulation Number
Econ
omic
Lim
it (y
ear)
Fig. 10—Economic limit for 158 simulations from CCD.

26
0
50000
100000
150000
200000
250000
0 2 4 6 8 10 12 14 16 18 20
Time(year)
Cum
ulat
ive
Oil
Rec
over
y (b
bl)
OXYjzh-7OXYjzh-9OXYjzh-85OXYjzh-121OXYjzh-129OXYjzh-133OXYjzh-134
Fig. 11—Cumulative oil recovery of the 7 runs from 158 CCD simulations.
-1
0
1
2
3
4
5
6
0 2 4 6 8 10 12 14 16 18 20
Time(year)
Net P
rese
nt V
alue
(Mill
ion
$)
OXYjzh-7OXYjzh-9OXYjzh-85OXYjzh-121OXYjzh-129OXYjzh-133OXYjzh-134
Fig. 12—NPV of the best 7 among 158 CCD simulations.

27
0
10
20
30
40
50
60
0 5 10 15 20 25 30 35 40 45
Time (year)
Oil
Rec
over
y (%
OO
IP)
WaterFlood
SurfactantFlood
Fig. 13—Comparison of water flood and surfactant flood oil recovery for Run 134.
F req u en c y C ha r t
Mill ion$
Mean = 1.9912.000
.023
.047
.070
.093
0
23.25
46.5
69.75
93
0.0000 1.0000 2.0000 3.0000 4.0000
1 ,0 0 0 T r ia l s 9 9 6 D is p la ye d
F o re c as t : NP V
Fig. 14—Probability distribution for net present value in million dollars.