a framework for improving the management of irrigation schemes
TRANSCRIPT

PR118.fm Page 1 Thursday, September 2, 2004 1:04 PM
A Framework for Improving the Management of Irrigation
Schemes in Vietnam
Proceedings of a workshop held in Ho Chi Minh City, Vietnam, 28 November 2003
Editors: Hector M. Malano, Biju A. George and Brian Davidson
Australian Centre for International Agricultural ResearchCanberra 2004
A framework for improving the management of irrigation schemes in Vietnamedited by Hector M. Malano, Biju A. George and Brian Davidson
ACIAR Proceedings No. 118e(printed version published in 2004)
PR118.fm Page 2 Thursday, September 2, 2004 1:04 PM
The Australian Centre for International Agricultural Research (ACIAR) was establishedin June 1982 by an Act of the Australian Parliament. Its mandate is to help identify agri-cultural problems in developing countries and to commission collaborative researchbetween Australia and developing country researchers in fields where Australia has aspecial research competence.
Where trade names are used this constitutes neither endorsement of nor discriminationagainst any product by the Centre.
ACIAR PROCEEDINGS
This series of publications includes the full proceedings of researchworkshops or symposia organised or supported by ACIAR. Numbers in thisseries are distributed internationally to selected individuals and scientificinstitutions.
© Australian Centre for International Agricultural Research, GPO Box 1571,Canberra, ACT 2601.
Malano, H.M., George, B.A. and Davidson, B., ed. 2004. A framework forimproving the management of irrigation schemes in Vietnam. Proceedings of aworkshop held in Ho Chi Minh City, Vietnam, 28 November 2003. ACIARProceedings No. 118, 72p.
ISBN 1 86320 473 3 (print)1 86320 474 1 (online)
Cover design: Design One Solutions
Technical editing and typesetting: Clarus Design Pty Ltd
Printing: Elect Printing
A framework for improving the management of irrigation schemes in Vietnamedited by Hector M. Malano, Biju A. George and Brian Davidson
ACIAR Proceedings No. 118e(printed version published in 2004)

PR118.fm Page 3 Thursday, September 2, 2004 1:04 PM
Foreword
Vietnam’s future food security depends on the country’s ability to expand agricul-tural production. This, in turn, will rely heavily on increased efficiency of irrigationsystems. About 80% of the country’s four million hectares of cultivated paddy andupland crops are equipped with some form of irrigation.
This publication contains the main findings of a project carried out in Vietnamwhich focused on the operation and management of publicly managed irrigationsystems. These findings formed the basis for the development of a managementimprovement model for irrigation systems in Vietnam which is also applicable toother systems throughout Asia.
The papers were presented at a workshop held at the Southern Institute for WaterResources Research in Ho Chi Minh City, Vietnam in November 2003.
We are pleased to publish these proceedings and hope that the book will be a val-uable resource for irrigation managers and policy makers to formulate and imple-ment strategies for improving the planning and operation of water resource andirrigation systems.
A framework for improving the manageedited by Hector M. Malano, Bij
ACIAR Procee(printed version p
3
Peter CoreDirectorAustralian Centre for International Agricultural Research
ment of irrigation schemes in Vietnamu A. George and Brian Davidsondings No. 118eublished in 2004)

PR118.fm Page 4 Thursday, September 2, 2004 1:04 PM
A framework for improving the management of irrigation schemes in Vietnamedited by Hector M. Malano, Biju A. George and Brian Davidson
ACIAR Proceedings No. 118e(printed version published in 2004)
PR118.fm Page 5 Thursday, September 2, 2004 1:04 PM
Contents
Foreword 3
A Framework for Improving the Management of Irrigation Schemes in Vietnam: an Overview 7Hector M. Malano, Biju A. George and Brian Davidson
Modelling and Monitoring of System Operation: Three Different Irrigation Systems in Vietnam 16Biju A. George, Hector M. Malano, Vo Khac Tri, Nguyen Chien and Hugh Turral
Operational and Resource-Use Performance in the Cu Chi Irrigation System 31Ngo Dang Phong, To Phuc Tuong, Nguyen van Dam, Le Truong Tho, Biju A. George, Nguyen van Dang and Hugh Turral
Assessing the Impacts of Water Flows on Users: a Gross Margins Analysisof Farms 41Sally Marsh, Brian Davidson, Le Quang Anh and Trinh Thi Long
Asset Management Modelling for Infrastructure Management in VietnameseIrrigation Management Companies 51Hector M. Malano, Biju A. George, Brian Davidson, Vo Khac Tri and Nguyen Viet Chien
Assessing the Financial Viability of Irrigation Management Companies: a Case Study at Cu Chi, Vietnam 59Brian Davidson, Hector M. Malano and Biju A. George
Assessing Institutional and Pricing Arrangements in Order to Improve Water-Use Efficiency and Viability 69Mike Bryant, Brian Davidson, Tim McGrath and Le Quang Anh
A framework for improving the management of irrigation schemes in Vietnamedited by Hector M. Malano, Biju A. George and Brian Davidson
ACIAR Proceedings No. 118e(printed version published in 2004)
5
PR118.fm Page 6 Thursday, September 2, 2004 1:04 PM
Abbreviations
ACIAR Australian Centre for International Agricultural ResearchBCM billion cubic metresCV coefficient of variationDGPS differential global positioning systemETo evapotranspirationFAO Food and Agricultural Organization of the United NationsGUI graphical user interfaceGIS geographical information systemHCMC Ho Chi Minh City HPC hand-held personal computerIMC irrigation management companyIMSOP irrigation main system operation (computer model)MCM million cubic metresRIS relative irrigation supplyRRD Red River DeltaRWS relative water supplySA summer–autumnSR supply ratioUS$ United States dollarVND Vietnamese DongVIWRR Vietnam Institute for Water Resources Research WS winter–spring
A framework for improving the management of irrigation schemes in Vietnamedited by Hector M. Malano, Biju A. George and Brian Davidson
ACIAR Proceedings No. 118e(printed version published in 2004)
6

PR118.fm Page 7 Thursday, September 2, 2004 1:04 PM
A Framework for Improving the Management of Irrigation Schemes in Vietnam: an Overview
Hector M. Malano,* Biju A. George* and Brian Davidson†
Introduction
When many irrigation schemes are planned and built,how much thought is put into how they should be man-aged? What can happen is that what can be termed an‘adoption approach’ is taken, where a method ofcontrol is chosen from a scheme in operation else-where in the country or in some other country. It wouldappear that using this approach has resulted in themanagement of irrigation schemes not evolving exten-sively. The advantage of this approach is that the risksof institutional failure are minimised. The use of thisapproach is understandable, as the operation of ascheme is complex, occurs at many levels andinvolves many different fields of expertise (includinghydrology, economics and institutional analysis).However, adopting a method of operating an irrigationscheme from another country or era may not be thebest approach to the problem. Even if an idealapproach is initially chosen, things change whilehabits become entrenched. A legitimate question thatcould be asked is: Is the current method of operating anirrigation scheme ideal?
There are two, related elements to this question.First, and simply, what is considered to be ideal?Does this mean that, given the existing physicalinfrastructure, the scheme running at maximal effi-ciency? Or does it mean that the returns to users aremaximised, given the cost of operation. Or does itmean that it is financially sustainable, withoutputting undue costs on society or the environment.
* International Technologies Centre, Department of Civiland Environmental Engineering, University ofMelbourne, Victoria 3010, Australia.
† Institute of Land and Food Resources, University of Melbourne, Victoria 3010, Australia.
A framework for improving the manageedited by Hector M. Malano, Biju
ACIAR Proceed(printed version p
7
Second, given the complexity of an irrigationscheme, surely a number of different fields need tobe investigated. To fix a problem in one geographicarea may very well cause problems elsewhere in thescheme. Further, fixing an engineering problemmay lead to financial or institutional problems.
It would appear that the question of ideal operationshould be resolved in a holistic manner, accounting fordifferent geographic locations, and incorporating dif-ferent fields of expertise. In other words, the engi-neering, economic, social and institutional issues needto be addressed on a wide scale if any changes to theoperation of an irrigation scheme are considered. Fur-ther, the degree of change needs to be assessed using avariety of measures. Improvements, or reductions,associated with any change can then be assessed usingthe tools associated with each field or discipline.
There are two problems associated with taking aholistic approach to assess the problems of oper-ating irrigation schemes. The first is philosophical.Karl Popper (quoted in James 1980) puts a succinctcase against holistic approaches. He argues that aholistic approach is so complex that policy makersare not provided with the directions needed to makechange. In essence, Popper presents a case for mar-ginalism, which is an anathema to holism. Thesecond objection is that such an approach meansthat an ‘ideal’ operational plan cannot be achieved.What is derived is a set of trade-offs where gains inone area are measured against costs in others.
The purpose of these proceedings is to outline anapproach for assessing the operation of an irrigationscheme using a holistic approach. To illustrate howthis works, examples are drawn from irrigationschemes in Vietnam. The papers presented in thisvolume were discussed at an ACIAR workshop inHo Chi Minh City in November 2003.
ment of irrigation schemes in Vietnam A. George and Brian Davidsonings No. 118e
ublished in 2004)

PR118.fm Page 8 Thursday, September 2, 2004 1:04 PM
An Outline of the Problems
An irrigation scheme is that physical structure thatmoves water in time and space. The crucial elementrequired of an irrigation scheme is the need to reg-ulate water flows. Consequently, some method ofstoring, moving and distributing water is requiredbefore it can be called an irrigation scheme. It isusually a large item of infrastructure, incorporatingsometimes a dam, channels, sluice gates, leveebanks, pumps etc. It can be as small as a bucket anda pipe, but it cannot be a bucket or a pipe on its own.By moving water in time and space, the things pro-duced from water can also be moved in time andspace. For instance, the spatial proliferation ofcotton and rice production in Australia has occurredbecause of the availability of inexpensive and reli-able supplies of water. In Vietnam, where water isregulated temporally, two and in some cases threerice crops are grown each year, whereas once onlyone crop could be grown.
It would be easy to confine an analysis of themanagement and operation of an irrigation schemeto what one sees in terms of a physical structure.However, given the definition presented above,such an approach would appear to be a little narrow.As an irrigation scheme runs for a purpose, any
A framework for improving the manageedited by Hector M. Malano, Biju
ACIAR Proceed(printed version pu
8
Problem Assessm
EconomicSystem Operation
Assessment Me
System Operation Asset Management
Operational Modeling
Historical Performance
Improved Operation
Asset Survey & Register
Asset Modelling
Asset Management Strategies
analysis of it must to some extent be measured interms of how well it performs the things it issuppose to do. Clearly, its ability to deliver watereffectively and efficiently is the key criterion uponwhich the operation and management can begauged.
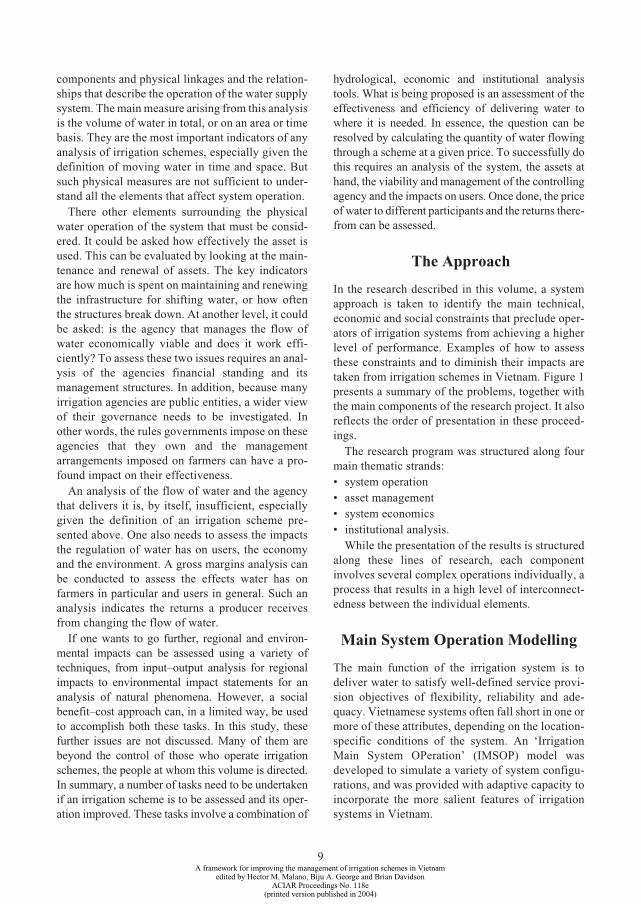
However, what does effective and efficient waterdelivery mean? From the definition presented aboveit must mean more that an assessment of the flow ofwater. Perhaps the best way of assessing an irriga-tion scheme is to segment the areas of concernaccording to the flow of water which, in turn, tracksthe effects it has. While such an approach is logical,it is perhaps better to isolate the problems that canoccur along this flow. From this base, the major areaof concern (hydrological, economic and/or institu-tional) can be isolated and a method of analysisidentified (see Figure 1). Key indicators, the meas-ures of effective and efficient water delivery, are theoutputs of such an approach and can be used forcomparative purposes.
Taking this approach, one can start with anassessment of the flow, distribution and volume ofwater passing through an irrigation scheme. Theseproblems, which are basically hydrological, can beassessed by conducting a ‘systems analysis’. Thisinvolves the identification of the system
ent
s Institutional
thod
System Economics Institutional Analysis
Household Analysis
Water Productivity
Company Analysis
Company Arrangements
Water Pricing Model
Figure 1. Main components of the research project
ment of irrigation schemes in Vietnam A. George and Brian Davidsonings No. 118eblished in 2004)
PR118.fm Page 9 Thursday, September 2, 2004 1:04 PM
components and physical linkages and the relation-ships that describe the operation of the water supplysystem. The main measure arising from this analysisis the volume of water in total, or on an area or timebasis. They are the most important indicators of anyanalysis of irrigation schemes, especially given thedefinition of moving water in time and space. Butsuch physical measures are not sufficient to under-stand all the elements that affect system operation.
There other elements surrounding the physicalwater operation of the system that must be consid-ered. It could be asked how effectively the asset isused. This can be evaluated by looking at the main-tenance and renewal of assets. The key indicatorsare how much is spent on maintaining and renewingthe infrastructure for shifting water, or how oftenthe structures break down. At another level, it couldbe asked: is the agency that manages the flow ofwater economically viable and does it work effi-ciently? To assess these two issues requires an anal-ysis of the agencies financial standing and itsmanagement structures. In addition, because manyirrigation agencies are public entities, a wider viewof their governance needs to be investigated. Inother words, the rules governments impose on theseagencies that they own and the managementarrangements imposed on farmers can have a pro-found impact on their effectiveness.
An analysis of the flow of water and the agencythat delivers it is, by itself, insufficient, especiallygiven the definition of an irrigation scheme pre-sented above. One also needs to assess the impactsthe regulation of water has on users, the economyand the environment. A gross margins analysis canbe conducted to assess the effects water has onfarmers in particular and users in general. Such ananalysis indicates the returns a producer receivesfrom changing the flow of water.
If one wants to go further, regional and environ-mental impacts can be assessed using a variety oftechniques, from input–output analysis for regionalimpacts to environmental impact statements for ananalysis of natural phenomena. However, a socialbenefit–cost approach can, in a limited way, be usedto accomplish both these tasks. In this study, thesefurther issues are not discussed. Many of them arebeyond the control of those who operate irrigationschemes, the people at whom this volume is directed.In summary, a number of tasks need to be undertakenif an irrigation scheme is to be assessed and its oper-ation improved. These tasks involve a combination of
A framework for improving the manageedited by Hector M. Malano, Biju
ACIAR Proceed(printed version pu
9
hydrological, economic and institutional analysistools. What is being proposed is an assessment of theeffectiveness and efficiency of delivering water towhere it is needed. In essence, the question can beresolved by calculating the quantity of water flowingthrough a scheme at a given price. To successfully dothis requires an analysis of the system, the assets athand, the viability and management of the controllingagency and the impacts on users. Once done, the priceof water to different participants and the returns there-from can be assessed.
The Approach
In the research described in this volume, a systemapproach is taken to identify the main technical,economic and social constraints that preclude oper-ators of irrigation systems from achieving a higherlevel of performance. Examples of how to assessthese constraints and to diminish their impacts aretaken from irrigation schemes in Vietnam. Figure 1presents a summary of the problems, together withthe main components of the research project. It alsoreflects the order of presentation in these proceed-ings.
The research program was structured along fourmain thematic strands: • system operation• asset management • system economics • institutional analysis.
While the presentation of the results is structuredalong these lines of research, each componentinvolves several complex operations individually, aprocess that results in a high level of interconnect-edness between the individual elements.
Main System Operation Modelling
The main function of the irrigation system is todeliver water to satisfy well-defined service provi-sion objectives of flexibility, reliability and ade-quacy. Vietnamese systems often fall short in one ormore of these attributes, depending on the location-specific conditions of the system. An ‘IrrigationMain System OPeration’ (IMSOP) model wasdeveloped to simulate a variety of system configu-rations, and was provided with adaptive capacity toincorporate the more salient features of irrigationsystems in Vietnam.
ment of irrigation schemes in Vietnam A. George and Brian Davidsonings No. 118eblished in 2004)

PR118.fm Page 10 Thursday, September 2, 2004 1:04 PM
This component of the research focuses on the useof computer modelling to:• assess of the historical performance of irrigation
systems• simulate and analyse alternative operational
regimes to enhance system performance• assist in the day-to-day operation of the system
for scheduling and computing flows to meetirrigation demand.The adaptive nature of the modeling approach
used in IMSOP was used to evaluate and improvethe operational performance of three irrigation sys-tems: at La Khe and Dan Hoai in Hatai Provincenear Hanoi; and at Cu Chi in the vicinity of Ho ChiMinh City. Each of these systems has specific fea-tures that required individual adaptation of themodel. The La Khe and Dan Hoai irrigation systemsfeature high levels of energy input for irrigationsupply and disposal of excess rainfall during therainy season. The Cu Chi irrigation system is agravity-fed system within the Dong Nai Basin thatfaces increasing intersectoral competition. Morewater is demanded for urban and industrial users inHo Chi Minh City. In addition, river flows must beincreased to avoid saltwater intrusion.
Once each system was modelled, it was possibleto simulate alternative operational scenarios. Thesewere used to demonstrate to irrigation agencies andother stakeholders a selection of operating proce-dures that could be implemented in the future. Theseselected scenarios were then field-tested to evaluatetheir comparative advantages and disadvantages,and their ability to deliver the desired quantity ofwater. The preferred option was then adopted by theirrigation company on the basis of thesupply:demand ratio to each of the main serviceareas within the system, equity of supply across thesystem and simplicity of operation. The process ofadaptation and change in operating rules wasachieved in consultation with the key stakeholdersin the project, notably the irrigation managementcompanies (hereinafter the IMCs) and the waterusers.
Managing the Infrastructure
A country’s ability to meet the future food-supplychallenges may depend largely on improvements toirrigation infrastructure. Many irrigation schemes,like those in the Red River Delta (hereinafter theRRD) of Vietnam, rely heavily on pumping for irri-
A framework for improving the manageedited by Hector M. Malano, Biju
ACIAR Proceed(printed version pu
10
gation and drainage and many operators are con-cerned about the high energy costs of the operation.Of great concern is the lack of sustainability of theirrigation infrastructure due to the inability to suffi-ciently invest in operation and maintenance. Atpresent, there are no provisions for linking the costof operating the irrigation and drainage infrastruc-ture to the actual price charged for these services.This, coupled with the inability of government tosubsidise these services at an appropriate level,places severe constraints in the ability of IMCs tosustain their operations.
The delivery of irrigation and drainage servicerequires a hydraulic infrastructure that is designed,operated, maintained and upgraded in the most cost-effective manner to meet the desired service objec-tives (Malano et al. 1999).
What managers of irrigation schemes need tofocus on is the development of a comprehensiveframework for the implementation of an asset-man-agement program for the IMCs. This system willallow the IMCs to plan their long-term strategy forthe creation of new assets, the rehabilitation ofassets to their original design specifications or themodernisation of assets to meet new servicerequirements. Hofwegen and Malano (1997) defineasset management programs as ‘A plan for creationor acquisition, maintenance, operation, replace-ment, modernization and disposal of irrigation anddrainage assets to provide agreed level of service inthe most cost effective and sustainable manner’.Currently, the price of irrigation delivery servicecharged by the IMCs in many countries, includingVietnam, bears no relation to the infrastructure andoperation and management costs. A key factor inoptimising the outcomes from this decision-makingprocess is the ability to make informed choices froma number of alternative future asset scenarios. Thetools developed in this project enable the IMCs toput in place a transparent process to ascertain theactual cost of service provision, and in particular theactual cost associated with alternative infrastructurestrategies.
The asset-management modelling framework hasthree main components:• a database of assets detailing geographical
locations of assets, design features, maintenancerecords and asset condition and performance
• an analysis module that enables the modelling offuture asset strategies, including the calculationof future liabilities and life-cycle asset costs
ment of irrigation schemes in Vietnam A. George and Brian Davidsonings No. 118eblished in 2004)

PR118.fm Page 11 Thursday, September 2, 2004 1:04 PM
• a set of alternative strategies for the long-termmanagement of the asset infrastructure. The asset database enables asset operators to
maintain an up-to-date register of the existingassets. A geographical information system (GIS)asset-management software program called ‘AssetManager©’ was developed to facilitate the rapidrecording, update, retrieval and manipulation of theexisting asset base. The software has been testedand fully implemented in the Cu Chi and Dan Hoaiirrigation systems. The software was used to eval-uate several strategic options available to the IMCsto invest, maintain and modernise their asset base.The economic assessment of these options providedthe key component for the calculation of the actualcost of supplying water for irrigation in thesesystems and, by extension, a key element fordesigning a water pricing model for these systems.
Financial Viability of Water Supply Companies
There is a belief that the performance of many pub-licly owned IMCs is poor. For instance, Turral andMalano (2002) argue that technical improvementscould be made in the delivery of water to manyschemes in Vietnam, leading to greater efficiency.Chien (2001) and Anh et al. (2003) allude to theproblems of managing irrigation schemes inVietnam and the lack of farmer empowerment whendealing with these companies. To study the eco-nomic performance of irrigation, three interrelatedaspects need to be examined:• the financial viability of the IMCs• the performance of the land and water resource
systems• the economic performance of the farming
enterprises served by these IMCs. While the other aspects need (and will be) dealt
with, the first of these issues—the financial viabilityof IMCs—is arguably the most important, as there isabundant evidence that these companies face hugedifficulties in maintaining and renewing theirassets. One of the most-often cited claims for theproblems associated with running these IMCs istheir apparent reliance on government subsidies tosurvive.
There is a need to provide a framework to analysethe financial viability of these companies bylooking at their cost structure and its relationship to
A framework for improving the manageedited by Hector M. Malano, Biju
ACIAR Proceed(printed version pu
11
the price of the water supply and drainage service.The metrics used in this analysis consist of 18 per-formance measures: six revenue measures and twoexpenditure measures disaggregated into ten sub-measures and eight financial performance meas-ures. These metrics are the result of financial quan-tities expressed on an area basis, a volume basis oras dimensionless quantities.
The framework was applied to the currentcompany operation in the Cu Chi irrigation system.The outcomes of the analysis provided an insightinto the financial difficulties faced by these compa-nies and, more importantly, it provided an opportu-nity to test the methodology, which can be appliedto other systems in Vietnam and elsewhere.
The analysis highlighted some critical aspects ofthe companies’ operations.
• The IMCs (of which Cu Chi is typical) are heavilyreliant on government subsidies to carry out theiroperations.
• The level of government subsidies is insufficientto ensure the long-term sustainability of IMCassets.
• The level of expenditure on maintenance isconsistently below the standard needed to preventthe rapid decay of the company assets.
Land and Water Productivity
Murray-Rust and Snellen (1993) argued that theperformance of any irrigation system depends inpart on the efficiency with which the irrigationsystem uses resources in providing these services.This ‘resource-use performance’ evaluates thereturn from agriculture produced from waterresources. The common indicator of resource-useefficiency is the crop yield, either per unit of land orper unit volume of water. To illustrate the resource-use efficiency, field experiments were conducted ina branch canal of the Cu Chi system from 2000 to2003 to estimate water-use efficiency and produc-tivity by quantifying the water balance components.The results of the analysis revealed very low outputof rice per unit volume of water. It was also foundthat there is a tendency to diversify from rice toupland crops, like maize and peanuts, which aremore profitable especially during the winter–springseason. In summary, far too much water is used inthe case under investigation.
ment of irrigation schemes in Vietnam A. George and Brian Davidsonings No. 118eblished in 2004)

PR118.fm Page 12 Thursday, September 2, 2004 1:04 PM
The Economic Performance of Farmers
Attempts to improve the efficiency of publiclymanaged irrigation schemes are undertaken within aframework that most suggested improvements willbenefit the users of water, i.e. farmers. Thus, it isnecessary to investigate the effects that the supplyof irrigation water has on farmers. What is impor-tant from this analysis is the approach that wastaken. It is necessary to survey a selected numberfarms in each scheme. Then, a whole-farm budgetfor each farm is constructed. These data are supple-mented with local knowledge on farm and house-hold activities and circumstances. From this base, itwas possible to investigate the economic impactswater has on each household. By comparing house-holds along a canal, down the irrigation scheme,certain conclusions can be drawn about the impactsof different water availability. However, it shouldbe kept in mind that, since each farm is, in reality, aseparate entity, managed differently and possiblyfor a different purpose, strict comparisons betweenfarms may not be possible. To illustrate the tech-nique, a gross margins analysis was undertaken ofrepresentative farms in the Cu Chi, La Khe and DanHoai irrigation schemes. The aim was to assesswhether farm profitability was affected by varia-bility in the supply of irrigation water due to eachfarm’s location within the system, and the cost ofthat water. It was found that the nature of thefarming system is defined by the provision of irri-gation, yet the prices paid for water and variabilityin its provision would appear to have little impact oncrop yields and farm incomes in two of the threeschemes. In the third scheme (at Cu Chi), cropyields and net returns from cropping per hectareappear to be considerably less in farms located at theend of the irrigation system.
Institutional Analysis and Water Pricing
It has been argued that volumetric pricing for waterwould improve the efficiency of irrigation waterdelivery over the area-based pricing system cur-rently in place in many countries around the world.However, many of the arguments put forward infavour of volumetric charging ignore the institu-tional reforms and infrastructural adjustments that
A framework for improving the manageedited by Hector M. Malano, Biju
ACIAR Proceed(printed version pu
12
would be required to implement such a change.There is a need to suggest a process by which a vol-umetric charge, albeit a partial one, could be imple-mented in a system which has area-based charges.One way of doing this is to introduce water usersassociations that would evolve over time to repre-sent the farmers who live along a single canal.These associations could buy and pay for waterfrom a water-supply company on a volumetricbasis, and distribute it to farmers who pay for it onan area basis.
In Vietnam, the communes or cooperatives cur-rently buy the water. Along any canal there can beup to six different communities buying water. Thisleads to problems associated with spatial locationand maintenance of the canal. A single water usersassociation representing all users along a canal mayprove to be a beneficial institutional change. Usingthe example of the La Khe irrigation scheme inVietnam, it was found that farmers had the potentialto reduce the amount they spent on water. However,existing institutional arrangements prevent thesereforms from being undertaken.
Description of Study Area
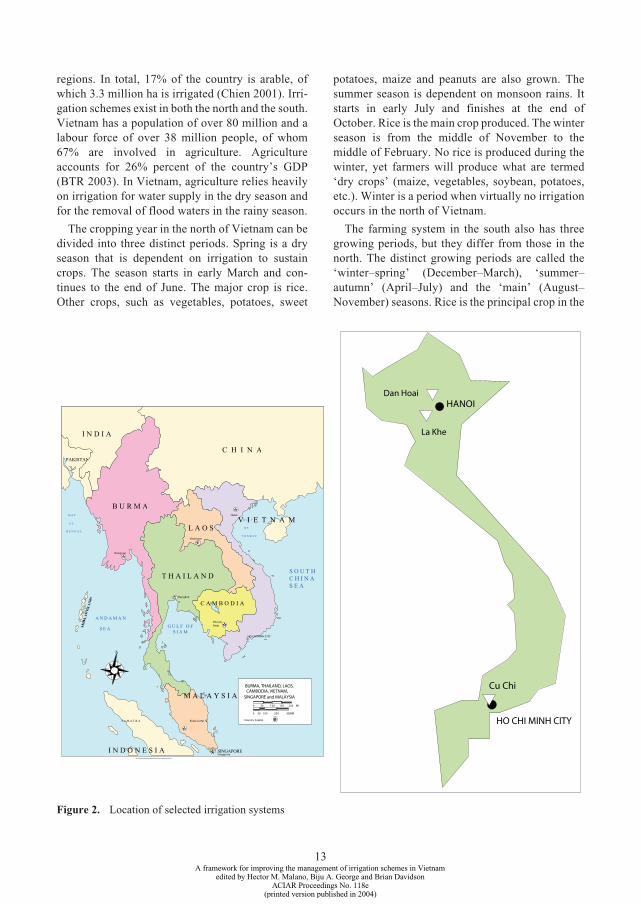
Any assessment of an irrigation scheme requiressome knowledge of the farming system withinwhich it operates. The farming system is dependenton the irrigation scheme and vice versa. In thisstudy, three irrigation schemes are assessed in orderto illustrate the concepts that are enunciated. Two ofthe schemes are in the north of Vietnam, while theother is in the south (see Figure 2). This section pre-sents details of the region under investigation, con-centrating on the irrigation schemes in question.
Vietnanese agriculture
Vietnam is a long, narrow country with a landarea of approximately 330 million km2. It stretchesfrom 8 to 22°N and has a coastline of nearly 3500km. Such north–south elongation, coupled withgreat differences in topography along a long coast-line, results in a great diversity in climate. Forinstance, tropical monsoon conditions predominatein the south, and rice is grown along river deltas,while in the north a cooler monsoon climate exists.Tree crops are grown in higher areas in the north,while rice prevails in lower regions. This diversityresults in different farming systems in different
ment of irrigation schemes in Vietnam A. George and Brian Davidsonings No. 118eblished in 2004)
PR118.fm Page 13 Thursday, September 2, 2004 1:04 PM
regions. In total, 17% of the country is arable, ofwhich 3.3 million ha is irrigated (Chien 2001). Irri-gation schemes exist in both the north and the south.Vietnam has a population of over 80 million and alabour force of over 38 million people, of whom67% are involved in agriculture. Agricultureaccounts for 26% percent of the country’s GDP(BTR 2003). In Vietnam, agriculture relies heavilyon irrigation for water supply in the dry season andfor the removal of flood waters in the rainy season.
The cropping year in the north of Vietnam can bedivided into three distinct periods. Spring is a dryseason that is dependent on irrigation to sustaincrops. The season starts in early March and con-tinues to the end of June. The major crop is rice.Other crops, such as vegetables, potatoes, sweet
A framework for improving the manageedited by Hector M. Malano, Biju
ACIAR Proceed(printed version pu
13
C H I N A
I N D I A
PAKISTAN
I N D O N E S I A
S U M A T R A
T H A I L A N D
B U R M A
L A O S
M A L A Y S I A
SINGAPORE
G U L F
O F
T O N K I N
A N D A M A N
S E A
B A Y
O F
B E N G A L
S O U T HC H I N AS E A
Singapore
PhnomPenh
Bangkok
Vientiane
Hanoi
Rangoon
Kuala Lump ur
HO CHI MINH CITY
N
Country Capital -
BURMA, THAILAND, LAOS, CAMBODIA, VIETNAM,SINGAPORE and MALAYSIA
0 50 100 150 200 MI
0 50 100 200 300KM
C A M B O D I A
V I E T N A M
G U L F O FS I A M
potatoes, maize and peanuts are also grown. Thesummer season is dependent on monsoon rains. Itstarts in early July and finishes at the end ofOctober. Rice is the main crop produced. The winterseason is from the middle of November to themiddle of February. No rice is produced during thewinter, yet farmers will produce what are termed‘dry crops’ (maize, vegetables, soybean, potatoes,etc.). Winter is a period when virtually no irrigationoccurs in the north of Vietnam.
The farming system in the south also has threegrowing periods, but they differ from those in thenorth. The distinct growing periods are called the‘winter–spring’ (December–March), ‘summer–autumn’ (April–July) and the ‘main’ (August–November) seasons. Rice is the principal crop in the
Dan Hoai
La Khe
HANOI
Cu Chi
HO CHI MINH CITY
Figure 2. Location of selected irrigation systems
ment of irrigation schemes in Vietnam A. George and Brian Davidsonings No. 118eblished in 2004)

PR118.fm Page 14 Thursday, September 2, 2004 1:04 PM
summer–autumn and main (or monsoon) seasons.During this latter season either short-growing riceor the more traditional long-growing varieties canbe planted. As in the north, a variety of crops otherthan rice can be grown during the dry season.
The role agriculture and irrigation play inVietnam is little different to that played in manyother countries. Irrigated agriculture in Vietnam isheavily concentrated in the RRD, the Mekong Deltaand the Saigon River System. The RRD supportsnearly half the country’s rice production. Irrigationsystems in the RRD rely heavily on pumping (80%of 850,000 ha) for the provision of irrigation anddrainage services. This is achieved by some 1700pumping stations and more than 7500 pump units.
The performance of these systems is disap-pointing. The high energy cost required to operatethem is a cause of great concern to their operatorsand managers. This, coupled with a shortfall in irri-gation revenues, has created severe constraints forthe sustainability of the irrigation infrastructure.While the ecological and agricultural characteristicsof the Mekong Delta and Saigon River system differfrom the RRD, they share common problems relatedto the sustainability and water management prac-tices within the irrigation systems.
Rice accounts for the bulk of the irrigation areaand water use in the country. In recent years, sincethe achievement of rice self-sufficiency, drylandcrops such as maize, peanuts, potatoes and vegeta-bles are becoming increasingly popular because oftheir higher economic value. However, there is agrowing competition for water among differentusers in the country, due to the increasing adoptionof a cropping pattern that comprises three crops peryear in the majority of the irrigation schemes, andthe growing demand for water from metropolitanareas as a result of rapid urban and industrialgrowth. Thus, agriculture’s share of water is likelyto decline in the near future. In addition, furthercrop diversification and increases in productivityrequire a more efficient delivery of irrigation anddrainage services.
The Cu Chi system
The Dau Tieng reservoir system is the largest inthe Dong Nai basin. The reservoir has an effectivelive storage of 1.1 BCM and a maximum surfacearea of 27,000 ha. The system is used to regulate theSaigon River, and supplies water to 170,000 ha of
A framework for improving the manageedited by Hector M. Malano, Biju
ACIAR Proceed(printed version pu
14
agricultural land. The reservoir also supplies limitedamounts of domestic water to Tay Ninh Provinceand Ho Chi Minh City, and provides flood controlprotection to the riparian area. Reservoir releasesare also used to regulate saline water intrusion in thelow-lying reaches of the Saigon and Vam Co Dongrivers.
The Cu Chi irrigation system is located in the EastBranch Canal of Dau Tieng Reservoir in Tay NinhProvince. The system was constructed with the aimof supplying irrigation to 12 communes covering12,000 ha in the northern part of the Cu Chi district.To date only 8500 ha have been irrigated. The maincanal is 11 km long, with a design discharge of 14m3/s. The system’s infrastructure consists of morethan 1500 concrete structures. Canal N31-A wasconstructed in 1993 to expand the irrigated area by2500 ha. Due to lack of flow-regulating structures inthe main supply canal, the current operational rulesare designed to provide a constant supply at thediversion point of the Cu Chi system, leading topotential inefficiencies when rainfall occurs.
The soils are predominantly light, with parts ofthe district affected by waterlogging and salinisa-tion as a result of large seepage losses associatedwith rice irrigation. The area receives an averageannual rainfall of 1861 mm of which 90% occurs inthe rainy season. The remaining seasons are dry,with irregular light showers only. The low rainfallduring the dry season makes irrigation indispen-sable for the cultivation of crops. Rice is the prin-cipal crop in the two main seasons: summer–autumnand main crop. During the winter–spring season,farmers grow peanuts and maize in addition to rice.Unlike the cultivation of rice, the area planted withwinter crops varies significantly from year to year.
The Dan Hoai system
The Dan Hoai system is located 25 km fromHanoi. The main canal is 23.5 km long and has threecross-regulators to control water levels. In DanHoai, 15 km of the 23.5 km long main channel havebeen rehabilitated and lined recently. The schemesupplies water to some 8000 ha of agricultural landwhere rice is the principal crop. There are two mainwater intakes into Dan Hoai’s main irrigationchannel: the Dan Hoai pumping station and the BaGiang intake sluice. The Dan Hoai pumping stationhas been in use since 1962 and the Ba Giang sluicebecame operational in 1993. The lowest design
ment of irrigation schemes in Vietnam A. George and Brian Davidsonings No. 118eblished in 2004)

PR118.fm Page 15 Thursday, September 2, 2004 1:04 PM
water level at the intake basin is +3.05 m and thehighest at the channel headwork is +9.00 m. Thepumping station in Dan Hoai consists of five lowhead pumps giving a nominal discharge of 10 m3/s.
The Ba Giang intake sluice was designed for anupstream water level of +12.70 m and a downstreamwater level at +8.90 m, giving a design discharge of12 m3/s. If the water level in the Red River (at theintake basin) is higher than +10.70 m, the pumpingstation is shut down even if there is a need for irri-gation supply. The Ba Giang culvert is opened frommainly June to September during the summer cropwhen the water level in the Red River at this culvertis above 8.9 m. Normally, the pumping station doesnot operate during this season. If the water level inthe river is very low, the pumping station is operatedsimultaneously to meet the gap in supply.
The La Khe system
The La Khe irrigation system is located 25 kmsouth of Hanoi on a spur channel between tworivers: the Nhue River, which acts as a bulk supplychannel from the Red River, and the Da River,which acts as a drain. In the system, 5600 ha are irri-gated by gravity from the main channel fed by themain pumping station, and a further 3000 ha are irri-gated by secondary pumping stations that take waterdirectly from the Nhue River. The scheme was builtin 1962 to provide drainage to 13,000 ha, allow aspring rice crop to be grown under irrigation(March–June) and supply supplemental water in therainy season (July–October). The main canal is 23km long and has four cross regulators to control
A framework for improving the manageedited by Hector M. Malano, Biju
ACIAR Proceed(printed version pu
15
water levels. The La Khe model consists of 135nodes including 1 pump, 116 offtakes, 14 measuringpoints and 4 regulators.
References
Anh, Q., Bryant, M., Davidson, B. and McGrath T. 2003.Institutional and pricing arrangements to improve wateruse efficiency and viability of publicly managedirrigation schemes in Vietnam. These proceedings.
BTR (The Business Travel Report) 2003. Country facts –Vietnam <www.thebtr.com/pages/asia/vietnam_fact_file.htm>.
Chien, N.V. 2001. Water resources management in Vietnamand the need for change in water fee policy. In: Brennan,D., ed.. Water policy reform: lessons from Asia andAustralia. Canberra, ACIAR Proceedings No. 106, 206–208.
Hofwegen, P.V and Malano, H.M. 1997. Hydraulicinfrastructure under decentralised and privatisedirrigation system management. In: Deregulation, decen-tralisation, and privatisation in irrigation. GermanAssociation for Water Resources and Land Improvement,Bulletin 20, 179–205.
James, R. 1980. Return to reason: Popper’s thoughts inpublic life. Open Books .
Malano, H.M., Chien, N.V. and Turral, H.N. 1999. Assetmanagement for irrigation and drainage infrastructure.Irrigation and Drainage Systems, 13, 109–129.
Murray-Rust, D. and Snellen, B.W. 1993. Irrigation systemperformance assessment and diagnosis. Colombo, SriLanka, International Irrigation Management Institute.
Turral, H. and Malano, H.M. 2002. Water policy in practice– a case study from Vietnam. In: Brennan, D., ed.. Waterpolicy reform: lessons from Asia and Australia. Canberra,ACIAR Proceedings No. 106, 189–205.
ment of irrigation schemes in Vietnam A. George and Brian Davidsonings No. 118eblished in 2004)
PR118.fm Page 16 Thursday, September 2, 2004 1:04 PM
Modelling and Monitoring of System Operation: Three Different Irrigation Systems in Vietnam
Biju A. George,*,1 Hector M. Malano,* Vo Khac Tri,† Nguyen Chien§ and Hugh Turral¶
Abstract
In this paper, the development of a process to diagnose and improve current operational performance of anirrigation scheme is discussed. To illustrate the technique, three different irrigation systems in Vietnam areassessed. The process involves a survey of existing infrastructure, calibration of irrigation-control structures,implementation of the operation computer model IMSOP, monitoring the existing operation, retrospectiveanalysis of the system performance, simulation of alternative operational scenarios, then the field trial ofselected scenarios chosen through a consultative process with the irrigation management companies and users.Detailed case studies in the three different irrigation systems are described.
Introduction – the Need for Assessing Performance
Large investment in irrigation infrastructure has notmet the planners’ expectations in Vietnam and othercountries. This realisation has forced policy makersand researchers to focus on improving the irrigationsystem performance at different levels. Lack offinancial resources and infrastructure are the majorobstacles to improving the performance of thesystem through physical development. A logicalalternative is to improve the systems operation andmanagement through better operational procedures
* International Technologies Centre, Department of Civiland Environmental Engineering, University ofMelbourne, Victoria 3010, Australia.
† Southern Institute for Water Resources Research, Ho Chi Minh City, Vietnam.
§ Vietnam Institute for Water Resources Research, Hanoi, Vietnam.
¶ International Water Management Institute, Colombo, Sri Lanka.
1 Corresponding author. Email: <[email protected]>.
A framework for improving the manageedited by Hector M. Malano, Biju
ACIAR Proceed(printed version p
16
and improved service delivery. Critical elements toachieve the goal of improved water management arean efficient operation of the main delivery systemand effective maintenance of irrigation anddrainage infrastructure (Schultz and Wrachien2002).
In the past decade, irrigation researchers havedeveloped and applied computer tools to plan,schedule and monitor the operation of irrigationsystems to improve their performance. Simple canaloperation models are useful in generating irrigationdemand based on evapotranspiration estimates anda realistic description of the delivery system and itscharacteristics (Turral et al. 2002). Researchershave shown the capability of simple models for gen-erating water demands at system level (George et al.2002).
In this study, the computer model IMSOP (Irriga-tion Main System OPeration) was adapted for applica-tion to three irrigation systems in Vietnam: the Cu ChiSystem in southern Vietnam and the Dan Hoai and LaKhe systems in the Red River Delta in the north of thecountry. This adaptive approach involved the model-ling of the hydraulic and crop water demand processes
ment of irrigation schemes in Vietnam A. George and Brian Davidsonings No. 118e
ublished in 2004)

PR118.fm Page 17 Thursday, September 2, 2004 1:04 PM
involved in the operation of the irrigation deliverysystem. This paper presents a description of theIMSOP model and the modelling and field trial andimplementation of improved operational rules in thesesystems. The results of the improved operation arecompared with monitoring data obtained during theimplementation process.
A Description of the Irrigation Main System Operation Model
A series of processes is involved in modelling andmonitoring an irrigation scheme. These include:• collection and collation of all available data on
the system• rating of key hydraulic control structures and
flow monitoring• computer simulation using the IMSOP model and
retrospective analysis of the operationalperformance
• simulation of alternative operational scenariosincluding rotational supply
• field trial of different operational scenarios.
A framework for improving the manageedited by Hector M. Malano, Biju
ACIAR Proceed(printed version pu
17
Meterological Data Input
Calculate Penman-Monteith ETo
Input Crop Details
Input Average Rainfall
Input Pan Evaporat
Adjust water rin real-
SimulatMonitori
Flow
Calculate Reference
Return Reference E
Input Soil Data
Input Planting Details
Calculate Crrequire
at each o
Actual Rainfall Data
Input Monitoring Data
The IMSOP model is a steady-state hydraulicmodel (Figure 1) that simulates the operation of themain and secondary canals in an irrigation system(Vlotman and Malano 1987; George et al. 2004).The IMSOP model has three sub-models, which arecombined to estimate crop evapotranspiration(ETo), the irrigation requirement, system operationand performance analysis by comparing the simu-lated results with monitoring data. The model isbased on a graphical user interface (GUI) built onVisual Basic 6. The GUI is mouse-driven, with pop-up windows, pull-down menus and button controls.The different components are described below.
Evapotranspiration models
An accurate estimation of ETo is essential fordeveloping accurate irrigation schedules. ETo is afunction of climatic conditions and can be estimatedin several ways, each depending on the availabilityof climatic data. However, the performance of dif-ferent ETo estimation methods varies. The two mostcommonly used and internationally acceptedmethods are included in the IMSOP model. The
ion
equirement time
eng
ETo
Input Hydraulic Data
To
op water mentfftake
Input Supply Factors
Input Process Order
Input Reservoir Details
SimulateMain System
Operation
Performance Indicators
Figure 1. Schematic diagram of the irrigation main system operation (IMSOP) model
ment of irrigation schemes in Vietnam A. George and Brian Davidsonings No. 118eblished in 2004)

PR118.fm Page 18 Thursday, September 2, 2004 1:04 PM
methods included are the FAO-56 Penman–Mon-teith method (Allen et al. 1998) and the FAO-24 panevaporation method (Doorenbos and Pruitt 1977). Auser can select the Penman–Monteith or Pan Evap-oration method according to the data available.
Irrigation requirements
Rice is the major crop grown in most of the irri-gation schemes in Vietnam. It has high waterdemand, and the process of cultivation and irriga-tion differs from the practices of other field crops.The model treats the calculation of an irrigationrequirement of rice and other dryland crops differ-ently.
Crop water requirements are calculated for eachofftake in the system, based on:• knowledge of the crop type• cropped area and time of planting • crop growth stage• dominant soil characteristics • an estimate of field efficiency.
The irrigation requirement is then calculated asthe sum of crop water demand, less any effectiverainfall, plus land soaking, land preparation require-ments and deep percolation. It is expressed asfollows:
whereI = irrigation requirement (mm)
η = irrigation application efficiency (%)
ETa = actual evapotranspiration (mm)
DP = deep percolation (mm)
LSR = land soaking requirement (mm)
LPR = land preparation requirement (mm)
RFeff = effective rainfall (mm)
i = time index
j = location index.
Actual evapotranspiration in equation (1)depends on the reference crop ETo and crop growthstage, and is estimated as follows:
(2)
Ii j, ETai j, DPi j, LSRi j,
LPRi j, RFeffi j,–
+ + +[
] 1ηj-----
=
(1)
ETai EToi Kci×=
A framework for improving the manageedited by Hector M. Malano, Biju
ACIAR Proceed(printed version pu
18
where
ETo = grass reference crop evapotranspiration(mm/day) calculated using the FAO-56Penman–Monteith or the FAO-24 panevaporation method
Kc = dimensionless crop coefficient which isa function of the crop type and thegrowth stage.
In saturated conditions, such as those that occur ina rice paddy, water percolates below the root zone inproportion to the saturated hydraulic conductivityof the soil and ponding depth. The calculation ofrice water requirements includes deep-percolationrequirements, which are usually categorised by soiltexture or obtained from field measurements. Fur-thermore, before transplanting the rice crop into thefield, substantial irrigation water is required for landpreparation and soaking. The depth of waterrequired for these purposes is required as an inputinto the model.
Effective rainfall is that which infiltrates into thesoil and is available for crop use. Effective rainfallis difficult to estimate because the infiltration ratechanges with time and soil conditions, and becauseof the spatial and temporal variability of rain. In thecurrent model, effective rain can be calculated byusing either the fixed-percentage or variable per-centage of rainfall method.
In the fixed percentage method, effective rainfallis calculated as:
(3)
where R = weekly rainfall (mm).
The above equation works between upper andlower bounds so that:
if then and if then
In the variable percentage method, weekly rain-falls are factored as follows:
; if (4)
; if (5)
; if (6)
; if (7)
RFeffi0.67 Ri 6–( )=
Ri 75> RFeffi75= R 10<
RFeff 0=
RFeffi0= Ri 10≤
RFeffi0.8 Ri×= 10 Ri 30≤<
RFeffi0.87 0.00235R–( ) Ri×=
30 Ri 200≤<
RFeffi0.4 Ri×= Ri 200>
ment of irrigation schemes in Vietnam A. George and Brian Davidsonings No. 118eblished in 2004)
PR118.fm Page 19 Thursday, September 2, 2004 1:04 PM
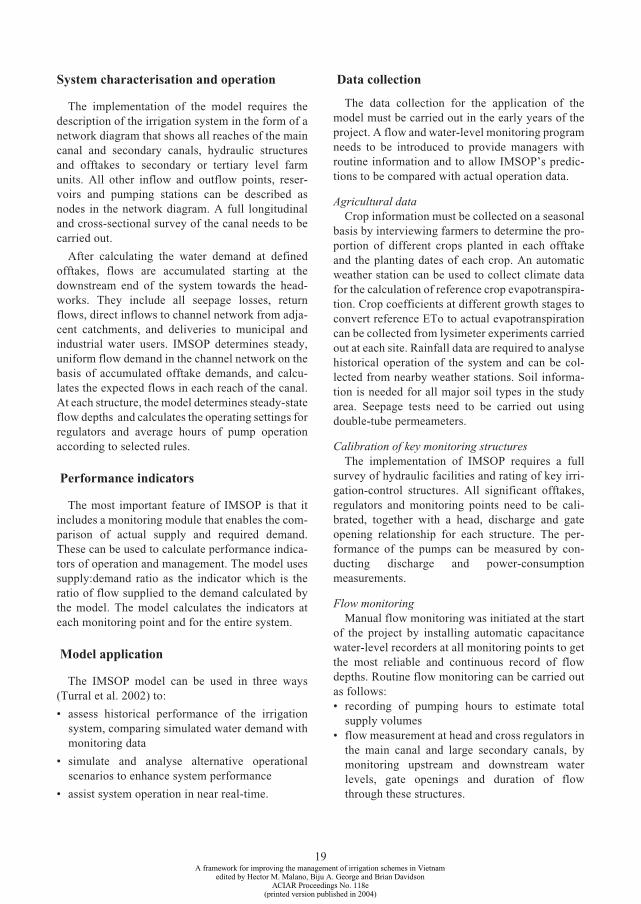
System characterisation and operation
The implementation of the model requires thedescription of the irrigation system in the form of anetwork diagram that shows all reaches of the maincanal and secondary canals, hydraulic structuresand offtakes to secondary or tertiary level farmunits. All other inflow and outflow points, reser-voirs and pumping stations can be described asnodes in the network diagram. A full longitudinaland cross-sectional survey of the canal needs to becarried out.
After calculating the water demand at definedofftakes, flows are accumulated starting at thedownstream end of the system towards the head-works. They include all seepage losses, returnflows, direct inflows to channel network from adja-cent catchments, and deliveries to municipal andindustrial water users. IMSOP determines steady,uniform flow demand in the channel network on thebasis of accumulated offtake demands, and calcu-lates the expected flows in each reach of the canal.At each structure, the model determines steady-stateflow depths and calculates the operating settings forregulators and average hours of pump operationaccording to selected rules.
Performance indicators
The most important feature of IMSOP is that itincludes a monitoring module that enables the com-parison of actual supply and required demand.These can be used to calculate performance indica-tors of operation and management. The model usessupply:demand ratio as the indicator which is theratio of flow supplied to the demand calculated bythe model. The model calculates the indicators ateach monitoring point and for the entire system.
Model application
The IMSOP model can be used in three ways(Turral et al. 2002) to:
• assess historical performance of the irrigationsystem, comparing simulated water demand withmonitoring data
• simulate and analyse alternative operationalscenarios to enhance system performance
• assist system operation in near real-time.
A framework for improving the manageedited by Hector M. Malano, Biju
ACIAR Proceed(printed version pu
19
Data collection
The data collection for the application of themodel must be carried out in the early years of theproject. A flow and water-level monitoring programneeds to be introduced to provide managers withroutine information and to allow IMSOP’s predic-tions to be compared with actual operation data.
Agricultural dataCrop information must be collected on a seasonal
basis by interviewing farmers to determine the pro-portion of different crops planted in each offtakeand the planting dates of each crop. An automaticweather station can be used to collect climate datafor the calculation of reference crop evapotranspira-tion. Crop coefficients at different growth stages toconvert reference ETo to actual evapotranspirationcan be collected from lysimeter experiments carriedout at each site. Rainfall data are required to analysehistorical operation of the system and can be col-lected from nearby weather stations. Soil informa-tion is needed for all major soil types in the studyarea. Seepage tests need to be carried out usingdouble-tube permeameters.
Calibration of key monitoring structuresThe implementation of IMSOP requires a full
survey of hydraulic facilities and rating of key irri-gation-control structures. All significant offtakes,regulators and monitoring points need to be cali-brated, together with a head, discharge and gateopening relationship for each structure. The per-formance of the pumps can be measured by con-ducting discharge and power-consumptionmeasurements.
Flow monitoringManual flow monitoring was initiated at the start
of the project by installing automatic capacitancewater-level recorders at all monitoring points to getthe most reliable and continuous record of flowdepths. Routine flow monitoring can be carried outas follows:• recording of pumping hours to estimate total
supply volumes• flow measurement at head and cross regulators in
the main canal and large secondary canals, bymonitoring upstream and downstream waterlevels, gate openings and duration of flowthrough these structures.
ment of irrigation schemes in Vietnam A. George and Brian Davidsonings No. 118eblished in 2004)
PR118.fm Page 20 Thursday, September 2, 2004 1:04 PM
Application of the Model
ACIAR Project No. 9834 was undertaken in three dif-ferent irrigation systems in Vietnam, two in the RRDand one in the Saigon River delta. Details of theseschemes are given in the previous paper. The mainaims of this project were to assess the current opera-tional performance and develop improved operationalprocedures for the irrigation supply system. The restof this paper describes the development of a processfor analysing the performance of irrigation systemsand investigating operational options that wouldenable a better provision of irrigation water serviceand enhance the productivity of the water delivered.
Case study 1 – the Cu Chi system
IMSOP modelling
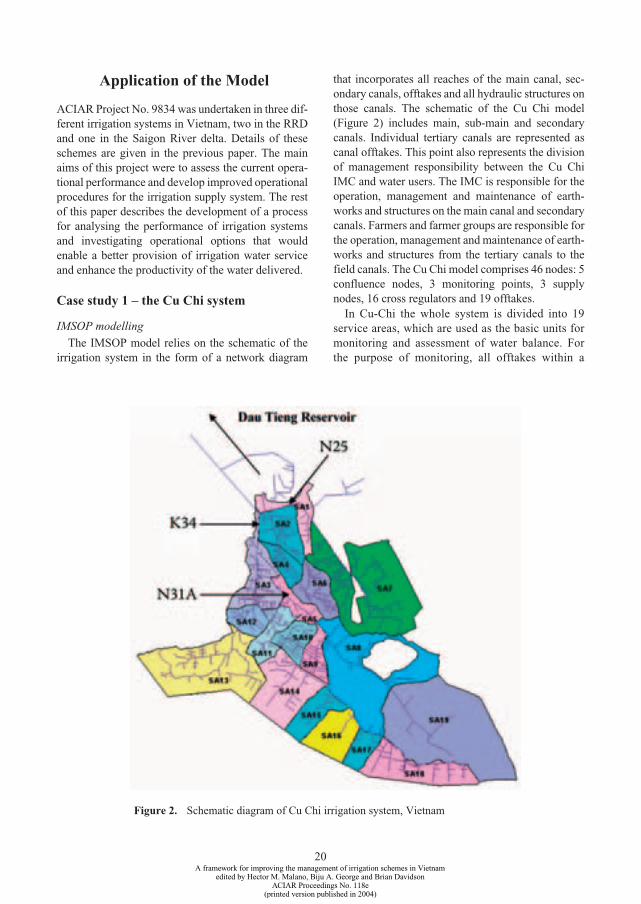
The IMSOP model relies on the schematic of theirrigation system in the form of a network diagram
A framework for improving the manageedited by Hector M. Malano, Biju
ACIAR Proceed(printed version pu
that incorporates all reaches of the main canal, sec-ondary canals, offtakes and all hydraulic structures onthose canals. The schematic of the Cu Chi model(Figure 2) includes main, sub-main and secondarycanals. Individual tertiary canals are represented ascanal offtakes. This point also represents the divisionof management responsibility between the Cu ChiIMC and water users. The IMC is responsible for theoperation, management and maintenance of earth-works and structures on the main canal and secondarycanals. Farmers and farmer groups are responsible forthe operation, management and maintenance of earth-works and structures from the tertiary canals to thefield canals. The Cu Chi model comprises 46 nodes: 5confluence nodes, 3 monitoring points, 3 supplynodes, 16 cross regulators and 19 offtakes.
In Cu-Chi the whole system is divided into 19service areas, which are used as the basic units formonitoring and assessment of water balance. Forthe purpose of monitoring, all offtakes within a
20
Figure 2. Schematic diagram of Cu Chi irrigation system, Vietnam
ment of irrigation schemes in Vietnam A. George and Brian Davidsonings No. 118eblished in 2004)

PR118.fm Page 21 Thursday, September 2, 2004 1:04 PM
service area have been combined into a syntheticofftake for each service area. The water balance isestimated for each service area by calculating thedifference between inflows into the area and out-flows leaving the area.
Analysis of past operationThe first stage of the operational improvement
process consisted of a retrospective modelling analysisof the system to assess its operational performance. Inthis process, the seasonal irrigation demand of thesystem was estimated using IMSOP for all three crop-ping seasons during 2001 and for the winter–springseason in 2002. It was compared with flow-monitoringdata to understand the shortcomings of the existingoperation.
During the winter–spring season of 2002, supplyexceeded demand by between 3% and 95% in all theservice areas. A comparison was made for 14 of the19 service areas; monitoring data were not availablefor the remaining 5. Supply was more than twice thedemand in nine service areas and in some cases itwas 3–5 times the required amount (service areas 5,10, 12, 14 and 19). The average supply during theseason was 10.5 m3/s, which resulted in an over-supply for the entire season estimated as 62 MCM.The supply:demand ratio was found to vary from1.03 to 5.9 across the system (Table 1).
Weekly average irrigation requirements were esti-mated for each service area and were also comparedwith the actual supply for all the three seasons in2001. During the winter–spring season, the supplyexceeded demand in all service areas, except 4, 14 and18. The average supply:demand ratio for the entirearea was estimated at 1.68. During the summer–autumn season, water was oversupplied to all serviceareas except for 3 and 4, and the averagesupply:demand ratio for the entire system was esti-mated at 1.89. In contrast, the amount of water sup-plied to service area 3 could meet only 46% of thedemand. The supply was less than the demand in fourservice areas (2, 4, 12 and 14) during the main crop-ping season (the monsoon). The averagesupply:demand ratio for the entire system was esti-mated at 1.72 for this season. The excess water sup-plied during the whole year was estimated at 119.5MCM. These disparate deviations between supplyand demand indicate that system operation is carriedout without consideration to crop water demand andproper canal regulation aimed at achieving supplyobjectives and equity of distribution.
A framework for improving the manageedited by Hector M. Malano, Biju
ACIAR Proceed(printed version pu
21
Modelling of alternative operational scenariosThe analysis of the system operation in Cu Chi
shows that oversupply occurs in all service areasand that the amount of oversupply varies widelyacross the system. The irrigation company couldimprove the control of the supplies to service areasto achieve the goal of reducing overall consumptionand improving supply equity among service areas.These objectives, however, can be achieved only bychanging the existing operational rules. These pri-orities guided the selection of simulation scenariosusing IMSOP. These simulation scenarios includedrotational supply, in addition to the current contin-uous supply to the entire system. In rotational watersupply, the water can be delivered to the system inseparate blocks, allowing parts of the system to beshut-down, thus simplifying the operation andachieving better system regulation with the existinghydraulic control (George et al. 2004).
Table 1. Supply:demand ratio for water, and itsvariation in different seasons, in the Cu Chiirrigation system, Vietnam
Service area
Supply:demand ratio
Winter–summer
2001
Summer–autumn
2001
Main–monsoon
2001
Winter–summer
2002
1 1.52 1.15 1.23 1.31
2 2.80 1.58 0.53 2.15
3 2.61 0.46 1.04 1.03
4 0.82 0.67 0.94 2.16
5 3.42 3.63 4.70 5.98
6 1.21 1.03 1.16 1.47
7 1.93 2.98 2.67 1.56
8 1.17 1.14 1.09 1.04
9 1.59 1.51 1.80 2.05
10 1.28 1.09 1.54 3.15
11 1.78 4.63 3.64 1.59
12 1.54 1.36 0.82 3.48
14 0.96 3.84 0.79 3.73
18 0.87 1.28 2.12 –
19 – – – 4.43
Average 1.68 1.89 1.72 2.51
Coefficient of variation
0.43 0.65 0.66 0.57
ment of irrigation schemes in Vietnam A. George and Brian Davidsonings No. 118eblished in 2004)

PR118.fm Page 22 Thursday, September 2, 2004 1:04 PM
Project staff held extensive discussions with IMCstaff and other stakeholders, including farmergroups, about the various options for changing theoperation of the system in order to improve per-formance. The capacity constraints of the maincanal to meet the peak water requirement duringland soaking restricted the use of long-term rota-tional options. Moreover, fish farms located in dif-ferent parts of the system restricted the length ofoff-time in any part of the system under a rotationalsupply arrangement. As a result, three different sce-narios were selected, simulated by IMSOP and fieldevaluated. The selected scenarios were:• continuous flow irrigation• irrigating 2-block on 4-day rotation• irrigating 2-block on 7-day rotation.
In order to simulate the second and third sce-narios, the whole system was divided into twozones: Zone I consisting of service areas 1, 2, 4, 6and 7 and Zone II of service areas 3, 5, 8, 9, 10, 11,12, 13 14, 15, 16, 17, 18 and 19. Zones I and II are2413 and 4692 ha, respectively.Continuous flow. Irrigation requirements were simu-lated for all 19 service areas together with the flowrequired at each regulator based on the averageweather and crop conditions for the winter–springseason 2003. Gate openings at each cross regulatorwere then determined by using the previously cali-brated discharge–depth–gate-opening relationships.The irrigation requirement exceeded the presentsupply level of 11 m3/s for short periods at the begin-ning of the season during land preparation andplanting, and towards the middle of the floweringstage, but it was sufficient to irrigate the wholesystem during the rest of the season. The averageflow requirement for the entire season was estimatedas 8.6 m3/s. The irrigation requirement is high in thewinter–spring season compared with the other twobecause of the low rainfall during this season.
Rotational supply. Under a 2-block, 4-day rotationalschedule, each zone is irrigated on a 2-day rotationschedule so that irrigation of the whole system canbe completed in 4 days. Here a supply ratio (SR) oftwo was used for each zone, given that water is sup-plied on 2 of 4 days in the irrigation cycle. The irri-gation requirement exceeded 11 m3/s for 33 dayswhen Zone II is irrigated. It exceeded 12 m3/s foronly one or two days during the peak period andnever exceeded 13.8 m3/s (maximum availability).The average requirement is estimated as 8.4 m3/s.
A framework for improving the manageedited by Hector M. Malano, Biju
ACIAR Proceed(printed version pu
22
Under the 2-block, 7-day rotation schedule case,Zone I is irrigated for 3 days (SR = 2.33) and ZoneII for 4 days (SR = 1.75). The requirement oftenexceeded 11 m3/s for a few days in the soaking stageand mid stage of the season and while it was alwaysbelow the maximum flow entitlement of 13.8 m3/s,it exceeded 12 m3/s towards the end of the season.The average requirement for the season is estimatedas 8.6 m3/s. This schedule was found to be morepractical from the operator’s point of view.
Field trial of alternative operational scenarios
Two of the simulated scenarios were tested in thefield during the first week of January 2003 to assesstheir actual performance. The scenarios tested in thefield consisted of irrigating the entire system usingcontinuous flow and a rotational operation with a 2-block, 4-day schedule.
Continuous flow. The irrigation requirements weredetermined for each service area with a range ofassumed tertiary efficiencies. Gate settings at eachregulator were determined using the structure dis-charge ratings derived earlier in the project. Flowdata were monitored and collected at measuring sta-tions four times a day (0800h, 1000h, 1300h and1500h) during the entire trial period. Gate openingswere adjusted twice a day, based on the head differ-ence at each gate. Current meter measurements werealso made at selected locations to verify canal flows.The analysis of field data shows a more equitable dis-tribution of water in the system compared with pre-intervention performance. The supply:demand ratiofor the whole system was reduced to an average of1.20, varying between 0.89 and 1.52 (Table 2).
Rotational supply. Because the trial had to be con-ducted during the irrigation season without disruptingthe existing operation, the section of the systemselected for the trial had to run seamlessly with therest of the system. To satisfy this objective, the trial ofrotational operation was carried out on a subsection ofthe system delineated by canal N25 that can be oper-ated independently from the rest of the system. Theservice area was divided into two blocks to whichwater was supplied on a 4-day rotational schedule.Block 1 comprised service areas 2, 4 and 6, and Block2 service area 7. An average supply:demand ratio of1.18 was achieved during the trial. The coefficient ofvariation of supply:demand ratio between differentservice areas was found to be 13% for continuoussupply and 5% for rotational operation. This outcome
ment of irrigation schemes in Vietnam A. George and Brian Davidsonings No. 118eblished in 2004)

PR118.fm Page 23 Thursday, September 2, 2004 1:04 PM
represents a substantial improvement on the existingsupply:demand ratios. The variability in supply toservice areas was found to be significantly less thanthat observed in the 2001 and 2002 monitoring sea-sons. The trial was particularly useful in convincingIMC staff and other stakeholders that it is possible toimprove the distribution of water by making simplechanges to the existing operational rules.
Water allocation and demandAnalysis was carried out to estimate the volume of
water and the level of security with which the IMCcan reallocate additional water to Ho Chi Minh City(HCMC) for industrial and urban use. A preliminaryanalysis of rainfall data was first carried out to deter-mine water demand by the Cu Chi system at variouslevels of security. The probability of rain was ana-lysed by conducting a frequency analysis of theannual data series. Based on the analysis, the annual
Table 2. Supply:demand ratio for water during a fieldtrial of alternative supply scenarios in the CuChi irrigation system, Vietnam
Service area Supply:demand ratio
Continuous flow Rotational supply
1 1.15 –
2 1.18 1.21
3 1.12 –
4 1.09 1.13
5 1.30 1.10
6 1.52 1.26
7 0.89 –
10 1.33 –
11 1.31 –
12 1.13 –
13 0.92 –
14 1.30 –
16 1.32 –
17 1.27 –
18 1.23 –
Average 1.20 1.18
Coefficient ofvariation
0.13 0.05
A framework for improving the manageedited by Hector M. Malano, Biju
ACIAR Proceed(printed version pu
23
rainfall expected at 90, 85 and 75% of probability ofoccurrence was calculated as 1622, 1654 and 1716mm, respectively. Irrigation demands were then cal-culated using IMSOP in order to ascertain the level ofsecurity with which the system can meet irrigationdemand and delivery of additional water to HCMCbased on the current level of water allocation.
The analysis is conducted under the assumptionsthat the IMC has a water entitlement from the DauTieng reservoir system that is assured regardless ofthe availability of water in the system and theoverall supply of water for Cu Chi irrigation must bemaintained at the present level. According to theexisting contract, the Cu Chi system is entitled to asupply of 13.8 m3/s at the inlet of the system. His-torically, however, the average flow at the head reg-ulator has ranged between 8 and 8.5 m3/s.Therefore, in order to include a range of possiblewater availability scenarios, the analysis is carriedout for four flow-availability conditions at the inlet:8, 11, 12 and 13.8 m3/s.
Currently, the IMC is considering supplying150,000 m3/day of water to meet the demand fromHCMC through canal N31A. To determine the effectof this volume of water reallocation to Ho Chi MinhCity, the volume of water remaining after satisfyingirrigation requirements at various levels of probabilitywas calculated, as shown in Table 3. From the anal-ysis, it can be observed that, at 90% probability ofrainfall occurring, the company will be able to supply1.34 times more water than the proposed 150,000 m3/day, assuming flow availability at the head of thesystem of 8 m3/s. The company will be able to supply4.7 times the amount supplied at present if it canobtain an inflow of 13.8 m3/s. At 75% probability ofrain, the company will be able to provide 1.53, 3.27,3.84 and 4.88 times the proposed supply at 8, 11, 12and 13.8 m3/s of inflow rate, respectively.
Table 3. Increase in surplus water at different inflowconditions in the Cu Chi irrigation system,Vietnam
Probability of occurrence
(%)
Water available after irrigation supply at various levels of supply security
8 m3/s 11 m3/s 12 m3/s 13.8 m3/s
90 1.34 3.08 3.65 4.69
85 1.46 3.19 3.77 4.81
75 1.53 3.27 3.84 4.88
ment of irrigation schemes in Vietnam A. George and Brian Davidsonings No. 118eblished in 2004)
PR118.fm Page 24 Thursday, September 2, 2004 1:04 PM
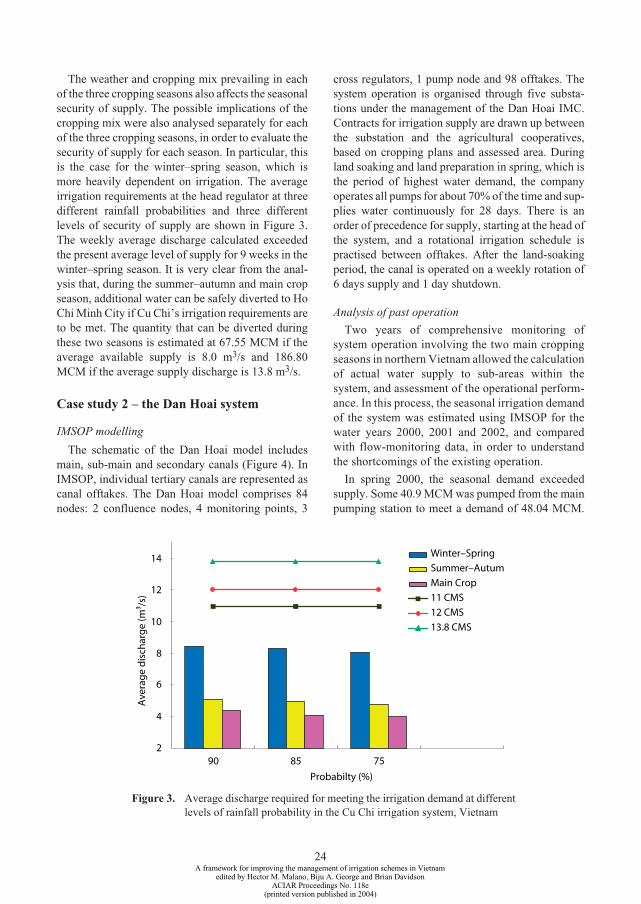
The weather and cropping mix prevailing in eachof the three cropping seasons also affects the seasonalsecurity of supply. The possible implications of thecropping mix were also analysed separately for eachof the three cropping seasons, in order to evaluate thesecurity of supply for each season. In particular, thisis the case for the winter–spring season, which ismore heavily dependent on irrigation. The averageirrigation requirements at the head regulator at threedifferent rainfall probabilities and three differentlevels of security of supply are shown in Figure 3.The weekly average discharge calculated exceededthe present average level of supply for 9 weeks in thewinter–spring season. It is very clear from the anal-ysis that, during the summer–autumn and main cropseason, additional water can be safely diverted to HoChi Minh City if Cu Chi’s irrigation requirements areto be met. The quantity that can be diverted duringthese two seasons is estimated at 67.55 MCM if theaverage available supply is 8.0 m3/s and 186.80MCM if the average supply discharge is 13.8 m3/s.
Case study 2 – the Dan Hoai system
IMSOP modelling
The schematic of the Dan Hoai model includesmain, sub-main and secondary canals (Figure 4). InIMSOP, individual tertiary canals are represented ascanal offtakes. The Dan Hoai model comprises 84nodes: 2 confluence nodes, 4 monitoring points, 3
A framework for improving the manageedited by Hector M. Malano, Biju
ACIAR Proceed(printed version pu
24
2
4
6
8
10
12
14
90 85
Pro
Ave
rage
dis
char
ge (m
³/s)
cross regulators, 1 pump node and 98 offtakes. Thesystem operation is organised through five substa-tions under the management of the Dan Hoai IMC.Contracts for irrigation supply are drawn up betweenthe substation and the agricultural cooperatives,based on cropping plans and assessed area. Duringland soaking and land preparation in spring, which isthe period of highest water demand, the companyoperates all pumps for about 70% of the time and sup-plies water continuously for 28 days. There is anorder of precedence for supply, starting at the head ofthe system, and a rotational irrigation schedule ispractised between offtakes. After the land-soakingperiod, the canal is operated on a weekly rotation of6 days supply and 1 day shutdown.
Analysis of past operation
Two years of comprehensive monitoring ofsystem operation involving the two main croppingseasons in northern Vietnam allowed the calculationof actual water supply to sub-areas within thesystem, and assessment of the operational perform-ance. In this process, the seasonal irrigation demandof the system was estimated using IMSOP for thewater years 2000, 2001 and 2002, and comparedwith flow-monitoring data, in order to understandthe shortcomings of the existing operation.
In spring 2000, the seasonal demand exceededsupply. Some 40.9 MCM was pumped from the mainpumping station to meet a demand of 48.04 MCM.
75
babilty (%)
Winter–SpringSummer–AutumMain Crop11 CMS12 CMS13.8 CMS
Figure 3. Average discharge required for meeting the irrigation demand at differentlevels of rainfall probability in the Cu Chi irrigation system, Vietnam
ment of irrigation schemes in Vietnam A. George and Brian Davidsonings No. 118eblished in 2004)

PR118.fm Page 25 Thursday, September 2, 2004 1:04 PM
The supply:demand ratio at the Minh Khai cross-reg-ulator and secondary canals N1 and N11 shows thatthe whole system is undersupplied (Table 4). Inspring 2001, the quantity supplied from the pumpingstation exceeded the demand, but the supply wasfound to be less than demand in all the monitoringpoints except for the N2 canal. This analysis estab-lished that there were significant shortcomings in theoperation of the system. The supply–demand anal-ysis for the spring 2002 season shows that the wholesystem is undersupplied, with a supply:demand ratiothat varied between 0.76 and 0.96.
Pumping Station
Ba Giang N1
N11
N13
N19
Minh Khai
Song Phuong
Da Khuy
Figure 4. Schematic diagram of the Dan Hoaiirrigation system, Vietnam
A framework for improving the manageedited by Hector M. Malano, Biju
ACIAR Proceed(printed version pu
25
The comparison of supply and demand during theautumn season in 2000 and 2001 shows that there isconsistent oversupply in the N2 secondary canal,which is located close to the Ba Giang sluice. Thecoefficient of variation between supply:demandratios was estimated as 0.31 and 0.35, respectively,during these two years, significantly higher than forother seasons which relied less on water suppliedfrom the pumping station.
The results of retrospective operational analysisin Dan Hoai suggest a consistent undersupply ofwater in the system. The overall distribution in thesystem is also very uneven, with some canals beingoversupplied and some canals undersupplied. Theinequity in distribution can be traced to problemswith the hydraulic infrastructure, such as channelcapacity, bank height, a number of illegal offtakesin the main and secondary canals, and malfunc-tioning of tertiary offtake gates. Moreover, thecapacity of key cross-regulators is insufficient topass peak demand flows to the downstream sectionsof the system.
Modelling of alternative operational scenariosAlternative operational rules were simulated
using IMSOP, with the aim of improving equity ofsupply to meet the level of crop water demand.Project staff held extensive discussions with IMCstaff, research staff and other stakeholders,including farmers groups, to explore options forchanging the operation of the system in order toimprove its performance. Based on these discus-sions, three different scenarios were simulated andanalysed using the model:• continuous-flow irrigation in the entire system• irrigating 2-block 4-day rotation (2B–4D)• irrigating 2-block 7-day rotation (2B–7D).
Table 4. Comparison of supply:demand ratio in 2000, 2001 and 2002 at different points in the Dan Hoai irrigationsystem, Vietnam
No. Monitoring location Spring 2000 Autumn 2000 Spring 2001 Autumn 2001 Spring 2002
1 Pumping station 0.85 – 1.09 – 0.76
2 N2 0.86 1.44 1.23 1.41 –
3 Minh Khai 0.79 1.03 0.93 0.71 0.84
4 N1 0.79 0.70 0.76 0.77 0.96
5 N11 0.93 0.90 0.83 0.80 0.81
Average 0.84 1.02 0.97 0.92 0.84
Coefficient of variation 0.07 0.31 0.20 0.35 0.11
ment of irrigation schemes in Vietnam A. George and Brian Davidsonings No. 118eblished in 2004)

PR118.fm Page 26 Thursday, September 2, 2004 1:04 PM
The service area was divided into two operationalzones. Zone I comprises the upper half of the irrigationsystem from the pumping station to the Minh Khaicross-regulator, and Zone II the area from Minh Khaito the end of the main channel. Various combinationsof continuous flow and operational zones (2B–4D and2B–7D) were investigated over a range of assumedtertiary efficiencies. Under a 2B–4D rotationalschedule, each zone is irrigated for two days so thatirrigation of the whole system can be fully supplied infour days. Here, a supply ratio (SR) of two was usedfor each zone, given that water is supplied for two daysin a four-day irrigation cycle. After calculating the irri-gation requirement for each service area, the flowrequired at each regulator was estimated and the gateopening at each cross-regulator was then determinedfrom previously calibrated discharge–depth–gate-opening relationships.
The modelling results revealed the following:1. The capacity of the main canal is not sufficient to
meet the peak requirement during land prepa-ration and towards the flowering period if thewhole system is irrigated continuously. Underthis scenario, the water level at the Minh Kaicross-regulator should be kept at 8.65 to 8.8 m toirrigate the upper zone, causing inequity of waterdistribution in zone II due to insufficient head.
2. When the Minh Khai regulator is closed to raisethe water level upstream, most of the offtakes atlow elevation should be closed to provide suffi-cient head to raise the water level upstream.However, many of the offtake structuresupstream of the regulator cannot be shut downdue to poor condition.
3. Insufficient capacity of the main canal and majorsecondaries like N1 and N11 to meet the peakflow requirement restricted the adoption of anyrotational schedule (2B–4D, 2B–7D).
4. The difference between actual pumping capacityand design pumping capacity is estimated as 35to 45%, which indicates that the pumps do nothave the capacity to supply sufficient water toadopt any long-term rotational schedule.The capacity constraints of the main canal to meet
the peak water requirement restricted the use oflong-term rotational options. The modelling resultsalso revealed shortcomings in the design criteriaused in the recent upgrade of the main canal.Capacity constraints and inadequate hydrauliccontrol severely reduce the ability to improve thelevel of service provided to irrigators.
A framework for improving the manageedited by Hector M. Malano, Biju
ACIAR Proceed(printed version pu
26
Field trial of alternative operational scenariosCurrently, the system is operated on a rotational
schedule, with the main canal running continuouslyfor six days a week, with the supply rotated to thesecondary canals and offtakes. After discussionswith IMC staff and given the constraints imposed bythe system hydraulic infrastructure, it was decidedto select a single scenario for field testing. This con-sisted of irrigating according to the IMSOP-mod-elled operation based on the existing operationalrules. The selected rules were field-trialled in thespring season (March 2003).
The IMSOP water requirements were determinedfor each offtake, at a range of assumed tertiary effi-ciencies. Based on this, the pumping requirementswere estimated. An operation schedule was pre-pared for one week. This consisted of running themain canal continuously and rotating the secondarycanals and offtakes. The schedule was prepared byconsidering the size and elevation of the offtakes.Flow data were monitored and collected at flow-measuring stations three times a day (0700h, 1100h,and 1700h) during the entire trial period. Gate open-ings were adjusted twice a day according to the headdifference at each gate. The analysis of field datashows a more equitable distribution of water in thesystem. Supply satisfied the demand at all moni-toring points with a supply:demand ratio rangingfrom 1.03 to 1.58 (Table 5). The trial convinced theIMC staff of the advantages of monitoring the actualflow throughout canals and adjusting the gates toirrigate so as to meet the crop water demand.
Table 5. Supply:demand ratio at different locationsduring field trial of alternative supplyscenarios in the Dan Hoai irrigation system,Vietnam
Monitoring station Supply:demand ratio
Pumping station 1.18
N1 1.13
N2 1.28
N5 1.30
N7 1.36
N9 1.12
N13 1.03
N15 1.58
Average 1.24
Coefficient of variation 0.13
ment of irrigation schemes in Vietnam A. George and Brian Davidsonings No. 118eblished in 2004)
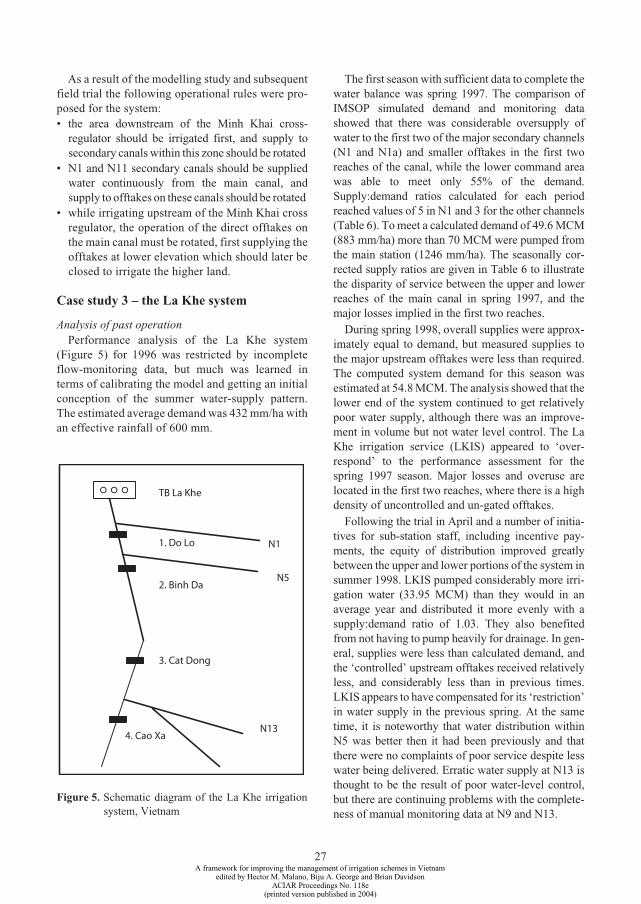
PR118.fm Page 27 Thursday, September 2, 2004 1:04 PM
As a result of the modelling study and subsequentfield trial the following operational rules were pro-posed for the system: • the area downstream of the Minh Khai cross-
regulator should be irrigated first, and supply tosecondary canals within this zone should be rotated
• N1 and N11 secondary canals should be suppliedwater continuously from the main canal, andsupply to offtakes on these canals should be rotated
• while irrigating upstream of the Minh Khai crossregulator, the operation of the direct offtakes onthe main canal must be rotated, first supplying theofftakes at lower elevation which should later beclosed to irrigate the higher land.
Case study 3 – the La Khe system
Analysis of past operationPerformance analysis of the La Khe system
(Figure 5) for 1996 was restricted by incompleteflow-monitoring data, but much was learned interms of calibrating the model and getting an initialconception of the summer water-supply pattern.The estimated average demand was 432 mm/ha withan effective rainfall of 600 mm.
N1
N5
1. Do Lo
2. Binh Da
3. Cat Dong
4. Cao XaN13
TB La Khe
Figure 5. Schematic diagram of the La Khe irrigationsystem, Vietnam
A framework for improving the manageedited by Hector M. Malano, Biju
ACIAR Proceed(printed version pu
27
The first season with sufficient data to complete thewater balance was spring 1997. The comparison ofIMSOP simulated demand and monitoring datashowed that there was considerable oversupply ofwater to the first two of the major secondary channels(N1 and N1a) and smaller offtakes in the first tworeaches of the canal, while the lower command areawas able to meet only 55% of the demand.Supply:demand ratios calculated for each periodreached values of 5 in N1 and 3 for the other channels(Table 6). To meet a calculated demand of 49.6 MCM(883 mm/ha) more than 70 MCM were pumped fromthe main station (1246 mm/ha). The seasonally cor-rected supply ratios are given in Table 6 to illustratethe disparity of service between the upper and lowerreaches of the main canal in spring 1997, and themajor losses implied in the first two reaches.
During spring 1998, overall supplies were approx-imately equal to demand, but measured supplies tothe major upstream offtakes were less than required.The computed system demand for this season wasestimated at 54.8 MCM. The analysis showed that thelower end of the system continued to get relativelypoor water supply, although there was an improve-ment in volume but not water level control. The LaKhe irrigation service (LKIS) appeared to ‘over-respond’ to the performance assessment for thespring 1997 season. Major losses and overuse arelocated in the first two reaches, where there is a highdensity of uncontrolled and un-gated offtakes.
Following the trial in April and a number of initia-tives for sub-station staff, including incentive pay-ments, the equity of distribution improved greatlybetween the upper and lower portions of the system insummer 1998. LKIS pumped considerably more irri-gation water (33.95 MCM) than they would in anaverage year and distributed it more evenly with asupply:demand ratio of 1.03. They also benefitedfrom not having to pump heavily for drainage. In gen-eral, supplies were less than calculated demand, andthe ‘controlled’ upstream offtakes received relativelyless, and considerably less than in previous times.LKIS appears to have compensated for its ‘restriction’in water supply in the previous spring. At the sametime, it is noteworthy that water distribution withinN5 was better then it had been previously and thatthere were no complaints of poor service despite lesswater being delivered. Erratic water supply at N13 isthought to be the result of poor water-level control,but there are continuing problems with the complete-ness of manual monitoring data at N9 and N13.
ment of irrigation schemes in Vietnam A. George and Brian Davidsonings No. 118eblished in 2004)

PR118.fm Page 28 Thursday, September 2, 2004 1:04 PM
Modelling of alternative operational scenariosRotation was investigated for spring rice cultiva-
tion, using long-term average weather and rainfallconditions. Promising scenarios were re-examinedusing more extreme wet and dry conditions, toobtain some idea of the sensitivity of capacity con-straints (Turral et al. 2002).
Various combinations of ‘blocks’ (2–4) and ‘on-time’ (1–7 days) were investigated, over a range ofassumed tertiary efficiencies (60–80%). In sum-mary, the findings were as follows:• Peak water requirements at land-soaking under
all scenarios exceeded the capacity of the majorsecondary channels (N1, N1a, N3, and N5).
• Peak water requirements at land-soakingfrequently exceeded the channel capacity in thesecond reach of the main canal and sometimes inthe third reach. The capacity of the second cross-regulator at Binh Da was also insufficient.
• Peak water requirements in the late season (atflowering time) can be accommodated under a 2
Table 6. Supply:demand ratio for water, and itsvariation in different seasons, in the La Kheirrigation system, Vietnam
Service area Supply:demand ratio
Spring1997
Spring1998
Summer1998
Whole system 1.42 0.91 0.98
N1 1.52 0.62 0.96
Reach 2 – – 0.81
N1a 2.19 0.63 0.46a
N3 1.02 0.66 0.80
N5 1.02 0.66 0.80
Lower CA (Reach 3 +) 0.58 0.66 0.79
N5b – 0.98 0.93
N9 – 0.31a –
Reach 4 – 0.61 0.66
N13 – 0.15a 0.34a
Reach 5 – 0.57 0.78
N13a – – 0.96
N13b – 0.57 0.64
N15a – 0.50 0.93
N15b – 0.36 0.56
Average 1.29 0.58 0.76
Coefficient of variation 0.39 0.35 0.24
a = missing data
A framework for improving the manageedited by Hector M. Malano, Biju
ACIAR Proceed(printed version pu
28
block, 4+4 day rotation, except in extremely dryyears when demand may exceed regulatorcapacity at Binh Da and Cao Xa.Vietnam Institute for Water Resources Research
(VIWRR) staff proposed an alternative scenariowhich overcomes the problems of limited capacityin the secondary canals: supply the larger canalscontinuously while rotating the smaller ones (whichhave relatively larger capacities). Thus, the mainchannel operated on continuous flow during theentire operation period. These scenarios were mod-elled on 4, 5 and 7 day on-times, with the two groupsof offtakes and with the system in continuous oper-ation. No system constraints were observed duringeither the land-soaking period or late season. How-ever, the existing capacity constraint in reach 2 andthrough Binh Da regulator still applies.
When the canal was operated in an 8 days on–8days off, with a 4+4 rotation of water delivery, thecapacity of the system was tested at the third cross-regulator, Cat Dong. Since there is a probability ofrain in the off periods, the constraint may not even-tuate. Nevertheless, if the operation cycle stretchesout to 12 days shut down followed by 12 days (6+6)rotational supply, then the second and third cross-regulators both limit supply to 15–25% less than thecomputed requirement.
Field trial of alternative operational scenariosA trial rotational operation was organised at the
end of the spring rice season in 1998, from 25 Aprilto 5 May. The service area was divided into twoblocks for operation. Block 1 comprised the upperhalf of the irrigation system, from the pumpingstation to the second cross-regulator at Binh Da.Block 2 covered the area from Binh Da to the end ofthe main channel.
Block 2 was supplied with water first, with someadditional supply to the large secondary channels inBlock 1 (N1, N1a, N3 and N5), in order to overcomethe capacity constraints observed in these channelsunder full rotation. Each block received water for 5days. LKIS and VIWRR staff took control of theoperation of the major secondary channels in thesystem, but were unable to fully control the smallersecondary offtakes.
The average calculated water demand for the 10-day trial period, calculated by IMSOP (assumingthat all planting dates and soil-type descriptions arecorrect, and that average tertiary offtake efficiencyis 80%), was 1194.4 m3/ha (Table 7).
ment of irrigation schemes in Vietnam A. George and Brian Davidsonings No. 118eblished in 2004)

PR118.fm Page 29 Thursday, September 2, 2004 1:04 PM
During the field trial, water elevations at the endof the canal were recorded at 5.03 m above mean sealevel (amsl). The design value is 4.8 m amsl withcommonly observed values of less than 4.5 m.
The results of the field trial revealed that:• supplying water to the downstream reaches first
ensured a more equitable supply• the distribution of water between the upper and
lower half of the system was very uneven over thewhole season
• during the field trial, Blocks 1 and 2 anddownstream secondary canals almost satisfied thewater demand
• there are many uncontrolled secondary offtakesand their water usage is very high
• average water use is skewed by a high level oflosses in the first two reaches, both throughleakage and through uncontrolled offtake.
Conclusions
In this paper, a package of operational improve-ments designed to enhance the performance of pub-licly managed irrigation schemes is presented. Thepackage includes a GPS-based survey of existing
A framework for improving the manageedited by Hector M. Malano, Biju
ACIAR Proceed(printed version pu
29
infrastructure, calibration of irrigation-controlstructures, the implementation of the operationalmodel to simulate the operation, retrospectiveanalysis of the system operation, monitoring of theexisting operation and field-trial of alternative oper-ational rules. A steady-state operation model calledIrrigation Main System OPeration (IMSOP) wasadapted to model the system operation. The packagewas applied in three irrigation systems in Vietnamto improve the technical operation of the irrigationdelivery system.
In Cu Chi, the retrospective analysis showed thatthe supply:demand ratios varied between 1.68 and2.51 for the entire system and between 3 and 5between individual service areas under the pre-inter-vention operation rules. These disparate deviationsbetween supply and demand, indicate that the systemoperation is carried out without consideration of theactual crop water demand and proper canal regulationto achieve supply equity. Two new scenarios based oncontinuous flow and rotational supply were selected,simulated, analysed and tested in the field. Theanalysis of the field data yielded an averagesupply:demand ratio of 1.20 for continuous flow and1.17 for rotational operation. A comprehensive
Table 7. Comparison of seasonal and field trial water distribution (m3/ha) throughout theLa Khe irrigation system, Vietnam, spring 1998.
Location/reach Whole season Field trial
Demand(m3/ha)
Percentage of total supply
Demand(m3/ha)
Supply(m3/ha)
Percentage of demand
Average of system 7920 100 1194.4 1462 122
Reach 1 11196 141 1252 2046 163
Reach 2 8741 110 1234 1735 141
Reach 3 6901 87 1271 943 74
Reach 4 5253 66 1275 997 68
Reach 5 7028 89 1335 1359 78
N1 7461 94 1093 1101 101
N1A 4843 61 944 803 85
N3 6432 81 1076 864 80
N5 6184 78 1093 936 87
N5B 6594 83 1093 1004 92
N13A 6928 87 1350 901 67
N13B 5392 68 1274 1023 80
N15A 3993 50 1274 1167 92
N15B 3091 39 1274 1012 79
ment of irrigation schemes in Vietnam A. George and Brian Davidsonings No. 118eblished in 2004)
PR118.fm Page 30 Thursday, September 2, 2004 1:04 PM
analysis of water reallocation to Ho Chi Minh City forurban and industrial purposes, and its effect on thesecurity of supply on the Cu Chi system, showed that,at 90% of probability of rainfall occurrence, the IMCwill be able to supply three times more than the pro-posed 150,000 m3/day assuming a flow availability of11 m3/s at the head of the system.
In Dan Hoai, the retrospective analysis showedlarge deviations between supply and demand, with aconsistent undersupply of water in the system. Theoverall supply:demand ratio varied between 0.79and 0.93 in spring 2000, 0.76 and 1.23 in spring2001 and 0.76 and 0.96 during spring 2002. Thestudy also revealed that the highly inequitable dis-tribution can be traced to inadequate channelcapacity and hydraulic control, the large number ofillegal offtakes in the main and secondary canals,and malfunctioning of tertiary offtake gates. Basedon the discussion with IMC staff, a single scenarioconsisting of IMSOP-scheduled flows following theexisting operation rules was selected and field-tri-alled in the 2003 spring season. The analysis of thefield data shows a more equitable distribution ofwater in the system, with an average supply:demandratio of 1.24.
At La Khe, the supply–demand analysis showedwide variations between supply and demand, withoversupply in some instances exceeding 400% ofcrop water requirement. A 2-block 10-day rota-tional scenario was simulated, analysed and testedin the field. The field trial showed that rotationalschedules yielded significant improvements in thelevel of equity among users throughout the system.The relative water supply was much more evenbetween Blocks 1 and 2, and the downstream sec-ondary canals almost satisfied demand.
The following important lessons have beenlearned for the future applications of the process tosystems other than the three case studies:
• Early establishment of flow monitoring is veryimportant in providing sufficient and timelyinformation on system and managementperformance. The establishment of automaticflow-monitoring devices eases the process butthey need careful calibration and maintenance.
• There is a need to develop an improvedmechanism for planning and coordinating thecrop area development at the offtake level andtransferring the information to the IMC at thestart of the season for the demand calculation.
A framework for improving the manageedited by Hector M. Malano, Biju
ACIAR Proceed(printed version pu
30
• Establishment of effective flow control in bothmain and secondary channels is of majorimportance. Clear rules and procedures for thebest operation of existing regulators and offtakesneed to be developed and agreed early in theprocess.
• The application of the model needs adequatedescription of the irrigation system in the form ofa network. Extensive survey is required for thisprocess and can be speeded-up by application ofmodern technology such as GPS.
• Key participation from the stakeholders isessential for successful implementation of themodel, and IMC staff must therefore be trained indata collection and model implementation at theearliest possible stage.
• Developing clear and simple operationalscenarios can reduce very large water losses andthe negative environmental impacts of over-irrigation. But this needs better understanding ofthe system regulations and constraints, andconsultation with the farmers’ groups is essential.
References
Allen, R.G., Pereira, L.S., Raes, D. and Smith, M. 1998.Crop evapotranspiration –guidelines for computing cropwater requirements. Rome, Italy, FAO Irrigation andDrainage Paper, No. 56.
Doorenbos, J. and Pruitt, W.O. 1977. Guidelines forpredicting crop water requirements. Rome, Italy, FAOIrrigation and Drainage Paper, No. 24.
George, B.A., Raghuwanshi, N.S. and Singh, R. 2002.Development and testing of a regional scale irrigation-scheduling model. Proceedings of internationalconference on advances in civil engineering, IndianInstitute of Technology, Kharagpur, India.
George, B.A., Malano, H.M., Tri, V.K. and Turral, H. 2004.Using modelling to improve operational performance inthe Cu Chi irrigation system, Vietnam. Irrigation andDrainage, 53, 237–249.
Schultz, B. and De Wrachien, D. 2002. Irrigation anddrainage systems research and development in the 21stCentury. Irrigation and Drainage, 51, 311–327.
Turral, H., Malano, H.M. and Chien, N.V. 2002.Development and specification of a service agreementand operational rules for La Khe irrigation system, HaDong, Vietnam. Irrigation and Drainage, 51, 129–140.
Vlotman, W.F. and Malano, H.M. 1987. Micro-computersteady state modelling of irrigation delivery systems.Logan, Utah State University, Department ofAgricultural and Irrigation Engineering, InternationalIrrigation Center.
ment of irrigation schemes in Vietnam A. George and Brian Davidsonings No. 118eblished in 2004)

PR118.fm Page 31 Thursday, September 2, 2004 1:04 PM
Operational and Resource-Use Performance in the Cu Chi Irrigation System
Ngo Dang Phong,* To Phuc Tuong,†,1 Nguyen van Dam,§ Le Truong Tho,§ Biju A. George,* Nguyen van Dang¶ and Hugh Turral‡
Abstract
Understanding why measuring and calculating water-use performance is important can best be undertaken withreference to an example. To that end, an exercise in water-use performance was undertaken on a site in the CuChi irrigation system. The choice of a site is explained, along with the tasks and calculations needed to completethe exercise. The results obtained in this analysis can readily be compared with those obtained from a widerassessment of farmers in the irrigation scheme. Rice productivity per unit area and per unit irrigation water islower than in other Vietnamese systems and significantly lower than in other Asian countries. However, theproductivity of maize and peanuts is similar to average yields in other Vietnamese systems. The waterproductivity of maize and peanuts was found to be very high compared with rice. Output of irrigation water inthe winter–spring crop was US$0.04/m3 for rice, US$0.15/m3 for maize and US$0.11/m3 for peanuts.
Background and Objectives
Efficiency gains and improvements are not onlyachieved by having a reliable supply of water pro-vided by a well-managed entity. They can also berealised by users finding better ways of employingthe water they currently receive. For people usingwater, a reasonable adage to follow may well be thatproducing more from either the same quantity ofwater, or less water, will result in an improvementin efficiency. In order to invoke this adage, an
* International Technologies Centre, Department of Civiland Environmental Engineering, University ofMelbourne, Victoria 3010, Australia.
† International Rice Research Institute, Los Baños, Philippines.
§ Cu Chi Irrigation Company, Ho Chi Minh City, Vietnam.¶ University of Polytechnic and Technology, Ho Chi Minh
City, Vietnam.‡ International Water Management Institute, Colombo, Sri
Lanka.1 Corresponding author. Email: <[email protected]>.
A framework for improving the manageedited by Hector M. Malano, Biju
ACIAR Proceed(printed version p
3
analyst must have some idea of the current rate ofwater-use efficiency. Once this rate is known, it canbe compared with other research on water-use effi-ciency to work out the degree of inefficiency that isevident, if any, before improved flows are recom-mended. The purpose in this paper is to outline amethod of assessing the degree of water-use effi-ciency and to apply it to a specific site.
This method was applied to a site within the Cu Chiirrigation scheme between 2001 and 2003. Both landand water productivity were assessed. Quite simply,the ability of the irrigation system to turn land andwater resources into marketable product wasassessed. In addition, the adequacy of irrigation andwater supply (including rainfall) to meet crop waterrequirements was gauged. The main irrigation canalsupplying water to the study site was lined in the 2002monsoon season. As a consequence, the effect oflining on the canal performance was also evaluated.The methodology used, the main findings and theirimplications for management improvement are pre-sented in the following sections.
ment of irrigation schemes in Vietnam A. George and Brian Davidsonings No. 118e
ublished in 2004)
1

PR118.fm Page 32 Thursday, September 2, 2004 1:04 PM
Method
The procedure for assessing water-use performanceinvolves selecting a suitable site within an irrigationscheme. The site is then segregated into differentcomponents and the amount of water supplied toeach segment, by both irrigation and rainfall, ismeasured. Within each segment, the activities offarmers, the areas planted and yields are monitored.From this base, the water balance and performanceindicators can be calculated.
Site selection
It is not possible to assess the performance of awhole irrigation scheme continuously. While thecost of doing so would outweigh the benefits, thereis no necessity to do so. What is required is to selecta portion of the scheme that can be reliablyassessed. It must not be too large and yet must, insome sense, be representative of the whole scheme.In particular, it must be possible to measure theamount of water entering and leaving the site. Theanalysis must be conducted over a sufficiently long
edited by Hector M. Malano, BijuACIAR Proceed
(printed version pu
N43_6_
T43_6_6
6_34T
N4
N43-6-2
T43_6_4
Irrigation flumeDrainage flumeCulvert
N43_6_
period to capture changing climatic conditions. Thisis usually one crop year. If the intention is to inves-tigate how some improvement may benefit water-use efficiency (say by canal lining), then it may benecessary to observe a longer period of water use;one before the improvement and one after it.
The study in Cu Chi was carried out from August2001 to August 2003 at an area serviced by irrigationcanal N43-6 and drainage canal T43-6 of the irrigationscheme (Figure 1). The area of the site selected wasapproximately 55 ha, of which 49 ha were arable. Thecropping calendar of the study site consisted mainly ofthree seasons: winter–spring from December toMarch; summer–autumn from April to July; and themonsoon season from August to November. Farmersgrew maize and peanuts in relatively elevated land andrice in relatively low land in the winter–spring season,whereas in summer–autumn and monsoon, farmersgrew only rice. (For more details on the seasons in thesouth of Vietnam, see Malano et al. (2004)).
Irrigation and drainage canals within the studysite divided it into three sub-areas: • micro site 1, irrigated by branch canal N43-6-2
and drained to T43-6-4
6
Dot NguaRoad
N43_6
3-6-8
National Highway 22
Micro site 1
Mesosite 1
Meso site 2
IM
I₂
I₃
I₄
I₁
4
A framework for improving the management of irrigation schemes in Vietnam32
Figure 1. Schematic layout of the study area in the in the Cu Chi irrigation system, Vietnam
A. George and Brian Davidsonings No. 118eblished in 2004)

PR118.fm Page 33 Thursday, September 2, 2004 1:04 PM
• micro site 2, irrigated by branch canal N43-6-4and drained to T43-6-6
• micro site 3, irrigated by branch canal N43-6-6and N43-6-8 and drained to T43-6.N denotes canals supplying water, and T drains
emptying the scheme.Micro sites 1 and 2 were generally at a higher ele-
vation than micro site 3. Within micro site 3, landwas higher along the irrigation canals of N43-6-6and N43-6-8, while the middle of the site was lower,creating a wide, stagnated zone in the middle.
As will be explained in later in this paper, it isnecessary at certain stages to combine some sites inorder to compute the water balance. Micro sites 1and 2 can be placed into what is termed ‘meso’ site1, while all three micro sites can be collapsed intomeso site 2. Such groupings do not violate theunderlying basis of the analysis.
Monitoring water and climatic parameters
It is important to measure the water entering andleaving the site and how it is distributed to eachmicro site within the site. This is achieved usinglong throat flumes (Tony et al. 2000). These flumeswere installed at the inlet of each irrigation canal(N43-6-2, N43-6-4, N43-6-6 and N43-6-8) and atthree locations along the drainage canal T43-6(downstream of T43-6-4, at T43-6-6 and at the endof T43-6). Thus, it is possible to measure the dis-charge of the irrigation intake to, and drainage from,each micro site (Figure 1). The upstream waterdepth was recorded automatically at 30-minuteintervals using water level probes to calculate thedischarge through the flumes. The total irrigationand drainage water of any period is calculated byintegrating the discharge over the measured time.
In order to accurately measure water use, it is nec-essary to account for:• seepage loss, which is the amount of water that is
lost in the canals themselves• the water that is in the soil• any changes in climate.
A measuring flume (IM in Figure 1) was installedin the main canal (N43-6) to assess seepage loss,which is calculated as the difference between thedischarge at IM and the sum of discharges at meas-uring flumes I2, I3 and I4 (see Figure 1). Ground-water-table tubes and percolation rings wereinstalled at five points diagonally along the studysite to assess the amount of water in the ground.
A framework for improving the manageedited by Hector M. Malano, Biju
ACIAR Proceed(printed version pu
33
They were monitored twice weekly during the studyperiod. Daily weather data (rainfall, temperature,relative humidity, radiation, wind speed) wererecorded at an automatic weather station, which wasinstalled 3 km from the study site.
Monitoring farming activities, planted area and crop yields
Water is an input into the crop productionprocess. To assess performance, it is necessary toevaluate the amount produced. Of interest is theyield, or the output per unit of area. A higher yieldfor a given quantity of water used can be construedto mean that performance has improved. As wateruse is not the only way of improving performance ina dynamic farming system, it is essential to observethe practices used to produce output. Again, it isnecessary to select representative activities from thealmost unlimited range available.
Using a land-parcel map, crop yields wereassessed by conducting farm surveys of 22 of 39randomly selected farmers at the end of each crop-ping season. Within the surveyed farms, crops werecut and monitored on 5 m2 on 4 to 10 randomlyselected rice fields, after each rice-growing season.In addition, 6 to 8 fields with upland crops weremonitored in the winter–spring growing season.The data from the survey and the crop cuts wereused to calculate the average crop yields.
Computation of water balance components
The ‘water accounting’ procedures proposed byMolden et al. (1998) were carried out for each crop-ping season, for each micro site. Quite simply, theseprocedures account for where the water goes in thesystem. It is important to assess whether ‘reuse’occurs during this process. The water accounting foreach site can be calculated using equation (1). Allterms in equation (1) are expressed in millimetres(mm) of water, over the area of interest.
(1)
where: I = irrigation water
RF = rainfall
ETcrop = evapotranspiration from the croppedarea
ETfallow = evapotranspiration from the non-cropped area
I RF+( ) ETcrop ETfallow+( )–D DP+( )– Outun– ∆S=
ment of irrigation schemes in Vietnam A. George and Brian Davidsonings No. 118eblished in 2004)

PR118.fm Page 34 Thursday, September 2, 2004 1:04 PM
D = drainage
DP = percolation
Outun = other unaccounted outflows tosurrounding areas (e.g. seepage fromcanals, lateral water movement fromthe study site to surrounding fields.)
∆S = change in water storage in the site.
The water-balance components were calculatedfor the composite sites comprising micro sites 1 and2 (meso site 1) and micro sites 1, 2 and 3 (that ismeso site 2) (Phong 2002; Tuong 2002).
The ETcrop was calculated from weather datausing the Penman–Monteith equation (Allen et al.1998) for the crop under study. To evaluate equation(1), it was necessary to make several assumptions.These were as follows:• In the winter–spring season, most of the fallowed
land was dried. To account for this, a daily rate ofETfallow was needed, and was assumed to beequal to half of the daily rate of ETcrop forpeanuts.
• In the monsoon and summer–autumn seasons,most of the fallowed land was flooded and coveredwith aquatic weeds. As a consequence, the changein water storage in the site (∆S) was assumed to bezero. It was also assumed that ETfallow was thesame as ET for rice.
• At the start of the winter–spring season, a fieldoften has water in the soil at a capacity necessaryfor growing upland crops (i.e. a 1–3-cm-deepwater layer for rice transplanting). Thus, at thistime the change in water storage in the site (∆S)was assumed equal to 50 mm, to take into accountfor the amount of water required for saturation inthe soil.
• At the time of harvest of the crop in winter–spring, there is usually no standing water and thesoil is rather dry. Thus, the change in waterstorage in the site (∆S) was assumed to be equal to–50 mm.
• The only term in equation (1) that could not bemeasured or computed is outun. Thus, this termwas assumed to be a residual that is used to closeequation (1).
Computation of performance indicators
While performance can be measured in manyways, the usual method is to calculate the amount
A framework for improving the manageedited by Hector M. Malano, Biju
ACIAR Proceed(printed version pu
34
produced (output) from a given unit of input. Theunit of input in most economic or agronomic studiesis by area. However, in a hydrological study such asthis, it is perhaps more relevant to use some quantityof water as the unit of input. Marsh et al. (2004)provide an interesting comparison on the choice ofthe input unit. In that paper, a unit of land is pre-ferred over water, as that is the standard practice ingross margins analysis.
In this study, output was measured in terms ofcrop yield per unit of either: cropped area;command area; water consumed; irrigation water;or water supply (irrigation + rainfall). Within anarea, there can be many crops grown (e.g. rice,maize, peanuts etc.). Thus, the ‘yield’ can beassessed for each specific crop over its area (i.e. kgof rice/ha), which can in turn be converted to thevalue of outputs per unit cropped area ($/ha) by:
In some cases, the cropped area is not as large asthe expected or the planned ‘command’ or‘designed’ area. Thus, it is important also to indicatethe value of the product per unit command area:
where i = crop type
n = number of crops
A = crop area (ha)
Y = crop yield (kg/ha)
P = crop price ($/kg)
CA = command area.
For more details on these procedures see Moldenet al. (1998).
The relative water supply (hereinafter calledRWS) was computed as the ratio of the total watersupply to crop demand:
(4)
YiAiPii 1=
n
∑
Aii 1=
n
∑-------------------------=
Output per unit cropped area ($/ha)
(2)
YiAiPii 1=
n
∑CA
-------------------------=Output per unit command area ($/ha)
(3)
RWS I RF+ETcrop DP+-------------------------------=
men A.ingbli
t of irrigation schemes in Vietnam George and Brian Davidsons No. 118eshed in 2004)
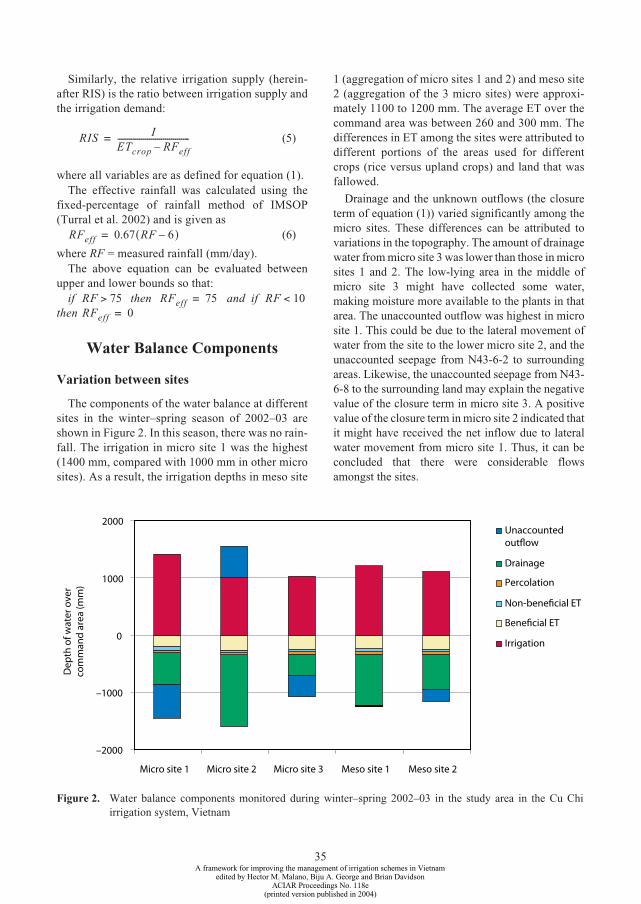
PR118.fm Page 35 Thursday, September 2, 2004 1:04 PM
Similarly, the relative irrigation supply (herein-after RIS) is the ratio between irrigation supply andthe irrigation demand:
(5)
where all variables are as defined for equation (1).The effective rainfall was calculated using the
fixed-percentage of rainfall method of IMSOP(Turral et al. 2002) and is given as
(6)
where RF = measured rainfall (mm/day).The above equation can be evaluated between
upper and lower bounds so that:if then and if
then
Water Balance Components
Variation between sites
The components of the water balance at differentsites in the winter–spring season of 2002–03 areshown in Figure 2. In this season, there was no rain-fall. The irrigation in micro site 1 was the highest(1400 mm, compared with 1000 mm in other microsites). As a result, the irrigation depths in meso site
RIS IETcrop RFeff–------------------------------------=
RFeff 0.67 RF 6–( )=
RF 75> RFeff 75= RF 10<RFeff 0=
A framework for improving the manageedited by Hector M. Malano, Biju
ACIAR Proceed(printed version pu
–2000
–1000
0
1000
2000
Micro site 1 Micro site 2 Micro site 3
Dep
th o
f wat
er o
ver
com
man
d ar
ea (m
m)
1 (aggregation of micro sites 1 and 2) and meso site2 (aggregation of the 3 micro sites) were approxi-mately 1100 to 1200 mm. The average ET over thecommand area was between 260 and 300 mm. Thedifferences in ET among the sites were attributed todifferent portions of the areas used for differentcrops (rice versus upland crops) and land that wasfallowed.
Drainage and the unknown outflows (the closureterm of equation (1)) varied significantly among themicro sites. These differences can be attributed tovariations in the topography. The amount of drainagewater from micro site 3 was lower than those in microsites 1 and 2. The low-lying area in the middle ofmicro site 3 might have collected some water,making moisture more available to the plants in thatarea. The unaccounted outflow was highest in microsite 1. This could be due to the lateral movement ofwater from the site to the lower micro site 2, and theunaccounted seepage from N43-6-2 to surroundingareas. Likewise, the unaccounted seepage from N43-6-8 to the surrounding land may explain the negativevalue of the closure term in micro site 3. A positivevalue of the closure term in micro site 2 indicated thatit might have received the net inflow due to lateralwater movement from micro site 1. Thus, it can beconcluded that there were considerable flowsamongst the sites.
Meso site 1 Meso site 2
Unaccountedoutflow
Drainage
Percolation
Non-beneficial ET
Beneficial ET
Irrigation
35
Figure 2. Water balance components monitored during winter–spring 2002–03 in the study area in the Cu Chiirrigation system, Vietnam
ment of irrigation schemes in Vietnam A. George and Brian Davidsonings No. 118eblished in 2004)

PR118.fm Page 36 Thursday, September 2, 2004 1:04 PM
Variation across seasons
The variation of water balance components in themonitored seasons is shown in Figure 3. The irriga-tion depths were higher in the winter–spring seasonthan in the other seasons. This could be due to thelower evaporative demand and greater rainfall thatoccurs in the monsoon and summer–autumn sea-sons. Low irrigation depths in the monsoon seasonof 2002 were possibly due to the closure of irriga-tion facilities for canal lining operations. Thisanomaly should not be reflected in any changes inirrigation canal management. Irrigation amounts inthe winter–spring season of 2002–03 were higherthan that in the corresponding season of 2001–02.This might reflect the better conveyancing capacityof the canals after lining.
Relatively high drainage values, especially in themonsoon and summer–autumn cropping seasons,could be due to the fact that water supply was far inexcess of water demand. In the winter–spring seasonof 2002–03, higher irrigation amounts led to higherlevels of drainage than those recorded in the winter–spring season of 2001–02. The unaccounted waterflow was only a small part of the total water input.
A framework for improving the manageedited by Hector M. Malano, Biju
ACIAR Proceed(printed version pu
36
–2500
–1500
–500
500
1500
2500
WS 01-02 WS 02-03 SA 02
Dep
th o
f wat
er o
ver
com
man
d ar
ea (m
m)
Such a result is a good indicator of the accuracy of themeasurement and its subsequent computation.
Effect of canal lining: seepage from main canal
The seepage loss in sections of N43-6 along thestudy site is presented in Table 1. Before the canal waslined in the winter–spring season of 2002, seepageloss in the main canal of N43-6 was measured at ahigh of 10–11 m3/day/m length of canal, or 3.9 m3/day/m2 canal wetted area. After lining, seepage perday per metre length and per unit of wetted area, fellby 33%. Thus, it could be argued that lining waseffective in reducing seepage from the canal. Thistranslated into a reduction in canal seepage loss com-puted over the service area from about 8 mm/day to 5mm/day. This was higher than percolation, which wasmeasured at 2 mm/day, and crop evapotranspiration,which was found to be 4–5 mm/day. Thus, it can beconcluded that the water loss along the canal fromseepage was a major component of water loss in thestudy area and could be considered to be a major con-tributor to the amount of drainage water leaving thescheme (see Figures 2 and 3).
Monsoon 01 Monsoon 02
Unaccountedoutflow
Drainage
Percolation
Non-beneficial ET
Beneficial ET
Irrigation
Rain
Figure 3. Water balance components monitored during different cropping seasons in the study area in the Cu Chiirrigation system, Vietnam
ment of irrigation schemes in Vietnam A. George and Brian Davidsonings No. 118eblished in 2004)
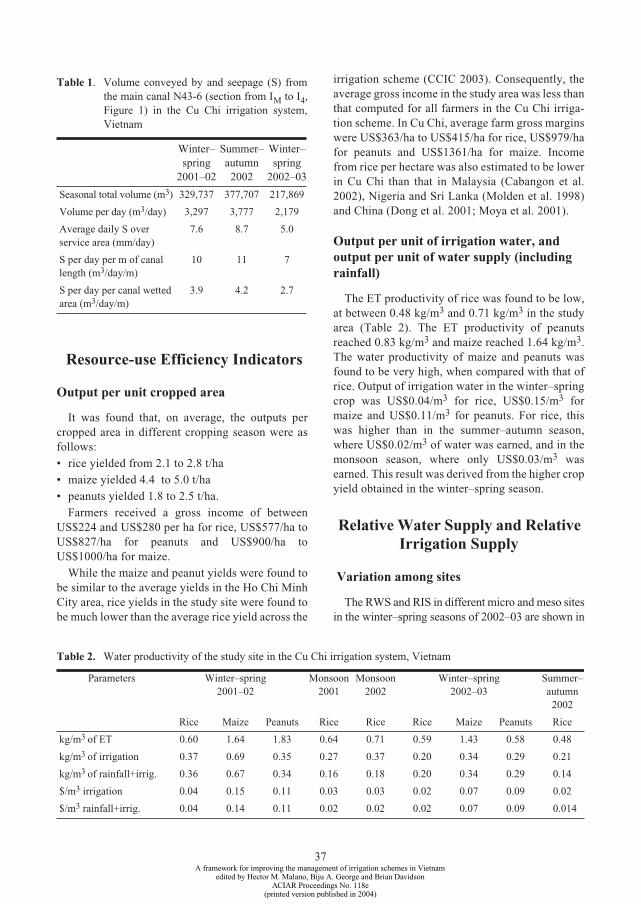
PR118.fm Page 37 Thursday, September 2, 2004 1:04 PM
Resource-use Efficiency Indicators
Output per unit cropped area
It was found that, on average, the outputs percropped area in different cropping season were asfollows:• rice yielded from 2.1 to 2.8 t/ha• maize yielded 4.4 to 5.0 t/ha• peanuts yielded 1.8 to 2.5 t/ha.
Farmers received a gross income of betweenUS$224 and US$280 per ha for rice, US$577/ha toUS$827/ha for peanuts and US$900/ha toUS$1000/ha for maize.
While the maize and peanut yields were found tobe similar to the average yields in the Ho Chi MinhCity area, rice yields in the study site were found tobe much lower than the average rice yield across the
Table 1. Volume conveyed by and seepage (S) fromthe main canal N43-6 (section from IM to I4,Figure 1) in the Cu Chi irrigation system,Vietnam
Winter–spring
2001–02
Summer–autumn
2002
Winter–spring
2002–03
Seasonal total volume (m3) 329,737 377,707 217,869
Volume per day (m3/day) 3,297 3,777 2,179
Average daily S over service area (mm/day)
7.6 8.7 5.0
S per day per m of canal length (m3/day/m)
10 11 7
S per day per canal wetted area (m3/day/m)
3.9 4.2 2.7
A framework for improving the manageedited by Hector M. Malano, Biju
ACIAR Proceed(printed version pu
37
irrigation scheme (CCIC 2003). Consequently, theaverage gross income in the study area was less thanthat computed for all farmers in the Cu Chi irriga-tion scheme. In Cu Chi, average farm gross marginswere US$363/ha to US$415/ha for rice, US$979/hafor peanuts and US$1361/ha for maize. Incomefrom rice per hectare was also estimated to be lowerin Cu Chi than that in Malaysia (Cabangon et al.2002), Nigeria and Sri Lanka (Molden et al. 1998)and China (Dong et al. 2001; Moya et al. 2001).
Output per unit of irrigation water, and output per unit of water supply (including rainfall)
The ET productivity of rice was found to be low,at between 0.48 kg/m3 and 0.71 kg/m3 in the studyarea (Table 2). The ET productivity of peanutsreached 0.83 kg/m3 and maize reached 1.64 kg/m3.The water productivity of maize and peanuts wasfound to be very high, when compared with that ofrice. Output of irrigation water in the winter–springcrop was US$0.04/m3 for rice, US$0.15/m3 formaize and US$0.11/m3 for peanuts. For rice, thiswas higher than in the summer–autumn season,where US$0.02/m3 of water was earned, and in themonsoon season, where only US$0.03/m3 wasearned. This result was derived from the higher cropyield obtained in the winter–spring season.
Relative Water Supply and Relative Irrigation Supply
Variation among sites
The RWS and RIS in different micro and meso sitesin the winter–spring seasons of 2002–03 are shown in
Table 2. Water productivity of the study site in the Cu Chi irrigation system, Vietnam
Parameters Winter–spring2001–02
Monsoon2001
Monsoon2002
Winter–spring2002–03
Summer–autumn
2002
Rice Maize Peanuts Rice Rice Rice Maize Peanuts Rice
kg/m3 of ET 0.60 1.64 1.83 0.64 0.71 0.59 1.43 0.58 0.48
kg/m3 of irrigation 0.37 0.69 0.35 0.27 0.37 0.20 0.34 0.29 0.21
kg/m3 of rainfall+irrig. 0.36 0.67 0.34 0.16 0.18 0.20 0.34 0.29 0.14
$/m3 irrigation 0.04 0.15 0.11 0.03 0.03 0.02 0.07 0.09 0.02
$/m3 rainfall+irrig. 0.04 0.14 0.11 0.02 0.02 0.02 0.07 0.09 0.014
ment of irrigation schemes in Vietnam A. George and Brian Davidsonings No. 118eblished in 2004)

PR118.fm Page 38 Thursday, September 2, 2004 1:04 PM
Figure 4. The two performance indicators had thesame value because there was no rainfall during thatseason. It can be inferred that the amount of water sup-plied was 2.4–3.4 times higher than required. TheRWS and RIS values were higher at micro site 1 thanat micro sites 2 and 3. They were also higher in mesosite 1 than in meso site 2. This was probably due to thehigher elevation of micro site 1.
Variation across seasons
The variation in RWS and RIS of meso site 2during the monitored seasons is shown in Figure 5.The RWS ranged from 1.6 to 3.1, and the RIS wasfrom 1.5 to 9.5. The RWS and RIS were particularlyhigh in the monsoon season of 2001 (at 3.3 and 9.5,respectively). This was because, despite very highrainfall (710 mm), low ET and irrigation waterrequirements, the system maintained a very highirrigation discharge. The RWS and RIS were nothigh in the monsoon season of 2002, because theirrigation system was shut down for canal lining,and because a low rainfall was recorded. In all sea-sons, the RWS and RIS were greater than 1, whichis indicative that the water supply far exceeded theevapotranspiration rate. Thus, it can be concluded
A framework for improving the manageedited by Hector M. Malano, Biju
ACIAR Proceed(printed version pu
38
0.0
1.0
2.0
3.0
4.0
MicroSite 1 MicroSite 2 Mic
Re
that the irrigation supply far exceeded irrigationdemand. In other words, there was large amount ofexcess water during the study period.
The RWS and RIS in the winter–spring season of2002–03 were higher than those of the corre-sponding season of 2001–02; that is, excess water inthe winter–spring season of 2002–03 was more thanin the winter–spring season of 2001–02. Thisoccurred when the seepage from the irrigation canalin the winter–spring season of 2002–03 was lessthan in the winter–spring season of 2001–02. Thiscould be due to canal lining (see Table 1). Thereduced seepage loss from the canal has not beentranslated into better water control in the sub-system under investigation.
The excess of irrigation water compared with croprequirement can be seen again in Figure 6. Waterintake in N43-6-4 on many days was two or threetimes higher than the daily ET during the dry seasonof the winter–spring season of 2002–03. The inade-quate service of the control structures (due to loss ordamage of the control gates) and poor field water-management practices (e.g. uncontrolled flooding)could have caused irrigation water wastage andlowered the crop water productivity considerably.
roSite 3 Meso Site 1 Meso Site 2
l. Water Supply Rel. Irri. Supply
Figure 4. Relative water supply and relative irrigation supply estimated acrossdifferent scales in the study area in the Cu Chi irrigation system, Vietnam
ment of irrigation schemes in Vietnam A. George and Brian Davidsonings No. 118eblished in 2004)

0.0
1.0
2.0
3.0
4.0
5.0
6.0
7.0
WS 01-02 WS 02-03 SA 02 Monsoon 01 Monsoon 02
RWS RIS
100
0
200
300
400
18/12 27/12 05/01 14/01 23/01 01/02 10/02 19/02 28/02 09/03 18/03 27/03
W, E
Tc (m
³/ha
)
W ETc
PR118.fm Page 39 Thursday, September 2, 2004 1:04 PM
A framework for improving the manageedited by Hector M. Malano, Biju
ACIAR Proceed(printed version pu
39
Figure 5. Relative water supply (RWS) and relative irrigation supply (RIS)estimated for different cropping seasons in the study area in the Cu Chiirrigation system, Vietnam
Figure 6. Irrigation delivery from N43-6-4(l) and evapotranspiration during winter–spring 2002–03 in the study area in the Cu Chi irrigation system, Vietnam
ment of irrigation schemes in Vietnam A. George and Brian Davidsonings No. 118eblished in 2004)

PR118.fm Page 40 Thursday, September 2, 2004 1:04 PM
Conclusions
In this study, the process of assessing resource-useperformance from measurements of water-balancecomponents within the Cu Chi irrigation system isdescribed. The physical output per unit of croppedarea and per unit water consumed (ET) for maizeand peanuts were comparable to those in other partsof Asia, while for rice they were much lower. Themain reason for a low ET water productivity of ricewas its low yield.
The economic output per unit of water supplied tothe study area was lower than comparable irrigationsystems in Asia. Rice productivity per unit area andper unit irrigation water was found to be lower thanin other Vietnamese systems, while the productivityof maize and peanuts is similar to average yields inother Vietnamese systems. Water productivity ofmaize and peanuts was found to be very high, espe-cially compared with rice. Output of irrigation waterin the winter–spring crop was US$0.04/m3 for rice,US$0.15/m3 for maize and US0.11/m3 for peanuts.
The high values for the RWS and RIS indicate thatthere was no water shortage in the study site. Further,it can be concluded that the water supplied throughirrigation could be much reduced, without affectingcrop yield. This implies that reducing the amount ofirrigation could therefore increase the output per unitof water supplied (through irrigation) considerably.Another way to increase the economic output per unitof area or per unit of water supplied is to replace ricegrowing with peanut and maize production. Thisoption is, however, contrained by a very high ground-water table in the study area. Reducing the watersupply could reduce seepage losses from the canaland therefore reduce the groundwater table. Furtherimprovements could be made to the groundwatertable, especially if shallow wells are used to replacethe irrigated supplies of water. Diversion of waterfrom agricultural uses towards higher value usage,will not only increase the output per unit water sup-plied, but also will help reduce the flooding/submer-gence problems that limit the cultivation of high-value upland crops in the area, especially in the low-lying areas of micro site 3.
Lining canals reduced seepage losses and increasedthe conveyance capacity of the main canal. But it didnot increase the output per unit of water supplied orirrigation application efficiency. To capitalise on theimprovements made to the main canal, it is necessaryto couple them with other improvements, such as
A framework for improving the manageedited by Hector M. Malano, Biju
ACIAR Proceed(printed version pu
40
better sluice-gate management in the main canal andthe rebuilding of intake gates from branch irrigationcanals. Such actions may allow better matching ofwater supply to the demand at each micro site.
References
Allen, R.G., Pereira, L.S., Raes, D. and Smith, M. 1998.Crop evapotranspiration: guidelines for computing cropwater requirements. Rome, FAO Irrigation and DrainagePaper No. 56.
Cabangon, R.J., Tuong, T.P. and Abdullah N.B. 2002.Comparing water input and water productivity oftransplanted and direct-seeded rice production systems.Agricultural Water Management, 57, 11–31.
CCIC (Cu Chi Irrigation Company). 2003. Annual report onCu Chi water irrigation 2002–2003.
Dong, B., Loeve, R., Li, Y.H., Chen, C.D., Deng, L. andMolden, D. 2001, Water productivity in Zhanghe irrigationsystem: issues of scale. In: Barker, R., Loeve, R., Li, Y.H.and Tuong, T.P., ed. 2001. Water-saving irrigation for rice.Proceedings of an international workshop held in Wuhan,China, 13–25 March 2001. Colombo, Sri Lanka,International Water Management Institute, 97–116.
Malano, H., George, B. and Davidson, B. 2004. Aframework for improving the management of irrigationschemes in Vietnam: an overview. These proceedings.
Marsh, S., Davidson, B., Le Quang Anh and Trinh Thi Long2004. Assessing the impacts of water flows on users: agross margins analysis of farms. These proceedings.
Molden, D., Sakthivadivel, R., Perry, C.J., de Fraiture, C.and Kloezen, W.H 1998. Indicators for comparingperformance of irrigated agricultural systems. Colombo,Sri Lanka, International Water Management Institute,IWMI Research Report 20, 26p.
Moya, P., Hong, L., Dawe, D. and Li, Y.H. 2001. Comparativeassessment of on-farm water saving irigation techniques inthe Zhanghe irrigation system. In: Barker, R., Loeve, .R, Li,Y.H. and Tuong, T.P., ed. 2001. Water-saving irrigation forrice. Proceedings of an international workshop held inWuhan, China, 13–25 March 2001. Colombo, Sri Lanka,International Water Management Institute,81 – 96
Phong, N.D. 2002. Operational performance experiments inCu Chi. Canberra, ACIAR Project Report LWR 9834.
Tony, L.W., Clemmens, A.J., Replogle, J.A. and Bos, M.G.2000. WINFLUME —windows based software for thedesign of long throaded measuring flumes. FourthNational Irrigation Symposium, Arizona, USA.
Tuong, T.P. 2002. Operational performance experiments inCu Chi. Canberra, ACIAR Project Report LWR 9834.
Turral, H., Malano, H.M. and Chien, N.V. 2002.Development and specification of a service agreementand operational rules for La Khe irrigation system, HaDong, Vietnam. Irrigation and Drainage, 51(2), 129–140.
ment of irrigation schemes in Vietnam A. George and Brian Davidsonings No. 118eblished in 2004)

PR118.fm Page 41 Thursday, September 2, 2004 1:04 PM
Assessing the Impacts of Water Flows on Users: a Gross Margins Analysis of Farms
Sally Marsh,* Brian Davidson,†,1 Le Quang Anh§ and Trinh Thi Long¶
Abstract
Water flows are regulated for a purpose. To understand and improve the flow of water from a central storageto its intended user is only part of the story. The impacts improved flows of water will have, will not only beexperienced by those who run the schemes, but also by those who use them. A clearer understanding of thiseffect can be seen from studies on measuring resource-use performance. Consequently, it is necessary tomeasure, in some objective manner, the impacts any current or expected water flows may have on water users.This needs to happen at a wider level than what was measured when resource-use performance was evaluated.Given that most regulated water flows are used by farmers who produce irrigated crops, a technique thatcomplements and enhances farmers’ planning horizons is required. One such technique is gross marginsanalysis. Further, as water is not the only factor involved in farming, a technique that can encompass all farmactivities is required. Gross margins analysis is such a technique. It was found that variability in wateravailability has little effect on the yields and incomes of farmers in La Khe. However, in Dan Hoai there issome evidence that winter–spring rice yields (the main irrigated crop) are lower for farms located at the endof the irrigation system. In Cu Chi, yields for all rice crops were lower for farms at the end of the system, andnet returns per hectare from cropping activities highest at the top of the system.
Introduction
This paper explains the techniques of gross marginsanalysis. They are used to assess the income gener-ating activities of households in three irrigationsystems in Vietnam. This analysis can also be usedto simulate the changes water supply may have onusers. The importance of different elements of the
* Department of Agricultural and Resource Economics,University of Sydney, Sydney, New South Wales 2006,Australia.
† Institute of Land and Food Resources, University of Melbourne, Victoria 3010, Australia.
§ Vietnam Institute for Water Resources Research, Hanoi, Vietnam.
¶ Southern Institute for Water Resources Research, Ho Chi Minh City, Vietnam.
1 Corresponding author. Email: <[email protected]>.
A framework for improving the manageedited by Hector M. Malano, Biju
ACIAR Proceed(printed version p
4
farming system can be isolated, and the significanceof individual costs and returns can be identified.The attractiveness of the approach is that it allowsfor a comparison to be made between households, asthey are standardised according to a common unit,usually by area. Water volumes could also be usedas a standardising unit, but only in cases where it isobjectively and precisely measured.
This approach can be used to answer a set ofrelated questions. The correct questions to ask canbe derived from hypothesising how the systemoperates, then, by utilising the output from the grossmargins analysis, assessing whether they have aninfluence or not. Of particular interest in the studiespresented in this paper is the impact that wateravailability has on crop production and farmincome. Chien (2001) argues that it is generallyaccepted that farmers near the irrigation headworkshave ready access to water, but farmers further
ment of irrigation schemes in Vietnam A. George and Brian Davidsonings No. 118e
ublished in 2004)
1

PR118.fm Page 42 Thursday, September 2, 2004 1:04 PM
down the system complain that water delivery isless timely and that water is sometimes insufficientto meet crop needs. Hence, where farmers derivetheir incomes from and how reliant they are oncrops that are water dependent is of interest. In addi-tion, the price paid for water and its relation to totalfarm output and costs is of interest. In order toundertake this analysis, it is necessary to comparefarmers with different water availability locatedwithin each irrigation scheme. In other words, theissues of importance assessed in this study do notinvolve a comparison of farmers located in differentirrigation systems. Rather, of interest are the differ-ences that occur between farmers located in thesame irrigation system, yet who have differentaccess to irrigation water because of their locationin relation to main water distribution canals.
The Technique of Gross Margins Analysis
Gross margins analysis is a well-known techniquethat can be used to assess the economic and finan-cial elements of a farming system, and to measurethe likely effect any change that is proposed to thatsystem. The technique is well grounded in eco-nomic theory and has been used to analyse a widerange of issues, under many different circum-stances. An assessment of improvements in thetechnical efficiency of water delivery in irrigationmay have a great impact on farmers. To understandthe impacts these changes have on the economic cir-cumstances of farmers requires informationobtained from a gross margins analysis of farms inthe regions in question.
The gross margin for any enterprise is the grossincome from the enterprise less the variable costsover a specified time period, standardised for differ-ences in a common resource (Sullivan 1987). The‘gross income’ is the return a farmer receives fortheir endeavours, or the price received per unit mul-tiplied by the quantity produced. The ‘variablecosts’ are those directly attributable to the produc-tion in question, and include the costs of fertiliser,pesticides, herbicides, seed etc. They do not includefixed costs, or overheads, such as motor vehicle pur-chase costs, taxes etc. Variable costs vary with thelevel of output, while fixed costs are incurredregardless of the quantity produced. The ‘period’under investigation is usually a year, but could be a
A framework for improving the manageedited by Hector M. Malano, Biju
ACIAR Proceed(printed version pu
42
season or the life of a project. Gross margins arestandardised to a common resource, like land, inorder to allow comparisons to be made between dif-ferent enterprises. There is nothing to stop analystsfrom standardising against any common resource.For instance, it might be prudent to standardiseaccording to the quantity of water used per farm.The only requirement is that the unit of standardisa-tion has to be measured objectively and accurately.In less-developed countries, this cannot be done forwater use.
Obst et al. (1999) argue that gross marginsanalysis can be used to identify many differentfactors about a farming system. Consequently, itcan be used to answer a set of questions, not justthose related to the question at hand; so much so thata gross margin is usually assessed as a first stage inany economic analysis. It is used to diagnose anyweaknesses of the existing business and to prescribeactions needed to reorganise it (Rickards andMcConnell 1967). Its role in assessing change man-agement is highlighted in Makeham and Malcolm(1993) and Malcolm et al. (1996). In a diagnosticsense, technical and economic efficiency is meas-ured by comparing the gross margins of all existingactivities on the farm. Also, a set of standards can bedeveloped for a number of farms within a region, inorder to make comparisons between them.
If a relatively low gross margin is identified, thencloser examination is warranted and the followingsymptoms looked for:• high input costs relative to output prices• low output associated with low variable costs,
indicating inadequate inputs• excessive expenditure relative to the value of
output• unsuitable production techniques.
If inefficiencies are identified and corrected, thefarm household should increase net farm income.
With respect to irrigation farmers in Vietnam, it isimportant to find out whether profitability isaffected by the cost of water, its use and availability,the practices employed by different farmers andtheir strategies towards a range of practices.
It should be noted that a gross margins analysis hasa number of deficiencies. Most importantly, it can bedifficult to distinguish and attribute costs to particularenterprises. It is also assumed that, if a regional oraggregate analysis is attempted, any farmers chosenfor the analysis are representative of all farms in theregion. Finally, any changes suggested from the
ment of irrigation schemes in Vietnam A. George and Brian Davidsonings No. 118eblished in 2004)
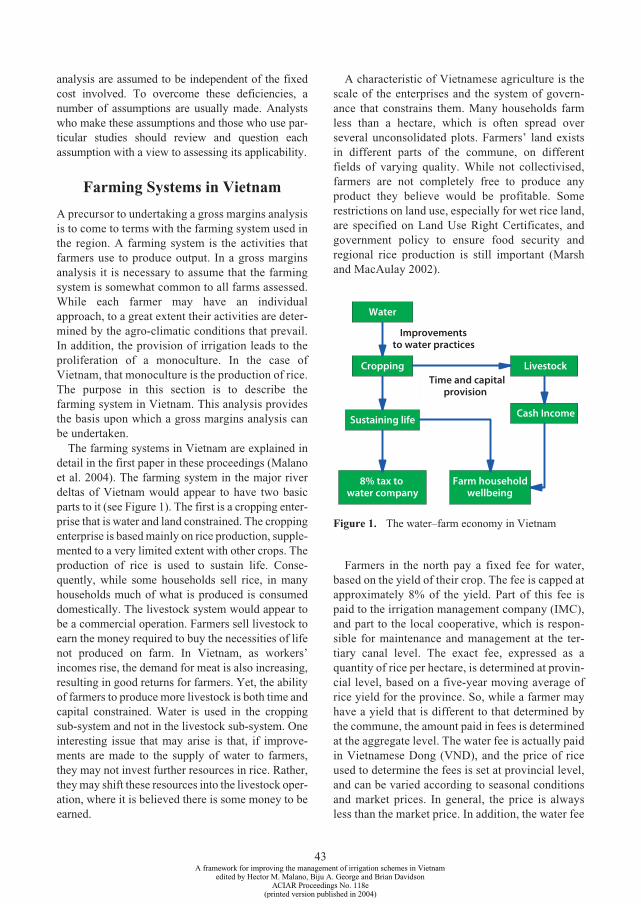
PR118.fm Page 43 Thursday, September 2, 2004 1:04 PM
analysis are assumed to be independent of the fixedcost involved. To overcome these deficiencies, anumber of assumptions are usually made. Analystswho make these assumptions and those who use par-ticular studies should review and question eachassumption with a view to assessing its applicability.
Farming Systems in Vietnam
A precursor to undertaking a gross margins analysisis to come to terms with the farming system used inthe region. A farming system is the activities thatfarmers use to produce output. In a gross marginsanalysis it is necessary to assume that the farmingsystem is somewhat common to all farms assessed.While each farmer may have an individualapproach, to a great extent their activities are deter-mined by the agro-climatic conditions that prevail.In addition, the provision of irrigation leads to theproliferation of a monoculture. In the case ofVietnam, that monoculture is the production of rice.The purpose in this section is to describe thefarming system in Vietnam. This analysis providesthe basis upon which a gross margins analysis canbe undertaken.
The farming systems in Vietnam are explained indetail in the first paper in these proceedings (Malanoet al. 2004). The farming system in the major riverdeltas of Vietnam would appear to have two basicparts to it (see Figure 1). The first is a cropping enter-prise that is water and land constrained. The croppingenterprise is based mainly on rice production, supple-mented to a very limited extent with other crops. Theproduction of rice is used to sustain life. Conse-quently, while some households sell rice, in manyhouseholds much of what is produced is consumeddomestically. The livestock system would appear tobe a commercial operation. Farmers sell livestock toearn the money required to buy the necessities of lifenot produced on farm. In Vietnam, as workers’incomes rise, the demand for meat is also increasing,resulting in good returns for farmers. Yet, the abilityof farmers to produce more livestock is both time andcapital constrained. Water is used in the croppingsub-system and not in the livestock sub-system. Oneinteresting issue that may arise is that, if improve-ments are made to the supply of water to farmers,they may not invest further resources in rice. Rather,they may shift these resources into the livestock oper-ation, where it is believed there is some money to beearned.
A framework for improving the manageedited by Hector M. Malano, Biju
ACIAR Proceed(printed version pu
43
A characteristic of Vietnamese agriculture is thescale of the enterprises and the system of govern-ance that constrains them. Many households farmless than a hectare, which is often spread overseveral unconsolidated plots. Farmers’ land existsin different parts of the commune, on differentfields of varying quality. While not collectivised,farmers are not completely free to produce anyproduct they believe would be profitable. Somerestrictions on land use, especially for wet rice land,are specified on Land Use Right Certificates, andgovernment policy to ensure food security andregional rice production is still important (Marshand MacAulay 2002).
Farmers in the north pay a fixed fee for water,based on the yield of their crop. The fee is capped atapproximately 8% of the yield. Part of this fee ispaid to the irrigation management company (IMC),and part to the local cooperative, which is respon-sible for maintenance and management at the ter-tiary canal level. The exact fee, expressed as aquantity of rice per hectare, is determined at provin-cial level, based on a five-year moving average ofrice yield for the province. So, while a farmer mayhave a yield that is different to that determined bythe commune, the amount paid in fees is determinedat the aggregate level. The water fee is actually paidin Vietnamese Dong (VND), and the price of riceused to determine the fees is set at provincial level,and can be varied according to seasonal conditionsand market prices. In general, the price is alwaysless than the market price. In addition, the water fee
Water
Cropping
Sustaining life
8% tax to water company
Farm householdwellbeing
Livestock
Cash Income
Improvementsto water practices
Time and capitalprovision
Figure 1. The water–farm economy in Vietnam
ment of irrigation schemes in Vietnam A. George and Brian Davidsonings No. 118eblished in 2004)

PR118.fm Page 44 Thursday, September 2, 2004 1:04 PM
can be varied if the farm household is a member ofa priority group, such as a war veteran.
In the south, the provincial governments also setwater fees. In Ho Chi Minh City Province, where CuChi is located, the water fee has remainedunchanged at 300 kg of rice per ha per year for thepast decade, regardless of whether or not farmersmake use of the water. The fee is paid in VND, withthe rice valued by the provincial government. TheIMC representative visits each farmer with amember of the local water users association, tocollect the fee.
Several questions arise from this brief view of theirrigated farming system in Vietnam. It could beasked, as water availability differs within each irri-gation scheme what happens to the:• yield of various rice crops?• crop incomes as the seasons change?• relative importance of income from dry crop
production?• water fees paid per hectare? • total farm income and household income levels?• percentage of total net income earned from
cropping activities?Answers to these questions help explain the
system under investigation and assist in under-standing the importance of irrigation water tofarmers in the system.
Data
Attempts to improve the efficiency of publiclymanaged irrigation schemes in Vietnam are under-taken within a framework that the suggestedimprovements will have a beneficial impact on theusers of water, i.e. farmers. The purpose in thispaper is to investigate the impacts that the supply ofirrigation water has on farmers. To that end, a grossmargins analysis of representative farms in threedifferent irrigation schemes is undertaken. The aimis to assess whether farm profitability was affectedby variability in the supply of irrigation water due tolocation within the system, and the cost of thatwater.
Collecting the data needed to undertake a grossmargins analysis suffers from all the problems asso-ciated with collecting any data, and has a few more ofits own. Those extra problems relate to the separationof fixed and variable costs, and the ability to attribute
A framework for improving the manageedited by Hector M. Malano, Biju
ACIAR Proceed(printed version pu
44
individual costs to individual activities. At a moregeneral level, any data collection method mustbalance the need for representativeness and com-pleteness with the costs of acquiring it. Completenessrequires that farmers be surveyed in great detail oninformation that at times requires recall rather thandocumentation. Representativeness requires that suf-ficient farmers are surveyed in order to quantify thediversity of the enterprises in question.
The farmers in the three irrigation systems, two inthe north and one in the south, were surveyed as partof a wider project (ITC 2001). It must be asked: howis it known that the surveyed farmers are represent-ative of others in the system? While it is difficult toascertain representativeness between systems, itwould appear that surveying farmers along canals isa reasonable sampling process, as water availabilityis of major concern in this study. Thus, farm house-holds from the top, middle and end of canals in eachscheme, with households at the end of canals per-ceived as having poorer access to irrigation water,can be compared.
In northern Vietnam, two surveys of farmers inthe La Khe and Dan Hoai irrigation systems wereundertaken. Both schemes are located in the RedRiver Delta, 25 km southwest of Hanoi. The La KheSystem is approximately 8600 ha, while Dan Hoai isnearly 8000 ha, of which 6800 ha are irrigated inany season. The La Khe scheme supports 20,000people. In Dan Hoai, there are 39 communes with apopulation of 329,000. At La Khe, 40 farm house-holds were surveyed, while in Dan Hoai 30 weresurveyed. In the south, 30 households were sur-veyed in Cu Chi. The Cu Chi irrigation schemecovers an area of 8500 ha. Farmers are organisedinto one of 82 water users’ associations, which is inaddition to their normal connection to a commune.
The household survey conducted in Cu Chi wasvery different to those conducted in Dan Hoai and LaKhe. This is partially a result of differences in the per-sonnel conducting the survey and in the farmingsystem that operates in the south of Vietnam. The CuChi survey data have more demographic detail andless on the costs of production, than those conductedin the north. Despite this, the data collected from CuChi were analysed in a manner consistent with theanalysis of the data obtained at La Khe and Dan Hoai,albeit that different assumptions need to be invokedwhen each gross margins analysis is undertaken.
ment of irrigation schemes in Vietnam A. George and Brian Davidsonings No. 118eblished in 2004)

PR118.fm Page 45 Thursday, September 2, 2004 1:04 PM
Assumptions
In undertaking the analysis of farm households itwas necessary to make the following assumptions:• Spring, summer and winter dry crops are treated
in an aggregate way. The income derived fromthe production of each crop on farm is summedand divided by the area planted to these crops.Consequently, no gross margins are provided forindividual dry crops. This assumption wasemployed, as a breakdown of the costs ofproducing individual dry crops was not known.This assumption has no real bearing on theanalysis at hand, as the dry crops are, bydefinition, not irrigated.
• Livestock income per hectare is derived from thesale of all livestock and divided by the total farmarea. Consequently, like the case of the dry crops,and for the same reasons, livestock income is anaggregate figure that has no bearing on the waterassessments conducted in this analysis. It should benoted that the use of the total farm area in this caseis possibly not ideal, as many livestock are grazedoff-farm and certainly not on areas that are cropped,although crops may be grown for livestock feed.
• Total income reported in the analysis refers to theincome derived from farm activities and not fromany other income-generating activities. Totalhousehold income includes the activities from allincome-generating operations.
• It was necessary to impute a price of all fertilisersused on the farm, as many farmers made use ofmanure. So the price of fertilisers equals the totalmoney spent on fertilisers, divided by the totalquantity used (including manure).
• Unlike the rice crop, the labour used on dry cropswas not disaggregated according to the season inwhich the crop was grown. What was known wasthe amount of labour needed to produce a hectareof a particular dry crop. These data were used todetermine the quantity of labour used in eachseason to produce dry crops. The assumptionunderlying this approach is that, regardless of theseason, the same quantity of labour is required toproduce a given dry crop.
• While many data were collected on costs thatcould be attributed to particular crops (especiallythose that are irrigated), several costs could not beattributed to an individual activity. Theseunattributed costs include the costs of pesticidesand herbicides, labour rents, the water and
A framework for improving the manageedited by Hector M. Malano, Biju
ACIAR Proceed(printed version pu
45
protection fees, agricultural taxes and water-maintenance fees. These need to be handled in awhole-farm budgeting approach, but are dividedby the area serviced by irrigation on each farm.
• Data on the quantities of pesticides used werecalculated on a per-farm basis. Information existson nine different types of pesticides used and theapplication rates were determined from scientificand input supplier sources. The price of each typeof pesticide was obtained and multiplied by theapplication rate to derive a cost per hectare.
• It was noted from the surveyed data that somefarmers provided voluntary labour to the IMC.This labour is a cost to the farmer and wascalculated by taking the number of days workedvoluntarily and multiplying by the going wagerate (US$0.66/day).
Results from Dan Hoai
Staff from the Vietnam Institute of Water ResourcesResearch carried out a survey at six communes in twodistricts of Hoai Duc and Dan Phuong in September2000. The households surveyed included farmslocated at three different parts of the system, consid-ered as upper, middle and lower parts of the Dan Hoaiservice area. From anecdotal evidence, it is believedthat those at the top of the scheme have the bestaccess to water, while those in the middle have betteraccess than those at the end. Thirty households weresurveyed in detail and 27 provided sufficient data foranalysis. The survey determined actual incomes fromfarm activities (income from cultivated crops andlivestock), cash and labour costs incurred for farmactivities, off-farm and trade activities, and percep-tions of irrigation and drainage service.
A number of general results can be derived from acursory glance at the survey responses. These includethat the average household landholding in Dan Hoaiis 0.19 ha (or 5.33 sao1). All but one of the 30 house-holds had net positive returns (from all income-gen-erating activities), They ranged from US$153 toUS$3400. Taken overall, it is correct to say that thesurveyed households show, not unexpectedly, a greatdeal of diversity in activities and income. Furtheranalysis of the data was undertaken, taking intoaccount the location of the household in the irrigationsystem. These results are presented in Table 1.
1 A sao is a common unit of land area in north Vietnam. 1 sao = 360 m2; 27.8 sao = 1 ha.
ment of irrigation schemes in Vietnam A. George and Brian Davidsonings No. 118eblished in 2004)
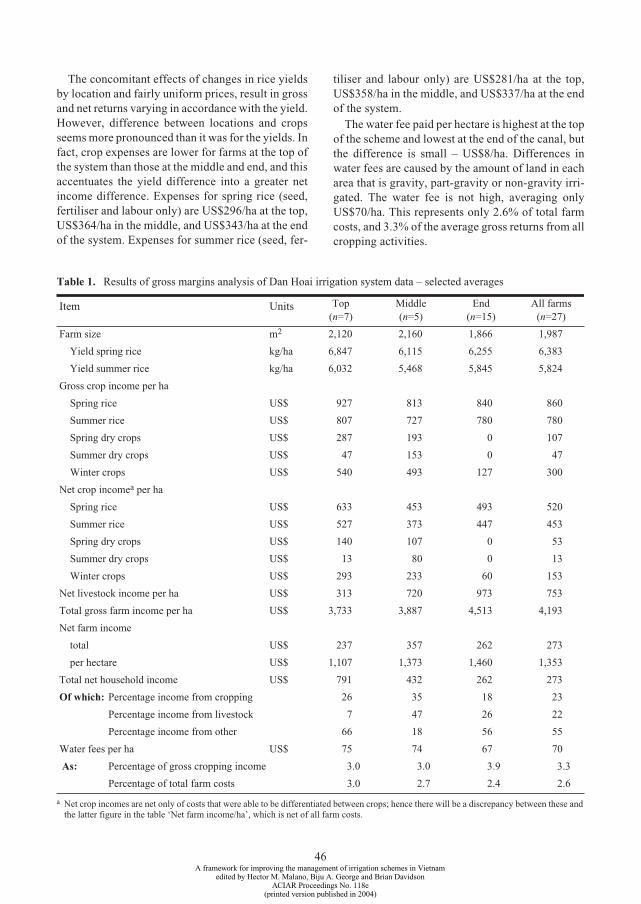
PR118.fm Page 46 Thursday, September 2, 2004 1:04 PM
The concomitant effects of changes in rice yieldsby location and fairly uniform prices, result in grossand net returns varying in accordance with the yield.However, difference between locations and cropsseems more pronounced than it was for the yields. Infact, crop expenses are lower for farms at the top ofthe system than those at the middle and end, and thisaccentuates the yield difference into a greater netincome difference. Expenses for spring rice (seed,fertiliser and labour only) are US$296/ha at the top,US$364/ha in the middle, and US$343/ha at the endof the system. Expenses for summer rice (seed, fer-
A framework for improving the manageedited by Hector M. Malano, Biju
ACIAR Proceed(printed version pu
46
tiliser and labour only) are US$281/ha at the top,US$358/ha in the middle, and US$337/ha at the endof the system.
The water fee paid per hectare is highest at the topof the scheme and lowest at the end of the canal, butthe difference is small – US$8/ha. Differences inwater fees are caused by the amount of land in eacharea that is gravity, part-gravity or non-gravity irri-gated. The water fee is not high, averaging onlyUS$70/ha. This represents only 2.6% of total farmcosts, and 3.3% of the average gross returns from allcropping activities.
Table 1. Results of gross margins analysis of Dan Hoai irrigation system data – selected averages
Item Units Top(n=7)
Middle(n=5)
End(n=15)
All farms(n=27)
Farm size m2 2,120 2,160 1,866 1,987
Yield spring rice kg/ha 6,847 6,115 6,255 6,383
Yield summer rice kg/ha 6,032 5,468 5,845 5,824
Gross crop income per ha
Spring rice US$ 927 813 840 860
Summer rice US$ 807 727 780 780
Spring dry crops US$ 287 193 0 107
Summer dry crops US$ 47 153 0 47
Winter crops US$ 540 493 127 300
Net crop incomea per ha
a Net crop incomes are net only of costs that were able to be differentiated between crops; hence there will be a discrepancy between these and the latter figure in the table ‘Net farm income/ha’, which is net of all farm costs.
Spring rice US$ 633 453 493 520
Summer rice US$ 527 373 447 453
Spring dry crops US$ 140 107 0 53
Summer dry crops US$ 13 80 0 13
Winter crops US$ 293 233 60 153
Net livestock income per ha US$ 313 720 973 753
Total gross farm income per ha US$ 3,733 3,887 4,513 4,193
Net farm income
total US$ 237 357 262 273
per hectare US$ 1,107 1,373 1,460 1,353
Total net household income US$ 791 432 262 273
Of which: Percentage income from cropping 26 35 18 23
Percentage income from livestock 7 47 26 22
Percentage income from other 66 18 56 55
Water fees per ha US$ 75 74 67 70
As: Percentage of gross cropping income 3.0 3.0 3.9 3.3
Percentage of total farm costs 3.0 2.7 2.4 2.6
ment of irrigation schemes in Vietnam A. George and Brian Davidsonings No. 118eblished in 2004)

PR118.fm Page 47 Thursday, September 2, 2004 1:04 PM
Net farm income per hectare is lowest for farms atthe top of the canal. This can be shown to be attribut-able to livestock activities. Net cropping income isUS$792/ha at the top of the system, US$655/ha in themiddle of the system, and US$486/ha at the end of thesystem. This is possibly the strongest indication fromthe data that cropping activities are favoured at farmlocations nearer to the irrigation headworks.
Only relatively small percentages of total netincome are derived from cropping activities. Theyrange from 18% at the end of the system, to 35% and26% at the middle and top of the system. The inter-relationship between cropping activities, livestockactivities and off-farm income in these small-farmhouseholds is complex. Thus, it is difficult to assessthe effect of water availability on farm activities andfarm income from farm production data. Further-more, cropping activities are related to subsistenceneeds, whereas income from livestock and off-farmactivities are used to create cash income.
Results from La Khe
Forty households in the La Khe irrigation system,from communes located at the top, middle and endof the N5 secondary canal, were surveyed in 2000.Data from all but two households were used in theanalysis. The data for La Khe are more detailed thanthose for Dan Hoai and, as a consequence, all butone of the costs could be attributed to individualactivities. In this sample, no farmer grew dry cropsduring the spring and summer production periods;all dry crops were produced in winter. The averagehousehold landholding was 0.30 ha (8.42 sao).Households, on average, had net positive returnsfrom agriculture of US$316 (range US$64–794)and net household incomes of US$379 (rangeUS$113–1460). Analysis of the data, based on loca-tion in the system, is shown in Table 2.
Spring and summer rice produced at the top andmiddle of the scheme returned approximatelyUS$267/ha and US$327/ha, respectively, per ricecrop, net of expenses; while at the end of the canal,returns are considerably higher at US$413/ha forthe spring crop and US$367/ha for the summer crop.The differences between the gross and net margins,i.e. the costs of producing each crop, tend to accen-tuate the effect of yield differences on farm returns.In other words, production is more expensive at thetop of the canal where yields are lower, than at theend of the canal where yields are higher.
A framework for improving the manageedited by Hector M. Malano, Biju
ACIAR Proceed(printed version pu
47
The water fee per hectare is highest at the top ofthe scheme and lowest at the end of the canal.Again, this would be related to the type of irrigationservice provided: gravity, part-gravity or non-gravity. The fee averages around US$67 per ha.This represents, on average, 7.6% of the costs ofproduction per farm. Yet, in terms of the grossreturns from cropping, the fee represents on averageonly 5.3%. As this cost is not dissimilar to the setcharges for water, the results of the water compo-nent of this analysis are considered to be reliable.
Total net farm income and farm income perhectare are highest at the end of the system. There islittle difference in the performance of farm incomesin the middle and top of the system. Average nethousehold income (which included income gener-ated off-farm) is similar at all locations: aroundUS$1307/ha at the top of the system, US$1227/ha inthe middle, and US$1260/ha at the end of the canal.
The percentage of net household income derivedfrom cropping, livestock and other activities isshown in Table 2. In this sample of farms from LaKhe, the percentage of total net income derivedfrom cropping activities was high at all locations,ranging from 47% at the top of the system to 55%and 70% at the middle and end of the system. By andlarge, it could be said that these farmers rely on riceproduction for a major component of their income.
Results from Cu Chi
Forty-four farm households located at the top, middleand end of the Cu Chi irrigation system were surveyedin 2000 by staff from the Southern Institute of WaterResources. In Cu Chi, the average household land-holding is 0.61 ha. Net returns from agricultureranged from an average of US$1230 for farms locatedat the top of the scheme, to US$571 for farms locatedin the middle of the system and US$822 for farmslocated at the end of the scheme. An analysis of thedata was undertaken, taking into account the locationof the household in the irrigation system. The resultsobtained are detailed in Table 3.
Gross returns for individual crops tend to followthe same trend as the yield for each crop across boththe location of the farm and the season in which thecrop is grown. This occurs because price for rice,both spatially and temporally, is fairly uniform.Figures for gross returns in Table 3 do not alwaysshow this, as these average gross returns include allsurveyed farms, whereas not all farms grow each
ment of irrigation schemes in Vietnam A. George and Brian Davidsonings No. 118eblished in 2004)

PR118.fm Page 48 Thursday, September 2, 2004 1:04 PM
crop; for example, monsoon long and short-seasonvarieties are mutually exclusive. Overall, moreincome per hectare is made from cropping activitiesat the top of the canal. Gross and net income perhectare from all crops is around 40% less for farmslocated at the middle or end of the system, comparedwith farms located at the top of the system.
The water fee per hectare is highest at the top of thescheme and lowest at the end of the canal. The feeaverages only US$4/ha over all the sampled farms.This represents approximately 3% of the costs of pro-duction per hectare. Yet, in terms of the returns fromrice (i.e. the gross returns), the fee represents onlyapproximately 2%. This cost would appear to be sig-nificantly lower than those reported to be charged towater users. However, in a assessment of companyviability (reported in Davidson et al. (2004)) it was
A framework for improving the manageedited by Hector M. Malano, Biju
ACIAR Proceed(printed version pu
found that, on average, only $US12/ha was paid inwater fees by users across the system. This differenceis believed to be due to the problems the IMC has incollecting water fees in selected areas.
Net farm income per hectare was lowest for farmsin the middle of the scheme and considerably higher,by nearly US$1627/ha, at the top of the scheme. Muchof this difference was caused by differences in netcropping returns per hectare: at the top of the schemethese were US$1840/ha, compared with aroundUS$933/ha at both the middle and end of the system.This is possibly the strongest indication from the datathat farming activities were favoured at farm locationsnearer the irrigation headworks. Total net householdincome was US$1805 at the top of the system, onlyUS$1121 in the middle, and US$1384 at the end of thesystem.
48
Table 2. Results of gross margins analysis of La Khe irrigation system data – selected averages
Item Units Top(n=13)
Middle(n=11)
End(n=14)
All farms(n=38)
Farm size m2 2,570 3,584 3,047 3,039
Yield
Spring rice kg/ha 4,231 4,583 4,826 4,552
Summer rice kg/ha 4,038 4,199 4,380 4,211
Gross crop income per ha
Spring rice US$ 540 560 633 580
Summer rice US$ 507 513 580 533
Winter crops US$ 113 60 247 147
Net crop income per ha
Spring rice US$ 267 333 413 340
Summer rice US$ 267 320 367 320
Winter crops US$ 93 33 120 87
Net livestock income per ha US$ 400 247 287 313
Total gross farm income per ha US$ 2,040 1,673 1,993 1,913
Net farm income
total US$ 227 323 357 316
per hectare US$ 1,020 933 1,187 1,053
Total net household income US$ 330 432 382 379
Of which: Percentage income from cropping 47 55 70 58
Percentage income from livestock 34 20 24 25
Percentage income from other 19 25 7 17
Water fees per ha US$ 73.6 69.2 50.7 63.9
As: Percentage of gross cropping income 6.8 6.2 3.6 5.3
Percentage of total farm costs 7.6 9.5 6.3 7.6
ment of irrigation schemes in Vietnam A. George and Brian Davidsonings No. 118eblished in 2004)
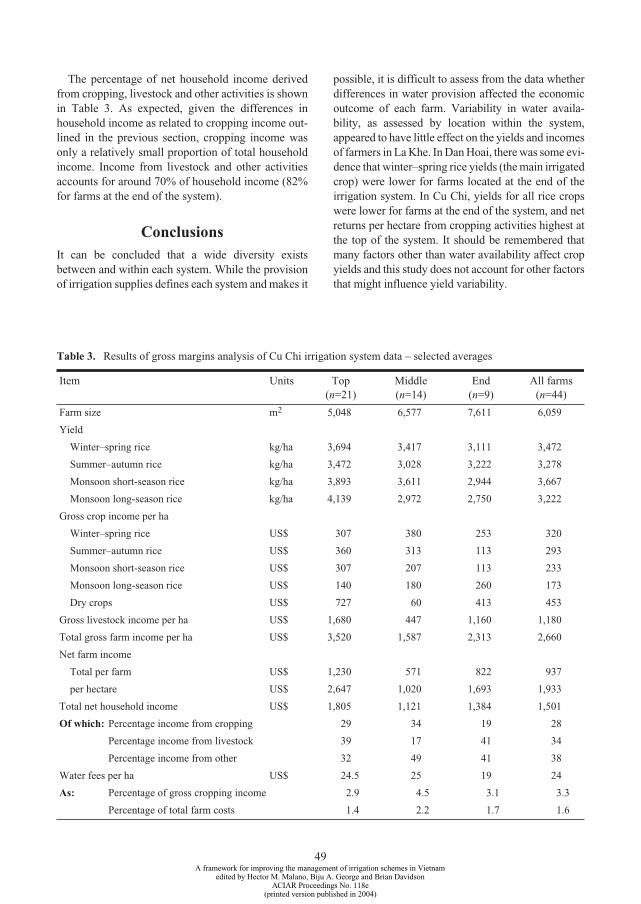
PR118.fm Page 49 Thursday, September 2, 2004 1:04 PM
The percentage of net household income derivedfrom cropping, livestock and other activities is shownin Table 3. As expected, given the differences inhousehold income as related to cropping income out-lined in the previous section, cropping income wasonly a relatively small proportion of total householdincome. Income from livestock and other activitiesaccounts for around 70% of household income (82%for farms at the end of the system).
Conclusions It can be concluded that a wide diversity existsbetween and within each system. While the provisionof irrigation supplies defines each system and makes it
A framework for improving the manageedited by Hector M. Malano, Biju
ACIAR Proceed(printed version pu
possible, it is difficult to assess from the data whetherdifferences in water provision affected the economicoutcome of each farm. Variability in water availa-bility, as assessed by location within the system,appeared to have little effect on the yields and incomesof farmers in La Khe. In Dan Hoai, there was some evi-dence that winter–spring rice yields (the main irrigatedcrop) were lower for farms located at the end of theirrigation system. In Cu Chi, yields for all rice cropswere lower for farms at the end of the system, and netreturns per hectare from cropping activities highest atthe top of the system. It should be remembered thatmany factors other than water availability affect cropyields and this study does not account for other factorsthat might influence yield variability.
49
Table 3. Results of gross margins analysis of Cu Chi irrigation system data – selected averages
Item Units Top(n=21)
Middle(n=14)
End(n=9)
All farms(n=44)
Farm size m2 5,048 6,577 7,611 6,059
Yield
Winter–spring rice kg/ha 3,694 3,417 3,111 3,472
Summer–autumn rice kg/ha 3,472 3,028 3,222 3,278
Monsoon short-season rice kg/ha 3,893 3,611 2,944 3,667
Monsoon long-season rice kg/ha 4,139 2,972 2,750 3,222
Gross crop income per ha
Winter–spring rice US$ 307 380 253 320
Summer–autumn rice US$ 360 313 113 293
Monsoon short-season rice US$ 307 207 113 233
Monsoon long-season rice US$ 140 180 260 173
Dry crops US$ 727 60 413 453
Gross livestock income per ha US$ 1,680 447 1,160 1,180
Total gross farm income per ha US$ 3,520 1,587 2,313 2,660
Net farm income
Total per farm US$ 1,230 571 822 937
per hectare US$ 2,647 1,020 1,693 1,933
Total net household income US$ 1,805 1,121 1,384 1,501
Of which: Percentage income from cropping 29 34 19 28
Percentage income from livestock 39 17 41 34
Percentage income from other 32 49 41 38
Water fees per ha US$ 24.5 25 19 24
As: Percentage of gross cropping income 2.9 4.5 3.1 3.3
Percentage of total farm costs 1.4 2.2 1.7 1.6
ment of irrigation schemes in Vietnam A. George and Brian Davidsonings No. 118eblished in 2004)
PR118.fm Page 50 Thursday, September 2, 2004 1:04 PM
References
Chien, N.V. 2001. Water resources management in Vietnamand the need for change in water fee policy. In: Brennan,D., ed., Water policy reform: lessons from Asia andAustralia. Canberra, ACIAR Proceedings No. 106, 206–208.
Davidson, B., Malano, H. and George, B. 2004. Assessingthe financial viability of irrigation managementcompanies: a case study at Cu Chi, Vietnam. Theseproceedings.
ITC (International Technologies Centre) 2001. ACIARProject 9834: System-wide water management inpublicly managed irrigation schemes in Vietnam.Parkville, Australia, University of Melbourne, AnnualReport, Department of Civil and EnvironmentalEngineering.
Makeham, J. and Malcolm, L. 1993. The farming game now.Sydney, Cambridge University Press.
Malano, H., George, B. and Davidson, B. 2004. Aframework for improving the management of irrigationschemes in Vietnam: an overview. These proceedings.
A framework for improving the manageedited by Hector M. Malano, Biju
ACIAR Proceed(printed version pu
50
Malcolm, L., Sale, P. and Egan, A. 1996. Agriculture inAustralia: an introduction. Melbourne, OxfordUniversity Press.
Marsh, S.P. and MacAulay, T.G. 2002. Land reform and thedevelopment of commercial agriculture in Vietnam:policy and issues, Australasian Agribusiness Review 10. <http://www.agrifood.info/Review/2002v10/2002_Index.htm>
Obst, W., Graham, R., Binney, W. and Christie, G. 1999.Agribusiness financial management. Sydney, FederationPress.
Rickards, A. and McConnell, D. 1967. Budgeting, grossmargins and programming for farm planning. Armidale,New South Wales, University of New England,Department of Farm Management, Professional FarmManagement Guidebook No. 3.
Sullivan, S. 1987. Enterprise budgets for the north west ofNew South Wales. Armidale, New South Wales,University of New England, ABRI Complan HandbookNo. 7.
ment of irrigation schemes in Vietnam A. George and Brian Davidsonings No. 118eblished in 2004)

PR118.fm Page 51 Thursday, September 2, 2004 1:04 PM
Asset Management Modelling for Infrastructure Management in Vietnamese Irrigation
Management Companies
Hector M. Malano,*,1 Biju A. George,* Brian Davidson,† Vo Khac Tri§ and Nguyen Viet Chien¶
Abstract
An adaptive asset-management framework and geographical information system software were designed toassist in the task of managing the infrastructure by the irrigation management companies in Vietnam. The aimof the approach is to calculate how much companies will need to replace the infrastructure under differentrenewal strategies. The software tool can be used to maintain an up-to-date database of asset condition and tocarry out various financial calculations and modelling including depreciation and condition-based renewalcosts. This approach was applied in two irrigation systems in Vietnam. The costs were assessed of threedifferent renewal strategies, one assessing a linear depreciation, another involving a full annuity and the finalapproach taking a partial annuity. It was found that, for the Cu Chi system, full renewal cost varies betweenUS$41.00/ha and US$28.00/ha when the interest rate varies between 3% and 9%. The equivalent renewal costfor the Dan Hoai system varies between US$33.00/ha and US$22.50/ha.
Introduction
The condition and adequacy of the infrastructure inan irrigation scheme play a critical role in the abilityof the scheme to deliver a specified irrigationservice. In many developed countries, includingVietnam, the irrigation and drainage infrastructureis less than well-managed due to low maintenance
* International Technologies Centre, Department of Civiland Environmental Engineering, University ofMelbourne, Victoria 3010, Australia.
† Institute of Land and Food Resources, University of Melbourne, Victoria 3010, Australia.
§ Southern Institute for Water Resources Research, Ho Chi Minh City, Vietnam.
¶ Vietnam Institute for Water Resources Research, Hanoi, Vietnam.
1 Corresponding author. Email: <[email protected]>.
A framework for improving the manageedited by Hector M. Malano, Biju
ACIAR Proceed(printed version p
5
expenditure and insufficient provisions for renewalof assets. The poor condition of the assets, com-bined with shortcomings in the design criteria, alsoimposes some limitations in the implementation ofimproved operational procedures.
The management and operation of irrigation anddrainage infrastructure involves a number of eventsincluding planning and constructing new assets,maintenance and rehabilitation, and the modernisa-tion of assets to meet new service requirements. Anasset management program takes account of all theseevents. Hofwegen and Malano (1997) defined assetmanagement programs as ‘A plan for creation oracquisition, maintenance, operation, replacement,modernization and disposal of irrigation anddrainage assets to provide agreed level of service inthe most cost effective and sustainable manner’. Thevarious processes involved in asset-management
ment of irrigation schemes in Vietnam A. George and Brian Davidsonings No. 118e
ublished in 2004)
1
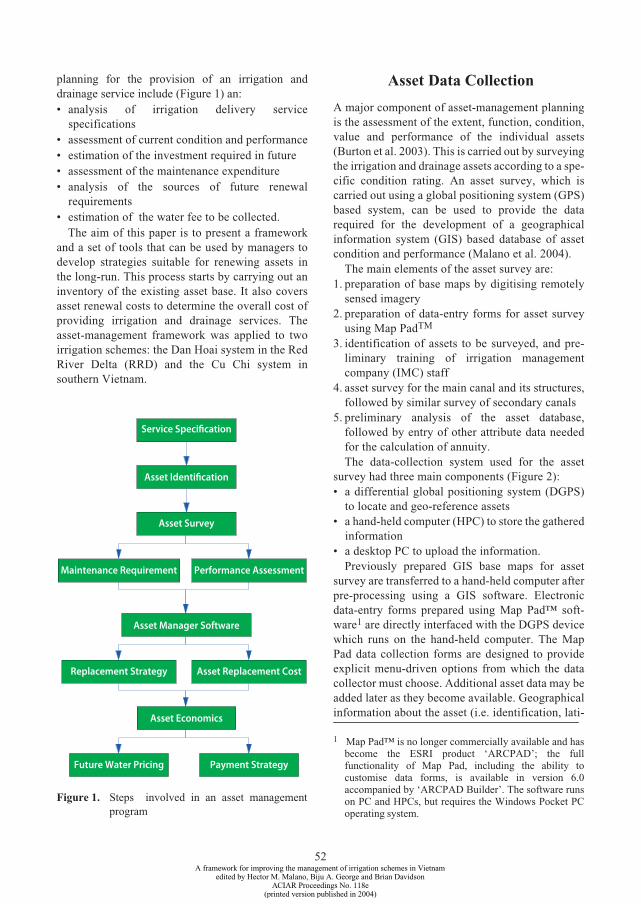
PR118.fm Page 52 Thursday, September 2, 2004 1:04 PM
planning for the provision of an irrigation anddrainage service include (Figure 1) an:• analysis of irrigation delivery service
specifications• assessment of current condition and performance• estimation of the investment required in future• assessment of the maintenance expenditure• analysis of the sources of future renewal
requirements • estimation of the water fee to be collected.
The aim of this paper is to present a frameworkand a set of tools that can be used by managers todevelop strategies suitable for renewing assets inthe long-run. This process starts by carrying out aninventory of the existing asset base. It also coversasset renewal costs to determine the overall cost ofproviding irrigation and drainage services. Theasset-management framework was applied to twoirrigation schemes: the Dan Hoai system in the RedRiver Delta (RRD) and the Cu Chi system insouthern Vietnam.
Maintenance Requirement
Replacement Strategy
Future Water Pricing
Performance Assessment
Asset Replacement Cost
Payment Strategy
Service Specification
Asset Identification
Asset Survey
Asset Manager Software
Asset Economics
Figure 1. Steps involved in an asset managementprogram
A framework for improving the manageedited by Hector M. Malano, Biju
ACIAR Proceed(printed version pu
52
Asset Data Collection
A major component of asset-management planningis the assessment of the extent, function, condition,value and performance of the individual assets(Burton et al. 2003). This is carried out by surveyingthe irrigation and drainage assets according to a spe-cific condition rating. An asset survey, which iscarried out using a global positioning system (GPS)based system, can be used to provide the datarequired for the development of a geographicalinformation system (GIS) based database of assetcondition and performance (Malano et al. 2004).
The main elements of the asset survey are:1. preparation of base maps by digitising remotely
sensed imagery2. preparation of data-entry forms for asset survey
using Map PadTM
3. identification of assets to be surveyed, and pre-liminary training of irrigation managementcompany (IMC) staff
4. asset survey for the main canal and its structures,followed by similar survey of secondary canals
5. preliminary analysis of the asset database,followed by entry of other attribute data neededfor the calculation of annuity.The data-collection system used for the asset
survey had three main components (Figure 2): • a differential global positioning system (DGPS)
to locate and geo-reference assets • a hand-held computer (HPC) to store the gathered
information • a desktop PC to upload the information.
Previously prepared GIS base maps for assetsurvey are transferred to a hand-held computer afterpre-processing using a GIS software. Electronicdata-entry forms prepared using Map Pad™ soft-ware1 are directly interfaced with the DGPS devicewhich runs on the hand-held computer. The MapPad data collection forms are designed to provideexplicit menu-driven options from which the datacollector must choose. Additional asset data may beadded later as they become available. Geographicalinformation about the asset (i.e. identification, lati-
1 Map Pad™ is no longer commercially available and hasbecome the ESRI product ‘ARCPAD’; the fullfunctionality of Map Pad, including the ability tocustomise data forms, is available in version 6.0accompanied by ‘ARCPAD Builder’. The software runson PC and HPCs, but requires the Windows Pocket PCoperating system.
ment of irrigation schemes in Vietnam A. George and Brian Davidsonings No. 118eblished in 2004)

PR118.fm Page 53 Thursday, September 2, 2004 1:04 PM
tude and longitude coordinates) and data-entryforms can be displayed for on-the-spot recording bythe operator. The data collected during field surveyare listed in Table 1 and the criteria used for thesurvey of asset condition are given in Table 2.Maintenance and repair requirements at the time ofthe survey were also recorded to enable an estimateof the maintenance backlog for the entire system.
Asset Management Modelling
Modelling framework
The main outcome of an asset-managementprogram is a comprehensive investment program toachieve a sustainable level of service provision. Theapproach taken for the calculation of infrastructurecost is based on the following:• asset condition rating based on its ability to
perform its function and overall decay
A framework for improving the manageedited by Hector M. Malano, Biju
ACIAR Proceed(printed version pu
DESKTOP • Receives s• Design an
DGPS LOGGER + AeReceives signals andx,y,z position.
• ascribing asset importance and calculation ofoverall condition rating
• estimation of residual life based on condition
• estimation of asset replacement cost and annuitybased on residual life.
The asset condition rating is carried out on thebasis of two parameters: condition, and hydraulicperformance (Tran et al. 2003). Asset conditionrefers to the ability of the asset to perform the func-tion for which it was intended. The condition ofassets is the result of several factors, including wearand tear, quality of maintenance, age and quality ofconstruction, and is a key measure necessary todetermine the residual life of assets. Hydraulic per-formance refers to the ability of the asset to satisfythe function for which it was designed. A scoringsystem is usually applied to rate the performance ofassets. The criteria used to evaluate the hydraulicperformance of assets in this model are described inTable 3.
COMPUTERurvey data as shape filed transfer survey forms to hand-held PC
rial notes
HAND-HELD PC + 8 Mb memory• displays base map of area to be surveyed (ARCVIEW shape file)• displays form to enter survey data and store it in database.
53
Figure 2. Integrated asset survey and software system
ment of irrigation schemes in Vietnam A. George and Brian Davidsonings No. 118eblished in 2004)
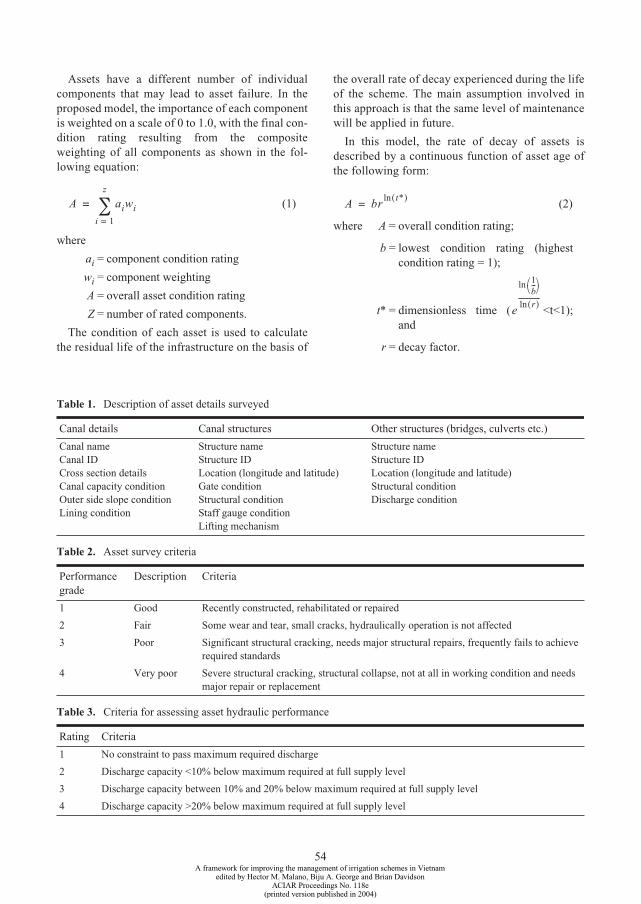
PR118.fm Page 54 Thursday, September 2, 2004 1:04 PM
Assets have a different number of individualcomponents that may lead to asset failure. In theproposed model, the importance of each componentis weighted on a scale of 0 to 1.0, with the final con-dition rating resulting from the compositeweighting of all components as shown in the fol-lowing equation:
(1)
where
ai = component condition rating
wi = component weighting
A = overall asset condition rating
Z = number of rated components.
The condition of each asset is used to calculatethe residual life of the infrastructure on the basis of
A aiwii 1=
z
∑=
ACIAR Proceed(printed version pu
the overall rate of decay experienced during the lifeof the scheme. The main assumption involved inthis approach is that the same level of maintenancewill be applied in future.
In this model, the rate of decay of assets isdescribed by a continuous function of asset age ofthe following form:
(2)
where A = overall condition rating;
b = lowest condition rating (highestcondition rating = 1);
t* = dimensionless time ( <t<1);and
r = decay factor.
A brt*( )ln
=
e
1b---⎝ ⎠
⎛ ⎞ln
r( )ln--------------
A framework for improving the management of irrigation schemes in Vietnamedited by Hector M. Malano, Biju A. George and Brian Davidson
54
Table 1. Description of asset details surveyed
Canal details Canal structures Other structures (bridges, culverts etc.)
Canal nameCanal IDCross section detailsCanal capacity conditionOuter side slope conditionLining condition
Structure nameStructure IDLocation (longitude and latitude)Gate conditionStructural conditionStaff gauge conditionLifting mechanism
Structure nameStructure IDLocation (longitude and latitude)Structural conditionDischarge condition
Table 2. Asset survey criteria
Performancegrade
Description Criteria
1 Good Recently constructed, rehabilitated or repaired
2 Fair Some wear and tear, small cracks, hydraulically operation is not affected
3 Poor Significant structural cracking, needs major structural repairs, frequently fails to achieve required standards
4 Very poor Severe structural cracking, structural collapse, not at all in working condition and needs major repair or replacement
Table 3. Criteria for assessing asset hydraulic performance
Rating Criteria
1 No constraint to pass maximum required discharge
2 Discharge capacity <10% below maximum required at full supply level
3 Discharge capacity between 10% and 20% below maximum required at full supply level
4 Discharge capacity >20% below maximum required at full supply level
ings No. 118eblished in 2004)

PR118.fm Page 55 Thursday, September 2, 2004 1:04 PM
This rating function takes into account the decaypattern appropriate for each asset, such as acceler-ated decay or delayed decay. The decay curve alsoreflects the level of expenditure needed to bring theasset to its original condition. Assets with a fasterrate of initial decay require greater investment toupgrade their condition earlier in their lives thanassets with a more uniform rate of decay. The assetdecay factor also has an effect on decisions aboutfuture strategies (on whether to maintain, replace,rehabilitate, or upgrade) that result from theirpresent condition.
Asset replacement costs are then calculated afteraccounting the inflation rate for the residual life asfollows:
(3)
where
RV = asset replacement value
RL = residual life of the asset
IF = inflation rate
P = present value of asset replacement.
To account for the full cost of providing irrigationand drainage services in perpetuity it is essential touse a renewals-accounting process that ensures ade-quate funding for the renewal of assets whenneeded. This entails setting up a renewal fund thatensures sufficient capitalisation over the renewalplanning period so the management company caninvest in asset replacement, rehabilitation or mod-ernisation. The calculation of this annuity is basedon the current rate of interest earned by fixed-termdeposits.
Three alternative forms of annuity calculationsavailable in the software are (Malano et al. 2004):
• depreciation
• full renewal
• partial renewal.
The calculation of depreciation is based on alinear depreciation model; that is, one where a con-stant annual rate of depreciation is used. Fullrenewal annuity assumes that the entire replacementvalue of the asset will be recovered during theresidual life of the current assets. Partial renewalassumes that the residual value of assets will berecovered during the residual life. This approachassumes the remaining value of the asset is written-off or sunk.
RV P 1 IF+( )RL
×=
A framework for improving the manageedited by Hector M. Malano, Biju
ACIAR Proceed(printed version pu
55
The linear depreciation annuity is calculated as:
(4)
where
DA = depreciation annuity
RV = asset replacement value
n = asset life (years).
The full renewal annuity is calculated as:
(5)
where
FA = full renewal annuity
RV = asset replacement value
i = interest rate
RL = residual life of the asset.
The partial annuity is calculated as:
(6)
wherePA = partial financial annuity
RE = residual value of the asset.
The residual (written-down) value is calculated as:
(7)
whereRE = residual value of the asset
D = depreciation
RV = asset replacement value.
The calculation is based on current asset condi-tion. The asset condition is used to determine theactual residual life of the structure. The approachtaken for the calculation of infrastructure cost isbased on the use of conditions based depreciation(CBD), which ascribes an estimated residual life toeach asset according to its current condition(Malano et al. 2004).
Asset Manager software
A GIS-based software, called Asset Manager, hasbeen designed for storing, manipulating andretrieving asset data (Malano et al. 2004). The soft-ware has three components: a graphical user inter-face (GUI) built on Visual Basic, a modellingcomponent and a GIS-based database managementsystem (Figure 3). The model has special features to
DA RVn
-------=
FA RV i×
1 i+( )RL
1–------------------------------=
PA RE i×
1 i+( )RL
1–------------------------------=
RE RV D–=
ment of irrigation schemes in Vietnam A. George and Brian Davidsonings No. 118eblished in 2004)
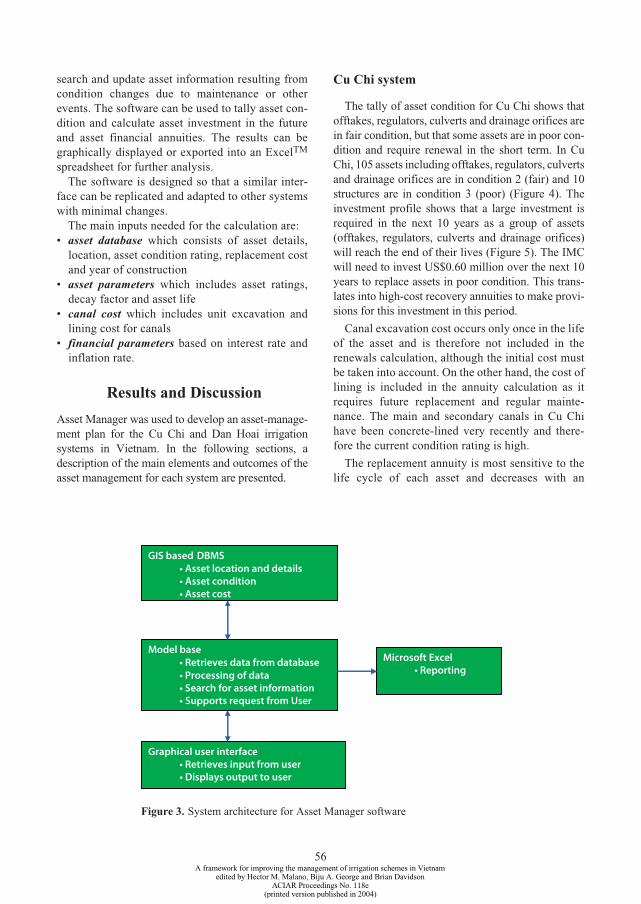
PR118.fm Page 56 Thursday, September 2, 2004 1:04 PM
search and update asset information resulting fromcondition changes due to maintenance or otherevents. The software can be used to tally asset con-dition and calculate asset investment in the futureand asset financial annuities. The results can begraphically displayed or exported into an ExcelTM
spreadsheet for further analysis. The software is designed so that a similar inter-
face can be replicated and adapted to other systemswith minimal changes.
The main inputs needed for the calculation are:• asset database which consists of asset details,
location, asset condition rating, replacement costand year of construction
• asset parameters which includes asset ratings,decay factor and asset life
• canal cost which includes unit excavation andlining cost for canals
• financial parameters based on interest rate andinflation rate.
Results and Discussion
Asset Manager was used to develop an asset-manage-ment plan for the Cu Chi and Dan Hoai irrigationsystems in Vietnam. In the following sections, adescription of the main elements and outcomes of theasset management for each system are presented.
A framework for improving the manageedited by Hector M. Malano, Biju
ACIAR Proceed(printed version pu
56
GIS based DBMS• Asset location and details• Asset condition• Asset cost
Model base• Retrieves data from database• Processing of data• Search for asset information• Supports request from User
Graphical user interface• Retrieves input from user• Displays output to user
Cu Chi system
The tally of asset condition for Cu Chi shows thatofftakes, regulators, culverts and drainage orifices arein fair condition, but that some assets are in poor con-dition and require renewal in the short term. In CuChi, 105 assets including offtakes, regulators, culvertsand drainage orifices are in condition 2 (fair) and 10structures are in condition 3 (poor) (Figure 4). Theinvestment profile shows that a large investment isrequired in the next 10 years as a group of assets(offtakes, regulators, culverts and drainage orifices)will reach the end of their lives (Figure 5). The IMCwill need to invest US$0.60 million over the next 10years to replace assets in poor condition. This trans-lates into high-cost recovery annuities to make provi-sions for this investment in this period.
Canal excavation cost occurs only once in the lifeof the asset and is therefore not included in therenewals calculation, although the initial cost mustbe taken into account. On the other hand, the cost oflining is included in the annuity calculation as itrequires future replacement and regular mainte-nance. The main and secondary canals in Cu Chihave been concrete-lined very recently and there-fore the current condition rating is high.
The replacement annuity is most sensitive to thelife cycle of each asset and decreases with an
Microsoft Excel• Reporting
Figure 3. System architecture for Asset Manager software
ment of irrigation schemes in Vietnam A. George and Brian Davidsonings No. 118eblished in 2004)
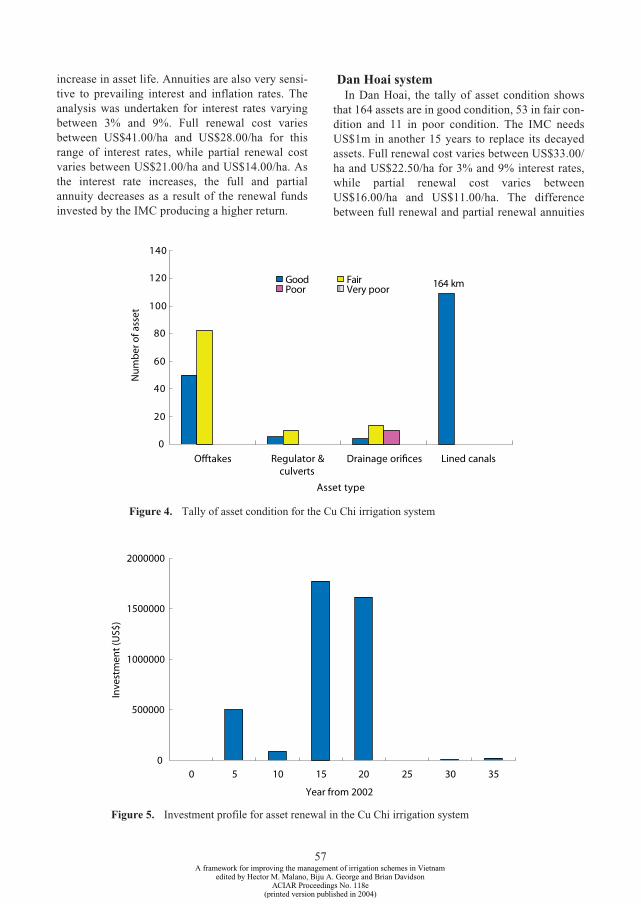
PR118.fm Page 57 Thursday, September 2, 2004 1:04 PM
increase in asset life. Annuities are also very sensi-tive to prevailing interest and inflation rates. Theanalysis was undertaken for interest rates varyingbetween 3% and 9%. Full renewal cost variesbetween US$41.00/ha and US$28.00/ha for thisrange of interest rates, while partial renewal costvaries between US$21.00/ha and US$14.00/ha. Asthe interest rate increases, the full and partialannuity decreases as a result of the renewal fundsinvested by the IMC producing a higher return.
A framework for improving the manageedited by Hector M. Malano, Biju
ACIAR Proceed(printed version pu
0
20
40
60
80
100
120
140
Offtakes Regulator &culverts
A
Num
ber
of a
sset
GoodPoor
0
500000
1000000
1500000
0 5 10 15
Yea
Inve
stm
ent (
US$
)
Dan Hoai systemIn Dan Hoai, the tally of asset condition shows
that 164 assets are in good condition, 53 in fair con-dition and 11 in poor condition. The IMC needsUS$1m in another 15 years to replace its decayedassets. Full renewal cost varies between US$33.00/ha and US$22.50/ha for 3% and 9% interest rates,while partial renewal cost varies betweenUS$16.00/ha and US$11.00/ha. The differencebetween full renewal and partial renewal annuities
164 km
Drainage orifices Lined canals
sset type
FairVery poor
2000000
Figure 4. Tally of asset condition for the Cu Chi irrigation system
20 25 30 35
r from 2002
57
Figure 5. Investment profile for asset renewal in the Cu Chi irrigation system
ment of irrigation schemes in Vietnam A. George and Brian Davidsonings No. 118eblished in 2004)

PR118.fm Page 58 Thursday, September 2, 2004 1:04 PM
depends on the general condition of assets. In gen-eral, the difference between the two approaches isreduced as the condition of the asset base isimproved and the residual life of assets approachesthe full life of new assets.
Conclusions
Asset-management planning of irrigation anddrainage services includes assessing current condi-tion and performance, estimating the investmentrequired in future, assessing the maintenanceexpenditure and analysing the sources of futurefunds and estimating the water fee to be collected.The project team developed an integrated informa-tion technology system for rapid data collection andmanagement of asset information.
The integrated information technology was usedto study the current situation of Cu Chi and DanHoai irrigation systems in Vietnam. The investmentprofile in Cu Chi and Dan Hoai shows that a largeinvestment is required in the next 15 years. Fullrenewal cost varies between US$41.00/ha andUS$28.00/ha in Cu Chi and US$33.00/ha andUS$22.50/ha in Dan Hoai at 3% and 9% interestrates.
The implementation of an asset-managementprogram delivers the following benefits:• the asset-management program enables the
management to estimate the actual cost ofproviding irrigation and drainage services andmakes it aware the financial viability of the IMCin the long term
A framework for improving the manageedited by Hector M. Malano, Biju
ACIAR Proceed(printed version pu
58
• GPS-based technology used for rapid datacollection of irrigation and drainageinfrastructure improves the capacity forsimultaneous on-site assessment of assetcondition
• the GIS-based asset-management software isdesigned in such a way that the same informationcan be readily replicated for other projects withminimal changes and can assist the IMC with thetask of improving maintenance and sustainabilityof the infrastructure.
References
Burton, M., Newcombe, W., Dedja, Y. and Key, T. 2003.Development and application of simplified assetmanagement procedures for transferred irrigationSystems. Irrigation and Drainage Systems, 17, 87–108.
Hofwegen, P.V and Malano, H.M. 1997. Hydraulicinfrastructure under decentralised and privatisedirrigation system management. In: Deregulation, decen-tralisation, and privatisation in Irrigation. GermanAssociation for Water Resources and Land Improvement,Bulletin 20, 179–205.
Malano, H.M., George, B.A. and Davidson, B. 2004. Assetmanagement modelling framework for irrigation anddrainage systems: principles and case study application.Irrigation and Drainage Systems, in press.
Tran, T.X.M., Malano, H.M. and Thompson, R. 2003.Application of the analytic hierarchy process to prioritiseasset renewals in the La Khe irrigation scheme, Vietnam.Journal of Construction, Engineering and ArchitecturalManagement, 10, 283–390.
ment of irrigation schemes in Vietnam A. George and Brian Davidsonings No. 118eblished in 2004)
PR118.fm Page 59 Thursday, September 2, 2004 1:04 PM
Assessing the Financial Viability of Irrigation Management Companies: a Case Study at Cu Chi,
Vietnam
Brian Davidson,*,1 Hector M. Malano† and Biju A. George†
Abstract
It has been argued that the provision of water is a service not a good. It could be argued that the providers of thoseservices play the most important role in the whole irrigation sector. For without them, the whole industry wouldcollapse. Because of their importance, or perhaps because of the enormous costs associated with providing theinfrastructure they control, many of these companies are publicly owned. Possibly as a consequence of theirownership structure, analysts have legitimately questioned the economic viability and management of thesefirms. The case is made that many of these companies do not run profitably, that they rely on governmentsubsidies to survive, that they do not spend enough on maintenance and that they run down their capital base.
Introduction
The purpose in this paper is to outline a methodwhich can be used to evaluate the financial viabilityof irrigation management companies (IMCs). Todemonstrate these techniques, the financial viabilityof a publicly owned IMC located at Cu Chi inVietnam is used. Of concern and contention in anyirrigation scheme is the price that the companyshould charge for water in order to recover costs inthe short run. It was found that the company couldnot operate without subsidies and did run down itsassets. Thus, it was not profitable or viable. It wasfound that there was a great disparity between whatthe consumers were charged for water and what thecompany received for supplying it.
* Institute of Land and Food Resources, University ofMelbourne, Victoria 3010, Australia.
† International Technologies Centre, Department of Civil and Environmental Engineering, University of Melbourne, Victoria 3010, Australia.
1 Corresponding author. Email: <[email protected]>.
ud
(printed version p
The Ethics of Running a Publicly Managed Company at a Loss
One of the most often cited claims of the problemsassociated with running publicly IMCs is theirapparent reliance on government subsidies to sur-vive. The clear implication of this claim is that thesecompanies do not collect enough fees from waterusers (mainly farmers) to cover their costs and, as aconsequence, are poorly run. This mismanagement,it is claimed, is having a detrimental effect on thewater sector, as markets are distorted, and that if thiscontinues into the future the companies will rundown their asset base.
Despite this, it could be argued that public com-panies should be judged differently from privateentities. Their aims, establishment and very exist-ence are different to privately owned companies. Itshould be asked: • how does a government entity face bankruptcy
when it has vast taxpayer funds behind it? • if governments set the pricing structure for water
supply companies how could a company trade its
ment of irrigation schemes in Vietnam A. George and Brian Davidsonings No. 118e
9
A framework for improving the manageedited by Hector M. Malano, BijACIAR Procee
5
ublished in 2004)

PR118.fm Page 60 Thursday, September 2, 2004 1:04 PM
way out of perceived difficulties by raisingprices?
• are rules governing the raising of investment for agovernment company very different to those thatapply to a privately owned company?
The only option to make the companies viable isto reduce costs, which may mean reducing servicelevels. Such an option may be unpalatable to a poorcountry reliant on irrigation to produce meagre foodsupplies. If a government wishes to run one of itsentities at a loss, in order to provide the people witha given return, why shouldn’t it? Isn’t this in someway similar to a private company operating a ‘loss-leader’ strategy? A legitimate activity of govern-ment is to determine the distribution of resources. Ifa government made the decision to distributeresources towards farmers and food production andaway from other sectors in the economy, all aneconomist can do is point out the costs and ramifi-cations of that decision, not pass comment on itsmorality.
However, this is not to say that IMCs could notrun more like privately owned companies. Govern-ments may prefer to reduce their subsidies andinvest in higher returning assets elsewhere in theeconomy. The Government of Vietnam has said thatin coming years it would wish to reduce and ulti-mately abolish subsidies for these companies, andwould do so on a gradual basis over a number ofyears (Le Quang Anh, Vietnam Institute for WaterResources Research, Hanoi, pers. comm.). Further,any differences in company ownership should notpreclude an analysis of public companies usingmeasures employed by privately owned companies.The measures themselves are readily acceptableprocedures that, if applied in an unbiased way,provide valuable information to the government andmanagers of these companies.
The Classification of Costs: Some Broad Distinctions
Irrigation companies incur a number of costs in pro-viding water services to farmers. Among thesecosts, a distinction must be made between economiccosts and financial (accounting) costs incurred inthe provision of irrigation services. Financial costsare the capital, operation and administrative costsinvolved in ensuring a sustainable provision of irri-gation water supply service (Rogers et al. 1997). In
A framework for improving the manageedited by Hector M. Malano, Biju
ACIAR Proceed(printed version pu
60
theory, they include those costs incurred by thecompany and recorded in the accounts of the com-pany. In practice, however, accounting standardsvary between countries and depreciation andrenewal costs may not be adequately identified. Amethod to identify asset depreciation costs for irri-gation and drainage infrastructure is described byMalano et al. (2004).
A definition of financial costs and economic costsis shown in Figure 1. In addition to financial costs,economic costs include all costs attributable to thecompany, including externalities which are not nor-mally recorded in the company accounts (Greig1998). This study is concerned with the identifica-tion of the financial costs involved in the provisionof irrigation and drainage services by irrigationcompanies. It is assumed that an economic valua-tion of economic cost items, such as externalities, isbeyond the scope of this study. In the Vietnamesecontext at least, externalities and the opportunitycost of capital are not accounted for in the sector’seconomic analysis and become actual costs tosociety.
The Procedures Involved in Financial Management
The procedures involved in financial managementassessments (hereinafter termed ‘the procedure’)would appear to follow a path common to many disci-plines. It involves first gathering relevant data andknowledge on the circumstances facing the firm in
Externalities
Opportunity cost of capital
Finance cost
Depreciation/replacementcosts of assets
Administration costs
Operation and maintenance
Eco
no
mic
co
sts
Fin
anci
al c
ost
s
Figure 1. Definition of economic and financial costs
ment of irrigation schemes in Vietnam A. George and Brian Davidsonings No. 118eblished in 2004)

PR118.fm Page 61 Thursday, September 2, 2004 1:04 PM
question, including understanding the firm’s aims andcore business. Then the appropriate tools are selected,the data are processed, the information is examinedand alternative policy recommendations are specified.While each of these tasks might appear to be discrete,in fact, one is dependent on the other.
Perhaps the issue that drives the procedure mostis to decide what is wanted from the analysis. TheIMCs in Vietnam are principally in the business ofregulating the flow of water. While it is easy to thinkof the core business as selling water, Vietnam is nota country in which that commodity could be said tobe scarce. Rather, what is scarce is the service ofcontrolling and managing water. The concerns ofIMCs in Vietnam primarily relate to the amount ofsubsidy received from the government, their ina-bility to raise prices, their need to meet future assetreplacement needs and the cost of maintaining thecurrent structure of the business (Chien 2001). Inother words, the stresses facing the companiesconcern liquidity, profitability, and asset manage-ment and structure.
The factors that govern the procedure are dataavailability. In Vietnam, financial information onindividual companies is very limited and its relia-bility subject to varying levels of doubt. Disre-garding the question of reliability, or assuming thatit is necessary to work with the data that are avail-able, a set of balance sheets was obtained for the CuChi IMC. For each, data were collected over aseven-year period, from 1996 to 2002. It should benoted that analysing a seven-year period requiressome assessment of the rate of inflation. Reliableestimates of the rate of inflation in Vietnam areavailable from the IMF (2004). In addition, if themeasures are to be expressed in US currency terms,changes in the US dollar–Vietnamese dongexchange rate over the period under investigationneed to be accounted for. Data on exchange rateswere also derived from the IMF (2004). Data werecollected on the income derived from water feesearned from farmers and from other sources. On theoutgoings side of the ledger, data were collected onthe costs of operating and maintaining the irrigationscheme, the number of staff employed, the salariespaid, any outstanding loan repayments, the amountspaid for water from the reservoir, administrationand insurance expenses and tax payments.
There are many variables that could be assessedto gauge the viability of the IMCs. These variablesrelate to all aspects of the business. The selection of
A framework for improving the manageedited by Hector M. Malano, Biju
ACIAR Proceed(printed version pu
61
relevant statistics should be governed by industrystandards and on the problem at hand. The measuresassessed in this study are summarised in Table 1.They can be segregated into revenue, expenditureand performance measures.
Malano and Burton (2001) suggest that averagetotal revenue can be used by a firm to reveal howmuch it earns for every piece of effort it performs.The higher the figure the better off the IMC wouldbe. In essence, the average revenue is the pricereceived by the IMC. The average total revenue canbe calculated by dividing the gross revenue col-lected by the area serviced (measure 1) or thevolume of water delivered (measure 2). Accordingto industry standards, and from a purely theoreticalstance, a measure by volume is preferred. After all,it could be argued that the volume of water is thetrue quantification of the product in question. How-ever, from a pragmatic stance, water is charged onan area basis in Vietnam, as flow data are bothscarce and unreliable. Gross revenue includes allsources of income, i.e. water fee revenues, otherincome and government subsidies. Hence, whilemeasures 1 and 2 reveal the revenue the IMCreceives, they are not the prices paid by consumers.
To calculate the consumers’ price, the water feerevenue earned by the IMC can be divided by thearea serviced (measure 3) or by the volume of waterdelivered (measure 4). The amount paid by the gov-ernment for irrigation can be calculated by dividingthe subsidy IMC receives by the area serviced(measure 5) and the quantity of water delivered(measure 6).
Expenditure can be assessed in two very differentways. First, at an aggregate level, the total expendi-ture can be divided by either the area serviced(measure 7) or the quantity of water delivered(measure 8) to yield what it costs the IMC, onaverage, to produce the product. The lower the com-pany’s costs, the more efficient it tends to be, in theshort run. As with the revenue measures, the waterindustry prefers measures by volume, yet pragma-tism means that area-serviced measures are morerevealing. Second, individual costs can be monitoredto observe which components have the greatest influ-ence on the company (measures 9a to 9j). Not only docosts that account for a large proportion of totalexpenditure need to be identified, but so too do thosethat change markedly. By assessing individual coststhe potential threats selected inputs have on the com-pany’s viability can be identified.
ment of irrigation schemes in Vietnam A. George and Brian Davidsonings No. 118eblished in 2004)

PR118.fm Page 62 Thursday, September 2, 2004 1:04 PM
The performance measures evaluated in this studywere, by and large, taken from Malano and Burton(2001). They are measures of how technically andmanagerially efficient an IMC is. It has been claimedthat, in many irrigation schemes, managers make littleattempt to maintain the operation of the scheme.
A framework for improving the manageedited by Hector M. Malano, Biju
ACIAR Proceed(printed version pu
Hence, the maintenance costs to gross revenue(measure 10) may provide a good indicator of howwell a system is maintained. However, interpretingthe measure can be difficult. A higher percentage maymean that the managers are dedicated to maintainingthe capital base of the scheme. Yet, it may also mean
62
Table 1. Summary of measures of financial viability
No. Name Ratio Units
Revenue measures
1 Average total revenue Gross revenue collected/Area serviced US$/ha
2 Gross revenue collected/Volume of water delivered US$/m3
3 Average water fee revenue Gross water fee revenue/Area serviced US$/ha
4 Gross water fee revenue/Volume of water delivered US$/m3
5 Average subsidy Government subsidy/Area serviced US$/ha
6 Government subsidy/Volume of water delivered US$/m3
Expenditure measures
7 Average total costs Total expenses/Area serviced US$/ha
8 Total expenses/Volume of water delivered US$/m3
9 Individual costs as a percentage of total expenses
9a power electricity Power costs/total expenses %
9b wages and salaries Wages and salaries/total expenses %
9c repairs and maintenance Repairs and maintenance/total expenses %
9d administration Administration costs/total expenses %
9e insurance Insurance/total expenses %
9f payment of loans Bank loans/total expenses %
9g water supply costs Water supply costs/total expenses %
9h water collection fee costs Water collection costs/total expenses %
9i taxes Taxes/total expenses %
9j summation
Performance measures
10 Maintenance cost to revenue Maintenance cost/Gross revenue collected ratio
11 Cost recovery Gross revenue collected/Cost of management, operation, maintenance ratio
12 MOM to area Cost of management, operation, maintenance/Area serviced US$/ha
13 Personal cost per employee Salary costs/Number employed US$/ha
14 Revenue collection performance Cost of collection/Gross revenue collected ratio
15 Revenue collection efficiency Gross revenue collected/Total leviable fees ratio
16 Balance, exc. subsidy (Gross revenue – govt. subsidy – total expenditure)/Area serviced US$/ha
17 inc. subsidy (Gross revenue – expenditure)/ Area serviced US$/ha
ment of irrigation schemes in Vietnam A. George and Brian Davidsonings No. 118eblished in 2004)

PR118.fm Page 63 Thursday, September 2, 2004 1:04 PM
that managers may need to spend more, as the capitalbase has been run down, or that they perform themaintenance tasks less efficiently. If the ratio remainsconstant over a number of years, then it can be sur-mised that the capital base has been maintained. How-ever, if it varies greatly, then it could be concludedthat the capital base has been run down. By assessingthe gross revenue divided by the cost of management,operation and maintenance (measure 11) an idea ofthe efficiency of the IMC can be gained. The largerthe ratio, the more efficient the company is. Effi-ciency can be improved by either increasing output orthus revenue, or by reducing the inputs, which in turnreduces the costs of operation. The importance of thiscan be further highlighted by assessing the costs ofmanagement, maintenance and operation in compar-ison with the area serviced (measure 12). This ratio,unlike the previous one (measure 11), compares anindicator of input usage to a constant output. A low orfalling ratio reveals an improvement by the company.In a similar vein, some indicator of the salary costs tothe number of employees (measure 13) provides agood gauge of the efficiency of labour. This ratio, likemeasure 10, is difficult to interpret. Some constancyin the measure over a number of years is to be desired.In Vietnam, much anecdotal information has beencollected on the inability of IMCs to collect therevenue they are due (Le Quang Anh, Vietnam Insti-tute for Water Resources Research, Hanoi, pers.comm.). A company’s performance in this area can begauged by assessing the cost of collection divided bythe revenue collected (measure 14). One might expectthat the lower the percentage the more efficient therevenue collection fees are. Revenue collection effi-ciency (measure 15) measures the ratio of what isactually collected to what could be collected. Todetermine what could be collected in water fees, thewater fees set by the provincial government are mul-tiplied by the area serviced. Finally, it is necessary toassess the IMC’s bottom line. This is a ratio of whatthey earn less total expenses divided by the area serv-iced. Given that the firms appear to rely on subsidiesto survive, two measures of what they earn can beused. The first relies on total gross income (measure16) and the second relies on gross income less subsi-dies (measure 17). In both cases, the higher the figurethe better off the company is. Yet, they could be neg-ative. In this case, rather than revealing the net incomeper hectare, what is yielded is the loss per hectare. Thefigure reveals the net income per hectare earned orlost by the operation.
A framework for improving the manageedited by Hector M. Malano, Biju
ACIAR Proceed(printed version pu
63
The Cu Chi Irrigation Management Company
Even though individual firms operate in the sameindustry, each firm operates under different sets ofcircumstances and conditions. While the same set ofmeasures can be applied to each firm, and similarrecommendations made upon an assessment of themarginal conditions facing each firm, it is impos-sible to make any significant comparisons betweenfirms. Exercises that attempt to do this, often knownas benchmarking studies, are fraught with theoret-ical and methodological inconsistencies. Thepurpose in this section is to briefly outline the con-ditions and circumstances under which the Cu ChiIMC operates.
The Cu Chi IMC supplies water to the Cu Chi irri-gation scheme. It is based in Ho Chi Minh CityProvince and gets its water from the Dau Tieng Damin Tay Ninh Province. The IMC is required to pur-chase water from the government in Tay Ninh Prov-ince. The scheme is a gravity-fed system ofchannels that is not reliant on pumping. In 2003there were 283 people employed, some of themcasual employees. To operate the company somestaff are located at seven stations throughout thescheme. These stations act as the link between thefarmers and the company. The farmers are organ-ised into 82 water users associations all basedaround either one or two tertiary canals. Thecompany has three functions:• Operate the scheme by governing the flow and
direction of water: It does this at each station bymeasuring the depth of water as a means ofcalculating the flow in different canals. If thewater is determined to be inadequate, the stationstaff contact head office from where staff ring thereservoir authority and ask for more water.
• Schedule the water used in the system: Inundertaking this task, station staff meets with theleaders of water user associations to determinefuture demand.
• Collect revenues from users: This task isperformed by the station leader who, with arepresentative of the water users association,visits each farmer and attempts to garner as muchof the owed fee as possible. The provincial government sets water fees. In Ho
Chi Minh City Province, the fee is US$20/ha/year.It is calculated according to a formula where eachfarmer must pay, for each hectare, a cost equivalent
ment of irrigation schemes in Vietnam A. George and Brian Davidsonings No. 118eblished in 2004)

PR118.fm Page 64 Thursday, September 2, 2004 1:04 PM
to the value of 135 kg of rice grown in the winter–spring season and 165 kg/ha per year for rice grownin the summer–autumn season. These fees changeonly according to the price of rice, which is cur-rently set at US$0.066 per kg. The formula has notbeen varied since its inception. Further, regardlessof what is grown, the water fee is calculatedaccording to what it would be if only rice were pro-duced. While the pricing formula is given, it maynot reflect the price charged by the company, as ahistory of fee default exists and not all the areaavailable for cropping is irrigated.
The Financial Viability of the Cu Chi Company
The results of the analysis conducted on the Cu ChiIMC are presented in Table 2. Reliable data from thecompany’s financial balance sheet were obtainedfrom 1996 to 2002. From these data, it was possibleto obtain some idea on most of the 17 revenue,expenditure and performance measures.
In nominal terms, the average revenue of the CuChi IMC rose from approximately US$20.41/ha in1996 to US$33.61/ha in 2002. The rise in earningscan be seen in the returns per volume, which rosefrom US cents 0.04/m3 in 1996 to US cents 0.10/m3
six years later. The greatest rise occurred in the lastyear. If the company’s earnings from fees levied onits consumers alone are considered, then the reve-nues for water rose by 128% between 1996 and2002, to over US$12.32/ha. Marsh et al. (2004) sur-veyed the fees producers paid for water. They foundthat farmers paid US$24.00/ha. The differencebetween the two values possibly reflects the degreeto which the company has a bad debt problem andthe difficulties associated with collecting waterfees. The residual between total earnings and earn-ings from water fees is made up by government sub-sidy, which rose by approximately 40% over theperiod, to US$20.90/ha in 2002.
What can be concluded from this analysis is that,in 2002, the price the company received for itsefforts was US$33.61 for every hectare it serviced.The consumers on average paid US$12.32/ha forwater services. The government contributedUS$20.90 for every hectare serviced, the differencebeing made up from the sale of other services. Thesefigures reveal the major weakness inherent in thecompany. That is, that it is totally reliant on govern-
A framework for improving the manageedited by Hector M. Malano, Biju
ACIAR Proceed(printed version pu
64
ment subsidies for survival. Over 62% of its revenuecame from subsidies. The gap between what theconsumers (in this case farmers) pay for water andwhat the company receives is so large that any with-drawal of the subsidies might force the closure ofthe operation.
Irrigation management companies that receivesubsidies experience all the uncertainties associatedwith the fear that they may be removed at any time.By receiving a subsidy, the companies face greaterrisks as their fortunes are now not only subject to theuncertainties that exist in agriculture and in thewater markets within which they operate, but arealso subject to all the macroeconomic and cross-sectorial issues facing the government. The efficientmanagement of people and processes is at the centreof economic growth. IMCs that have efficient man-agement structures make money. Finally, of crucialconcern to IMCs is asset management, as they tendto be decreasing cost industries. Their very exist-ence is dependent on the investment that has beenmade in the infrastructure. A failure to look afterassets will result in the demise of the company.
In 1996, the Cu Chi IMC needed US$22.78/ha toservice its clients. These costs rose to US$38.22/hain 2002, an increase of nearly 68%. Total expendi-ture rose greatly at the end of the period and yet wassomewhat stable during the early and middle yearsat between US$0.05 and US$0.08 for every m3
delivered. Not once between 1996 and 2002 did theCu Chi IMC’s revenues (which included earningsfrom all sources) meet its expenditure. At an indi-vidual cost level, three items account for most of thecosts. Two of them (administration and salaries,which account for between 40% and 65% of allcosts) can and need to be contained. Further, theircontribution to total expenditure is highly unstable.The company’s exposure to its other major cost, thecost of water from the reservoir, would appear to bedeclining. The amount of total expenditure spent onmaintenance, between 3% and 8% would appear tobe low and volatile. The company needs to containits costs, particularly those associated with staff, if itis to be considered viable in the long run. Such via-bility could be threatened if the scheme is not ade-quately maintained.
In terms of performance, it would appear that themeasure of maintenance to revenue (measure 10) islow and erratic over the period under investigation.It varies from a high in 1996 of 23 to a low of only8 in 2002. Yet the ratio first fell, then rose, before
ment of irrigation schemes in Vietnam A. George and Brian Davidsonings No. 118eblished in 2004)
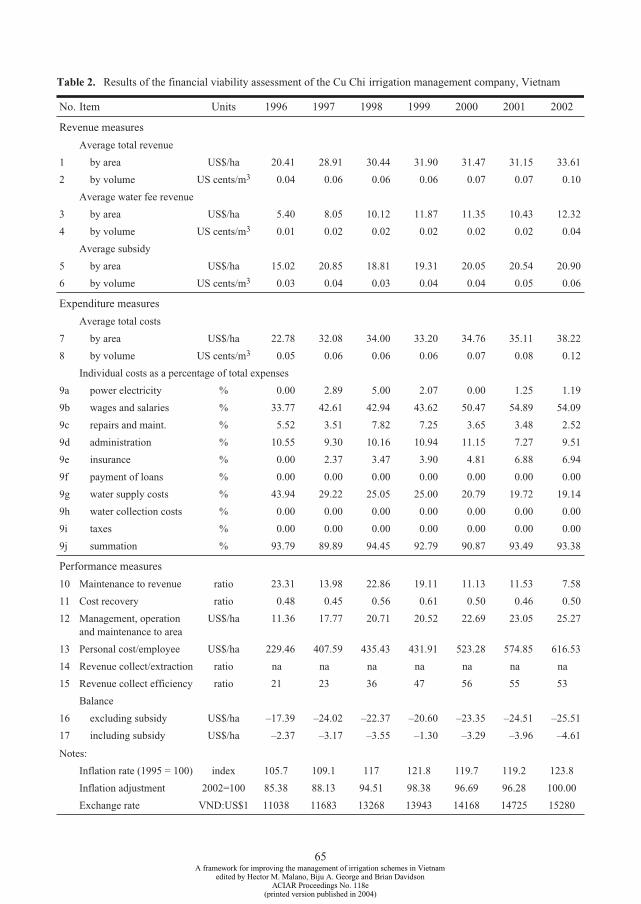
PR118.fm Page 65 Thursday, September 2, 2004 1:04 PM
Exchange rate VND:US$1 11038 11
A framework for improving the manageedited by Hector M. Malano, Biju
ACIAR Proceed(printed version pu
83 13268 13943 14168 14725 15280
65
Table 2. Results of the financial viability assessment of the Cu Chi irrigation management company, Vietnam
No. Item Units 1996 1997 1998 1999 2000 2001 2002
Revenue measures
Average total revenue
1 by area US$/ha 20.41 28.91 30.44 31.90 31.47 31.15 33.61
2 by volume US cents/m3 0.04 0.06 0.06 0.06 0.07 0.07 0.10
Average water fee revenue
3 by area US$/ha 5.40 8.05 10.12 11.87 11.35 10.43 12.32
4 by volume US cents/m3 0.01 0.02 0.02 0.02 0.02 0.02 0.04
Average subsidy
5 by area US$/ha 15.02 20.85 18.81 19.31 20.05 20.54 20.90
6 by volume US cents/m3 0.03 0.04 0.03 0.04 0.04 0.05 0.06
Expenditure measures
Average total costs
7 by area US$/ha 22.78 32.08 34.00 33.20 34.76 35.11 38.22
8 by volume US cents/m3 0.05 0.06 0.06 0.06 0.07 0.08 0.12
Individual costs as a percentage of total expenses
9a power electricity % 0.00 2.89 5.00 2.07 0.00 1.25 1.19
9b wages and salaries % 33.77 42.61 42.94 43.62 50.47 54.89 54.09
9c repairs and maint. % 5.52 3.51 7.82 7.25 3.65 3.48 2.52
9d administration % 10.55 9.30 10.16 10.94 11.15 7.27 9.51
9e insurance % 0.00 2.37 3.47 3.90 4.81 6.88 6.94
9f payment of loans % 0.00 0.00 0.00 0.00 0.00 0.00 0.00
9g water supply costs % 43.94 29.22 25.05 25.00 20.79 19.72 19.14
9h water collection costs % 0.00 0.00 0.00 0.00 0.00 0.00 0.00
9i taxes % 0.00 0.00 0.00 0.00 0.00 0.00 0.00
9j summation % 93.79 89.89 94.45 92.79 90.87 93.49 93.38
Performance measures
10 Maintenance to revenue ratio 23.31 13.98 22.86 19.11 11.13 11.53 7.58
11 Cost recovery ratio 0.48 0.45 0.56 0.61 0.50 0.46 0.50
12 Management, operation and maintenance to area
US$/ha 11.36 17.77 20.71 20.52 22.69 23.05 25.27
13 Personal cost/employee US$/ha 229.46 407.59 435.43 431.91 523.28 574.85 616.53
14 Revenue collect/extraction ratio na na na na na na na
15 Revenue collect efficiency ratio 21 23 36 47 56 55 53
Balance
16 excluding subsidy US$/ha –17.39 –24.02 –22.37 –20.60 –23.35 –24.51 –25.51
17 including subsidy US$/ha –2.37 –3.17 –3.55 –1.30 –3.29 –3.96 –4.61
Notes:
Inflation rate (1995 = 100) index 105.7 109.1 117 121.8 119.7 119.2 123.8
Inflation adjustment 2002=100 85.38 88.13 94.51 98.38 96.69 96.28 100.00
6
ment of irrigation schemes in Vietnam A. George and Brian Davidsonings No. 118eblished in 2004)

PR118.fm Page 66 Thursday, September 2, 2004 1:04 PM
falling quite significantly. In terms of cost recoveryby the Cu Chi IMC, a measure of its efficiency, itwould appear that the revenue accounts for onlysomewhere near half of the expenditure on manage-ment, maintenance and operation. Not only that, butthe figure is highly erratic, rising to 61% in 1999,before falling back to around 50%. The rises areassociated with an improvement in efficiency, whilea fall has the opposite effect. The costs of manage-ment, maintenance and operations per hectare, andthe costs per employee, appear to have risen signif-icantly between 1996 and 2002. Of these two indi-cators, it would appear that salary costs to employeenumbers is nearly out of control, rising nearly169%. It should be noted that this rise is possiblyoverstated, as it was calculated on the currentemployment profile of 285 employees. However,even if it is assumed that half those numbers wereemployed in 1996, the rise is still sizeable. Finally,while the efficiency of revenue collection is rising,from approximately 21% in 1996 to around 55% in2001, it is still not adequate (see measure 15). Thisstatistic reveals that, for whatever reason, the IMCin a good year collects only a little more that half therevenue it could obtain if the government’s feestructure was applied to the region and was col-lected.
The Cu Chi IMC runs at a loss. The size of theloss was approximately US$4.61/ha in 2002.During the period under investigation, the companynever operated at a profit in any year. This loss isfurther compounded by the fact that the revenuesupon which it is based include a sizeable subsidy. Ifthe subsidy is removed, then the losses increase. In2002, the Cu Chi IMC’s losses would have beennearly US$25.51/ha serviced.
What makes these figures so startling and wor-rying from a company perspective, is not neces-sarily their size, but what is excluded from theanalysis. The expenditure data make no allowancefor capital renewal. Malano et al. (2004) have esti-mated that cost of renewing the assets would requirean additional annuity of between US$33/ha andUS$50/ha each year, depending on the degree ofmaintenance undertaken and the rate of interest.They also highlight the low level of maintenanceexpenditure by the company, suggesting that assetsare decaying at a rapid rate. It is as if the company isusing the asset as if it were a non-renewableresource. Once it depreciates and eventually breaksdown, it will need to be scraped or rebuilt.
A framework for improving the manageedited by Hector M. Malano, Biju
ACIAR Proceed(printed version pu
66
The analysis was entirely based on recurrentcosts. The sustainability of the company and systemoperations, however, depends on the ability tosupport its recurrent cost and sustain its asset base inperpetuity. From a company perspective, thisimplies the ability to renew its asset base when thecurrent assets reach the end of their economic life.The expenditure data displayed in Table 2 make noallowance for capital renewal.
The balance sheet was analysed to estimate thecost for different services of the company. The costsof operation of the Cu Chi IMC can be grouped intoeight categories:• asset cost• power cost for irrigation and drainage• personnel cost which includes salaries paid to
full-time, part-time and casual staff• repairs and maintenance• administration• insurance• bulk water fee, which includes the fee paid to
Dau-Tieng reservoir for obtaining water• miscellaneous expenses.
The comparison of the total service costs,including the asset replacement annuity for theperiod 1996 to 2002, is presented in Figure 2.Details of this analysis are presented in a paper byMalano et al. (2004). The full cost of providing irri-gation and drainage service at Cu Chi is estimated tobe US$75.03/ha during 2002. The analysis revealedthat here is a steady increase in the staff salary com-ponent in different years, a trend which may con-tinue in the future. There is no difference in bulkwater fee in different years. But in future there is achance that the reservoir may charge a higher pricefor water which will increase the cost of operation.
Currently, the Cu Chi IMC is charging users only32% of the actual cost of providing irrigation anddrainage service. This will affect the long-term sus-tainability of the company. Marsh et al. (2004)assessed the economic circumstances of farmers inthe Cu Chi irrigation system based on the results ofa survey of farmers. They found that, on surveyedfarms, the water fees only represented 3.3% of thegross cropping income and 1.6% of total farm cost.Total net farm income (gross income less costs)averaged US$1853.30/ha. Under these circum-stances, it may be tempting to raise the level ofwater fees to close the gap between what farmerspay and what would be required to run the scheme ina viable manner. However, such a policy may have
ment of irrigation schemes in Vietnam A. George and Brian Davidsonings No. 118eblished in 2004)

0
10
20
30
40
50
60
70
80
1996 1997 1998 1999 2000 2001 2002
Year
US$
/ha
Cost of ServiceWater Fee Income
PR118.fm Page 67 Thursday, September 2, 2004 1:04 PM
significant implications for the current croppingsystem, as the winter–spring and summer–autumnrice crops may not be financially viable. Also, thereal economic situation of the farmers needs to beinvestigated as the landholding is too small in theseirrigation schemes.
Conclusions
It was argued that the concerns of IMCs in Vietnamrevolved around issues of raising enough revenue tocover costs, their reliance on subsidies from the gov-ernment and whether they maintain their assets.
It was found in Cu Chi that the IMC should be con-cerned on a number of fronts. First, it is heavilyreliant on government subsidies. Its expenditure wasUS$4.61/ha above its earnings. If subsidies wereremoved from the company, it would lose approxi-mately US$25.51/ha. The price paid by consumers isonly US$12.32 /ha, relatively small in comparison tothe expenditure needed to operate, manage and main-tain the scheme. Further, the company has a numberof costs that would appear to be out of control. Thedegree to which maintenance is carried out must alsobe questioned.
Perhaps of greatest concern is the issue of payingfor maintenance and asset renewal. Letting assets rundown threatens the long-run viability of the com-pany. Given the amount of capital that is required toregulate water flows, asset renewal and replacement
A framework for improving the manageedited by Hector M. Malano, Biju
ACIAR Proceed(printed version pu
67
is an issue that needs to be addressed. While it wasnot within the scope of this study to assess these long-run issues, it should be noted that the company doesnot have a strategy for collecting and quarantiningfunds for this purpose. If it did, then the operatingexpenses and the costs of running the scheme wouldbe considerably higher.
The full cost of providing an irrigation and drainageservice at Cu Chi was estimated to be US$75.03/haduring 2002. The analysis also showed that there hasbeen a steady increase in staff salaries in differentyears, a trend which may continue in the future.
Currently, the Cu Chi IMC is charging users only32% of the actual cost of providing an irrigation anddrainage service. This will affect the long-term sus-tainability of the company.
References
Chien, N.V. 2001. Water resources management in Vietnamand the need for change in water fee policy. In: Brennan,D., ed.. Water policy reform: lessons from Asia andAustralia. Canberra, ACIAR Proceedings No. 106, 206–208.
Greig, J. 1998. Some practical perspectives on water pricingreform from an agricultural viewpoint. Sustainablemanagement of water in agriculture: issues and policies.OECD Proceedings, The Athens Workshop 113–131.
IMF (International Monetary Fund) 2004. Internationalfinancial statistics. Washington, IMF.
Figure 2. Comparison of renewal-based service cost with water fee income
ment of irrigation schemes in Vietnam A. George and Brian Davidsonings No. 118eblished in 2004)

PR118.fm Page 68 Thursday, September 2, 2004 1:04 PM
Malano, H.M and Burton, M. 2001. Guidelines forbenchmarking performance in the irrigation and drainagesector. Rome, Food and Agriculture Organization of theUnited Nations, 44p.
Malano, H.M., George, B.A. and Davidson, B. 2004. Assetmanagement modelling for infrastructure management inVietnamese irrigation management companies. Theseproceedings.
A framework for improving the manageedited by Hector M. Malano, Biju
ACIAR Proceed(printed version pu
68
Marsh, S., Davidson, B., Le Quang Anh and Trinh Thi Long2004. Assessing the impacts of water flows on users: agross margins analysis of farms. These proceedings.
Rogers, B., Bhatia, R. and Huber, A. 1997. Water as a socialand economic good: how to put the principle into practice.24p. Retrieved: 15 May 2004 from:<http://members.tripod.com/~jzjz/watroger.html>.
ment of irrigation schemes in Vietnam A. George and Brian Davidsonings No. 118eblished in 2004)

PR118.fm Page 69 Thursday, September 2, 2004 1:04 PM
Assessing Institutional and Pricing Arrangements in Order to Improve Water-Use Efficiency and Viability
Mike Bryant,* Brian Davidson,†,1 Tim McGrath§ and Le Quang Anh¶
Abstract
To run an irrigation management company requires more than an eye to the costs and services provided. Onemust also operate in a legal and institutional framework. In most countries, legislation exists to control how thewater industry can operate and what it can charge. These laws will affect how each scheme operates. In muchof the developing world, water supplies are not measured objectively. As a consequence, area-based chargingis undertaken rather than the much preferred volumetric charging. Area-based charging requires a largeadministrative framework if it is to be effective, a structure that has a number of deficiencies. What is proposedin this paper is a method of moving towards a system of partial volumetric charging.
Introduction
The purpose in this paper is to come to terms withthe importance of understanding that institutionalarrangements can play a critical role determiningthe outcomes of the operation of an irrigationscheme. The problem with undertaking this task isthat the institutional arrangements under whicheach scheme operates are different. As a conse-quence, the best way to demonstrate the importanceof institutional arrangements is through an example.The example chosen is how to implement volu-metric pricing into a scheme that has area-based
* Deceased† Institute of Land and Food Resources, University of
Melbourne, Victoria 3010, Australia.§ University of Queensland, Queensland 4072, Australia.¶ Vietnam Institute for Water Resources Research, Hanoi,
Vietnam.1 Corresponding author.
Email: <[email protected]>.
edited by Hector M. Malano, BijuACIAR Proceed
(printed version p
pricing. This was a problem faced by the managersof the La Khe irrigation scheme in Vietnam.
It has been argued that volumetric pricing forwater would improve the efficiency of irrigationwater delivery over the area-based pricing systemcurrently in place in many countries around theworld. Many of the arguments put forward in favourof volumetric charging ignore the institutionalreforms that would be needed to implement such achange. In this paper, a process is suggested bywhich a volumetric charge, albeit a partial one,could be implemented. It is argued that water usersassociations (WUAs) should evolve over a longperiod to represent farmers’ interests. These organ-isations would buy and pay for water from a water-supply company on a volumetric basis, and dis-tribute it to farmers who would pay for it on an areabasis. Using the example of the La Khe irrigationscheme, it was found that, if the changes wereimplemented, farmers had the potential to reducethe amount they spent on water. However, existinginstitutional arrangements prevent these reformsfrom being undertaken at present.
ment of irrigation schemes in Vietnam9
A framework for improving the manage6
A. George and Brian Davidsonings No. 118e
ublished in 2004)

PR118.fm Page 70 Thursday, September 2, 2004 1:04 PM
How to Evaluate Changes in Institutional Structures
Any change, be it a technical one or a managementrevolution, needs to be monitored. It must be asked:upon what basis would any changes in managementand pricing be considered successful? It wouldseem that significant improvement in four areaswould be the most important indicators:• the distribution and reliability of water provided
to farmers• water fee collection rates• the operation and maintenance of the scheme,
both within the secondary canals where WUAsgovern and over the scheme as a whole
• the social standing, incomes and status offarmers.Of course, the overriding criterion that must
govern all change is whether or not it is actuallyimplemented. Without implementation, evaluationof these other issues is superfluous.
Measuring and monitoring the evolution of theproposals, over a significant period, will determinewhether the reforms have been successful. If it tran-spires that the proposals are not ideal, and do notresult in the expected benefits, then they can beabandoned. If the evolution is handled slowly, thenthe costs of not meeting these targets will be mini-mised.
Existing and Proposed Management Structures
In order to change any institutional system, it is firstnecessary to be able to describe both the existingand proposed procedures. In addition, it is essentialto have a strategy for moving from the existingarrangements to the proposed ones. These tasks areexamined in this section of the paper.
An overview of the existing and proposed man-agement and pricing structures is presented inFigure 1. The way water is currently ordered anddistributed into secondary canals within irrigationschemes is a problem. The traditional approach inLa Khe has been for water-management groupswithin each cooperative/commune to assessfarmers’ seasonal water requirements and submitthese to the La Khe irrigation management company(IMC). The IMC would deliver water into theappropriate secondary canal, from where it is then
A framework for improving the manageedited by Hector M. Malano, Biju
ACIAR Proceed(printed version pu
70
distributed to different fields. The IMC bills eachcooperative/commune for water used according toan area-based formula which incorporates a differ-ential fee schedule according to whether or notwater can be delivered to fields by gravity. The IMCpays the cooperatives and/or communes to collectthe water fees from each farmer. Thus, a rathercomplex billing arrangement exists.
This management arrangement works reasonablywell if there is only one cooperative on a secondarycanal. The problem in La Khe is that, in general, sec-ondary canals can be used to service two, and some-times up to four, cooperatives. There has been atendency for a ‘first come-first served’ rule tooperate. So farmers in cooperatives near the head ofthe secondary canals get most of the water, to the det-riment of those downstream. Further, cooperatives/communes sharing access to the same secondarycanals have generally operated independently of oneanother, especially in respect to both water orderingand in resolving issues of common concern, such asidentification of canal maintenance needs.
In order to resolve these inherent problems, it isnecessary to change the structures that manage irri-gation water and the methods of pricing it (seeFigure 1). Water users associations need to beempowered to represent farmers and should not behindered by other concerns that might arise at acommune/cooperative level. Empowering WUAs toundertake these tasks involves a two stage proce-dure. In the initial phase, water user advisory com-mittees (WUAC) would be established. This two-stage procedure would occur over a three to four-year period in order to allow all those involved inthe process to adjust slowly. These groups need tobe based around secondary canals and would takeover the water-scheduling and fee-collecting tasksfrom the cooperatives/communes. They would buywater from the IMC and would charge individualfarmers. Further, any disputes amongst farmerswould be be raised and resolved within the WUA,rather than in some cases between different cooper-atives/communes.
Water Pricing Arrangements
The second element of the process is the need toreform water-pricing arrangements. Water is cur-rently sold according to the area of crop to be serv-iced, and the amount is discounted where watercannot be delivered under full gravity feed. On
ment of irrigation schemes in Vietnam A. George and Brian Davidsonings No. 118eblished in 2004)

PR118.fm Page 71 Thursday, September 2, 2004 1:04 PM
Physicalsystem
Primarycanals
Secondarycanals
Tertiarycanals
Wat
er c
om
pan
yW
ater
use
rs a
sso
ciat
ion
Farm
ers
Are
a b
ased
Volu
me
bas
ed
Wat
er s
up
ply
co
mp
any
Farm
ers
Co
mm
un
e/co
op
erat
ive
Are
a b
ased
Existing structure
ControlCharges
Proposed structure
Control Charges
Figure 1. An overview of the existing and proposed structuresfor the supply of water in the La Khe irrigationscheme, Vietnam
average, each farm in La Khe comprises 6.7 sao ofgravity-fed irrigation, 2.3 sao of partial-gravity irri-gation, and 4.9 sao of non-gravity irrigation.1 Underthe current management structure and water moni-toring arrangements, this is the most practical wayto sell water. Because the price charged is notrelated to the volume sold, it is considered thatwhere farmers have access to adequate water sup-plies, they have no incentive to use it sparingly.
It is proposed that water should be chargedaccording to a two-part formula to be levied initiallyon the WUAs and then passed on by the WUAs tothe farmers. The initial part of the fee is based on thevolume sold, while the other part passed on tofarmers is based on the area serviced. The totalvolume of water sold to the WUA could be recordedand used to calculate the variable part of the watercosts (such as the electricity used for pumping irri-
1 1997/98 survey of farm income and expenditure.
A framework for improving the manageedited by Hector M. Malano, Biju
ACIAR Proceed(printed version pu
71
gation water). This could be called the ‘volumetricfee’. The area of land that can be irrigated from eachsecondary canal can be used to calculate the fixedpart of the water supply costs (such as maintenanceand administration costs), and for ease of explana-tion could be called the ‘area fee’.
Thus, it is in the interests of the WUAs to buy thesmallest quantity of water possible, just enough tosupply its needs, as it is buying and paying for wateron a volumetric basis. It is also in its interests to dis-tribute it equitably, as farmer members pay forwater on an area basis.
The Performance of the Changes
In La Khe, it would appear that any move towardsimplementing these changes has failed to materi-alise after the WUACs were established before theWUAs. The reason for this failure would appear tolie in a misunderstanding of the existing power
ment of irrigation schemes in Vietnam A. George and Brian Davidsonings No. 118eblished in 2004)

PR118.fm Page 72 Thursday, September 2, 2004 1:04 PM
arrangements amongst cooperatives/communes.McGrath (2003) argued that collective control overagricultural production in Vietnam eroded in thelate-1970s and the early 1980s, to a much largerextent than envisaged or desired by the Governmentof Vietnam. Villagers and local cadres tended toresist central directives that conflicted with theirown interests. They often colluded to circumventstate regulations. In the north of Vietnam, during the1990s, collectives retained a stronger influence overproduction than envisaged by national policymakers. In the south, by contrast, most collectiveswere disbanded and alternative institutionalarrangements established. Given that the extent towhich policies can be implemented depends on hownetworks of power are organised, it is necessary todetermine what happened at the local level.McGrath (2003) argues ‘… that whether policieswere or were not applied was in large part deter-mined by the relationship between Party and villagepower structures … traditional kinship and patron–protégé relations deeply embodied in Vietnameseculture and society continued to influence relationsbetween peasant farmers and state authorities’.
Conclusions
It is argued that, in order to get any efficiency inwater use, it is necessary to price so that any chargeis based on the quantity used. To make these chargespossible, a number of changes need to be made to
A framework for improving the manageedited by Hector M. Malano, Biju
ACIAR Proceed(printed version pu
72
the management structures associated with water.However, the process of implementing volumetricprices in Vietnam is at least difficult, due to institu-tional shortcomings, if not impossible due to thenature of irrigated agriculture. What results fromthis paper is a process by which the correct institu-tional arrangements could be put in place in advanceof a funding formula that allows for limited volu-metric pricing. The pricing formula works on theWUAs buying water on a volumetric basis andcharging farmers on an area basis. Such an approachmay lead to significant water savings, as it is in theinterest of WUAs to buy as little water as possibleand thus pass on the savings to producers.
The problem with the approach is that it funda-mentally changes the existing balance of power inthe cooperatives/communes. Any change in thebalance of power, especially in favour of farmers,diminishes those currently in power. Attempts toimplement these changes in La Khe during the late1990s met considerable resistance. The trials even-tually failed well short of reaching any maturestage. Implementation of these arrangements willrequire some fundamental changes in philosophyamong farmers, irrigation system administratorsand government agencies.
Reference
McGrath, T. 2003. Vietnamese agricultural policy. PhDthesis, University of Queensland, Australia.
ment of irrigation schemes in Vietnam A. George and Brian Davidsonings No. 118eblished in 2004)