a framework for bim model-based construction cost
TRANSCRIPT
A FRAMEWORK FOR BIM MODEL-BASED CONSTRUCTION COST
ESTIMATION
A Thesis
presented to
The Faculty of California Polytechnic State University,
San Luis Obispo
In Partial Fulfillment
of the Requirements for the Degree
Master of Science in Civil and Environmental Engineering
by
Michael Thomas Clark
June 2019

ii
© 2019
Michael Thomas Clark
ALL RIGHTS RESERVED
iii
COMMITTEE MEMBERSHIP
TITLE:
A Framework for BIM Model-Based
Construction Cost Estimation
AUTHOR:
Michael Thomas Clark
DATE SUBMITTED:
June 2019
COMMITTEE CHAIR:
Hani S. Alzraiee, Ph.D. PE PMP
Assistant Professor of Civil and Environmental
Engineering
COMMITTEE MEMBER: Charles Chadwell, Ph.D. PE
Department Chair and Professor of Civil and
Environmental Engineering
COMMITTEE MEMBER:
Erik P. Kasper, Ph.D. PE
Professor of Civil and Environmental
Engineering
iv
ABSTRACT
A Framework for BIM Model-Based Construction Cost Estimation
Michael Thomas Clark
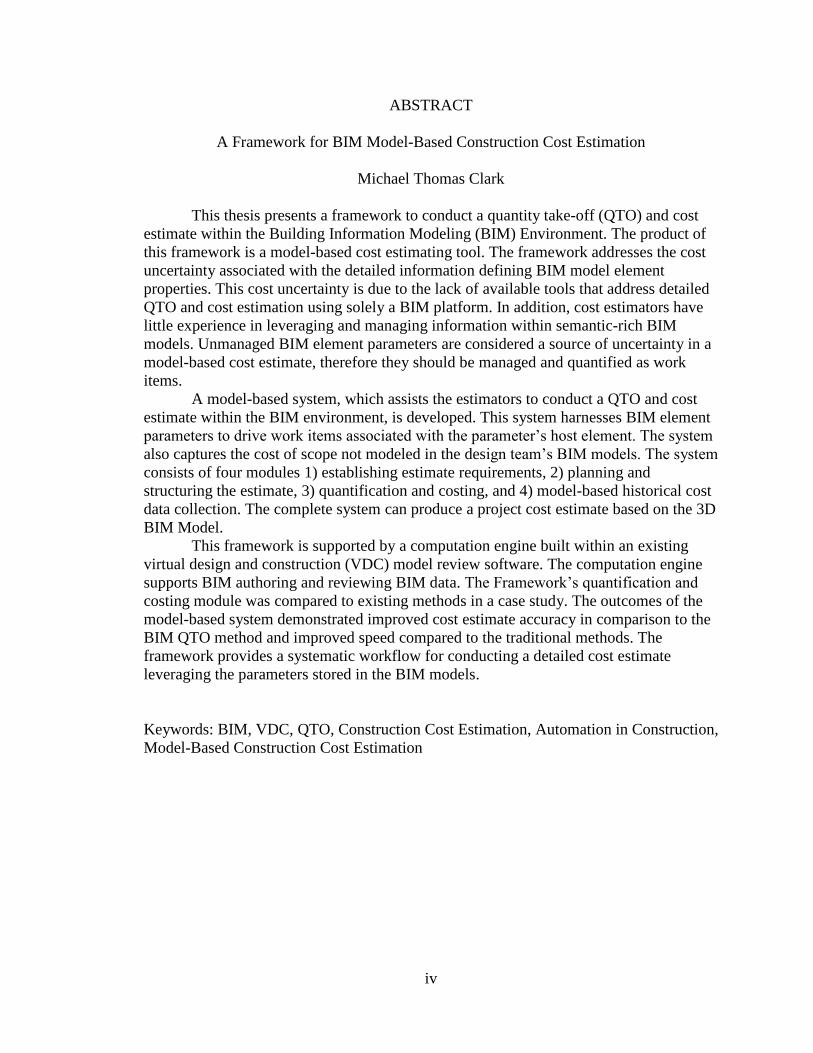
This thesis presents a framework to conduct a quantity take-off (QTO) and cost
estimate within the Building Information Modeling (BIM) Environment. The product of
this framework is a model-based cost estimating tool. The framework addresses the cost
uncertainty associated with the detailed information defining BIM model element
properties. This cost uncertainty is due to the lack of available tools that address detailed
QTO and cost estimation using solely a BIM platform. In addition, cost estimators have
little experience in leveraging and managing information within semantic-rich BIM
models. Unmanaged BIM element parameters are considered a source of uncertainty in a
model-based cost estimate, therefore they should be managed and quantified as work
items.
A model-based system, which assists the estimators to conduct a QTO and cost
estimate within the BIM environment, is developed. This system harnesses BIM element
parameters to drive work items associated with the parameter’s host element. The system
also captures the cost of scope not modeled in the design team’s BIM models. The system
consists of four modules 1) establishing estimate requirements, 2) planning and
structuring the estimate, 3) quantification and costing, and 4) model-based historical cost
data collection. The complete system can produce a project cost estimate based on the 3D
BIM Model.
This framework is supported by a computation engine built within an existing
virtual design and construction (VDC) model review software. The computation engine
supports BIM authoring and reviewing BIM data. The Framework’s quantification and
costing module was compared to existing methods in a case study. The outcomes of the
model-based system demonstrated improved cost estimate accuracy in comparison to the
BIM QTO method and improved speed compared to the traditional methods. The
framework provides a systematic workflow for conducting a detailed cost estimate
leveraging the parameters stored in the BIM models.
Keywords: BIM, VDC, QTO, Construction Cost Estimation, Automation in Construction,
Model-Based Construction Cost Estimation

v
ACKNOWLEDGMENTS
This work is dedicated to my family and friends. They are incredibly supportive.
I’d especially like to thank my mother Liz, for her editing and computer science support.
And to my father Greg who contributed his ideas and passion for construction. Their love
and support helped immeasurably.
I am incredibly grateful for the guidance and advice provided by my advisor, Dr.
Hani S. Alzraiee. This was his first year as a professor at Cal Poly and I admire how he
hit the ground running. He is an incredible mentor and advisor, who challenged me to
grow throughout this process. I am grateful that he provided advice and guidance to
complete the thesis on time.
I’d like to thank Dr. Charles Chadwell, Civil Engineering Department Chair, for
serving as a committee member. I appreciate his blend of knowledge that spans structural
engineering and construction. He has been devoted to developing the construction
engineering program within our department. This program is materializing, and I am
proud to be a part of it. I am incredibly grateful to him for developing this opportunity.
Dr. Eric Kasper is humble, but he certainly deserves praise. He is a Professor of
Structural Engineering and the Steel Bridge Team Advisor. I joined this team as a
Freshman, 5 years ago. This club inspired me to pursue a career construction. I’ve grown
to know Dr. Kasper well. He has supported and advised me on any question or idea I
could conceive. He is an incredible role model and I appreciate his support.
Thank you to Terry M. Roy. His practical guidance from past construction
estimating experiences kept me thinking practically. I had the pleasure of taking two
classes with him which both influenced this research. He offered his time for interviews
and even provided statements to include in this thesis. He affirmed the intentions of my
work; do not replace estimators with automation, instead improve their capabilities and
efficiency.
Finally, thank you to the CE Student Fund Initiative (SFI) for supporting my
Conference Registration and Travel to Montreal. I am excited to present this research in
June 2019 to the Canadian Society of Civil Engineers and the Construction Research
Congress.

vi
TABLE OF CONTENTS
Page
LIST OF TABLES ............................................................................................................ IX
LIST OF FIGURES ........................................................................................................... X
LIST OF ACRONYMS ................................................................................................... XII
CHAPTER
1. INTRODUCTION .......................................................................................................... 1
1.1 Background ............................................................................................................... 1
1.2 Problem Statement .................................................................................................... 2
1.3 Research Objectives .................................................................................................. 3
1.4 Thesis Organization .................................................................................................. 4
2. LITERATURE REVIEW ............................................................................................... 5
2.1 Overview ................................................................................................................... 5
2.2 Introduction to BIM .................................................................................................. 5
2.2.1 Definition of BIM .............................................................................................. 5
2.2.2 Definition of VDC ............................................................................................. 6
2.2.3 BIM and Construction Cost Estimating ............................................................. 8
2.2.4 VDC and the Contractor’s Participation in Design ............................................ 9
2.3 Construction Cost Estimation ................................................................................. 11
2.3.1 Cost Estimate Uses .......................................................................................... 11
2.3.2 AACE Cost Estimating Standards ................................................................... 11
2.3.3 Traditional QTO and Cost Estimating Method ................................................ 14
2.3.4 Current BIM QTO Systems ............................................................................. 16
2.4 Construction Contracts ........................................................................................... 20
2.4.1 Delivery Methods & Cost Estimation .............................................................. 20
2.4.2 Warranted Model Accuracy ............................................................................. 21
2.5 Complications in BIM for Model-Based Cost Estimation ...................................... 22
2.5.1 Ontology of Model Elements ........................................................................... 22
2.5.2 Model Level of Development .......................................................................... 26
2.5.3 Interoperability of Software and Data .............................................................. 27
2.5.4 Data Recycling ................................................................................................. 28
2.6 Costs External to the Model Elements .................................................................... 29
2.6.1 Means and Methods of Construction ............................................................... 29
2.6.2 Multiple Quantities Driven by an Element ...................................................... 30
2.7 Construction Cost Control ...................................................................................... 34
2.7.1 VDC Project Controls ...................................................................................... 34
2.7.2 Cost Codes for Construction Activities ........................................................... 36
vii
2.7.3 Historical Data Reporting ................................................................................ 36
2.8 Industrial Manufacturing Perspective on Cost Estimation ..................................... 37
2.8.1 Qualitative Versus Quantitative Cost Estimate Techniques ............................ 37
2.8.2 The Activity Based Costing Method ................................................................ 38
2.9 Summary of Identified Limitations ......................................................................... 39
3. METHODOLOGY ....................................................................................................... 41
3.1 Overview ................................................................................................................. 41
3.2 Phase I: Initiation and Literature Review ............................................................... 42
3.2.1 Ease of Use ...................................................................................................... 43
3.2.2 Estimator’s Subjective Opinion of a Work Item’s Cost .................................. 43
3.2.3 Construction Contracts ..................................................................................... 43
3.2.4 Parametric Estimating ...................................................................................... 44
3.2.5 VDC Cost Control ............................................................................................ 44
3.2.6 Means and Methods ......................................................................................... 45
3.2.7 Flexible Mapping ............................................................................................. 45
3.2.8 Software Interoperability ................................................................................. 46
3.3 Phase II: Plan Framework Components .................................................................. 46
3.3.1 Structured Query Language and Business Intelligence ................................... 47
3.3.2 Navisworks Application Programming Interface Add-in ................................ 47
3.4 Phase III: Develop Framework ............................................................................... 48
3.5 Phase IV: Validation ............................................................................................... 50
3.6 Phase V: Conclusions and Recommendations ........................................................ 50
3.7 Summary ................................................................................................................. 51
4. MODEL-BASED COST ESTIMATING FRAMEWORK .......................................... 52
4.1 Overview ................................................................................................................. 52
4.2 Establish Estimate Requirements ............................................................................ 54
4.2.1 Construction Contracts: BIM Execution Plan .................................................. 54
4.2.2 Software Interoperability ................................................................................. 55
4.2.3 Check BIM Against Warranted Accuracy ....................................................... 56
4.3 Plan and Structure the Estimate .............................................................................. 57
4.3.1 Design Flexible Data Maps to Other Stakeholders’ BIM Models ................... 57
4.3.2 Define OBS and WBS...................................................................................... 59
4.4 Quantification and Costing ..................................................................................... 60
4.4.1 Author Means and Methods ............................................................................. 60
4.4.2 Automatic QTO of BIM Elements ................................................................... 63
4.4.3 Attach Work Items ........................................................................................... 65
4.4.4 Parametric Estimate ......................................................................................... 69
4.4.5 Model-Based Reports ....................................................................................... 72
4.5 Model-Based Historical Cost Data Refinement...................................................... 73
4.5.1 Cost Code Tether ............................................................................................. 73
viii
4.5.2 VDC Cost Control ............................................................................................ 75
4.5.3 Historical Data Refinement .............................................................................. 76
4.6 Summary ................................................................................................................. 76
5. IMPLEMENTATION ................................................................................................... 78
5.1 Overview ................................................................................................................. 78
5.2 Project Background ................................................................................................. 78
5.3 Traditional Cost Estimate Method .......................................................................... 80
5.4 BIM QTO and Excel Estimate ................................................................................ 86
5.5 Model-Based Cost Estimate .................................................................................... 91
5.6 Discussion of Results .............................................................................................. 99
5.6.1 Discussion of Case Study Metrics ................................................................... 99
5.6.2 Results for Preparation of the Computation System ...................................... 101
5.7 Quality Control ..................................................................................................... 102
5.8 Summary ............................................................................................................... 104
6. CONCLUSIONS......................................................................................................... 105
6.1 Overview ............................................................................................................... 105
6.2 Contributions of the Proposed Framework ........................................................... 105
6.3 Limitations of the Proposed Framework .............................................................. 107
6.4 Future Developments ............................................................................................ 109
REFERENCES ............................................................................................................... 112
APPENDICES ................................................................................................................ 117
Appendix A: Power BI Cost Estimate Report ............................................................ 117
Appendix B: All BIM elements in the Revit Model ................................................... 118
Appendix C: Parametric Estimate SQL Entity Amalgamated into an Excel Table .... 119
ix
LIST OF TABLES
Table Page
1. Map of Limitations and Corresponding Literature Review Sections ........................... 42
2. SOG Quantities Established from the Traditional QTO ............................................... 84
3. BIM QTO Parameters Exported using the Navisworks Selection Inspector ................ 88
4. SQL Table with all BIM Parameters Used to Complete the Model-Based Cost
__Estimate......................................................................................................................... 94
5. Comparison of the Estimating Parameters captured in the Traditional Method
__Estimate to the Estimating Parameters captured in the Model-Based Cost Estimate ... 99
6. Comparison of the Time to Complete and Estimated Cost Results of the
__Traditional Method Estimate versus the Model-Based Cost Estimate ....................... 100

x
LIST OF FIGURES
Figure Page
1. QTO Time Savings with BIM (Olsen & Taylor, 2017) .................................................. 8
2. AACE Cost Estimate Classification System (AACE RP 17R-97, 2011) ..................... 13
3. AACE Cost Estimate Process Diagram (AACE RP 19R-97, 2003) ............................. 14
4. Software Popularity (Lawrence, et al., 2014) ............................................................... 17
5. Navisworks QTO of Spread Footings, Highlighted Blue ............................................. 18
6. Assemble QTO of Masonry Walls, Highlighted Blue .................................................. 19
7. Ontological Cost Estimation Framework (Lee, Kim, & Uy, 2014) .............................. 23
8. BIM Knowledge-Base Ontological Map (Niknam & Karshenas, 2015) ...................... 25
9. Model LOD (McPhee, 2013) ........................................................................................ 26
10. BIM Based Site Information Management (Lee, Park, & Song, 2018) ...................... 28
11. BIM-Based Cost-Estimation Employing Flexible Mapping (Lawrence, et al., 2014) 31
12. A Flexible Mapping Process to Update an Existing Cost Estimate (Lawrence, et al,
___2014) ........................................................................................................................... 33
13. P6 and Assemble used in Model-Based Project Control (Scroggins, 2018)............... 35
14. Methodology Overview .............................................................................................. 41
15. Conceptual Roadmap of Model-Based Cost Estimating System ................................ 48
16. Skeleton of the Framework’s Input, Environment, and Output .................................. 49
17. Cost Estimating Steps Followed in the Case Study Validation .................................. 50
18. Legend Representing the Framework Elements ......................................................... 52
19. Overview of Model-Based Cost Estimation Framework ............................................ 53
20. Input-Environment-Output Diagram with the Implemented Software ....................... 56
21. SQL Table of Flexible Parameter Mapping ................................................................ 59
22. Stakeholder: OBS & CSI UNI Specification: WBS ................................................... 60

xi
23. Flowchart Outlining the Documentation of Means and Methods ............................... 62
24. SQL Table of all BIM Elements in the Project ........................................................... 64
25. Navisworks Add-in Data Model for connecting the BIM Elements to SQL .............. 65
26. Flowchart for Work Item Attachment......................................................................... 67
27. Assembly Estimating Feature for Work Item Attachment Step ................................. 68
28. Navisworks Add-in Tab for selecting a BIM Element to Attach Work Items............ 69
29. Flowchart for Completing a Parametric Estimate ....................................................... 70
30. SQL Entities for Capturing Subjective Input .............................................................. 71
31. Parametric Estimate SQL Table.................................................................................. 72
32. Cost Control SQL Table Linking Cost Codes to the Cost Estimate ........................... 75
33. Drone Photograph of Yakʔitʸutʸu Student Housing Project (Cal Poly, 2018) ............ 79
34. Process Diagram of the Cost Estimate Case Study Modules ...................................... 82
35. Traditional QTO of SOG Completed using Bluebeam Revu ..................................... 83
36. Cost Estimate Spreadsheet produced from the Traditional QTO ............................... 85
37. BIM QTO of SOG performed with the Navisworks “Selection Inspector” ............... 87
38. Traditional Cost Estimate Driven by Quantities from the BIM QTO ........................ 90
39. Conditioned Navisworks File for Completing a Model-Based Cost Estimate ........... 93
40. Work Item Attachment Using the Navisworks Add-in............................................... 94
41. Traditional Cost Estimate Spreadsheet for Comparison purposes. ............................. 96
42. Report Query for Concrete Placing ............................................................................. 98

xii
LIST OF ACRONYMS
BIM
VDC
OBS
WBS
SOW
MEP
AACE
ACWP
TCM
GMP
LOD
IFC
RFI
SQL
BI
API
BEP
Building Information Modeling
Virtual Design and Construction
Organizational Breakdown Structure
Work Breakdown Structure
Scope of Work
Mechanical Electrical and Plumbing
Association for the Advancement of Cost Engineering
Actual Cost of Work in Place
Total Cost Management
Guaranteed Max Price
Level of Development
Industry Foundation Class
Request for Information
Structured Query Language
Business Information
Application Programming Interface
BIM Execution Plan
1
1. INTRODUCTION
1.1 Background
BIM is a computer-based process of communicating design intent. BIM is
becoming the platform for the management of the entire construction project lifecycle.
VDC is the use of models provided by different project stakeholders to pursue
construction objectives. It’s important to note that VDC is a verb, meaning it is the act of
employing information in project-related decision making. Successful VDC involves
visualization and analysis of the model to produce decisions. The zenith of BIM and
VDC is the return of the master builder concept. Not to an individual, but to one locus of
control for the entire project. The BIM model presents elements that spatially organize
the project’s information. This information is used to plan and execute construction
operations using VDC. Proper implementation of BIM and VDC entails that the project’s
suite of information is wholly accessible within the BIM model. The BIM model then
becomes the singular locus of control for the entire construction project.
Many project variables, including the project’s estimated cost, are dependent on
the parameters stored in BIM elements. The core principle guiding the proposed model-
based cost estimating framework is “no cost estimate information should exist that is
inaccessible from, or blind to, the project’s BIM models.” When this principle is
followed, all the cost estimate work items should be driven by the parameters of the BIM
model elements. Any design changes to the model element’s parameters should
automatically be available to the cost estimate work items. Thereby the BIM model
environment becomes the locus of control for a project’s cost information. Then through
VDC, construction cost data is collected in the context of the BIM environment.
2
1.2 Problem Statement
The existing body of knowledge lacks a concise framework for construction cost
estimation using BIM. Current popular BIM cost estimating computation platforms lack a
pure BIM model-based method and instead rely on quantity extraction. While these
platforms increase speed and efficiency in the quantification process, this is achieved
with a loss of accuracy. The current computation platforms extract parameters from BIM
elements instead of completing the cost estimate within the spatial context of BIM. This
extraction leads to a partial loss of the estimator’s ability to conceptualize the impact of
the arrangement of the 3D model elements on the project’s cost. This loss is detrimental
to the spatial context BIM provides, and consequently the accuracy of the cost estimate.
Aside from a loss of accuracy, this data extraction also reduces the efficiency of
the cost estimating process. Since the existing tools rely on more than BIM elements,
estimators at times manually author additional geometric shapes to host parameters that
are not provided in the BIM model. This authoring is not parametric, it will not update
when a design change is proposed in the designer’s BIM model. These manually defined
QTO conditions are not BIM elements, and therefore cannot store additional information
or be communicated to other stakeholders. This QTO authoring introduces measurement
error and is not directly useful to other project stakeholders. The current body of
knowledge employs computation systems that under develop the potential efficiency
increase of using BIM elements in cost estimation.
The main limitation within the existing body of knowledge is the absence of an
easy to use framework for capturing all parameters that affect the project’s cost, within
the BIM model-based environment. In current practices, some parameters are manually
3
authored as QTO conditions, while other granular parameters are missed. This limitation
should be addressed by improving the capabilities of cost estimation from within a BIM
environment. Such an improvement departs from the school of thought that relies on
quantity extraction for cost estimation. Improvements should increase both the quality
and quantity of geometric and cost estimate information available within BIM.
1.3 Research Objectives
The objective of this thesis is to develop a framework to complete a construction
cost estimate entirely within BIM. An accurate cost estimate must take into consideration
all variables and constraints where the quantity is installed within the project. This cannot
be accomplished with a quantity extraction, the model-based cost estimate requires the
spatial context that is provided by BIM. The proposed framework is intended to capture
all costs. To achieve this main objective, the following sub-objectives are carried out:
1. Conduct interviews with cost estimating professionals.
2. Complete a literature review that sufficiently analyzes BIM, VDC, and
other influences on BIM model-based construction cost estimation.
3. Prepare a succinct methodology that lays out a roadmap for the model-
based cost estimation framework.
4. Develop a Framework for model-based cost estimation that incorporates
these four sequential modules:
o Module 1: Establish cost estimate requirements.
o Module 2: Plan and structure the cost estimate.
o Module 3: Conduct quantification and costing.
o Module 4: Refine historical cost data from within BIM.
4
5. Complete a case study to evaluate the proposed framework against the
existing body of knowledge.
1.4 Thesis Organization
This thesis begins with a literature review (Chapter 2) that develops the eight
limitations in detail. These limitations are analyzed in the methodology (Chapter 3). The
methodology outlines the development process of the thesis. This process is pursued to
create a framework for model-based cost estimation (Chapter 4). This framework is
tested against two other cost estimate methods to create a case study comparison (Chapter
5). The conclusion examines results and identifies any prevailing limitations (Chapter 6).

5
2. LITERATURE REVIEW
2.1 Overview
Through a detailed literature review, this chapter builds an understanding of the
limitations in the construction industry which hinder adoption of parametric BIM model-
based construction cost estimation. This literature review analyzes BIM and VDC, cost
estimation, contract structures, construction phase cost control, and the industrial
manufacturing industry’s successful adoption of parametric cost estimation.
2.2 Introduction to BIM
This section defines BIM and VDC. It explores the increasing involvement of the
general contractor in the design process and examines how BIM and VDC have enabled
increased participation by the construction contractor in the design process. The actual
mechanics and functionality of BIM and VDC are further explored in Sections 2.5
through 2.7.
2.2.1 Definition of BIM
BIM is a 3D model-based process of representing design intent in building
construction. The models contain data representing the physical and functional
characteristics of the project. This data is associated with discrete digital elements
contained in the model. BIM has grown in popularity as construction projects become
increasingly complex (Autodesk, 2018). It is a system that clearly communicates the
designer’s intent. Clear communication allows many stakeholders to coordinate and
improve the productivity of construction. Clear communication of design intent through
BIM promises to improve productivity in construction (Turner and Townsend, 2018).

6
BIM tools include a litany of software platforms allowing the combination of
different stakeholder’s data in a spatial environment. A BIM model is built of 3D
elements. They are discrete objects, each of which has a unique identifier known as an
object ID. Unique object ID’s allow BIM users to clearly select an element. Object ID’s
are also a tool for referencing relationships to other objects. Parameters of model
elements store data. These parameters allow stakeholders to communicate information.
So, BIM is a form of spatial organization with a litany of software interpretations
(ADEB-VBA, 2015). Since BIM can host so much data, one interest in the industry is
building cost estimate information into the definition of BIM elements. However, BIM is
not presently popular for use in cost estimation. In a 2010 survey, spatial design
coordination was the most common task to leverage BIM. Spatial design coordination
allows project teams to “detect clashes” or identify where multiple model elements
occupy the same 3D space. Clash detection involves 3D data, which BIM visually
represents. Meanwhile, the cost is an additional dimension of data. This additional
dimension is currently not well interpreted through BIM. This is in part why cost
estimation ranked fourteenth of twenty-five options in the survey of BIM uses (Kreider,
Messner, & Dubler, 2010).
2.2.2 Definition of VDC
VDC is the use of models provided by different project stakeholders to
pursue objectives. It’s important to note that VDC is a verb, meaning it is the act of
employing information in project-related decision making. Successful VDC involves
visualization and analysis of the combined model to produce decisions. Producing these
visualizations requires a product-organization-process model. An organizational model
7
identifies various stakeholders in an organizational breakdown structure (OBS). This is
effectively a list of all parties who qualify as project stakeholders. The process model is
the work breakdown structure (WBS), or the sequential activities required to complete
the work. Since BIM elements can hold additional parameters, they can store data
regarding the element’s relationship to the OBS and WBS (Stanford Engineering, 2018).
BIM is one of the three sub-models within the product-organization-process
model. It represents the finished product as intended by the design team. The
organization and process models encompass the elements that construct the models. The
construction team evaluates the design intent and applies means and methods to
physically produce the model. VDC digitally communicates the organization and process
components of a project. VDC synthesizes the information produced by a designer’s BIM
with the people and processes required to complete the project (Chen, John, & Cox,
2018).
Employing VDC adds fluidity to the construction process since it is no longer
completed in discrete “design-bid-build” stages. Specialty sub-contractors including
HVAC-R and plumbing adopted VDC to increase pre-fabrication of piping and
ventilation assemblies. Thereby, they can employ lower wage-higher productivity labor
to produce products offsite which increase profitability. However, these sub-contractors
experience cost overruns in the actual implementation of VDC. Specifically, when design
changes are made, these trades must reproduce the VDC plans for their pre-fabricated
components. The cost overrun was a product of the additional effort required to update
the model (Said & Reginato, 2018). Model-based cost estimation could reduce the cost of
evaluating design changes (Borhani, Dossick, Lee, & Osburn, 2017).
8
2.2.3 BIM and Construction Cost Estimating
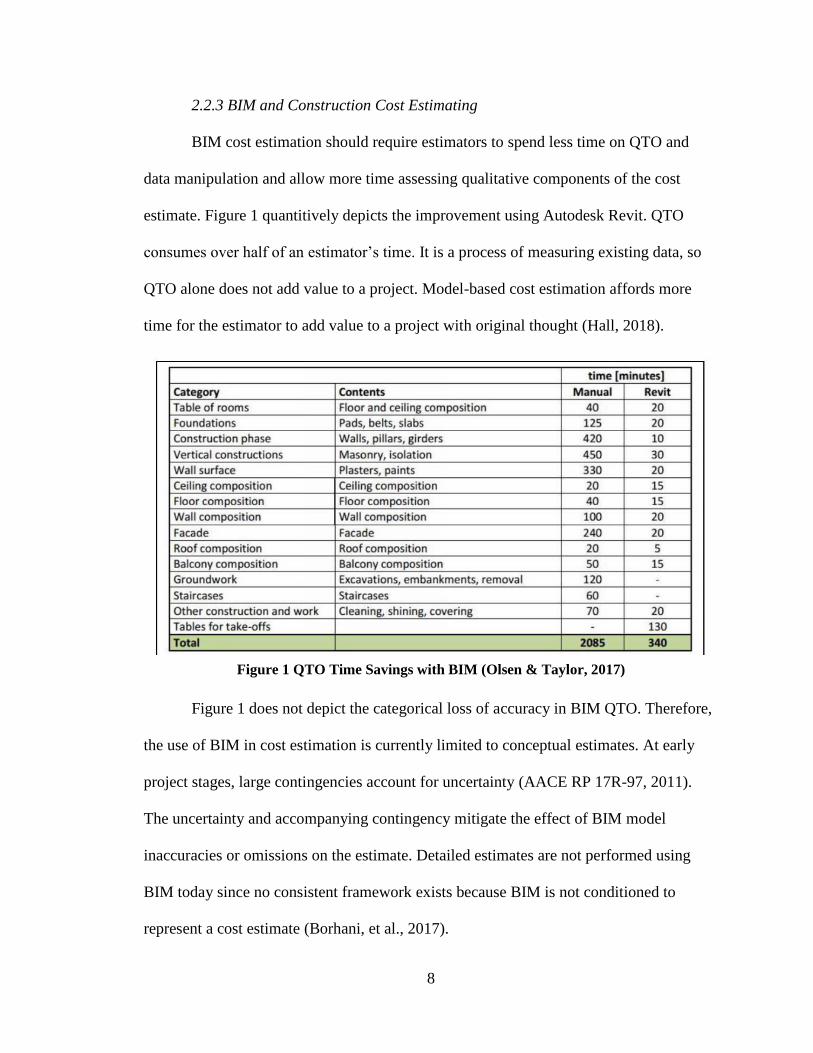
BIM cost estimation should require estimators to spend less time on QTO and
data manipulation and allow more time assessing qualitative components of the cost
estimate. Figure 1 quantitively depicts the improvement using Autodesk Revit. QTO
consumes over half of an estimator’s time. It is a process of measuring existing data, so
QTO alone does not add value to a project. Model-based cost estimation affords more
time for the estimator to add value to a project with original thought (Hall, 2018).
Figure 1 QTO Time Savings with BIM (Olsen & Taylor, 2017)
Figure 1 does not depict the categorical loss of accuracy in BIM QTO. Therefore,
the use of BIM in cost estimation is currently limited to conceptual estimates. At early
project stages, large contingencies account for uncertainty (AACE RP 17R-97, 2011).
The uncertainty and accompanying contingency mitigate the effect of BIM model
inaccuracies or omissions on the estimate. Detailed estimates are not performed using
BIM today since no consistent framework exists because BIM is not conditioned to
represent a cost estimate (Borhani, et al., 2017).
9
The framework does not exist partially because the existing software tools are
insufficient. BIM-based QTO does not capture enough detail to accurately estimate a
project. It yields a bill of materials without any context to the item’s complexity or the
contractor’s definition of the work. Construction estimators are interested in identifying
the scope of work (SOW). The SOW involves quantities, as well as people and processes
required to complete the work (Stanford Engineering, 2018). A system of model-based
estimation must allow estimators to capture these other parameters and associate them
with the model generated quantities. (Trimble Navigation Limited, 2014).
BIM’s estimating allure is in its structure of storing data. It allows automation in
the takeoff process. Specifically, the organization and unique identification of model
elements. Model elements are categorized in a hierarchical structure by; 1) category, 2)
family, 3) type, and 4) the element. A BIM-based QTO can select all instances in the
model by any of these hierarchical steps. A categorical breakdown in this fashion can
help estimators select all the elements in a model associated with a specific quantity if the
model hierarchy matches the structure of the estimate. BIM is effectively a system for
spatially organizing a cost estimate (Golaszewska & Salamak, 2017).
2.2.4 VDC and the Contractor’s Participation in Design
In 2007, it was noted that BIM technology promises construction teams the ability
to simulate building construction. The teams who employ VDC can gain a competitive
advantage by simulating certain complicated activities within a project. Simulation of
these activities reduces the risk of changes in the field. This trend is increasing
exponentially (AGCA, 2007).
10
Since 2007, the number of activities a team can simulate has increased. This trend
started with high-risk activities. An example is mechanical, electrical, and plumbing
(MEP) coordination. Specifically, in renovations of existing structures. This coordination
involves multiple systems which must occupy the same limited interstitial spaces of
buildings. Those limited spaces are confined by the existing structure. When coordination
is inadequate, MEP systems must be resized causing cost and schedule delays
(Farnsworth, Beveridge, Miller, & Christofferson, 2014) VDC allows teams to avoid
these cost and schedule delays.
VDC is a tool for the team to control construction risks during design. MEP
coordination is one small subset of risks endured on a project. Worker safety and even
variations in labor productivity are risks that VDC is used today to assess. The general
contractors ultimately decide if a project will use BIM since they are the link between
designer and owner during design, construction, and commissioning. A design team’s
model is only valuable to the owner if the model was referenced and updated during
construction. General contractors are increasingly adopting BIM, thereby influencing the
other project stakeholders to adopt BIM as well (Ghaffarianhoseini, et al., 2017).
VDC involves the synthesis of BIM models with external data to optimize the
results of a project. A BIM model represents the finished product since it’s used to
communicate design intent. This leaves the model absent of many social and technical
methods necessary to achieve the finished product. VDC adds a broader scope to
modeling. It incorporates the design intent but includes the means and even motivations
for achieving that finished product. VDC is pertinent to model-based cost estimation
11
since the cost is driven by the product, organization, and process models (Kam, Song, &
Senaratna, 2016).
2.3 Construction Cost Estimation
This section reviews current methods of cost estimation in construction. A cost
estimate is an establishment of the most probable cost for a project. The project must
have a defined scope. In construction, this scope is typically delineated by the drawings
and specifications (AACE RP 10S-90, 2015). It is important to note that the construction
cost estimate is a linear representation of a dynamic system. Managing a cost estimate
means managing the influences on the dynamic system (Alzraiee, 2013).
2.3.1 Cost Estimate Uses
There are multiple stakeholders who use construction cost estimates, and each
seeks different information from the report. The interest in information also varies with
the stage of an estimate. The three discrete stages include; 1) cost planning, 2) estimating,
and 3) tendering. Cost planning helps stakeholders establish a budget. Estimating informs
the design team to make design changes to keep the project on budget. Finally, tendering
is employed by the construction team to establish a firm price (Brook, 2017).
2.3.2 AACE Cost Estimating Standards
The Association for the Advancement of Cost Engineering (AACE) is an
organization that influences standardization in cost estimation. These standards help
increase cost estimate reliability. A selection of standards that are prevalent in the context
of BIM model-based cost estimation is presented in this sub-section. These standards
influence cost estimate reliability and repeatability.

12
The AACE outlines prescriptive requirements for the skills and knowledge of cost
estimators. This comprehensive list incorporates most characteristics required to
complete an accurate estimate. Since these characteristics produce successful estimates,
they can guide the development of estimation software. The main skills and knowledge
that translate to development of software that facilitates model-based cost estimation
includes; 1) clearly identified supporting knowledge, which constitutes all the
background data that may be incorporated in a cost estimate 2) total cost
management(TCM), which is a structured map that explains each step in a cost estimate
and how that estimate figures into the project life cycle. 3) estimate planning, identifies
the goal of an estimate and devotes the appropriate resources towards achieving the goal.
and 4) performance assessments generate supporting knowledge in the form of historical
data. A successful assessment guides future improvement of cost estimate assumptions in
similar construction projects (AACE RP 19R-97, 2012).
The AACE provides a comprehensive list of terms relevant to the cost estimating
profession. The Actual Cost of Work Performed (ACWP) is the cost an estimate is
intended to project. It consists of all the dollars spent to complete an activity. So, in
comparison to the cost estimate, a contractor profits when ACWP is less than or equal to
the estimated cost for that activity. The construction cost estimators job is to project the
ACWP. The construction cost estimate ascertains the ACWP (AACE RP 10S-90, 2015).
The reliability of this projection depends in part upon the completeness of the drawings
used in the cost estimate. The AACE categorizes estimates based on their class. Each
class considers how well the plans define the SOW. It also considers the method used to
produce the estimate. The goal of categorization is to establish an expected accuracy

13
range. Changing the method of estimation could increase the expected accuracy range
(AACE RP 17R-97, 2011).
Figure 2 AACE Cost Estimate Classification System (AACE RP 17R-97, 2011)
The process of producing a cost estimate is outlined by the AACE. It includes 7
steps of direct effort: 1) establishing the estimate requirements based on the end user, 2)
planning the estimate based on the WBS and OBS, 3) establishing cost using the project
documents and external sources, 4) assess the risk produced by uncertainty, 5) document
the basis of estimate, 6) compare the estimate to historical data, and 7) deliver the
estimate to enterprise decisionmakers. This process is described in Figure 3 (AACE RP
19R-97, 2003).

14
Figure 3 AACE Cost Estimate Process Diagram (AACE RP 19R-97, 2003)
2.3.3 Traditional QTO and Cost Estimating Method
The traditional estimating method is defined in this thesis as the use of 2D (paper
or PDF) drawings for QTO and Excel for producing the estimate. This is the most
common procedure used to produce detailed cost estimates. The seven steps are described
in detail in the following list:
1. In the traditional method, step 1 consists of communication external to the
estimate. Email correspondence and meetings between estimators and
designers guide the requirements of the estimate. This information is not
attached to the contract documents or the cost estimate.
2. In step 2, the GC would review the plans and specifications to define the
entire SOW. Estimators read the plans and specifications to visualize
project requirements. Once visualized, the estimator can categorize each
requirement by WBS.
15
3. During step 3, the estimators(s) measure quantities and categorize them by
the WBS. Measurements are made by drawing shapes on the 2D plans to
capture lengths, areas, and volumes of the work-in-place (AACE RP 34R-
05, 2014). The estimator manually asserted where each condition
occurred, and there is no link between the quantity and the corresponding
specification section (Chen, Lu, Peng, Rowlinson, & Huang, 2015).
4. In step 4, the estimators assess the estimate’s uncertainty. The two types of
risk are epistemic, knowledge-based, and aleatory, “roll of the dice” (Der
Kiureghian, 2009). An example of epistemic risk is information the
estimator does not have time to review in the contract documents. An
aleatory risk is an uncertainty in manually produced quantities. Historical
average data is used to mitigate each risk (AACE RP 19R-97, 2003).
5. In step 5, estimators prepare a basis of estimate. During steps 1-4, the
estimator(s) take mental or physical notes of any unique conditions or
possible external impacts on the project. They also produce a project
narrative. This qualitative information is combined typically into a word
document (AACE RP 10S-90, 2015).
6. During step 6, the estimators compare benchmarks to similar projects.
These benchmarks include price per floor area, the price per unit, or price
per occupant. They may drill into a specific WBS section to compare
benchmarks of that section. Examples of this include the cost of plumbing
per occupant or the price of air conditioning per building volume. The
purpose of this review is to identify any significant variances with
16
historical data. Then the estimators must justify the variance or correct
major mistakes.
7. The GC produces a cost report for other project stakeholders. This report
must be manually produced by manipulating the individual estimate line
items (Brook, 2017).
Estimators who collaborate must manually coordinate scopes through
communication methods detached from the estimate i.e. email or physical meetings.
Upon completion, the estimators must manually review each other’s work to confirm the
entire SOW is captured exactly once. Work-sharing allows multiple BIM users to work
on the same file simultaneously. It has enabled improved collaboration and quicker
project delivery. The iterative nature of computers combined with the ability to easily
collaborate through work-sharing has improved the design process (Autodesk, 2018).
BIM should be leveraged to do the same for construction cost estimation.
2.3.4 Current BIM QTO Systems
This section examines the current body of knowledge pertaining to BIM QTO and
its accompanying computation platforms. All existing BIM cost estimating platforms rely
on information external to the BIM model. The models supplied by the design team lack
“consistent quality”. Up to half of the data for QTO may be absent from the BIM model
(Olsen & Taylor, 2017). The current BIM QTO systems attempt to map designer’s
objects straight into an estimate ledger (Lawrence, Pottinger, Staub-French, & Nepal,
2014). This mapping process is inconsistent since “Error-free classification is beyond
state of the art” (Wu & Zhang, 2018). In model-based cost estimation, there is a reliable
and repeatable method for producing a cost estimate from a BIM model, the current
17
systems are not reliable or repeatable (Borhani, et al., 2017). It is worth categorizing the
BIM QTO systems as 2D/3D or 3D only. A 3D system can only quantify what the design
team has authored in their BIM model. A 2D/3D system allows estimators to author
additional quantities. A 2D/3D system can achieve greater estimating accuracy by adding
more information to the model in the form of QTO conditions (Sattineni & Bradford,
2011).
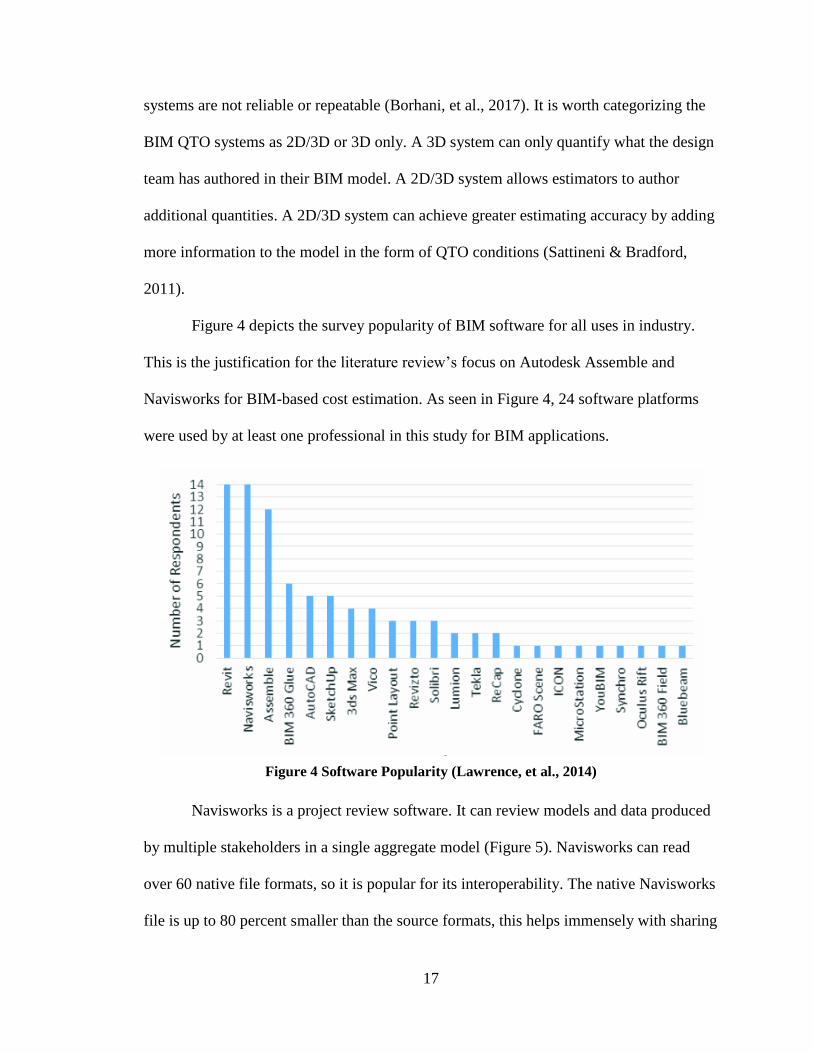
Figure 4 depicts the survey popularity of BIM software for all uses in industry.
This is the justification for the literature review’s focus on Autodesk Assemble and
Navisworks for BIM-based cost estimation. As seen in Figure 4, 24 software platforms
were used by at least one professional in this study for BIM applications.
Figure 4 Software Popularity (Lawrence, et al., 2014)
Navisworks is a project review software. It can review models and data produced
by multiple stakeholders in a single aggregate model (Figure 5). Navisworks can read
over 60 native file formats, so it is popular for its interoperability. The native Navisworks
file is up to 80 percent smaller than the source formats, this helps immensely with sharing

18
and collaboration. Because of these characteristics, its most popular use is in “clash
detection” and not cost estimation (Dodds & Johnson, 2011).
Figure 5 Navisworks QTO of Spread Footings, Highlighted Blue
Navisworks is not popular for cost estimation. It is not BIM authoring software,
meaning the object parameters in Navisworks are strictly produced by the native software
and original author. The accuracy of extracted cost estimate parameters depends on the
modeling standards dictated by the design team (Monteiro & Martins, 2013). Figure 5
depicts the designer-authored length, width, and thickness parameters in the QTO. In
order to produce a complete QTO, any gaps in the SOW must be manually taken off in a
2D view. This process incorporates 2D QTO, similar to the traditional method.
Assemble is the most used 3D BIM QTO software package (Olsen & Taylor,
2017). It reads BIM model elements directly from the native Revit file (Figure 6).
Interoperability is limited since it can only read from some Autodesk formats. However,
the user interface is simple to use, and the platform is web-based, both characteristics

19
make it popular for QTO. It enables conditioning and querying BIM data to other
estimating platforms by way of a CSV export (Autodesk, 2018). This platform is more
limited by gaps in the SOW. There are no features allowing authoring of additional
elements. So, it is typically not used at the bid-tendering phase of cost estimation. At this
phase, the AACE cost estimate class is low, meaning that the acceptable cost
contingencies are low. This means that a bid-tender cost estimate should more closely
project the ACWP for the project.
Figure 6 Assemble QTO of Masonry Walls, Highlighted Blue
The fact that Assemble is limited to reading from Revit increases its accuracy by
rigid mapping in comparison to other BIM QTO platforms. Since Revit has a distinct data
structure, the mapping between Revit and Assemble is fixed. Therefore, there are no data
losses when information is transferred from Revit to Assemble. These two do not
communicate using the IFC framework. They are both products administered by
Autodesk that use proprietary data mapping.
20
2.4 Construction Contracts
This section reviews various popular contract delivery methods employed in
construction to identify each delivery method’s impact on model-based estimation. The
type of construction contract dictates how and when BIM authoring is funded. From the
cost estimating perspective, it is preferable for BIM funding to be provided early and by
the client. This funding strategy is favored by collaborative contract delivery methods.
2.4.1 Delivery Methods & Cost Estimation
In design-bid-build, the owner establishes a contract with the construction team.
This contract obligates them to provide the finished product for their bid price. Cost
estimators in this delivery method establish a bid for delivering the product per the plans
and specifications provided by the owner (Fernández-Solís & Chugh, 2018). Meanwhile
in design-build, the owner contracts with a single firm for design and construction
services. The costs and scope of the design-build contract are determined by the team
with a guaranteed max price (GMP). A GMP limits the financial risk of the owner but
provides flexibility to the project delivery team. A fixed price bid would require 100%
complete design documents, which are not available (Burnham & Nagata, 2016).
Bridging is a blend of the two previous approaches and involves two separate
design entities. The first team is hired by the owner to produce bridging documents. The
second design team is hired by the construction team in the same fashion as a design-
build contract. The owner can dictate quality or functionality through the bridging
documents while the construction team can adapt those documents for constructability.
Then they produce the final plans and model which they finally build. This blend offers
the flexibility of design-build while the product is defined by the owner (Fernández-Solís
21
& Chugh, 2018). In this method, the cost estimate is a blend of both parties too. The
owner establishes a preliminary budget with the bridging documents, then estimators
project the price to deliver the project their team designed (Burnham & Nagata, 2016).
2.4.2 Warranted Model Accuracy
In design-bid-build, the plans and specifications constitute the entire scope of
work. Models are provided “for information purposes only” as an omission from the
model could be argued as a limitation to the SOW. Model-based cost estimation in
design-bid-build would be completely driven by the construction team who would also
have to produce the model from 2D drawings and compensate for that cost in the bid.
This repetitive process still saved time in controlling cost during construction. So, model-
based estimation in design-bid-build is possible (Zhao & Wang, 2014), but the additional
cost is a great loss if the bid is not won.
In design-build, no model is provided by the owner. The team dictates the design
and BIM authoring requirements to stakeholders. One requirement is a BIM model level
of detail that is enough to produce a cost estimate. The team is compensated to produce
the design, so they can invest resources in model-based cost estimation and be
compensated through design fees paid by the owner. The team produces and thus dictates
the BIM model’s warranted accuracy (AIA, 2007).
Bridging produces two separate document sets; the bridging documents and
construction documents. This contract structure has the same warranted model accuracy
as design-build. The construction team ultimately governs the level of detail and quality
of construction documents and model. The owner can influence this method early by
22
producing a detailed bridging model. However, it’s ultimately the construction model that
defines the scope of work (Fernández-Solís & Chugh, 2018).
2.5 Complications in BIM for Model-Based Cost Estimation
A BIM model’s purpose is to represent design intent, which does not
communicate cost by default. This section examines BIM’s limitations that negatively
impact its potential to produce reliable cost estimates. The underlying theme is
inconsistencies in information and software tools (Olsen & Taylor, 2017).
2.5.1 Ontology of Model Elements
The general term ontology is a component in the study of philosophy. It examines
the concept of what objects exist and their categorization. Its goal is ascertaining an
objective reality. Ontology in BIM is the term used to describe the formal and explicit
specification of model elements. It seeks to rigidly categorize BIM elements by their
family, category, type, and ultimately cost. An ontology does not allow modifications of
BIM element definitions by the design team. A successful ontology requires a singular
library of model elements which is accessible to all who use the software (Sabol, 2008).
An ontology also requires that modifications to a model element do not change its
definition. Any stakeholder who has access to a model can produce a model element.
Therefore, any stakeholder with model access can modify the parameters and the
resulting meaning of a model element. This introduces uncertainty in the definitions of
model elements. An ontology is meant to eliminate subjectivity in the process of
estimating. Figure 7 depicts the underlying ontological framework for BIM-based cost
estimation of tile flooring (Lee, Kim, & Uy, 2014).

23
Figure 7 Ontological Cost Estimation Framework (Lee, Kim, & Uy, 2014)
BIM cannot be compressed into an ontology (Chen, John, & Cox, 2018). Without
an ontology, the model based estimating process must involve manual categorization of
model elements. The model-based cost estimation process cannot be automated since the
designers do not have the intent of communicating cost directly (Monteiro & Martins,
2013). Under the current object-oriented domain, a second hierarchy must be produced
exclusively for cost estimating. Since classes defined in different domains cannot share
parameters, the cost estimate class must be produced by manual manipulation (Niknam &
Karshenas, 2015). The manual process does not have to be tedious. Digital models
contain tools for manipulating data with much greater ease than 2D paper drawings
(Trimble Navigation Limited, 2014).
A philosophy more appropriate for BIM is creating a flexible mapping between a
designer’s model and cost estimation data. This flexible map method still involves an
ontology, but it is developed on a project basis. Each project team involves different
stakeholders, who ultimately communicate in varied fashions. The ontological definitions
should be set at the project level (Franco, Mahdi, & Abaza, 2015). Figure 8 depicts an
24
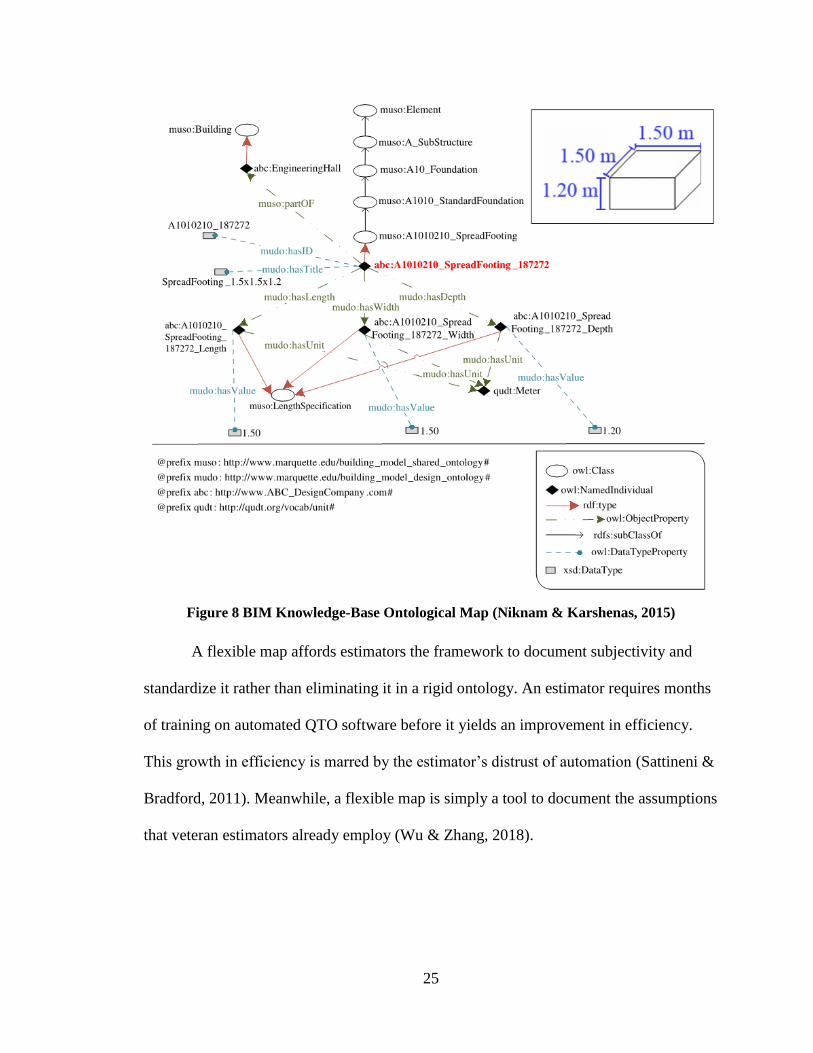
ontological map produced for a spread footing. Figure 8 suggests there is a shared
ontology between the construction team and designers. In this situation, the designers are
producing BIM models with the intent of communicating cost. Since they do not have
complete knowledge of how the contractor will complete the construction project, they
cannot fully define the cost of construction. The designer’s main goal in BIM is to
communicate the design intent of the construction project. The estimators can produce a
flexible map in the absence of a shared ontology (Niknam & Karshenas, 2015).
The flexible map system does not eliminate input from estimators as true
automation or ontology would. Instead, this tool gives estimators the efficiency to focus
their efforts on tasks more complicated than the quantity takeoff and organization of cost
estimate. Flexible mapping uses a data structure that points estimator input to existing
objects in BIM. These pointers reuse the parameters of the BIM objects in the cost
estimate (Lawrence, et al., 2014).
25
Figure 8 BIM Knowledge-Base Ontological Map (Niknam & Karshenas, 2015)
A flexible map affords estimators the framework to document subjectivity and
standardize it rather than eliminating it in a rigid ontology. An estimator requires months
of training on automated QTO software before it yields an improvement in efficiency.
This growth in efficiency is marred by the estimator’s distrust of automation (Sattineni &
Bradford, 2011). Meanwhile, a flexible map is simply a tool to document the assumptions
that veteran estimators already employ (Wu & Zhang, 2018).

26
2.5.2 Model Level of Development
The model quality is the key indicator of the simulation’s performance. One
aspect of model quality is the detail to which elements are represented; this is commonly
referred to as Level of Development (LOD). AIA Document E203-2013 sets industry
standards for LOD (Borrmann, Konig, Koch, & Beetz, 2018). A graphical representation
of that standard LOD classification is presented in Figure 9.
Figure 9 Model LOD (McPhee, 2013)
LOD is currently proportional to the level of effort a designer spends in
representing the work. So, to achieve a high level of detail, design teams must devote
considerable modeling resources. This resource devotion is cost prohibitive to completing
a model that closely represents all activities in a project. Therefore, BIM efforts typically
focus on specific high-risk activities which achieve high reward for low modeling effort
(Chen, et al., 2015).
27
2.5.3 Interoperability of Software and Data
Interoperability is the exchange data between applications to avoid data re-entry
or recycling. Interoperable data remains usable when transferred between programs.
Interoperability, strongly connected to an ontology, is analogous to the structure of the
sentence, while ontology is the meaning of words in that sentence. Interoperability leads
to increased collaboration amongst stakeholders who utilize various software platforms
(Wu & Zhang, 2018).
The BIM user must consider interoperability when selecting software applications
(Azhar, 2011). Certain software combinations will require macros, programs, or other
“links” to semi-automatically transcribe data from one data structure to the other software
which requires this intermediate manipulation is weakly interoperable (Wu & Zhang,
2018). The additional resources spent to transcribe data reduces stakeholder buy-in to
BIM-based project management (Ma, Xiong, Olawumi, Dong, & Chan, 2018).
The ISO-registered industry foundation classes (IFC) were introduced to improve
software interoperability. This data structure should produce a “one-to-many”
information flow. The IFC allows parameters of a model element produced by one
stakeholder to be re-interpreted for use by others. However, this re-interpretation still
requires subjective human input. An IFC object representing a wall could be drawn using
IfcWallStandardCase, IfcSlab, or Ifcbeam and visually present the same result. Thus,
successful IFC interoperability is also driven by an ontology. Those who model walls
must always use the correct IFC class to eliminate the need for re-interpretation. The IFC
provides only a data structure and not standards on data within the structure (Wu &
Zhang, 2018).

28
2.5.4 Data Recycling
Data recycling is a trend in the construction industry. It is the process of each
stakeholder taking information and transcribing it into their own language (Figure 10).
The current practice of manually parsing and collating data in spreadsheets is an
enormous overhead to the industry. Since multiple stakeholders interact in construction
projects, data recycling is common (Fulford & Standing, 2013).
Figure 10 BIM Based Site Information Management (Lee, Park, & Song, 2018)
Data recycling is detrimental because it increases error and is an effort that by
itself does not add value to a project (Fulford & Standing, 2013). Error is potentially
introduced at each manual data transaction. In the above example, both the architect and
engineer must manually transfer the current version file with the proper measurement
scale. This process by itself does not add any value to the project. Value in construction is
attained through activities that bring the project closer to completion (Chan, Scott, &
Chan, 2004).

29
2.6 Costs External to the Model Elements
BIM can represent a host of data spatially by linking that data to a 3D element
within the BIM model. Geometric parameters are automatically generated and stored in
BIM elements since they are required to define the 3D model. These parameters also
partially define the quantities of work items in cost estimation. However, additional
information is required to complete the cost estimate. This section examines cost
estimating information that is not stored in BIM elements automatically that should be
considered to produce a reliable model-based cost estimate.
2.6.1 Means and Methods of Construction
Construction means and methods are activities employed to complete the project
and not an element of the finished product. Since they are not the design intent, they are
not documented in construction drawings or a designer’s BIM model. However, both
design and construction are acts of communication (Lobel, 2008). The GC completes
plans a plan to build details then confirms them through submittals or requests for
information (RFI). Thereby, model elements are not authored solely by the designer. The
GC employs expert knowledge to determine means and methods (Lobel, 2008).
Defining the means and methods of construction involve a cognitive process of
understanding the project’s design intent. Scaffolding is an example of this, it is produced
from a cognitive understanding that workers must access the exterior of a multi-story
building. BIM is employed to plan, design, and represent scaffolding. The BIM-based
approach allows other stakeholders to view, understand, and add input to means and
methods the construction team selects to build the product (Kim, Cho, & Kim, 2018).
30
This digital documentation allows graphical communication the construction teams
cognitive understanding of the design intent.
A design’s constructability is driven by the means used to communicate between
design and construction. The construction team is responsible for translating this
information into a series of logical procedures to produce the finished product. RFI’s and
submittals are examples of communicating this cognitive process. BIM introduces a new
platform to both produce and interprets RFI’s and submittals. RFI’s are a tool the GC
uses when it cannot discern or produce the documented design intent (Lobel, 2008).
Education overemphasizes the model authoring aspect of BIM. There is a poor
conception that what can be modeled can be built. The construction teams that
successfully adapt BIM for their projects should emphasize the people and process arms
of over technology and information. Therefore, people who learn to translate a model to
into a physical product, or produce means and methods of construction, are more likely to
successfully employ BIM (Chen, John, & Cox, 2018).
2.6.2 Multiple Quantities Driven by an Element
A BIM element requires multiple work items to produce them physically. A wall
assembly contains studs, insulation, and drywall. These items are physically separate but
are lumped into a BIM model element. As much as twenty-five percent of the total cost
is a result of these inferred quantities. One method for addressing additional work items
is applying a waste factor or contingency. At the conceptual estimate level, contingencies
are high (AACE RP 17R-97, 2011). These high contingencies conceal the effect of
missing information by appending a factor to the bill of quantities. These factors are

31
organic and not quantitative, they are produced by a subjective understanding of the
model’s accuracy (Olsen & Taylor, 2017).
A more accurate approach for capturing additional work items is driving a
multitude from the same BIM element. In other cost estimating systems, this requires the
quantity to be produced multiple times. Using the stud wall assembly example, a separate
selection in the BIM model would be made to define studs, drywall, and insulation. This
is the “many-to-many” approach previously discussed (Wu & Zhang, 2018). To simplify
this, standard assemblies are adopted. The new problem is standardization requires
adherence to a rigid definition (Lee, Kim, & Uy, 2014). These standard cost estimating
assemblies are difficult to use in custom situations. A more effective approach maps
multiple estimate line items to a single BIM quantity (Figure 11). The difference is each
component can be customized and the parameters driven by geometry in the BIM model.
Figure 11 BIM-Based Cost-Estimation Employing Flexible Mapping (Lawrence, et al.,
2014)

32
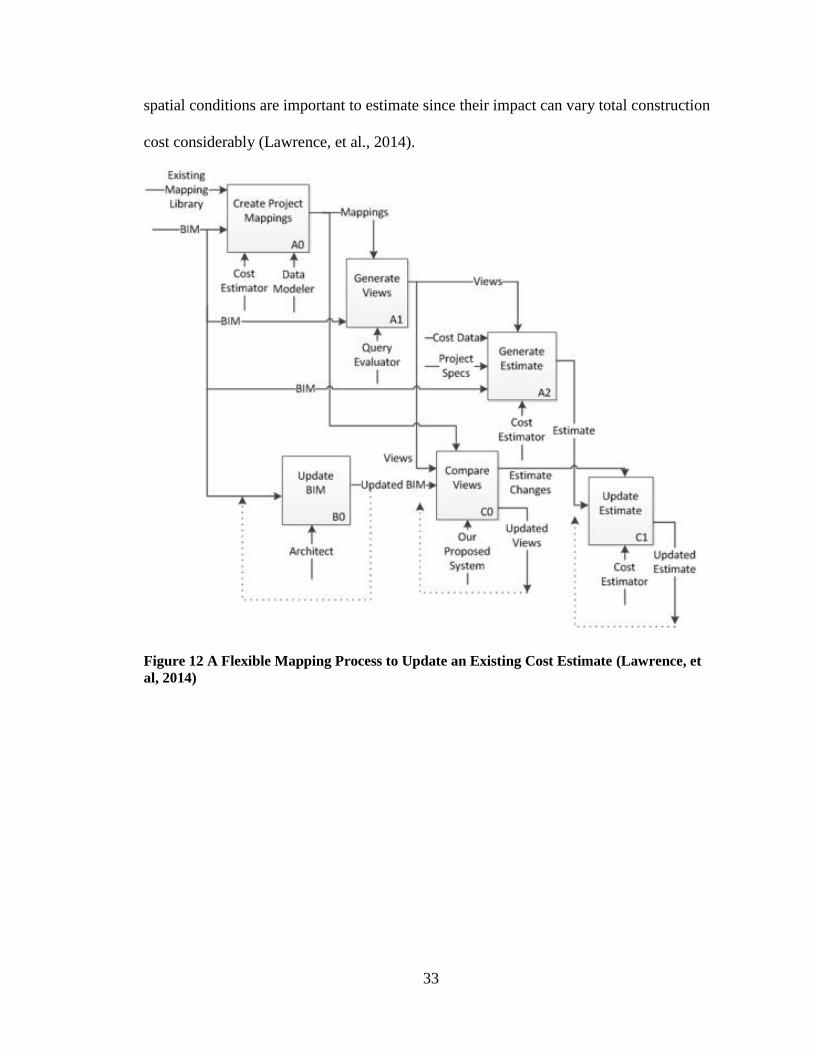
Often unnoticed are the multiple types of mappings an estimator uses to describe
a work item. Figure 11 displays a “one-to-many” parameter mapping (Wu & Zhang,
2018). This is what most BIM-based cost estimating software’s emphasize. It solely
analyzes geometric object properties. The other maps are more often produced
subjectively with the cost estimator’s own knowledge. They are proxies, aggregated
conditions, and spatial conditions. It is useful to understand each map since design
changes and updates to the model affect each differently. Another key feature of all types
of mappings is their re-usability. When these cost estimating maps are recorded into a
database, they should be used for subsequent cost estimates with similar BIM elements.
Figure 12 presents an example of a flexible mapping framework (Lawrence, et al., 2014).
A proxy map is used by estimators to price work based on historically related
parameters. An example is a baseboard quantity based on the gross floor area of a lecture
theater. The mapped items are the gross floor area and the definition of a lecture theater.
In this example, a lump sum price was provided. The lump sum allowance does not
suggest certainty in the quantity of millwork. The proxy map is useful when the plans are
incomplete, but an estimator subjectively understands the relationship from historical
data. Meanwhile, aggregated and spatial conditions abstractly represent different effects
on productivity. Aggregated conditions measure the compound effect of repetition since
productivity improves as the crew learns from each instance of practice. Spatial
conditions are a subjective measure of how the geometry will affect productivity. For
example, a curved concrete wall costs more to produce than a comparable straight wall.
The complicated curves require special formwork and attention to detail. Aggregate and
33
spatial conditions are important to estimate since their impact can vary total construction
cost considerably (Lawrence, et al., 2014).
Figure 12 A Flexible Mapping Process to Update an Existing Cost Estimate (Lawrence, et
al, 2014)

34
2.7 Construction Cost Control
This section reviews construction cost control and its relationship to BIM model-
based cost estimation. Cost control is a process to monitor the project’s budget against a
benchmark. Since the cost estimate is a benchmark, a BIM model-based cost estimate
should be tailored for use as a benchmark in cost control. Such a system should associate
historical cost data with geometric properties of BIM objects.
2.7.1 VDC Project Controls
Project control involves monitoring the resources invested in an activity and
correcting procedures to meet the targeted resource amounts. Earned value is the
percentage of an activity that is completed. So, a $100 activity that is 60% complete has
an earned value of $60. However, an activity that has consumed 60% of its duration has
not necessarily earned $60. Earned value management is a progress control system. It
considers the activity completion alongside the schedule duration. It involves capturing
the scope, schedule, and resources of the project. Earned value management enables a
comparison of earned value to the actual cost of the work completed. Earned value
management is one process that establishes investment versus work complete, thereby
providing a metric to control a project (AACE RP 10S-90, 2015).
Today, VDC is occasionally employed to control certain project metrics. In a
2014 case study titled “A Comparison of Using Traditional Cost Estimating Software and
BIM for Construction Cost Control” (Zhao & Wang, 2014), both VDC and traditional
methods were utilized to control a project. Including training on the new software, the
BIM-based method took 74 hours to complete the QTO and cost estimate. Meanwhile,
the traditional took 114 hours to complete the same QTO and cost estimate. Though

35
quicker, this exercise revealed that BIM currently lacks a library of elements and
properties to document estimate assumptions and infer parameter to modify the estimated
cost.
Project control involves monitoring a complex web of variables and managing
those variables to produce information for stakeholder decision making. VDC is excellent
for the spatial organization of variables, Figure 13 below displays the spatial organization
of a project schedule. While a system like this is a powerful cost control tool, it is not
widely adopted today. One reason for this is manually updating a BIM model is tedious
and error-prone. Therefore, the model remains static since synchronizing it with the
ongoing building process is too cumbersome and the pace of construction is dynamic. A
future VDC solution to this limitation is connecting model elements to parameters
already measured on-site (Chen, et al., 2015).
Figure 13 P6 and Assemble used in Model-Based Project Control (Scroggins, 2018)
36
2.7.2 Cost Codes for Construction Activities
Cost codes associate the actual effort of resources with a given activity. The
AACE prescribes standards for cost codes since they are a metric for controlling a
project. A central theme is the standardization of codes between estimators and project
management. Cost codes are a tool for communication and therefore require a dictionary
or standard library. Two usages of cost codes worth highlighting are providing a means to
correlate work-in-place to the budget and categorizing past performance. VDC provides a
means for defining a cost code dictionary. The two highlighted usages will provide data
to improve estimate accuracy (AACE RP 20R-98, 2003).
2.7.3 Historical Data Reporting
Historical data constitutes most of the cost basis for construction cost estimating.
A proposed system for organizing this information involves indexing and storing the cost
for specific BIM elements in a database. This proposed system allows future users of the
database to reference these BIM elements with consistent work items for generally
diverse projects. The link that enables building this database is controlling a project and
feeding the data back to the initial database (USA PN US08357417, 1999). Proper
collection and management of historical data allow estimators to build an operable
database. This can be easily referenced by professionals in the firm handling similar
decisions. BIM is great for organizing spatial data; however, it is rarely utilized to
organize a historical database. One method of assimilating historical data, collecting
labor productivity with timecards, was the lowest ranked use of BIM in a survey of GCs
(Farnsworth, et al., 2014).

37
Cost estimating is just one activity that would benefit from a spatially organized
historical database. This detailed information can be used in court to support claims to
damages resulting from other stakeholders. If other stakeholders introduce factors that
impact labor productivity on the project and this is supported with historical data, then
the construction team can be compensated for lost productivity (McDonald, et al., 2004).
2.8 Industrial Manufacturing Perspective on Cost Estimation
This section evaluates the industrial manufacturing industry’s parametric cost
estimation tools. This industry produces small parts similar to scaled-down construction
projects. It has successfully implemented a parametric model-based cost estimation
framework. This system functions by parametric assignment of cost to the geometric
features of manufactured parts.
2.8.1 Qualitative Versus Quantitative Cost Estimate Techniques
The framework used by manufacturing professionals to assign a cost to the
production of a part can be widened to the breadth of a building. The key difference is the
scale. In construction, the focus is an entire project and not an individual part. Therefore,
the same level of effort cannot be expended as it would be cost and schedule prohibitive.
Qualitative cost estimation is primarily a comparative analysis of the current project and
past results for projects with similar characteristics (Niazi, et al., 2005). Such an estimate
is based on the buildings intended use, location, the ratio of area to the perimeter, and
other global variables that affect the order of magnitude of the price. This type of
estimate is useful for determining feasibility since it is not resource intensive (AACE RP
10S-90, 2015).
38
A more developed version of qualitative cost estimation is pricing the major
building systems separately. In industrial manufacturing, this is described as case-based
reasoning, which attempts to make use of historical data that closely matches the
attributes of a new design. Meanwhile, quantitative analysis is based on a detailed
understanding of the cost to provide each item within the scope of work. Quantitative
costs are calculated using an analytical function representing different parameters. Use of
this method is typically limited to the final phase in design since it requires a complete
comprehension of the design. Parametric models express cost as a function of constituent
variables. Constituent variables become clearer with increased design development
(Niazi, et al, 2005). Quantitative analysis is better suited for a well-defined design while
qualitative methods can be more useful in early project stages. Each method has a
different level of cost certainty (AACE RP 17R-97, 2011).
2.8.2 The Activity Based Costing Method
In the manufacturing industry, the activity-based costing method (ABC) is used to
accumulate product cost. As applied to BIM-based estimation, accumulation involves
determining all work items required to physically produce a given BIM model element.
In construction, the output is the work-in-place, work items that install the work-in-place,
and associated costs are derived from pricing the work items (Qian & Ben-Arieh, 2008).
The underlying mathematical equation of the ABC model is linear and simple. It sums all
parameters multiplied by the corresponding unit price. It is possible to obtain an accurate
and quick estimation of design and development costs of one part (Qian & Ben-Arieh,
2008). BIM model elements are analogous to parts. Incorporating more parameters in the
QTO linearizes and thus simplifies the elements related to cost.
39
The same ABC method can sum non-linear parameters. An example of a non-
linear parameter is the frequency at which a line item or model element appears in the
project. As more objects appear in the project the cost decreases, but it never reaches
zero. A common example of this phenomenon is the cycle time of producing concrete
decks in vertical construction. As the crew becomes more familiar with that deck layout,
the cycle time decreases then eventually reaches a lower limit (Antunes, et al., 2018).
2.9 Summary of Identified Limitations
BIM QTO alone is insufficient for detailed cost estimation. The spatial context
required to increase accuracy is lost when the quantities are exported from BIM. The
estimators must manually quantify gaps in the SOW since BIM QTO only captures the
cost of the finished product. BIM element definitions are “flexible”; therefore, a rigid
ontology cannot be established. Due to the flexible definitions of BIM elements, they
must be mapped by conditioning the BIM model. BIM QTO allows changes in the design
to smoothly propagate to the estimate and improve cost estimating efficiency. BIM QTO
should be utilized as a step-in model-based cost estimation to address these limitations.
Model-based cost estimation is the complete incorporation of cost estimate
information into the BIM model. Such a system requires a succinct framework to
facilitate its adoption. The model-based estimate should be tailored for use in project cost
control to refine future cost estimate assumptions. Detailed ABC yields parametric
definitions of cost for mass-produced parts, this process should be applied to
construction. Manually authoring gaps to the SOW is an opportunity for the GC to
communicate means and methods which may encourage adoption of this process as it
reduces mistakes.

40
A successful framework for model-based construction cost estimation will
implement improvements to the eight limitations listed below:
1. The framework should be easy to use and concise.
2. The estimators should be able to incorporate their subjective opinion and
tribal knowledge into the model-based cost estimate.
3. Construction contracts should be refined to warrant the accuracy and
completeness of a BIM model that is used in the framework.
4. The model-based estimate should be completed parametrically, by
referencing only the parameters available in the BIM environment
5. Using VDC cost control and a cost code tethering structure, construction
phase production data should be available for estimate data refinement.
6. The means and methods of construction that are defined by the contractor
should be modeled in the BIM environment. The parameters of these
elements should be used to estimate the cost of the means and methods of
construction.
7. The project team should employ flexible mapping procedures to link their
data sources together and reduce data recycling.
8. The project team should use a succinct software suite that is interoperable
with the software or other project stakeholders.
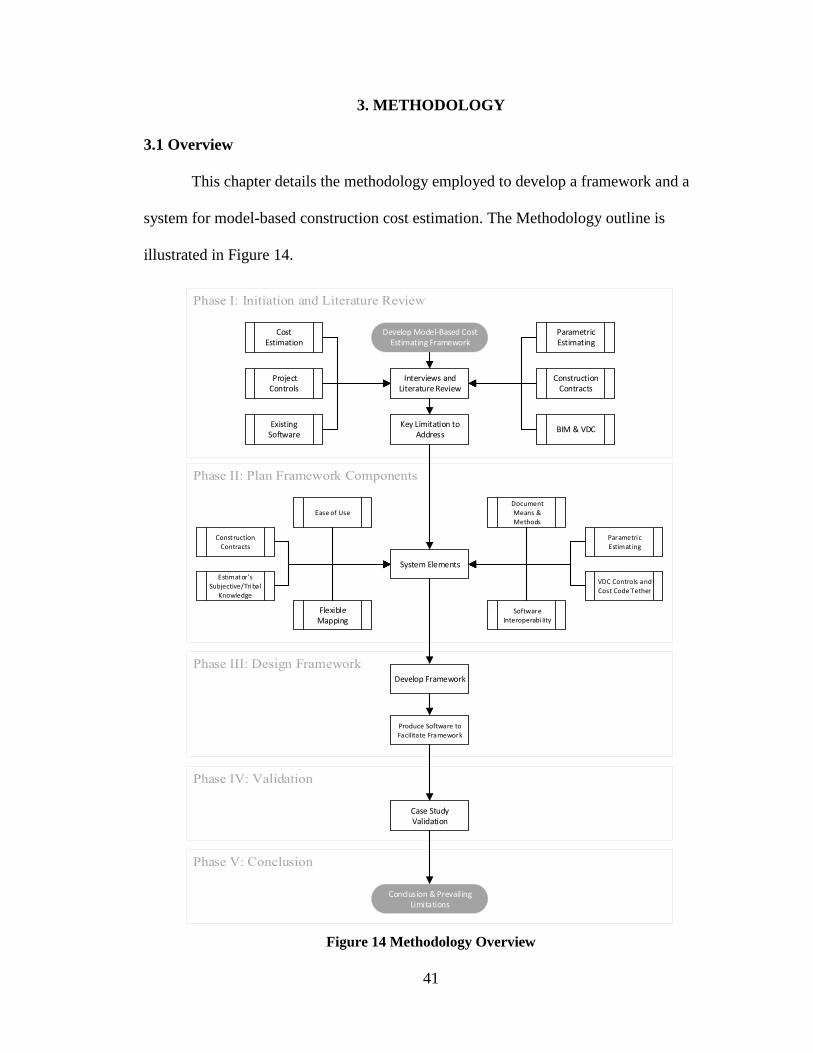
41
3. METHODOLOGY
3.1 Overview
This chapter details the methodology employed to develop a framework and a
system for model-based construction cost estimation. The Methodology outline is
illustrated in Figure 14.
Develop Model-Based Cost Estimating Framework
Conclusion & Prevailing Limitations
Interviews and Literature Review
Existing Software
Construction Contracts
BIM & VDC
Cost Estimation
Project Controls
Parametric Estimating
System Elements
SoftwareInteroperabi lity
Flexible Mapping
Document Means & Methods
Parametric Estimat ing
Ease of Use
VDC Controls and Cost Code Tether
Construction Contracts
Estimator s Subjective/Tribal
Knowledge
Develop Framework
Produce Software to Facilitate Framework
Case Study Validation
Key Limitation to Address
Figure 14 Methodology Overview
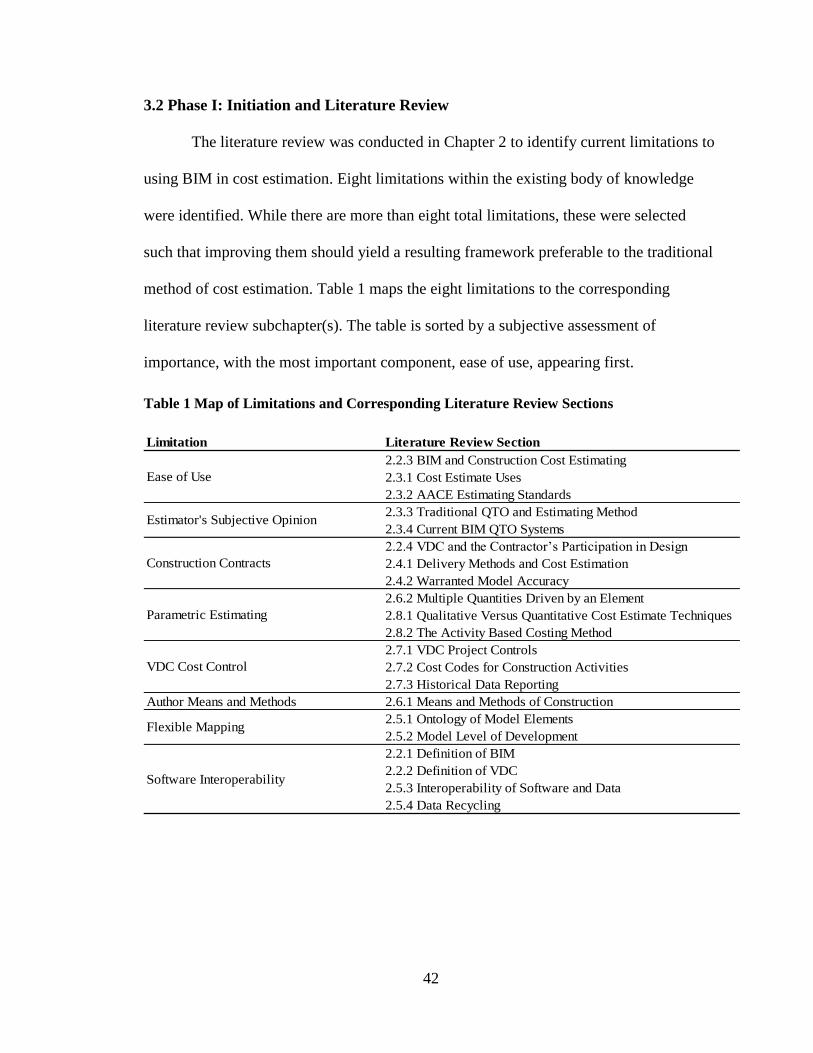
42
3.2 Phase I: Initiation and Literature Review
The literature review was conducted in Chapter 2 to identify current limitations to
using BIM in cost estimation. Eight limitations within the existing body of knowledge
were identified. While there are more than eight total limitations, these were selected
such that improving them should yield a resulting framework preferable to the traditional
method of cost estimation. Table 1 maps the eight limitations to the corresponding
literature review subchapter(s). The table is sorted by a subjective assessment of
importance, with the most important component, ease of use, appearing first.
Table 1 Map of Limitations and Corresponding Literature Review Sections
Limitation Literature Review Section
2.2.3 BIM and Construction Cost Estimating
2.3.1 Cost Estimate Uses
2.3.2 AACE Estimating Standards
2.3.3 Traditional QTO and Estimating Method
2.3.4 Current BIM QTO Systems
2.2.4 VDC and the Contractor’s Participation in Design
2.4.1 Delivery Methods and Cost Estimation
2.4.2 Warranted Model Accuracy
2.6.2 Multiple Quantities Driven by an Element
2.8.1 Qualitative Versus Quantitative Cost Estimate Techniques
2.8.2 The Activity Based Costing Method
2.7.1 VDC Project Controls
2.7.2 Cost Codes for Construction Activities
2.7.3 Historical Data Reporting
Author Means and Methods 2.6.1 Means and Methods of Construction
2.5.1 Ontology of Model Elements
2.5.2 Model Level of Development
2.2.1 Definition of BIM
2.2.2 Definition of VDC
2.5.3 Interoperability of Software and Data
2.5.4 Data Recycling
Software Interoperability
VDC Cost Control
Construction Contracts
Ease of Use
Estimator's Subjective Opinion
Flexible Mapping
Parametric Estimating
43
3.2.1 Ease of Use
Ease of use is prioritized in this methodology. This is primarily to encourage
adoption. Ease of use should make this framework preferable to the traditional method.
The second reason lies in achieving reliability and repeatability. A simple framework is
more likely to produce results with less variation. As mentioned previously, other
stakeholders are equally interested in a cost estimating framework’s ease of use. This
methodology considers three categories of questions other stakeholders mays ask. These
three levels are 1) Reporting “how much does it cost”, 2) Querying “how much does this
particular feature cost” 3) Alteration “what would change if we did something different”.
The framework should produce a cost estimate that can answer all three questions, unlike
the traditional method.
3.2.2 Estimator’s Subjective Opinion of a Work Item’s Cost
Addressing this limitation involves the documentation of subjective opinion
within BIM. The purpose of documenting it is for analysis during and after construction.
The documented information provides a comparison opportunity between the parameters
of estimated and actual cost to complete.
3.2.3 Construction Contracts
A major issue for detailed cost estimation using BIM is the contractually
warranted model accuracy. This subject ties into the existing practice of defining a model
LOD, but it includes two sub-requirements. They are the quality and quantity of BIM
model elements. There is cost uncertainty associated with both in BIM models and LOD
is not enough alone to address this. The scope of this research proposes only warranting
the accuracy and not the completeness of any BIM model elements. Completeness is the
44
responsibility of the contractor; with vague plans, they have the freedom to innovate.
Accuracy of information guarantees that any reference made to the parameters of the
BIM elements by the estimators is accurate. Future research should investigate the effect
of quantity of BIM elements upon cost estimate accuracy.
3.2.4 Parametric Estimating
Parametric estimating is the process of linking multiple work items to a single
BIM model element and interlinking multiple parameters to a single work item. The key
advantages are 1) these work items do not need to be authored in BIM and 2) the
parameters can be evaluated once actual project cost data are available. It provides more
information with less BIM authoring. It allows assumptions about work items to be made
early then confirmed or denied when a more complete model is available. In the early
design stage, the database of potential work items associated with a BIM element acts as
a checklist. This checklist feature should reduce the variance in estimated cost between
design document iterations.
3.2.5 VDC Cost Control
A plethora of cost data is produced during construction operations. Collecting it
tethered to the BIM model elements allows for better audit and data mining capabilities.
This feature allows estimators to control costs and forecast the cost to complete during
construction while also refining production data for use in future estimates. Current
practices do not involve estimators during the construction phase.
45
3.2.6 Means and Methods
Identifying the optimal construction approach (means and methods) is an integral
part of the cost estimating process. The estimators make decisions about what the
construction team will do to produce the work in place, dependent upon the available
resources. These choices bind the construction team to a budget that allocates only those
resource. A ladder, man lift, or scaffolding are all examples of means and methods that
can be employed to work on a building’s exterior. So, documenting the decision on
selected construction approach in the model 1) allows the cost of alternatives to be easily
evaluated and 2) communicates the decision to other estimate stakeholders.
3.2.7 Flexible Mapping
Flexible mapping is interrelating two existing data sets, like cost and BIM
element parameters, with a recorded map. This is contrary to the current practice of
extracting BIM element parameters and importing them to a cost estimating environment.
It is rooted in how cost estimates are completed today with quantity extraction. This
extraction is a manual one-time process that must be repeated with each design iteration.
Flexible mapping allows the quantity links to be reused in subsequent design iterations.
Addressing the flexible mapping limitation should 1) reduce the menial tasks that
estimators perform and 2) decrease the cost of estimating design changes. The flexible
map should allow parameters stored in BIM elements produced by the design team to
flow through to the proper cost estimate work items.
46
3.2.8 Software Interoperability
The software interoperability limitation is the inability of computation platforms
to succinctly communicate data to each other. The industry today manually recycles data
to remedy this issue. The simplest solution requires that the team use a specific software
package. Therefore, this framework is built on popular Autodesk and Microsoft software
including Revit, Navisworks, SQL Server, Excel, and Power BI.
3.3 Phase II: Plan Framework Components
The planning phase began with an analysis of the eight limitations identified in
the literature review, see Section 2.9 Summary of Identified Limitations. The analysis
revealed that three computation tools in addition to BIM, Business Intelligence (BI), C#,
and SQL, were required to address the eight limitations. SQL was chosen to manage and
query a large set of interrelated tables of data. Meanwhile, C# was implemented to
correlate rows in a manageable and queryable database with BIM elements through
Navisworks. BI is a platform that easily queries and reports data from SQL. It is
implemented to allow different stakeholders with varying levels of access to the same
database. These three computation platforms should enable ease of use in the framework.
They are described in more detail in Sections 3.3.1 and 3.3.2. With these two
computation tools in mind, the framework was conceptually outlined to define its
skeleton. This outlining process considered the steps of the AACE Cost Estimating
Process (AACE RP 19R-97, 2003). Steps One through Three are directly taken from the
AACE RP. Step four was inspired by the AACE RP and adapted, which should improve
47
the cost estimating database over time. The results of this phase in the thesis are
summarized in the roadmap (Figure 15).
3.3.1 Structured Query Language and Business Intelligence
The Structured Query Language (SQL) powers a database and enables computations to
be performed within it. This enables both the storage of historical cost estimate data and
the computations that use this data with BIM element parameters. Computation is
supported by pre-defined and custom wrote functions for specific columns in a table.
Another key feature is that it can support a host of interrelated tables. This allows the
association of cost estimate information with the construction schedule, suppliers,
subcontractors, BIM authoring software, and past cost estimates. SQL is the background
architecture that allows all parameters influencing the project’s cost to be available in the
model-based cost estimate. Business Intelligence (BI) is a process for analyzing SQL
data. It enables visual analysis of cost data alongside the various other cost estimate
influences. This process can return all the costs associated with a specific BIM element,
floor level, sub-trade, subcontractor, etc. It is a tool that enables the visualization of SQL
data.
3.3.2 Navisworks Application Programming Interface Add-in
The Navisworks add-in is written using the Autodesk application programming
interface (API). It is written in the C# programming language and contains namespaces
for reading and writing data to an SQL database. Since SQL is a database and
computation platform, C# must only handle the input and output transaction from the
database to Navisworks.
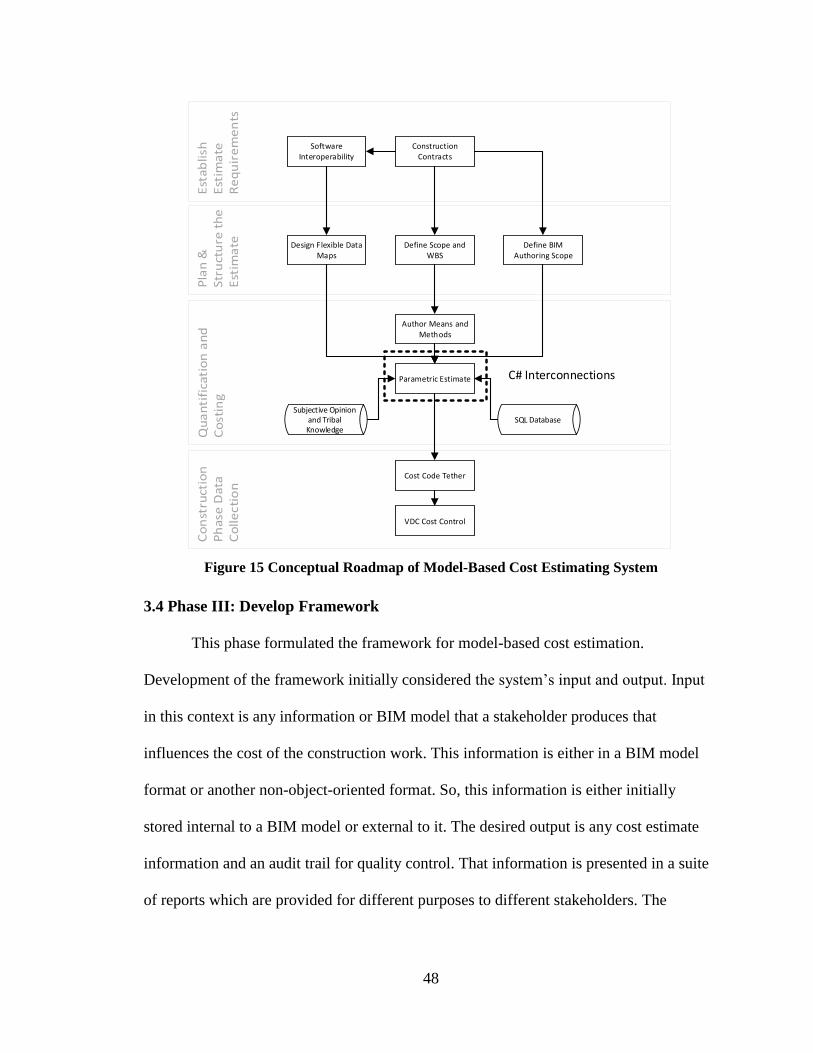
48
Construction Contracts
Software Interoperability
Define Scope and WBS
Design Flexible Data Maps
Define BIM Authoring Scope
Author Means and Methods
Parametric Estimate
SQL Database
Cost Code Tether
Subjective Opinion and Tribal Knowledge
VDC Cost Control
C# Interconnections
Figure 15 Conceptual Roadmap of Model-Based Cost Estimating System
3.4 Phase III: Develop Framework
This phase formulated the framework for model-based cost estimation.
Development of the framework initially considered the system’s input and output. Input
in this context is any information or BIM model that a stakeholder produces that
influences the cost of the construction work. This information is either in a BIM model
format or another non-object-oriented format. So, this information is either initially
stored internal to a BIM model or external to it. The desired output is any cost estimate
information and an audit trail for quality control. That information is presented in a suite
of reports which are provided for different purposes to different stakeholders. The
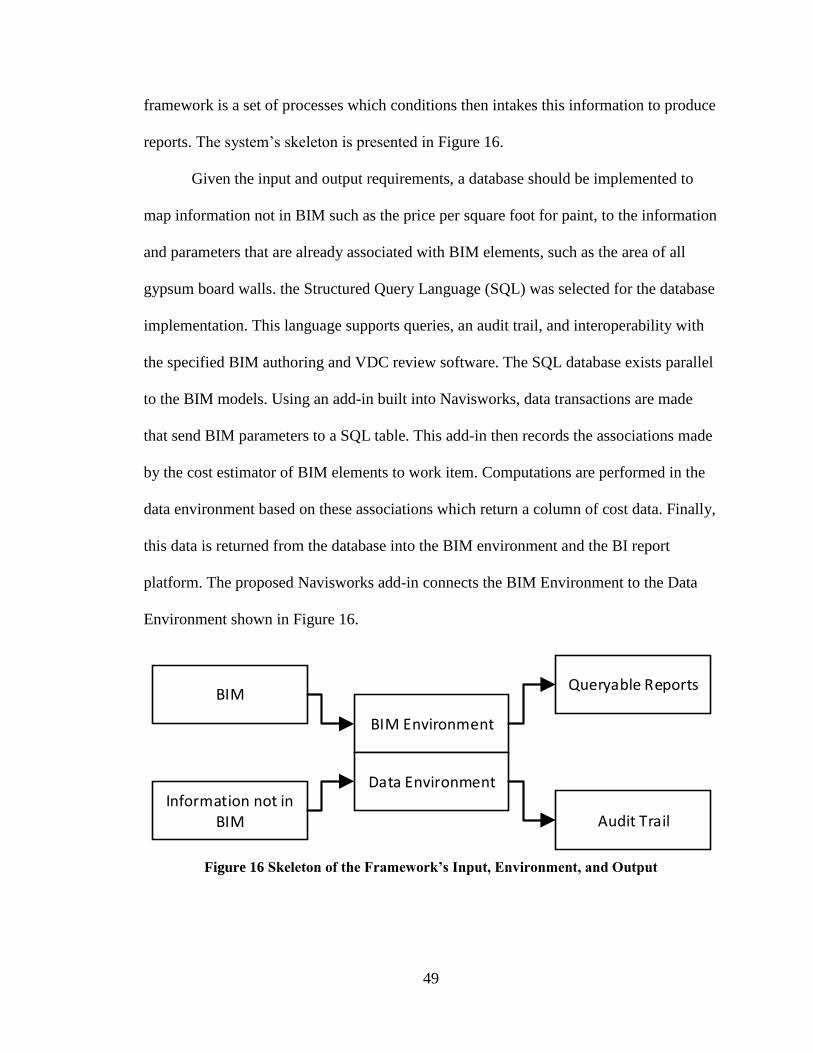
49
framework is a set of processes which conditions then intakes this information to produce
reports. The system’s skeleton is presented in Figure 16.
Given the input and output requirements, a database should be implemented to
map information not in BIM such as the price per square foot for paint, to the information
and parameters that are already associated with BIM elements, such as the area of all
gypsum board walls. the Structured Query Language (SQL) was selected for the database
implementation. This language supports queries, an audit trail, and interoperability with
the specified BIM authoring and VDC review software. The SQL database exists parallel
to the BIM models. Using an add-in built into Navisworks, data transactions are made
that send BIM parameters to a SQL table. This add-in then records the associations made
by the cost estimator of BIM elements to work item. Computations are performed in the
data environment based on these associations which return a column of cost data. Finally,
this data is returned from the database into the BIM environment and the BI report
platform. The proposed Navisworks add-in connects the BIM Environment to the Data
Environment shown in Figure 16.
BIM
Information not in BIM
BIM Environment
Queryable Reports
Data Environment
Audit Trail
Figure 16 Skeleton of the Framework’s Input, Environment, and Output

50
3.5 Phase IV: Validation
The validation phase applied the framework to a real case study construction
project. The studied project employed the design-build delivery method and its BIM
model had the LOD for model-based co-ordination. The first three modules in the
framework were followed to complete three separate estimate reports. Three cost estimate
reports were created following the traditional method, the BIM QTO method, and the
model-based cost estimating framework respectively. Each cost estimate was completed
using the project drawings, specs, and BIM model (except for the traditional method).
All three of the cases employed the process outlined in Figure 17. The estimate reports
are presented and analyzed.
Establish Estimate Requirements
Plan and Structure the Estimate
Quantification and Costing
OBS
WBS
QTO
Work-Item Identification
Data Transcription
Reference Historical Data
Basis of Estimate
Estimate Report
Figure 17 Cost Estimating Steps Followed in the Case Study Validation
3.6 Phase V: Conclusions and Recommendations
A summary is presented in the conclusions and recommendations Chapter that
covers the framework, case study implementation, and results. The challenges
encountered during the model-based estimating case study and lessons learned are also
presented. The prevailing limitations are those that were identified in the literature review
but not addressed in the framework. These should be the focus of future works.
51
3.7 Summary
This chapter presented the methodology employed to develop and propose the
following framework. The literature review conducted in Phase I indicated the current
limitations to model-based cost estimation. The planning in Phase II identified eight
limitations to the existing body of knowledge that the proposed framework should
improve. The design in Phase III synthesized these eight limitations into a single
methodology to develop a framework for model-based cost estimation. Phase IV was
intended to validate the framework, it was a case study of a real, completed, construction
project. Then Phase V presented the findings from the research along with other
limitations that were outside the scope of this thesis.
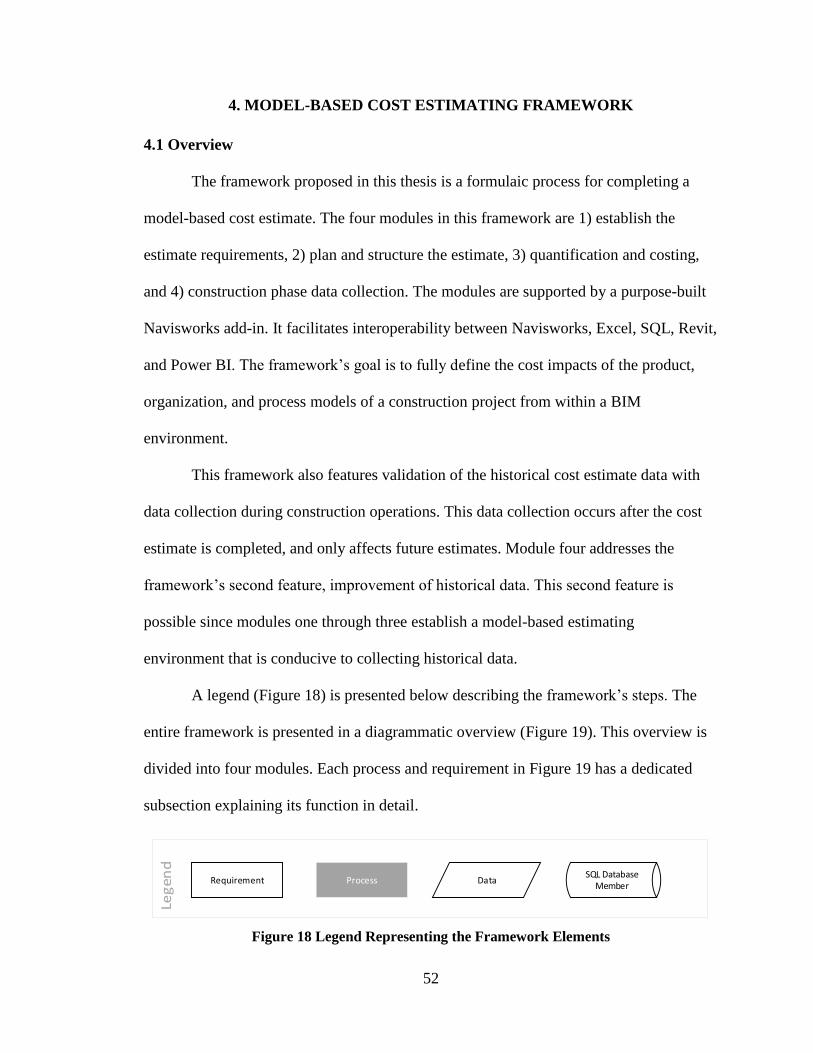
52
4. MODEL-BASED COST ESTIMATING FRAMEWORK
4.1 Overview
The framework proposed in this thesis is a formulaic process for completing a
model-based cost estimate. The four modules in this framework are 1) establish the
estimate requirements, 2) plan and structure the estimate, 3) quantification and costing,
and 4) construction phase data collection. The modules are supported by a purpose-built
Navisworks add-in. It facilitates interoperability between Navisworks, Excel, SQL, Revit,
and Power BI. The framework’s goal is to fully define the cost impacts of the product,
organization, and process models of a construction project from within a BIM
environment.
This framework also features validation of the historical cost estimate data with
data collection during construction operations. This data collection occurs after the cost
estimate is completed, and only affects future estimates. Module four addresses the
framework’s second feature, improvement of historical data. This second feature is
possible since modules one through three establish a model-based estimating
environment that is conducive to collecting historical data.
A legend (Figure 18) is presented below describing the framework’s steps. The
entire framework is presented in a diagrammatic overview (Figure 19). This overview is
divided into four modules. Each process and requirement in Figure 19 has a dedicated
subsection explaining its function in detail.
RequirementSQL Database
MemberProcess Data
Figure 18 Legend Representing the Framework Elements
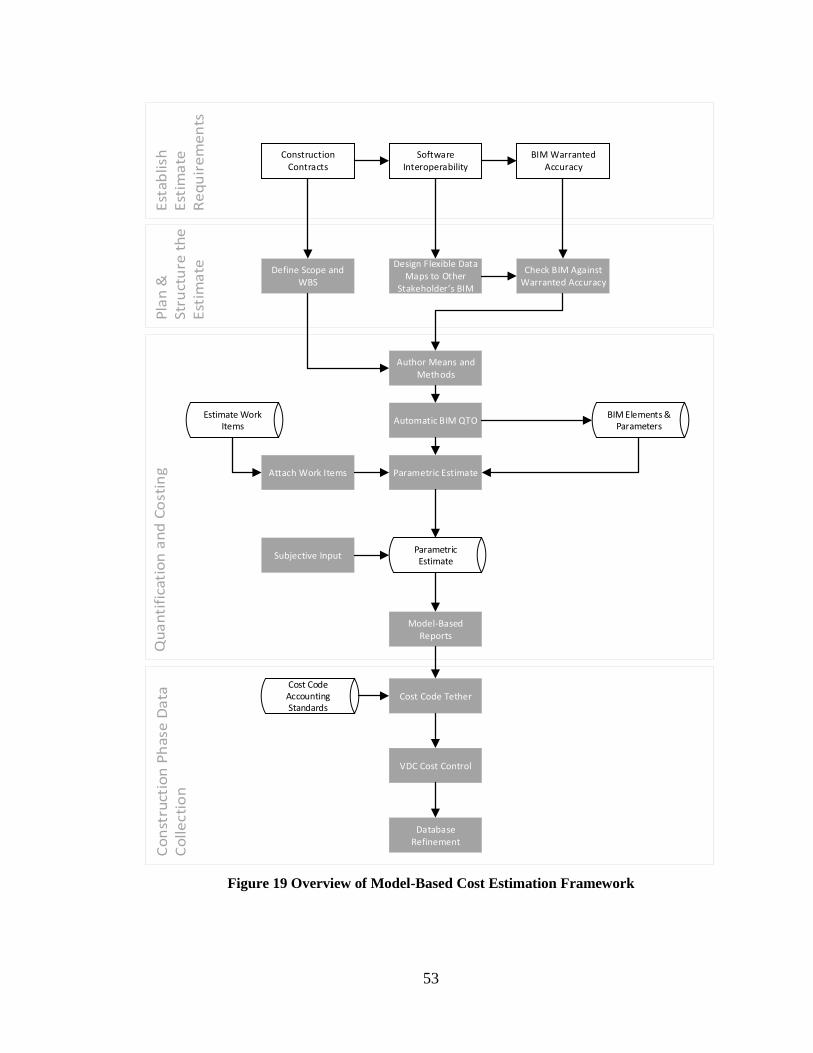
53
Author Means and Methods
Attach Work Items
Automatic BIM QTO
VDC Cost Control
Parametric Estimate
Parametric Estimate
Estimate Work Items
BIM Elements & Parameters
Model-Based Reports
Database Refinement
Cost Code TetherCost Code Accounting Standards
Subjective Input
Construction Contracts
Software Interoperability
Define Scope and WBS
Design Flexible Data Maps to Other
Stakeholder s BIM
Check BIM Against Warranted Accuracy
BIM Warranted Accuracy
Figure 19 Overview of Model-Based Cost Estimation Framework
54
4.2 Establish Estimate Requirements
The estimate requirements must be established prior to any BIM authoring by
stakeholders. The purpose of these requirements is to establish a BIM model that can
produce a reliable cost estimate. Repeatability is achieved by flexible data mapping. The
flexible map allows parameters stored in BIM elements produced by the design team to
flow through to the proper cost estimate work items. This module sets the requirements
for reliability and repeatability, which prepares the stakeholders’ models for conditioning.
4.2.1 Construction Contracts: BIM Execution Plan
This framework proposes that construction contracts should contain specific
language regarding software interoperability and BIM warranted accuracy, denoted as the
BIM Execution Plan (BEP). A BEP ensures software interoperability which reduces the
need to recycle data previously produced by other stakeholders. This framework uses
Autodesk Revit for all BIM authoring, so the BEP should specify that this is the required
modeling software for the design team to use. If they are unable to meet this requirement,
then the software should be capable of communicating its data with Revit through a
software link. However, the scope of this framework is limited to one software link that
facilitates communication with Revit only. A BEP’s warranted accuracy ensures that the
BIM elements presented by the design team contain accurate information like location,
size, and function. This could be achieved in part by specifying a LOD for design models.
But the BEP must also incorporate quantity and quality control tasks performed
automatically by a computation platform or manually by the cost estimators. In this
research, all quantity and quality control efforts were manual.
55
4.2.2 Software Interoperability
There are two levels of software interoperability, intrastakeholder versus
interstakeholder. Inter-stakeholder interoperability is defined by the contracts created
between the design team members and the contractor performing the cost estimate. The
requirement is that the software communicates through links as specified in the
construction contracts sub-section. This framework uses C# to bridge a software’s data to
a SQL database. That data link is reading Revit instances from within Navisworks. So,
the software links can either connect the designer’s data into a Revit model or directly
into the SQL database through C#. This type of interoperability is intended to reduce data
recycling between the project stakeholders. This interoperability requirement is defined
in the contracts between the contractor and other stakeholders who author BIM models.
At the intra-stakeholder level, software interoperability is achieved with the
estimators sticking to Autodesk Revit for authoring and Navisworks for estimating. This
setup allows estimators to take advantage of Revit’s Switchback feature for Navisworks.
This feature allows estimators to author means and methods while completing the
estimate. While the BIM authoring takes place in Revit, Switchback allows this process
to start and end in Navisworks. This feature allows the entire estimate to be completed
with Navisworks as the singular locus of control. It initiates the switch into and out of
Revit and achieves intra-stakeholder interoperability.
Figure 20 presents the suite of software used in the proposed framework. Other
software combinations can produce the same model-based cost estimate. However, each
combination would require its own purpose-built data connection and software add-in.
The framework limited the scope of software to a single combination so that
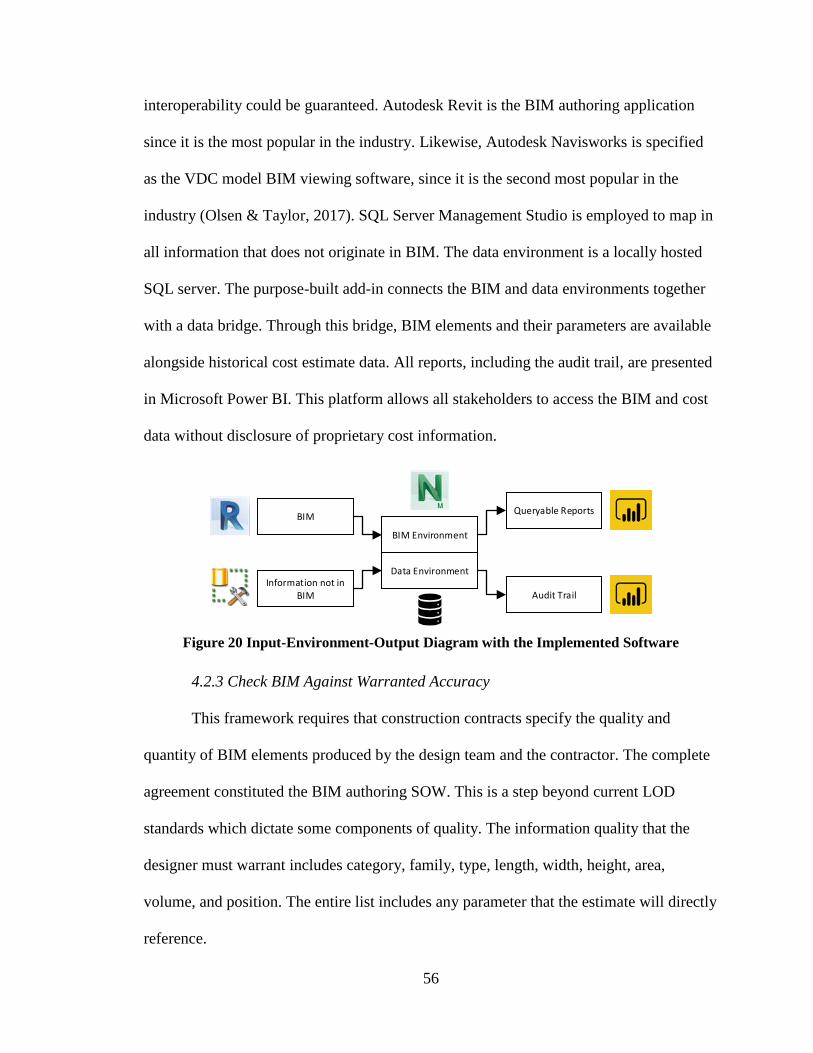
56
interoperability could be guaranteed. Autodesk Revit is the BIM authoring application
since it is the most popular in the industry. Likewise, Autodesk Navisworks is specified
as the VDC model BIM viewing software, since it is the second most popular in the
industry (Olsen & Taylor, 2017). SQL Server Management Studio is employed to map in
all information that does not originate in BIM. The data environment is a locally hosted
SQL server. The purpose-built add-in connects the BIM and data environments together
with a data bridge. Through this bridge, BIM elements and their parameters are available
alongside historical cost estimate data. All reports, including the audit trail, are presented
in Microsoft Power BI. This platform allows all stakeholders to access the BIM and cost
data without disclosure of proprietary cost information.
BIM
Information not in BIM
BIM Environment
Queryable Reports
Data Environment
Audit Trail
Figure 20 Input-Environment-Output Diagram with the Implemented Software
4.2.3 Check BIM Against Warranted Accuracy
This framework requires that construction contracts specify the quality and
quantity of BIM elements produced by the design team and the contractor. The complete
agreement constituted the BIM authoring SOW. This is a step beyond current LOD
standards which dictate some components of quality. The information quality that the
designer must warrant includes category, family, type, length, width, height, area,
volume, and position. The entire list includes any parameter that the estimate will directly
reference.
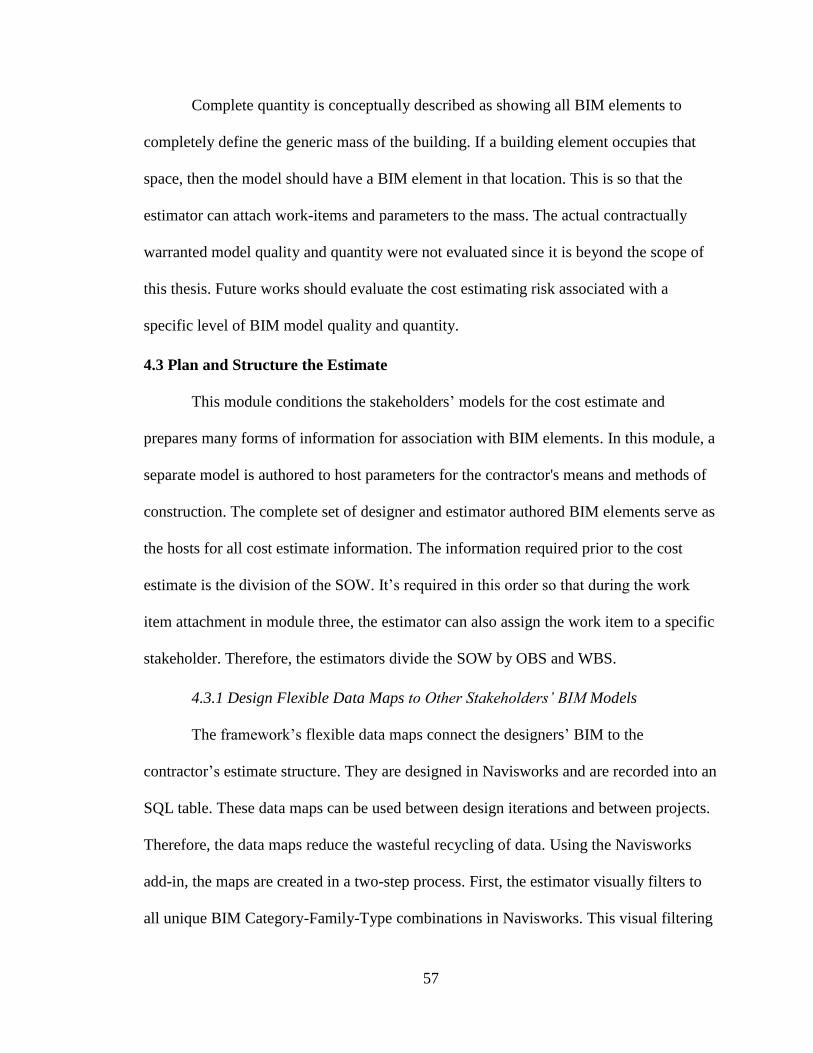
57
Complete quantity is conceptually described as showing all BIM elements to
completely define the generic mass of the building. If a building element occupies that
space, then the model should have a BIM element in that location. This is so that the
estimator can attach work-items and parameters to the mass. The actual contractually
warranted model quality and quantity were not evaluated since it is beyond the scope of
this thesis. Future works should evaluate the cost estimating risk associated with a
specific level of BIM model quality and quantity.
4.3 Plan and Structure the Estimate
This module conditions the stakeholders’ models for the cost estimate and
prepares many forms of information for association with BIM elements. In this module, a
separate model is authored to host parameters for the contractor's means and methods of
construction. The complete set of designer and estimator authored BIM elements serve as
the hosts for all cost estimate information. The information required prior to the cost
estimate is the division of the SOW. It’s required in this order so that during the work
item attachment in module three, the estimator can also assign the work item to a specific
stakeholder. Therefore, the estimators divide the SOW by OBS and WBS.
4.3.1 Design Flexible Data Maps to Other Stakeholders’ BIM Models
The framework’s flexible data maps connect the designers’ BIM to the
contractor’s estimate structure. They are designed in Navisworks and are recorded into an
SQL table. These data maps can be used between design iterations and between projects.
Therefore, the data maps reduce the wasteful recycling of data. Using the Navisworks
add-in, the maps are created in a two-step process. First, the estimator visually filters to
all unique BIM Category-Family-Type combinations in Navisworks. This visual filtering
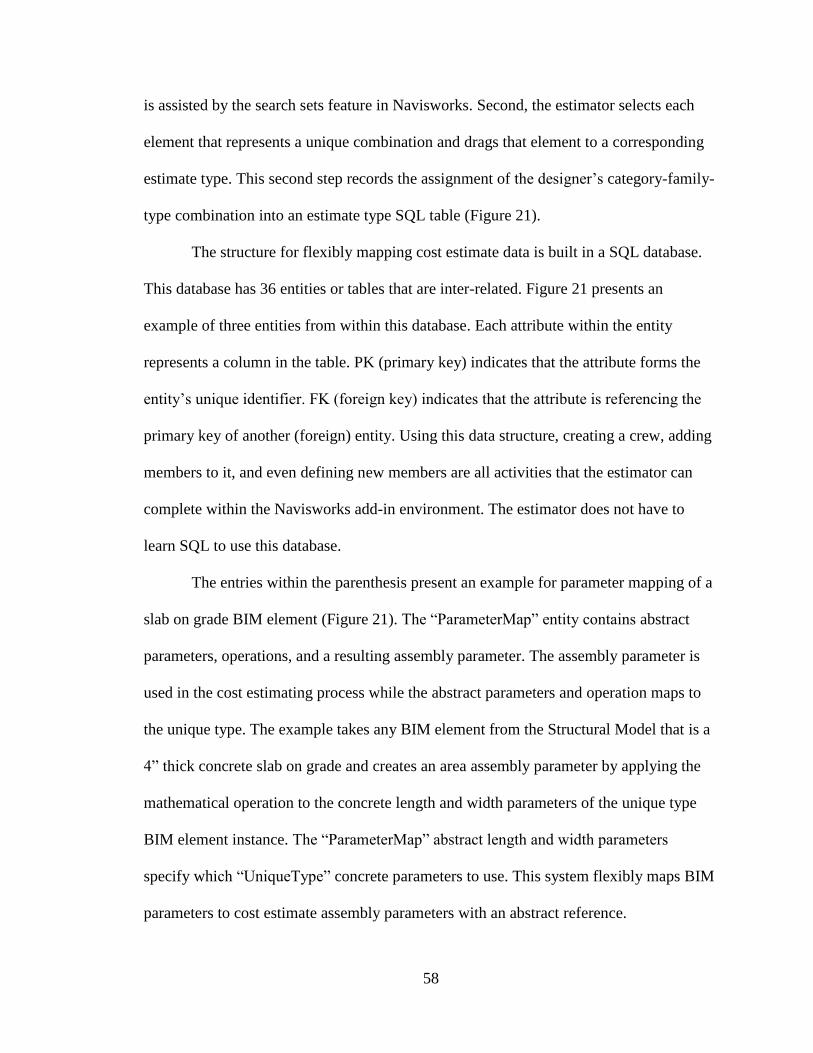
58
is assisted by the search sets feature in Navisworks. Second, the estimator selects each
element that represents a unique combination and drags that element to a corresponding
estimate type. This second step records the assignment of the designer’s category-family-
type combination into an estimate type SQL table (Figure 21).
The structure for flexibly mapping cost estimate data is built in a SQL database.
This database has 36 entities or tables that are inter-related. Figure 21 presents an
example of three entities from within this database. Each attribute within the entity
represents a column in the table. PK (primary key) indicates that the attribute forms the
entity’s unique identifier. FK (foreign key) indicates that the attribute is referencing the
primary key of another (foreign) entity. Using this data structure, creating a crew, adding
members to it, and even defining new members are all activities that the estimator can
complete within the Navisworks add-in environment. The estimator does not have to
learn SQL to use this database.
The entries within the parenthesis present an example for parameter mapping of a
slab on grade BIM element (Figure 21). The “ParameterMap” entity contains abstract
parameters, operations, and a resulting assembly parameter. The assembly parameter is
used in the cost estimating process while the abstract parameters and operation maps to
the unique type. The example takes any BIM element from the Structural Model that is a
4” thick concrete slab on grade and creates an area assembly parameter by applying the
mathematical operation to the concrete length and width parameters of the unique type
BIM element instance. The “ParameterMap” abstract length and width parameters
specify which “UniqueType” concrete parameters to use. This system flexibly maps BIM
parameters to cost estimate assembly parameters with an abstract reference.
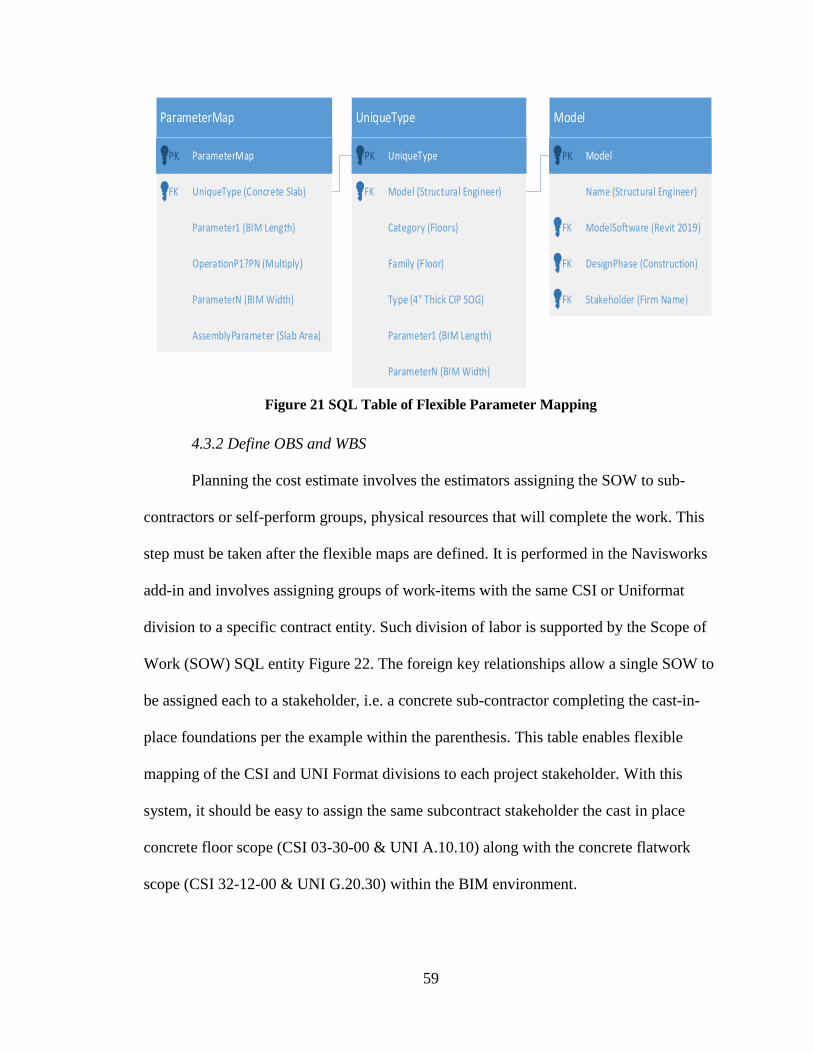
59
Model
ModelPK
Name (Structural Engineer)
DesignPhase (Construction)FK
Stakeholder (Firm Name)FK
ModelSoftware (Revit 2019)FK
UniqueType
UniqueTypePK
Category (Floors)
Family (Floor)
Type (4" Thick CIP SOG)
Parameter1 (BIM Length)
ParameterN (BIM Width)
Model (Structural Engineer)FK
ParameterMap
ParameterMapPK
AssemblyParameter (Slab Area)
Parameter1 (BIM Length)
ParameterN (BIM Width)
OperationP1?PN (Multiply)
UniqueType (Concrete Slab)FK
Figure 21 SQL Table of Flexible Parameter Mapping
4.3.2 Define OBS and WBS
Planning the cost estimate involves the estimators assigning the SOW to sub-
contractors or self-perform groups, physical resources that will complete the work. This
step must be taken after the flexible maps are defined. It is performed in the Navisworks
add-in and involves assigning groups of work-items with the same CSI or Uniformat
division to a specific contract entity. Such division of labor is supported by the Scope of
Work (SOW) SQL entity Figure 22. The foreign key relationships allow a single SOW to
be assigned each to a stakeholder, i.e. a concrete sub-contractor completing the cast-in-
place foundations per the example within the parenthesis. This table enables flexible
mapping of the CSI and UNI Format divisions to each project stakeholder. With this
system, it should be easy to assign the same subcontract stakeholder the cast in place
concrete floor scope (CSI 03-30-00 & UNI A.10.10) along with the concrete flatwork
scope (CSI 32-12-00 & UNI G.20.30) within the BIM environment.

60
SOW
SOW (#1)PK
CSI (03-30-00)FK
UNIFormat (A.10.10)FK
Specification (03-00-00)FK
Name (Cast-in-place Concrete Foundations)
Stakeholder (Concrete Sub-contractor)FK
Figure 22 Stakeholder: OBS & CSI UNI Specification: WBS
4.4 Quantification and Costing
Parametric estimating is the primary limitation addressed in the quantification and
costing module. It involves linking existing and new BIM parameters to estimator created
work items. Each BIM element hosts a set of work items. These work items are driven by
the BIM parameters that are children of the hosting BIM element. The quantification and
costing module produces new cost information in the context of the conditioned BIM
model. The output of this step is the model-based cost estimate.
4.4.1 Author Means and Methods
The estimators coordinate with the construction operations group to define the
means and methods of construction. Traditionally, this is done with communications
external to the cost estimate platform. Diminishing the audit trail for decisions. This
framework instead proposes authoring the means and methods within the model
environment since the environment functions as the cost estimate platform. Once the
means and methods are defined in BIM, the estimators can use these BIM elements to

61
host the work items associated with that mean or method. The cost of the work items is
driven using the BIM element parameters.
This should be the only step where the estimator undertakes BIM authoring if the
contractual BIM warranted accuracy is met. The framework prescribes that the finished
building volume is accurately represented by the design team’s BIM models. Section
4.3.2 outlines the BIM model’s warranted accuracy requirement. So, if the design team is
delivering models that meet the requirement, then the estimators need not complete any
additional BIM modeling to produce the cost estimate for the work-in-place. However,
means and methods occupy additional 3D space beyond the work-in-place. Means and
methods of construction are not work-in-place, they need additional parameters not
available in the design team’s models to be estimated within the model-based
environment. These additional parameters are provided by BIM elements authored by the
estimators.
Figure 23 outlines the BIM authoring process that the estimator completes when
the design team has submitted their models for cost estimation. First, the estimator opens
Revit from within Navisworks, using the Autodesk switchback feature. The estimator
then links in the design team’s models to use as a background or guide for placing BIM
elements. Once the estimator identifies a mean or method, it can be attached as a work
item to the existing design team’s BIM models, or if that work item requires custom
parameters to estimate its cost. If the work item does not require custom parameters, then
no new BIM element is authored. Otherwise, the estimator checks the existing custom
Revit families for an instance to host that work item. The estimator must create a new
reusable family if one is not available. Then the estimator places the BIM element in the

62
new Revit BIM model. Once the BIM element is authored, the estimator switches back to
Navisworks to attach one or more work items to that BIM element. At the end of this
step, every BIM element required to complete the cost estimate should be authored.
Therefore, every parameter that is required in the cost estimate should be available within
the BIM model.
Start
Does a Custom
Family Exist?End
Load Family
into Revit
Can it be described
by a Designer s BIM
Parameters?
Attach as a Work
Item
Yes
No
Yes
No
List of Custom
Families and
Corresponding
Parameters
Place
instances
Load Links to
the Design
Team s
Models
Attach Work Items
Identify a
Construction
Mean or
Method
Author New
Revit Family
Store New
Family in List
Open Revit
with
Switchback
Design Team s
BIM Models
Figure 23 Flowchart Outlining the Documentation of Means and Methods

63
4.4.2 Automatic QTO of BIM Elements
The process followed up until this point should yield a set of BIM models that
define all the spatial parameters of the project when combined. This step of the
framework prescribes that these models be appended into a single Navisworks file set
(filetype .nwf). It includes the designer’s intent and the estimator’s means and methods.
This single Navisworks file contains all project BIM elements and spatial parameters.
The add-in can then complete an automatic recording of all the BIM elements in
the model. It will create an SQL table whose primary key is the element Id and model Id.
The other columns will host all the element’s parameters. Each row in this table contains
one BIM element an all its associated parameters. This is like a QTO except the table
does not have any work items stored directly in it. This table instead acts as a checklist, it
includes all BIM elements that should have associated work-items before the estimate is
complete. This is the data table that the add-in will read from when the estimator is
performing the model-based cost estimate. Figure 24 shows a diagram of this table. The
first three columns are Element ID, Model ID, and Model name. Then there is an
additional column for each parameter used. Examples of these parameters include length,
width, height, area. This table effectively transfers all the BIM information required to
complete the estimate out of the BIM model.

64
BIMSchedule
BIMSchedulePK
StartDate (4/1/2018)
EndDate (5/1/2018)
UniqueType
UniqueTypePK
Category (Floors)
Family (Floor)
Type (4" Thick CIP SOG)
Parameter1 (BIM Length)
ParameterN (BIM Width)
ElementId (Automatic QTO)
ElementIdPK
Parameter1 (BIM Length = 100)
ParameterN (BIM Width = 50)
Model (Structural Engineer)FK
BIMSchedule (Phase 1)FK
Model (Structural Engineer)PKFK
UniqueType 4" SOGFK
Name (Phase 1)
Figure 24 SQL Table of all BIM Elements in the Project
The automatic QTO process is facilitated with a Navisworks Add-in. This add-in
enables the flow of BIM data into and cost estimate data out of SQL. Data flows through
the add-in utilizing a SQL connection and SQL data model (Figure 25). The connection is
simply a reference to the hosting location of the SQL server. The data model is a C#
based emulation of the actual SQL database. It contains 36 classes, each emulating one of
the 36 database entities. The C# class shown in Figure 25 is the data model emulation of
the “Element Id” SQL entity. The class name is “Element Id”, matching the name of the
entity in the database. The entity has a foreign key relationship to the “ParamEstimate”
entity, (Figure 31) so it contains a hash set that refers to the “ParamEstimate” C# class.
ElementID, Model, UniqueType, BIMSchedule, and AssemblyParameter are all entries in
the SQL database and are therefore variables in the C# data model class. This data model
serves as a bridge for extracting information from BIM then writing it into the SQL
database.
65
Figure 25 Navisworks Add-in Data Model for connecting the BIM Elements to SQL
4.4.3 Attach Work Items
The following two framework steps, work item attachment, and parametric
estimate, are completed consecutively for each attached work item. This is a departure
from the traditional method, where the entire QTO is completed then the entire estimate
is completed. In this framework, the cost estimation of a work item happens immediately
after its quantification. This is an important difference because it allows the estimator to
capture the context and the knowledge that is gathered during quantification then
immediately incorporate it in the cost estimate.
When the work item attachment step begins, all required reference information
should be linked into the model-based environment. Now the estimators establish the

66
quantity of work for the entire project. This quantification process is similar to the
traditional QTO in which estimators examine the model to determine the quantity of
work. Except in this framework, information is flowing into the BIM model instead of
out. This is why the framework contains the keyword “model-based”, the work item
attachment is completed in the context of the BIM model.
The first activity in the work item attachment step (Figure 26) is selecting a BIM
element within the Navisworks model. When this is done, the add-in reads the selection
and queries the SQL database. It returns a list of all potential work items that are pre-
mapped to that element’s BIM hierarchy. If the estimator finds the desired work item in
that filtered list, then the process continues. Otherwise, the estimator may need to define
a new mapping, or even define a new work item. The estimator should strive to utilize
existing work items because a newly created work item will have no historical data
automatically associated with it from past projects. The estimator has now either found or
defined the work item that should be attached to the BIM element. Next, the estimator
chooses whether this work item belongs to an assembly. If it stands alone, then the work
item attachment process is complete. If it is within an assembly, then the estimator can
choose or define a new assembly. Once the assembly is selected or defined, the estimator
completes the work item attachment step by clicking a button and moving on to the
parametric estimate step. This step took place within the Navisworks add-in. Once the
estimator clicked the button to move on, the work item attachment record was recorded
into the work item SQL table. This record is externally available to the power BI
reporting software.
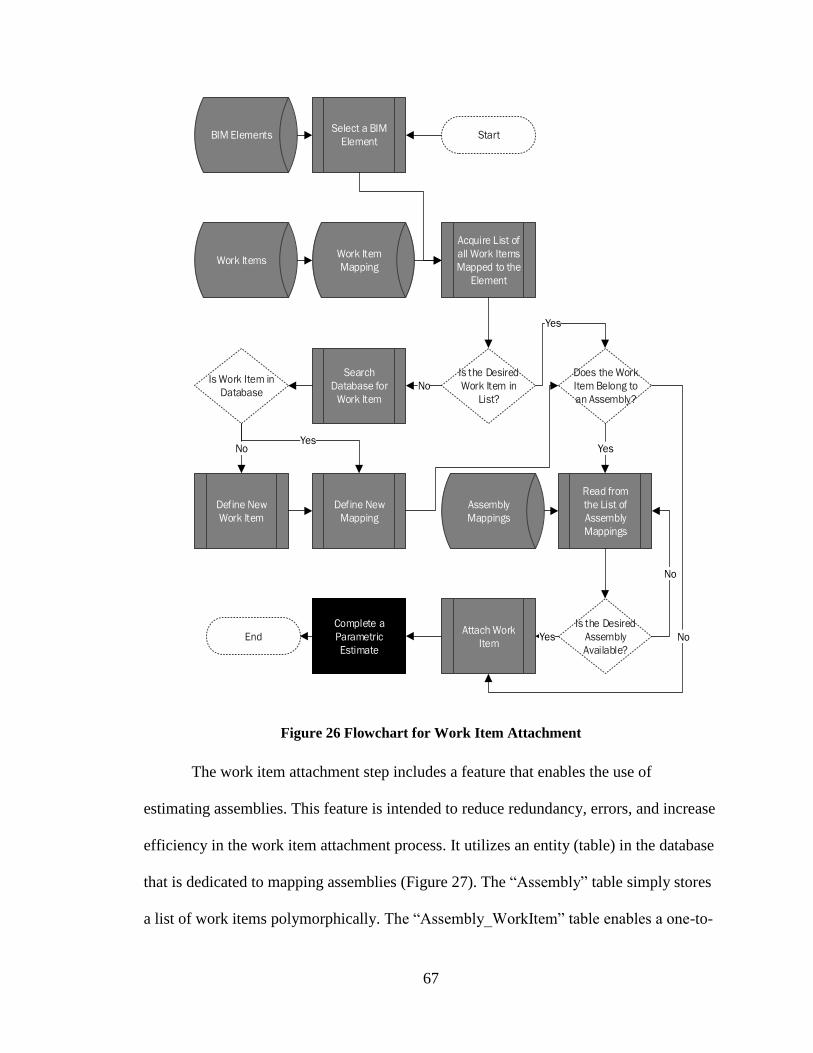
67
Start
Is the Desired
Work Item in
List?
End
Complete a
Parametric
Estimate
Acquire List of
all Work Items
Mapped to the
Element
Attach Work
Item
Work Item
Mapping
Define New
Mapping
NoIs Work Item in
Database
Define New
Work Item
Work Items
Select a BIM
ElementBIM Elements
Search
Database for
Work Item
NoYes
Does the Work
Item Belong to
an Assembly?
Yes
No
Read from
the List of
Assembly
Mappings
Assembly
Mappings
Yes
Is the Desired
Assembly
Available?
No
Yes
Figure 26 Flowchart for Work Item Attachment
The work item attachment step includes a feature that enables the use of
estimating assemblies. This feature is intended to reduce redundancy, errors, and increase
efficiency in the work item attachment process. It utilizes an entity (table) in the database
that is dedicated to mapping assemblies (Figure 27). The “Assembly” table simply stores
a list of work items polymorphically. The “Assembly_WorkItem” table enables a one-to-

68
many relationship of one assembly containing multiple work items of each type (labor,
material, and equipment). It also allows multiple scopes of work to be estimated in a
single assembly. This platform leverages the repeatability of assembly estimating
alongside the detailed cost estimate produced by a work item level estimate.
Assembly_WorkItem
AssemblyPKFK
WorkItemPKFK
LaborWI
LaborWIPK
CrewFK
Name
WorkItem_WI
WorkItemPK
MaterialWIFK
MaterialWI
MaterialWIPK
Name
CSIFK
CSIFK
LaborWIFK
EquipmentWIFK
MaterialQuoteFK
UOM
Assembly
AssemblyPK
UNIFormatFK
UnitCost
UOM
SOWFK
Name
Name
ContactFK
ContactFK
EquipmentWI
EquipmentWIPK
Name
CSIFK
EquipmentRateFK
ContactFK
Figure 27 Assembly Estimating Feature for Work Item Attachment Step
The next user feature is work item attachment (Figure 28). This is what allows the
user to transfer BIM data into SQL. When the estimator selects an element, the add-in
reads that element’s unique Element Id, “Type Name” in Figure 28. Per section 4.4.2, the
Element Id is already in SQL. Therefore, the BIM parameters for that element are
available in SQL. Once selected, the estimator finds and attaches the desired work item in
a list that is filtered by the type of object selected. The assembly parameter for this work
item is driven by the parameter mapping specified in the param estimate SQL entity
Figure 31. Selecting the element allows the estimator to complete a SQL based cost
estimate while using BIM as a visual aide.
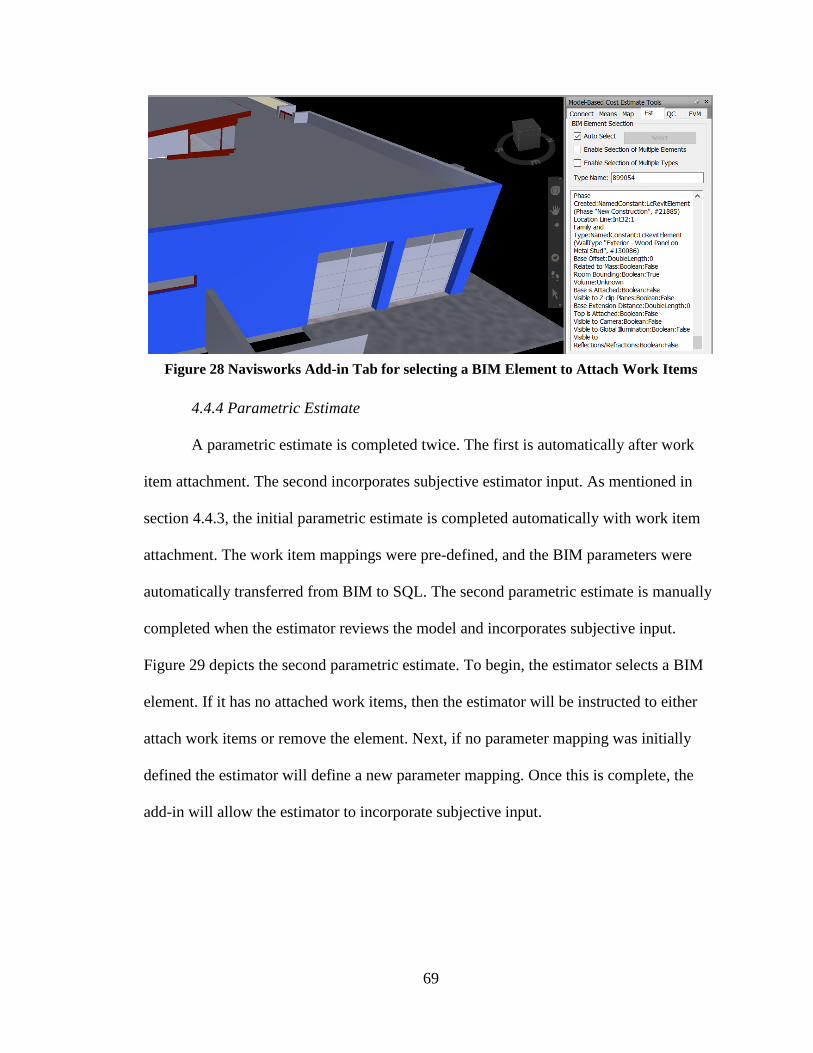
69
Figure 28 Navisworks Add-in Tab for selecting a BIM Element to Attach Work Items
4.4.4 Parametric Estimate
A parametric estimate is completed twice. The first is automatically after work
item attachment. The second incorporates subjective estimator input. As mentioned in
section 4.4.3, the initial parametric estimate is completed automatically with work item
attachment. The work item mappings were pre-defined, and the BIM parameters were
automatically transferred from BIM to SQL. The second parametric estimate is manually
completed when the estimator reviews the model and incorporates subjective input.
Figure 29 depicts the second parametric estimate. To begin, the estimator selects a BIM
element. If it has no attached work items, then the estimator will be instructed to either
attach work items or remove the element. Next, if no parameter mapping was initially
defined the estimator will define a new parameter mapping. Once this is complete, the
add-in will allow the estimator to incorporate subjective input.
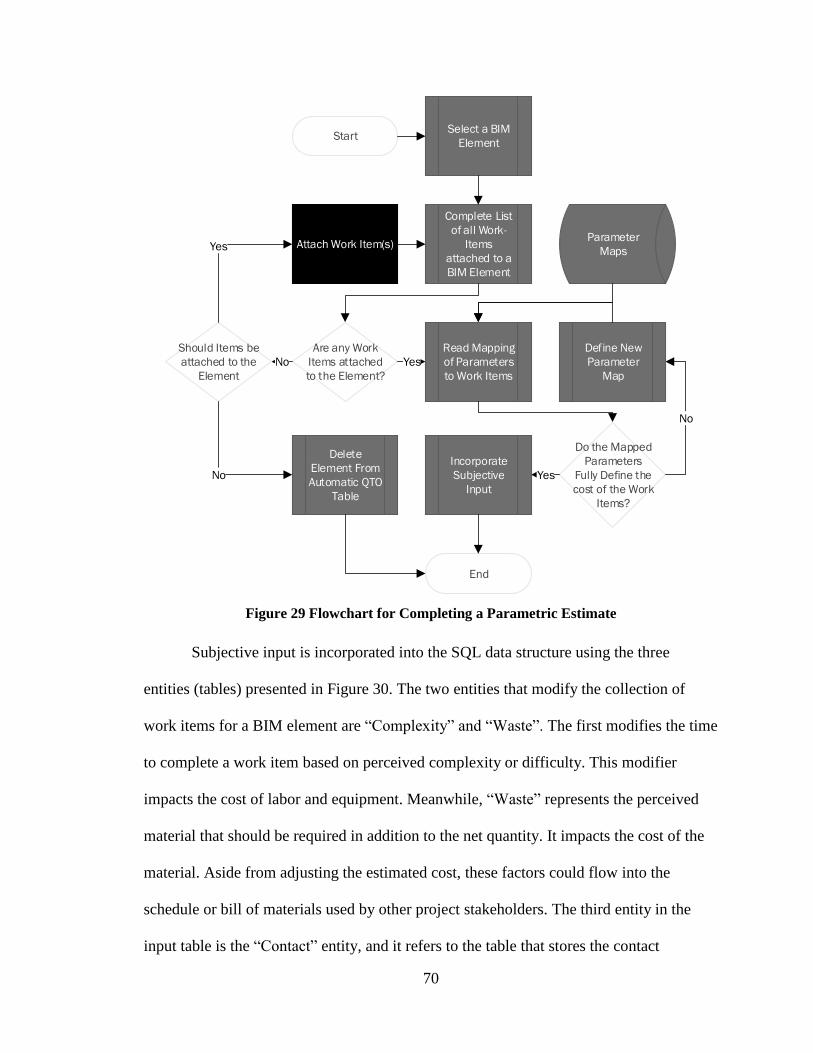
70
Start
Are any Work
Items attached
to the Element?
End
Parameter
Maps
No
Should Items be
attached to the
Element
Delete
Element From
Automatic QTO
Table
No
Yes
Yes
Do the Mapped
Parameters
Fully Define the
cost of the Work
Items?
Yes
No
Complete List
of all Work-
Items
attached to a
BIM Element
Read Mapping
of Parameters
to Work Items
Define New
Parameter
Map
Incorporate
Subjective
Input
Attach Work Item(s)
Select a BIM
Element
Figure 29 Flowchart for Completing a Parametric Estimate
Subjective input is incorporated into the SQL data structure using the three
entities (tables) presented in Figure 30. The two entities that modify the collection of
work items for a BIM element are “Complexity” and “Waste”. The first modifies the time
to complete a work item based on perceived complexity or difficulty. This modifier
impacts the cost of labor and equipment. Meanwhile, “Waste” represents the perceived
material that should be required in addition to the net quantity. It impacts the cost of the
material. Aside from adjusting the estimated cost, these factors could flow into the
schedule or bill of materials used by other project stakeholders. The third entity in the
input table is the “Contact” entity, and it refers to the table that stores the contact
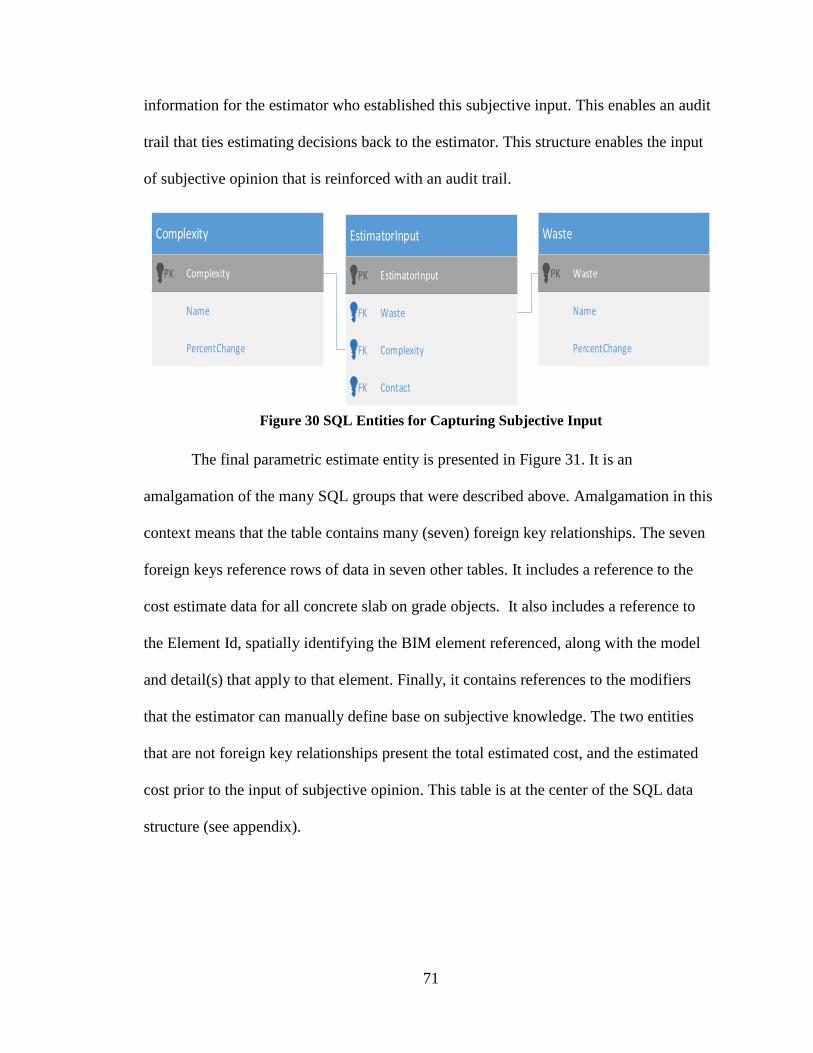
71
information for the estimator who established this subjective input. This enables an audit
trail that ties estimating decisions back to the estimator. This structure enables the input
of subjective opinion that is reinforced with an audit trail.
EstimatorInput
EstimatorInputPK
WasteFK
Complexity
ComplexityPK
Name
ComplexityFKPercentChange
Waste
WastePK
Name
PercentChange
ContactFK
Figure 30 SQL Entities for Capturing Subjective Input
The final parametric estimate entity is presented in Figure 31. It is an
amalgamation of the many SQL groups that were described above. Amalgamation in this
context means that the table contains many (seven) foreign key relationships. The seven
foreign keys reference rows of data in seven other tables. It includes a reference to the
cost estimate data for all concrete slab on grade objects. It also includes a reference to
the Element Id, spatially identifying the BIM element referenced, along with the model
and detail(s) that apply to that element. Finally, it contains references to the modifiers
that the estimator can manually define base on subjective knowledge. The two entities
that are not foreign key relationships present the total estimated cost, and the estimated
cost prior to the input of subjective opinion. This table is at the center of the SQL data
structure (see appendix).

72
ParamEstimate
ParamEstimatePK
ElementId (101048)FK
ParameterMap (4" Concrete SOG Area)FK
Assembly (4" Concrete SOG)FK
BIMCost
EstimateSchedule (4/1/2018-5/1/2018)FK
EstimatorInput (Estimator ID)FK
EstimatedCost
Detail (A/S4.1)FK
Model (Structural)FK
BIM
Estimator
Cost Data
Figure 31 Parametric Estimate SQL Table
4.4.5 Model-Based Reports
There are two types of reports produced by this framework as mentioned in
Figure 20. One presents cost estimate data while the second presents an audit trail. The
main feature added in these reports is the ability to query the underlying data. The data is
contextually linked to BIM elements. Through the audit trail, other stakeholders can
review the assumptions made in the cost estimating process. The cost estimate reports are
enhanced by queries. Queries can either filter BIM elements by cost or costs by BIM
element. Furthermore, any data brought into the model in the conditioning is accessible to
these queries. The estimator can find the cost for a scope of work, or for every element on
a building level without doing additional takeoff or estimate manipulation. The queryable
73
reports allow multiple stakeholders to consume the same estimate data. This adaptability
reduces the recycling of data in the estimate reporting process.
An audit trail establishes a record of the assumptions made in the cost estimating
process. Other stakeholders can review the audit trail reports to answer specific questions
that would otherwise be communicated through conversation. Example uses of the audit
trail reports include ascertaining which estimator made which set of assumptions,
determining the impact of assumptions on the estimated cost, and understanding how
complexity is subjectively defined. Answers to these reporting questions alongside
historical cost data refinement should improve future cost estimate assumptions.
4.5 Model-Based Historical Cost Data Refinement
The key limitation addressed in this module is VDC cost control. This final
module in the framework is the crux for the successful implementation of model-based
cost estimation. This section should produce revelations tying productivity and cost to
model geometry, product specifications, and other BIM element parameters. The
revelation of these relationships, in the context of BIM elements, should further improve
the performance of model-based cost estimation.
4.5.1 Cost Code Tether
The premise of this step is to associate a set of estimate work items with a specific
cost code. The field uses accounting cost codes to budget their work, pay employees, and
track progress. Currently, these codes are set by the accounting department and field
personnel. So, there is some disconnect between the estimate and field personnel’s cost
breakdown structure. In the proposed framework, these codes are set and managed by the
estimators. If an issue arises and the field needs another cost code to bill, then the
74
estimators should be the ones to create a new cost code. the estimators remain involved
while construction is in progress to map estimate information to production data.
At the end of module three, the estimators created cost reports and an audit trail
driven by the data model amalgamated with the BIM model. This complete cost model
included a list of work items with associated material, labor, and equipment costs. These
work items were also associated with specific BIM elements in the model. The first step
in module four ties estimated quantities and durations to the actual construction cost. The
real cost is collected with cost codes, which are filled out by the field construction
personnel. When these cost codes are tied to work items, the actual cost can be compared
side by side with the estimated cost. Furthermore, this tether connects the cost codes to
the BIM elements and their associated parameters. This gives cost codes a 3D spatial
organization structure. So, once the work items are tethered to a cost code, historical
accounting data is available in the model-based environment. This allows the estimating
to review the accuracy of their estimate at the end of construction.
Implementation of this cost code tether is achieved within SQL. Figure 31 in
section 4.4.4 shows the “ParametricEstimate” SQL Entity. This entity is linked to the
“CostCode” entity by way of the “CostCode_ParametricEstimate” entity, both shown in
Figure 32. This setup allows multiple work items to be associated with the same cost
code. This is an example of a “one to many” relationship that is enabled by the SQL
language. This affords the estimators flexibility to assign their estimate items to cost
code. The relational structure also allows the relationship to be established after the
estimate is complete. I.e. the estimators do not need to assign each work item to a cost
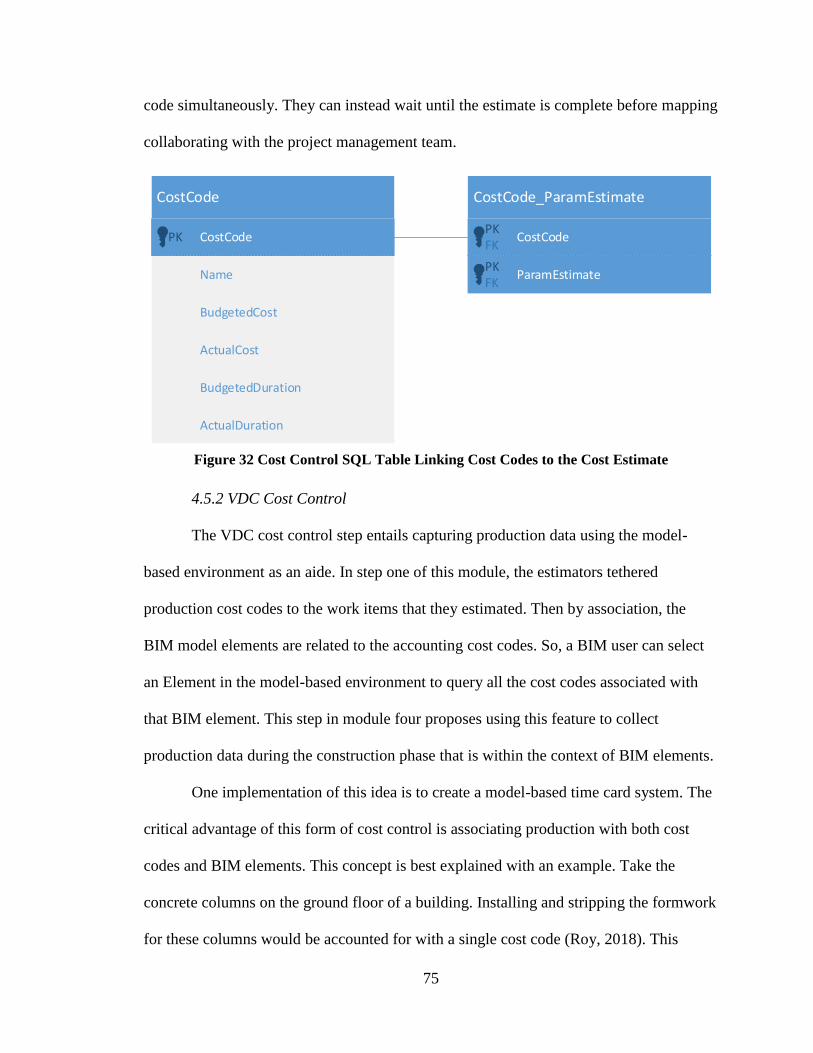
75
code simultaneously. They can instead wait until the estimate is complete before mapping
collaborating with the project management team.
CostCode
CostCodePK
Name
CostCode_ParamEstimate
CostCodePKFK
ParamEstimatePKFK
BudgetedCost
BudgetedDuration
ActualCost
ActualDuration
Figure 32 Cost Control SQL Table Linking Cost Codes to the Cost Estimate
4.5.2 VDC Cost Control
The VDC cost control step entails capturing production data using the model-
based environment as an aide. In step one of this module, the estimators tethered
production cost codes to the work items that they estimated. Then by association, the
BIM model elements are related to the accounting cost codes. So, a BIM user can select
an Element in the model-based environment to query all the cost codes associated with
that BIM element. This step in module four proposes using this feature to collect
production data during the construction phase that is within the context of BIM elements.
One implementation of this idea is to create a model-based time card system. The
critical advantage of this form of cost control is associating production with both cost
codes and BIM elements. This concept is best explained with an example. Take the
concrete columns on the ground floor of a building. Installing and stripping the formwork
for these columns would be accounted for with a single cost code (Roy, 2018). This
76
means that a crew can report their production rate for formwork of all columns on the
ground floor. When these numbers are reviewed in the production report, only an
aggregate average for all columns is available. However, when this data collection is
done within the context of the model these production rates are discrete for each BIM
element. The production report can then evaluate the differences in production rates by
each individual column. This feature should help the estimators analyze the BIM element
parameters alongside the reported production. This analysis should lead to an
understanding of which BIM element parameters affect production rates.
4.5.3 Historical Data Refinement
The final step in the framework is to analyze the collected data and refine the
production rates that are stored in the work item SQL database. As the framework is
repeated on additional projects, the accuracy of the work-item database should evolve.
The first cost estimates would be completed with a database derived from traditional cost
estimates and production reports. Current production reports are blind to the element
properties for which a certain production rate was achieved. The database evolution
should be driven by the increase in granularity of the production reporting process. The
model-based data is associated with BIM elements and can, therefore, access element
properties. The project team should be able to gather more data in the context of the BIM
model without adding additional responsibilities for the field team to handle.
4.6 Summary
This chapter detailed the steps within the four modules of the model-based cost
estimating framework. The first module prepared the project team to handle the BIM
model conditioning process. These preparations enable accessibility of all the project’s
77
data required for a cost estimate from within the BIM model. The second module
conditioned the BIM models that would be used in the quantification and costing process.
This conditioning process established the estimate structure in the context of the BIM
model. The third module established the project’s cost within the BIM model
environment. The estimators added work items that were hosted and driven by the BIM
elements and their parameters. The fourth module leveraged the model conditioning and
cost estimation to refine the construction phase data collection process. The production
data captured in this framework is contextually linked to the work items and host BIM
elements. This fourth module allows database refinement that should evolve the accuracy
of future model-based cost estimates.
78
5. IMPLEMENTATION
5.1 Overview
The proposed cost estimation framework was tested against a real construction
project. A case study comparison was made between the traditional, BIM QTO, and
model-based cost estimating methods. The case study’s scope is limited to a single twelve
thousand square foot structural concrete slab on grade (SOG). This element is the
foundation slab of building 4E in the Yakʔitʸutʸu student housing project at Cal Poly in
San Luis Obispo. The three cost estimates of that element were performed in the
following order, 1) a traditional QTO and Excel-based cost estimate, 2) a BIM QTO and
Excel-based cost estimate, and 3) a model-based cost estimate. The SOG was selected for
this study since it is a single element with multiple attached work items. The physical
element is the 3D mass of the slab, it is represented in BIM as a single BIM element of
the category: floors, family: floor, and type: 4” concrete SOG. This element was selected
to exemplify the work item attachment feature of the model-based cost estimation
method.
5.2 Project Background
The Yakʔitʸutʸu Student Housing project is a residential community on the Cal
Poly campus adjacent to Grand Avenue in San Luis Obispo, California. It consists of
seven three to five-story residence halls with 1,475 beds, commercial retail space, and an
adjacent four-story parking garage. An aerial photograph of the project near completion
is presented in Figure 33.

79
Figure 33 Drone Photograph of Yakʔitʸutʸu Student Housing Project (Cal Poly, 2018)
The subject building of this study is a three-story residence hall, it is the leftmost
building in Figure 33. It is constructed of cast-in-place concrete with a metal stud wall
enclosure. The foundation system is comprised of a four-inch-thick SOG and spread
footings that rest on bedrock, which is only a few feet below the surface. The gravity
system consists of round and square reinforced concrete columns. These columns support
the deck, which is pre-stressed cast-in-place concrete. The lateral force resisting system is
comprised of orthogonal concrete shear walls.
Each residence hall viewed from the plan perspective has an outline of two
rectangles slightly angled offset from one another. This large perimeter to surface area
ratio lead to under-estimation of the floor to floor cycle times for slab, column, and
suspended slab construction. The project team does not know how the important cost
estimating lesson from this overrun will be communicated to other estimators in the
company (Tuttle, 2018). Though it was not evaluated in the case study, VDC cost control,
proposed in this thesis, should provide a means to transfer such information.
80
The contractor who completed this design-build project employed the traditional
method of cost estimation. Their cost estimate results are not discussed in this study since
their cost data is proprietary and kept secret for competitive purposes. The contractor did,
however, perform model coordination and clash detection using VDC. BIM models
existed that were authored by the design team in 2014 and 2015. These models had
quantity and quality of information that was sufficient to perform the case study. The
contractor provided these models for the case study. These models were not conditioned
or purposed for cost estimation by the contractor, so this conditioning was performed in
the case study.
The plans and specifications used in the traditional method were acquired from
The University’s Prolog software platform. The University also provided records of daily
production logs and photographs. These were reviewed prior to completing the three cost
estimates. These background data were meant to provide the context of the means and
methods for the estimator. Interviews with project stakeholders were also conducted. The
interviewees included the Cal Poly Director of facilities (Arronson, 2018), the general
contractor’s construction superintendent (Tuttle, 2018), and a project manager from The
University’s third-party construction manager (Wyatt, 2018). These interviews helped
build a strong context of the project for completing the case study.
5.3 Traditional Cost Estimate Method
The traditional method of cost estimation consists of multiple modules conducted
in different environments. In this case study, the first step was a review of the plans,
specifications, and project documentation to establish the estimate requirements. This
entailed writing a basis of estimate, prescribed by the AACE. The basis of estimate is a
81
deliverable that defines the scope of the project. Any person with capital project
experience should be able to use the basis of estimate to understand and assess the cost
estimate (AACE RP 10S-90, 2015). In this case study, the overview and introduction
sections of Chapter 5 serve as the basis of estimate. The cost estimate scope is defined as
all work-items required to install the SOG to building 4E in California Polytechnic State
University’s Yakʔitʸutʸu Student Housing project. This first module establishes cost
estimate requirements, was described in a word document environment, separate from the
QTO and estimate environments.
The second module is planning and structuring the estimate. This involves
defining the OBS and the WBS. Note that these two are the organization and process
models within the product-organization-process model of VDC (Stanford Engineering,
2018). The OBS simply defined that a contractor’s organization was assigned the
complete installation scope for the SOG. The WBS broke the install into four work
packages including 1) earthwork, 2) formwork, 3) pouring concrete, and 4) finishing
concrete. Both of these breakdown structures were defined in the Excel estimating
environment using a blank estimating template. These definitions of OBS and WBS are
documented in environments separate from modules one and three.
The third module consisted of the quantification and costing efforts by the
estimator. This began with 1) a QTO using the structural foundation PDF plan and
corresponding details, 2) identification of the required work-items based on the QTO
parameters, the OBS, and the WBS, 3) transcription of the QTO parameters to the Excel
environment, and 4) references to historical labor, material, and equipment data regarding
prices and production rates. The finished product of the quantification and costing
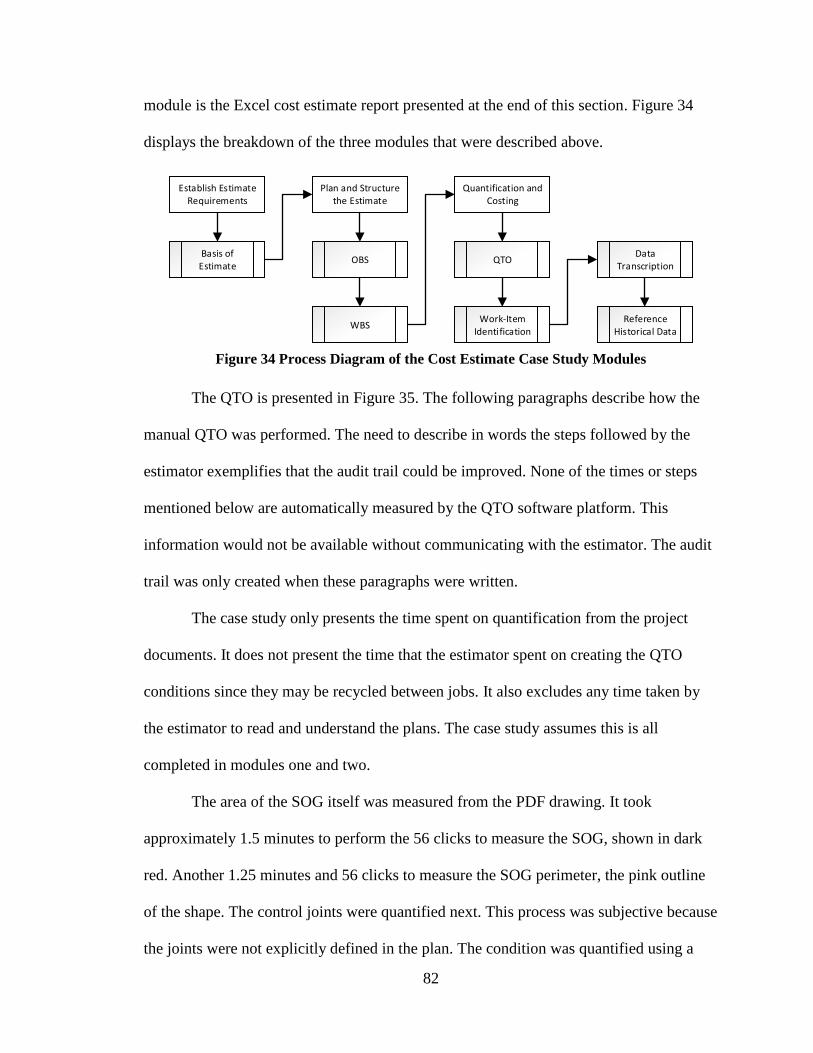
82
module is the Excel cost estimate report presented at the end of this section. Figure 34
displays the breakdown of the three modules that were described above.
Establish Estimate Requirements
Plan and Structure the Estimate
Quantification and Costing
OBS
WBS
QTO
Work-Item Identification
Data Transcription
Reference Historical Data
Basis of Estimate
Figure 34 Process Diagram of the Cost Estimate Case Study Modules
The QTO is presented in Figure 35. The following paragraphs describe how the
manual QTO was performed. The need to describe in words the steps followed by the
estimator exemplifies that the audit trail could be improved. None of the times or steps
mentioned below are automatically measured by the QTO software platform. This
information would not be available without communicating with the estimator. The audit
trail was only created when these paragraphs were written.
The case study only presents the time spent on quantification from the project
documents. It does not present the time that the estimator spent on creating the QTO
conditions since they may be recycled between jobs. It also excludes any time taken by
the estimator to read and understand the plans. The case study assumes this is all
completed in modules one and two.
The area of the SOG itself was measured from the PDF drawing. It took
approximately 1.5 minutes to perform the 56 clicks to measure the SOG, shown in dark
red. Another 1.25 minutes and 56 clicks to measure the SOG perimeter, the pink outline
of the shape. The control joints were quantified next. This process was subjective because
the joints were not explicitly defined in the plan. The condition was quantified using a

83
simple linear measurement, the locations of the actual control joints were approximated
based on the SOG’s geometry. The control joint QTO took 0.75 minutes. The slab step
was also quantified using a linear measurement. It was clearly located on the drawing and
not subjectively defined. The QTO took 0.5 minutes. The sloped SOG was an additional
area measurement taken atop the SOG condition. This condition was explicitly defined in
the drawings, and the QTO took 0.5 minutes. The complete QTO took approximately 4.5
minutes. All measurements were derived from designer authored geometry.
Figure 35 Traditional QTO of SOG Completed using Bluebeam Revu
Table 2 presents the results of the traditional QTO. Bluebeam Revu was the
software used to perform the QTO. Those values closely match the BIM quantities since
Revu has a feature to snap to Autodesk Objects. Revu was in effect measuring the same
parameters that are available in BIM. The PDF software was reading the geometry that
spatially defines the element’s property, but it was not able to access that property
directly. This process is data recycling, which was identified in the literature review.
Some of the parameters that are measured in the QTO are already available in BIM.
Furthermore, this manual QTO itself is not used by other stakeholders. The resulting
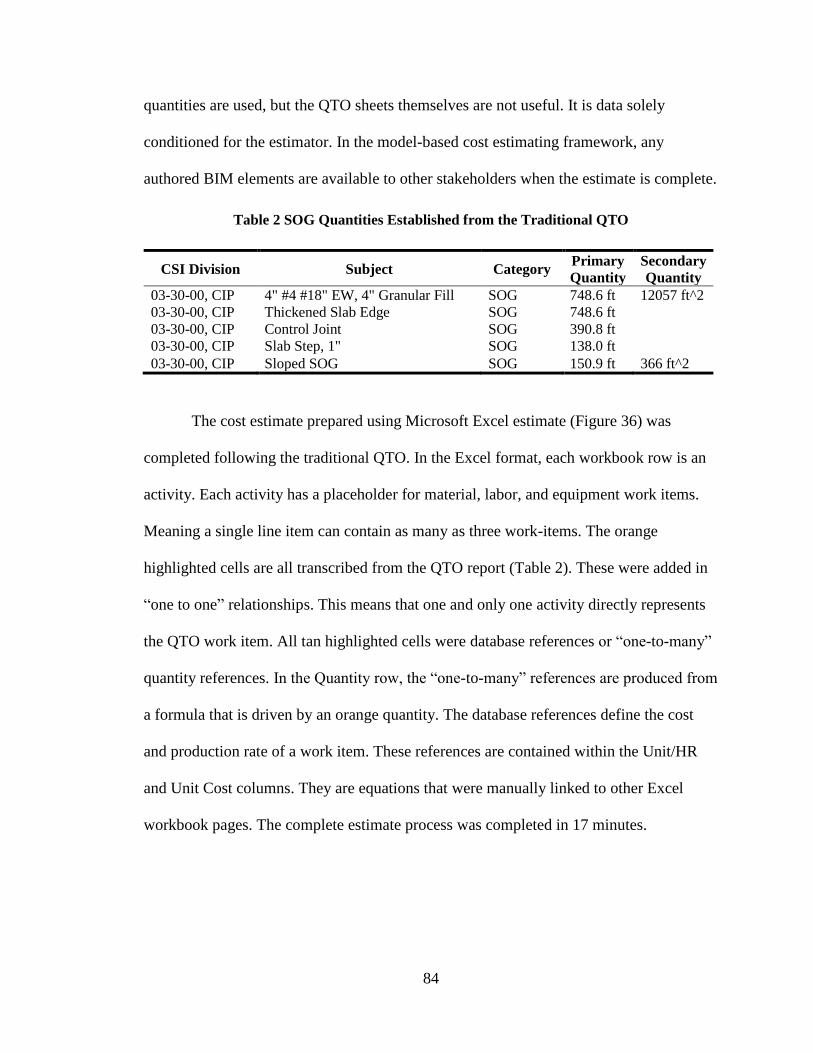
84
quantities are used, but the QTO sheets themselves are not useful. It is data solely
conditioned for the estimator. In the model-based cost estimating framework, any
authored BIM elements are available to other stakeholders when the estimate is complete.
Table 2 SOG Quantities Established from the Traditional QTO
CSI Division Subject Category Primary
Quantity
Secondary
Quantity
03-30-00, CIP 4" #4 #18" EW, 4" Granular Fill SOG 748.6 ft 12057 ft^2
03-30-00, CIP Thickened Slab Edge SOG 748.6 ft
03-30-00, CIP Control Joint SOG 390.8 ft 03-30-00, CIP Slab Step, 1" SOG 138.0 ft 03-30-00, CIP Sloped SOG SOG 150.9 ft 366 ft^2
The cost estimate prepared using Microsoft Excel estimate (Figure 36) was
completed following the traditional QTO. In the Excel format, each workbook row is an
activity. Each activity has a placeholder for material, labor, and equipment work items.
Meaning a single line item can contain as many as three work-items. The orange
highlighted cells are all transcribed from the QTO report (Table 2). These were added in
“one to one” relationships. This means that one and only one activity directly represents
the QTO work item. All tan highlighted cells were database references or “one-to-many”
quantity references. In the Quantity row, the “one-to-many” references are produced from
a formula that is driven by an orange quantity. The database references define the cost
and production rate of a work item. These references are contained within the Unit/HR
and Unit Cost columns. They are equations that were manually linked to other Excel
workbook pages. The complete estimate process was completed in 17 minutes.

85
Figure 36 Cost Estimate Spreadsheet produced from the Traditional QTO
86
Figure 36 does not show that the estimator began with a blank spreadsheet
template. Each line item was manually added in the work-item identification step. The
estimator referenced the drawings, specifications, and prior tribal knowledge to establish
what were the work-items. There was no singular checklist referenced to build out the
contents of the estimate. Instead, the estimator had to manage various sources of
information and amalgamate them into the spreadsheet. This amalgamation diminishes
the audit trail of the estimate. Any stakeholder that reviews the estimate would have to
ask the estimator to justify decisions since there is no database storing their justification.
It is also not easy to use the system. It takes time and more thought to recycle information
from other data sources.
5.4 BIM QTO and Excel Estimate
The BIM QTO was completed following the same three modules presented in
Figure 34. The results of module one and two are the same for the traditional method.
The basis of estimate, OBS, and WBS are all defined external to the BIM model.
Therefore, none of the data defined in any of these modules is available in the BIM QTO.
The tool employed to complete the QTO was Autodesk Navisworks’ selection inspector
feature. The inspector was set to the parameters shown at the bottom of Figure 37. The
indicated parameters were manually filtered from the list of over 50 available BIM
element parameters. The filtered parameters that were usable in the estimate were
thickness, volume, area, and perimeter. The category, family, and type parameters are all
additional data that describe the functional characteristics of the BIM element. To
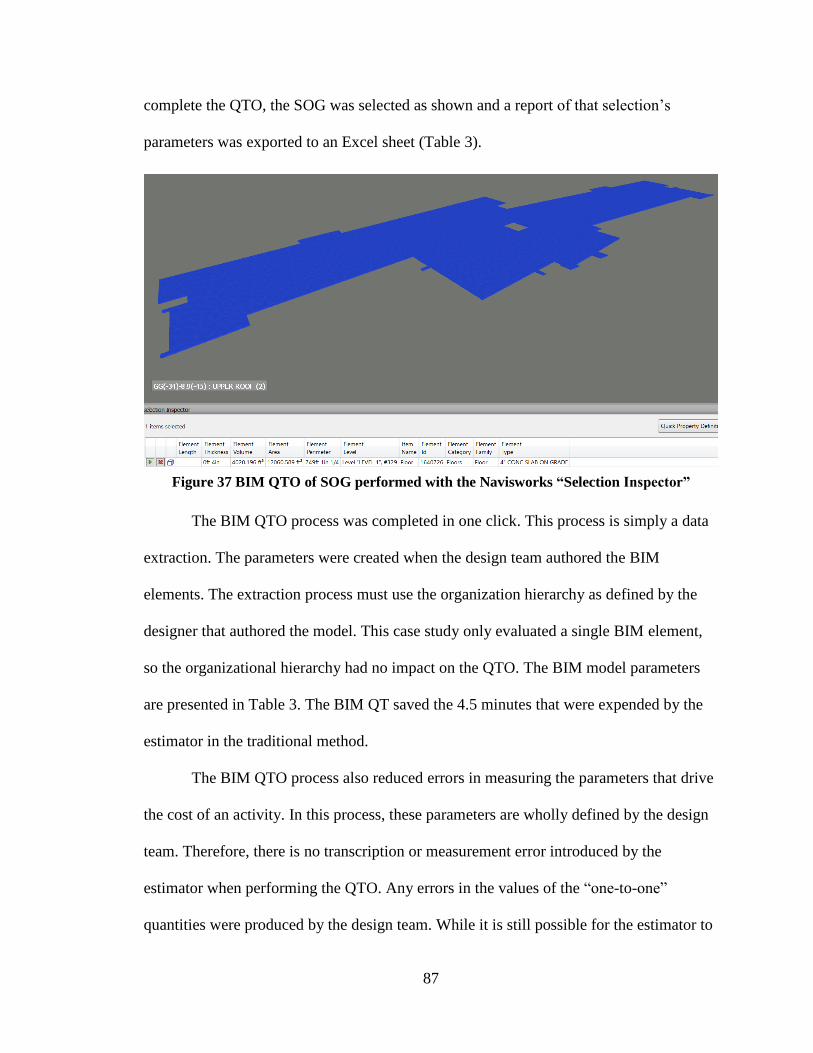
87
complete the QTO, the SOG was selected as shown and a report of that selection’s
parameters was exported to an Excel sheet (Table 3).
Figure 37 BIM QTO of SOG performed with the Navisworks “Selection Inspector”
The BIM QTO process was completed in one click. This process is simply a data
extraction. The parameters were created when the design team authored the BIM
elements. The extraction process must use the organization hierarchy as defined by the
designer that authored the model. This case study only evaluated a single BIM element,
so the organizational hierarchy had no impact on the QTO. The BIM model parameters
are presented in Table 3. The BIM QT saved the 4.5 minutes that were expended by the
estimator in the traditional method.
The BIM QTO process also reduced errors in measuring the parameters that drive
the cost of an activity. In this process, these parameters are wholly defined by the design
team. Therefore, there is no transcription or measurement error introduced by the
estimator when performing the QTO. Any errors in the values of the “one-to-one”
quantities were produced by the design team. While it is still possible for the estimator to
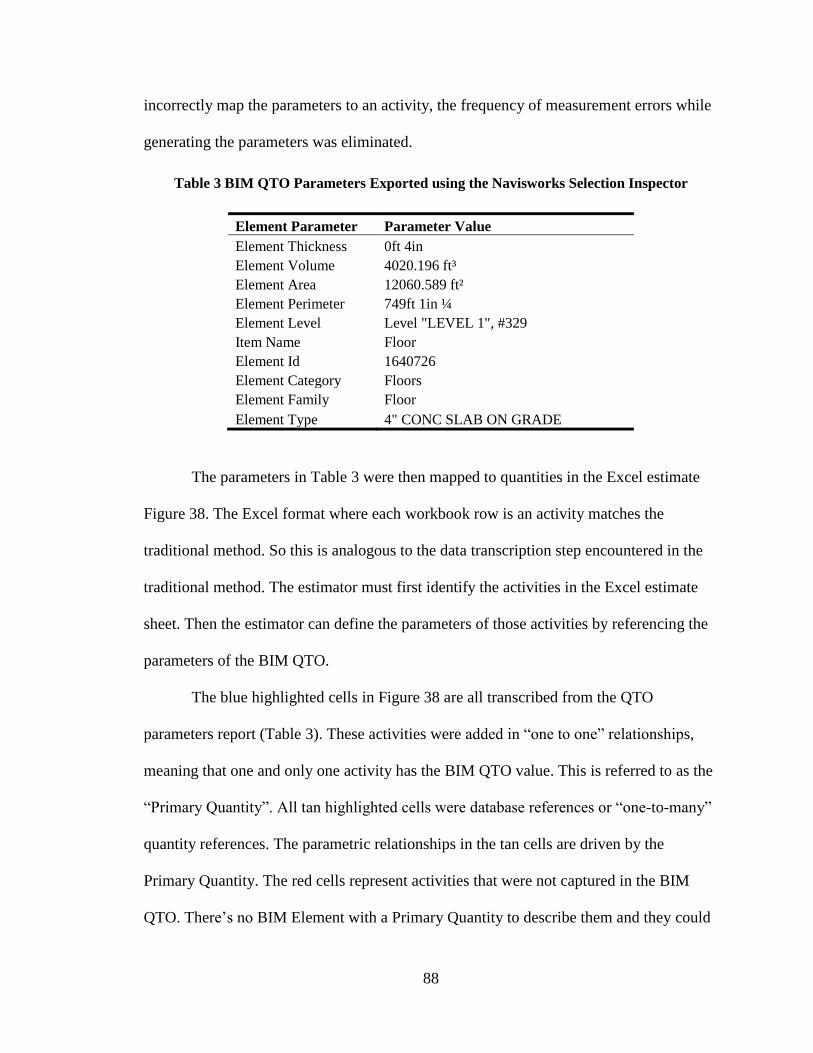
88
incorrectly map the parameters to an activity, the frequency of measurement errors while
generating the parameters was eliminated.
Table 3 BIM QTO Parameters Exported using the Navisworks Selection Inspector
Element Parameter Parameter Value
Element Thickness 0ft 4in
Element Volume 4020.196 ft³
Element Area 12060.589 ft²
Element Perimeter 749ft 1in ¼
Element Level Level "LEVEL 1", #329
Item Name Floor
Element Id 1640726
Element Category Floors
Element Family Floor
Element Type 4" CONC SLAB ON GRADE
The parameters in Table 3 were then mapped to quantities in the Excel estimate
Figure 38. The Excel format where each workbook row is an activity matches the
traditional method. So this is analogous to the data transcription step encountered in the
traditional method. The estimator must first identify the activities in the Excel estimate
sheet. Then the estimator can define the parameters of those activities by referencing the
parameters of the BIM QTO.
The blue highlighted cells in Figure 38 are all transcribed from the QTO
parameters report (Table 3). These activities were added in “one to one” relationships,
meaning that one and only one activity has the BIM QTO value. This is referred to as the
“Primary Quantity”. All tan highlighted cells were database references or “one-to-many”
quantity references. The parametric relationships in the tan cells are driven by the
Primary Quantity. The red cells represent activities that were not captured in the BIM
QTO. There’s no BIM Element with a Primary Quantity to describe them and they could

89
not be driven by another Primary Quantity. This results in a $12,901 or 12% discrepancy
in the estimated cost versus the traditional method.
This case study presented a true BIM QTO, limited to the model itself. Therefore,
the cost estimate parameters were limited to the BIM model provided by the designer.
The estimator could not define any custom parameters to drive the red activities in Figure
38. This case study did not present an evaluation of a mixed system, which uses a
combination of the traditional and BIM QTO methods. It was excluded since it is similar
to the model-based cost estimating framework except QTO conditions are authored
instead of BIM elements. The model-based process instead creates BIM-based
conditions. These BIM conditions can host more parameters in addition to the parameter
required to estimate an activity.
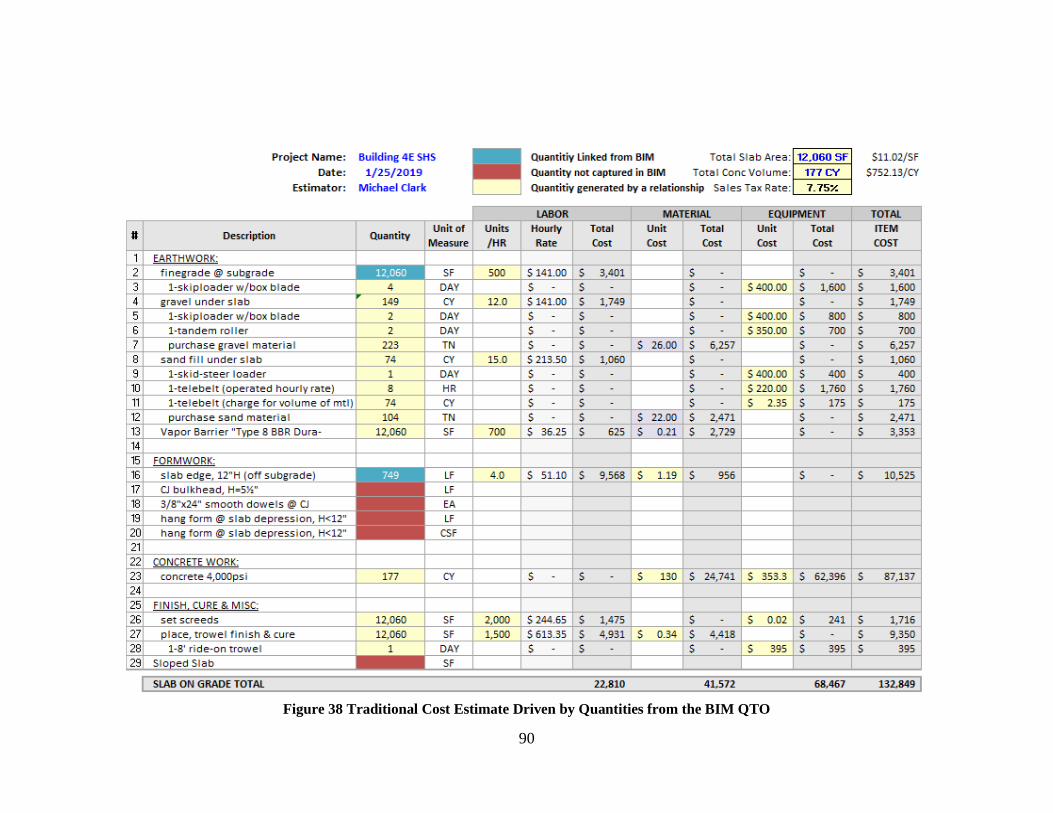
90
Figure 38 Traditional Cost Estimate Driven by Quantities from the BIM QTO
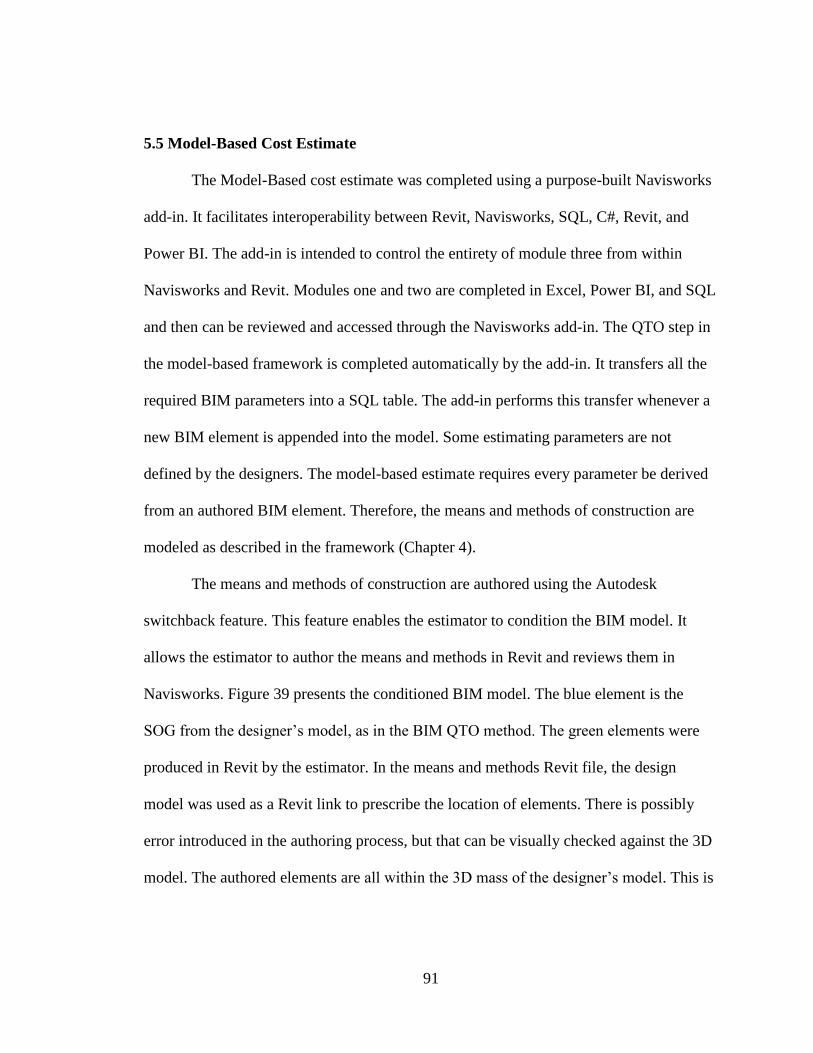
91
5.5 Model-Based Cost Estimate
The Model-Based cost estimate was completed using a purpose-built Navisworks
add-in. It facilitates interoperability between Revit, Navisworks, SQL, C#, Revit, and
Power BI. The add-in is intended to control the entirety of module three from within
Navisworks and Revit. Modules one and two are completed in Excel, Power BI, and SQL
and then can be reviewed and accessed through the Navisworks add-in. The QTO step in
the model-based framework is completed automatically by the add-in. It transfers all the
required BIM parameters into a SQL table. The add-in performs this transfer whenever a
new BIM element is appended into the model. Some estimating parameters are not
defined by the designers. The model-based estimate requires every parameter be derived
from an authored BIM element. Therefore, the means and methods of construction are
modeled as described in the framework (Chapter 4).
The means and methods of construction are authored using the Autodesk
switchback feature. This feature enables the estimator to condition the BIM model. It
allows the estimator to author the means and methods in Revit and reviews them in
Navisworks. Figure 39 presents the conditioned BIM model. The blue element is the
SOG from the designer’s model, as in the BIM QTO method. The green elements were
produced in Revit by the estimator. In the means and methods Revit file, the design
model was used as a Revit link to prescribe the location of elements. There is possibly
error introduced in the authoring process, but that can be visually checked against the 3D
model. The authored elements are all within the 3D mass of the designer’s model. This is
92
one contractual requirement of the warranted accuracy clause for the proposed
framework. The BIM authoring process took 3 minutes.
The Model-Based cost estimate was completed using module three of the
prescribed framework, quantification and costing. The process was followed using the of
the Navisworks add-in system. Many features of the add-in were not developed for the
scope of this thesis. Those features were replicated with portions of the work performed
using the “selection inspector”, Excel, SQL, C#, and Power BI in individual silos. The
final add-in is intended to control the entire process from within Navisworks.
Figure 39 presents the conditioned BIM model. It constitutes the document means
and methods sub-step of the framework, presented in section 4.4.1. The blue element is
the building’s SOG. It was imported from the designer’s Revit model. It is quantified in
the same fashion as the BIM QTO process. The green elements were produced in Revit
by the estimator. In the means and methods Revit file, the design model was used as a
Revit link to prescribe the location of BIM elements. The green elements are all within
the 3D mass of the designer’s model. Therefore, the designer did not violate the
warranted model accuracy requirement.
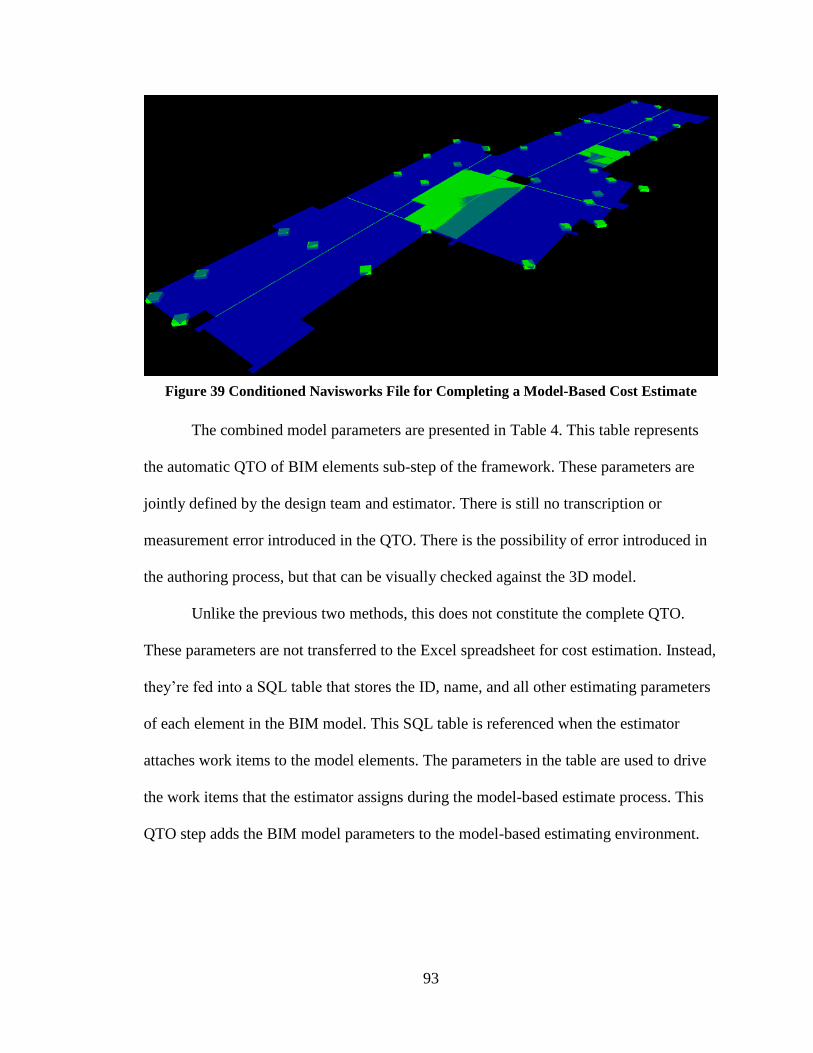
93
Figure 39 Conditioned Navisworks File for Completing a Model-Based Cost Estimate
The combined model parameters are presented in Table 4. This table represents
the automatic QTO of BIM elements sub-step of the framework. These parameters are
jointly defined by the design team and estimator. There is still no transcription or
measurement error introduced in the QTO. There is the possibility of error introduced in
the authoring process, but that can be visually checked against the 3D model.
Unlike the previous two methods, this does not constitute the complete QTO.
These parameters are not transferred to the Excel spreadsheet for cost estimation. Instead,
they’re fed into a SQL table that stores the ID, name, and all other estimating parameters
of each element in the BIM model. This SQL table is referenced when the estimator
attaches work items to the model elements. The parameters in the table are used to drive
the work items that the estimator assigns during the model-based estimate process. This
QTO step adds the BIM model parameters to the model-based estimating environment.

94
Table 4 SQL Table with all BIM Parameters Used to Complete the Model-Based Cost
Estimate
Element
Type Element Id
Primary
Quantity
Total: Concrete SOG
Control Joint N/A 401 ft
Total: Column Diamonds N/A 34 EA
Sloped Slab -4" 280271 320 ft²
1" Depressed Slab - 4"
thick 280721 1118 ft²
The work items are attached using the add-in tool panel shown in Figure 40. This
figure shows the mapped category’s under-slab accessories activities available to attach
to the selected element. Each activity represents an assembly that can include material,
labor, and equipment work-items. The estimator also has the option to modify each work-
item of these individually.
Figure 40 Work Item Attachment Using the Navisworks Add-in
95
The complete results of the work-item attachment process for the SOG are
presented in the appendix. This amalgamation of tables, which is hosted in a SQL server,
constitutes the model-based cost estimate. The Navisworks add-in reads and writes to this
SQL database using the C# programming language. In the appendix table, blue columns
represent BIM parameters, orange columns are work-items, grey columns are global
project variables, and green columns are the subjective input identifiers. This single table
references many other tables. Each referenced table contains a list of options for a
column or a group of columns. Examples of these reference tables used in this case study
are presented in the appendix as well. The complete work-item table is queryable within
Navisworks using the add-in. This integration enables the spatial and temporal
organization of cost estimate data and achieves a model-based cost estimate.
The results of the model-based cost estimate are presented in Figure 41 for
comparison to the two previous methods in this case study. The results of the comparison
show that the model-based estimate can attain the same accuracy as a traditional cost
estimate while improving the audit trail and maintaining BIM QTO’s speed. The model-
based cost estimate’s accuracy is made possible by the construction intent that is
documented in the means and methods BIM elements authored by the cost estimators.
The audit trail is stored in the SQL tables that represent relationships of BIM element
parameters to work-items. This spreadsheet is not representative of the actual model-
based cost estimate tables or report format, it was prepared for comparison purposes only.
Examples of both the SQL table and the estimate Power BI report are presented in the
appendix.

96
Figure 41 Traditional Cost Estimate Spreadsheet for Comparison purposes.
97
The complete model-based cost estimate report is presented in the appendix. It is
cumbersome to use on its own. The Power BI platform supports querying data or finding
a specific metric from within that database. Figure 42 presents an application of a query
to that cost estimate report. The question that the estimator asked was “how much of the
total estimated cost for the SOG is purchasing and placing the concrete? Then what
proportion of this cost is in material, labor, and equipment”. The report shows that the
total cost for the SOG concrete was $87,137. Then divided by labor, material, and
equipment the respective cost was $41,139, $24,741, and $21,257. The pie chart at the
right of Figure 28 shows that each respective SOG category constitutes 31.19%, 18.76%,
and 16.12% of the total project cost. This report answers questions that would otherwise
require additional numerical manipulation of the data by the estimator.
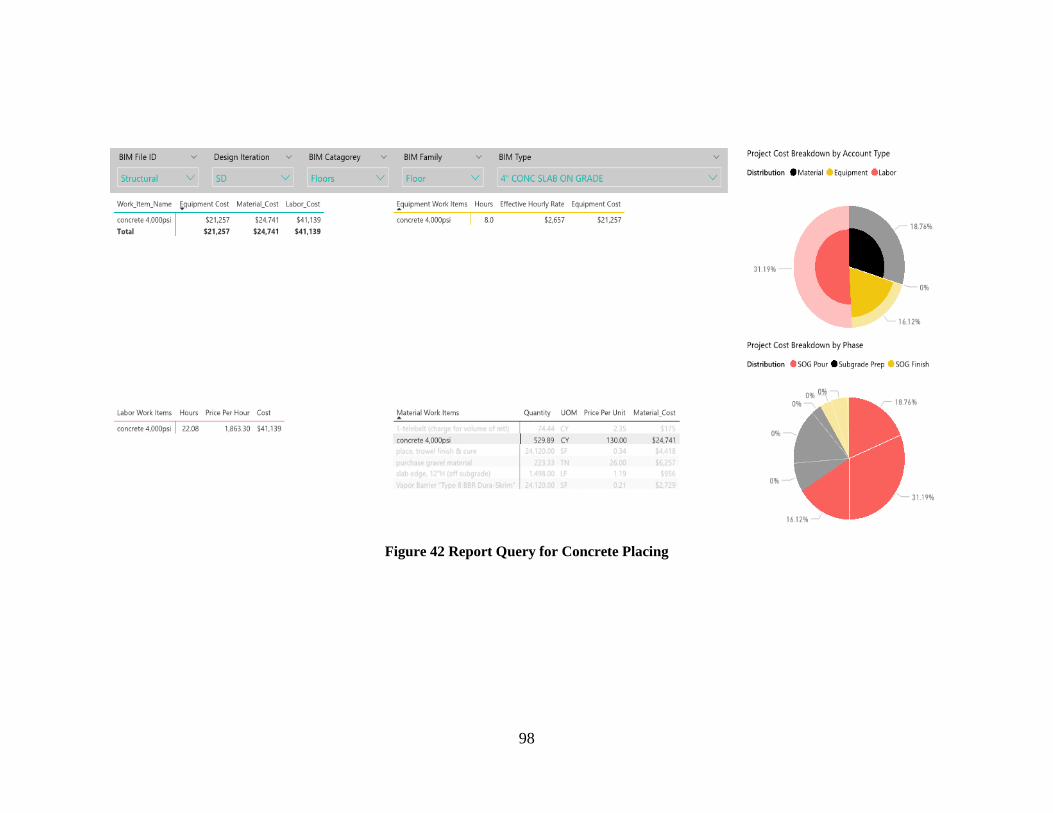
98
Figure 42 Report Query for Concrete Placing

99
5.6 Discussion of Results
This section presents a comparison of the results from the three cost estimating
methods: traditional, BIM QTO, and model-based. Metrics included in this discussion are
the time to complete, accuracy of estimated activity costs, and completeness of the cost
estimate. This section also reviews the time taken to prepare the cost estimate database.
5.6.1 Discussion of Case Study Metrics
Table 5 presents a comparison of the parameters that were captured in traditional
and model-based cost estimates. The traditional method’s parameters are taken as
benchmarks and compared to the model-based results. In the improvement column, a
positive value represents an improvement or benefit to the estimator while a negative
value represents the opposite. Therefore, for any deviation in a quantity, the improvement
column value is negative since the traditional method was used as a datum. This
convention was chosen since current practices designate the drawings as the contract
documents. Therefore, a QTO performed using the contract documents should be the
benchmark for a cost estimate comparison.
Table 5 Comparison of the Estimating Parameters captured in the Traditional Method
Estimate to the Estimating Parameters captured in the Model-Based Cost Estimate
Element Parameter
Traditional QTO &
Excel Estimate
Model-Based
Estimate Improvement
Slab Area 12,057 SF 12,060 SF -0.02%
Slab Edge 749 LF 749 LF 0%
CJ Bulkhead 391 LF 401 LF -3%
Column Diamonds 35 EA 34 EA -3%
Hung Form at Slab Depression 138 LF 142 LF -3%
Sloped Slab on Grade 366 SF 320 SF -13%
Estimated Activies1 23 EA 23 EA 0%
Activities Missed 0 EA 0 EA 0%
1) A count of the activities that could be quantified based on the available parameters or QTO information.
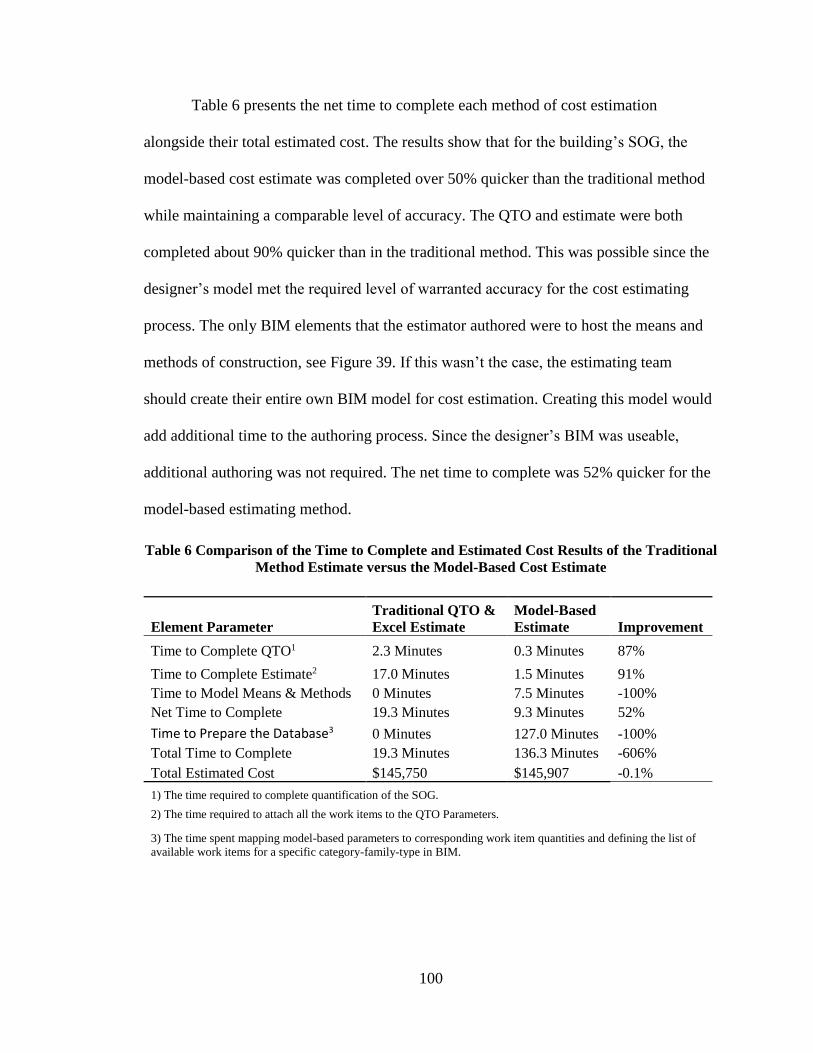
100
Table 6 presents the net time to complete each method of cost estimation
alongside their total estimated cost. The results show that for the building’s SOG, the
model-based cost estimate was completed over 50% quicker than the traditional method
while maintaining a comparable level of accuracy. The QTO and estimate were both
completed about 90% quicker than in the traditional method. This was possible since the
designer’s model met the required level of warranted accuracy for the cost estimating
process. The only BIM elements that the estimator authored were to host the means and
methods of construction, see Figure 39. If this wasn’t the case, the estimating team
should create their entire own BIM model for cost estimation. Creating this model would
add additional time to the authoring process. Since the designer’s BIM was useable,
additional authoring was not required. The net time to complete was 52% quicker for the
model-based estimating method.
Table 6 Comparison of the Time to Complete and Estimated Cost Results of the Traditional
Method Estimate versus the Model-Based Cost Estimate
Element Parameter
Traditional QTO &
Excel Estimate
Model-Based
Estimate Improvement
Time to Complete QTO1 2.3 Minutes 0.3 Minutes 87%
Time to Complete Estimate2 17.0 Minutes 1.5 Minutes 91%
Time to Model Means & Methods 0 Minutes 7.5 Minutes -100%
Net Time to Complete 19.3 Minutes 9.3 Minutes 52%
Time to Prepare the Database3 0 Minutes 127.0 Minutes -100%
Total Time to Complete 19.3 Minutes 136.3 Minutes -606%
Total Estimated Cost $145,750 $145,907 -0.1%
1) The time required to complete quantification of the SOG.
2) The time required to attach all the work items to the QTO Parameters.
3) The time spent mapping model-based parameters to corresponding work item quantities and defining the list of
available work items for a specific category-family-type in BIM.
101
5.6.2 Results for Preparation of the Computation System
The time to prepare the database is included in the comparison even though it is
not directly part of the model-based cost estimating process. It does hoverer represent a
large overhead task that must be completed prior to embarking on the first model-based
cost estimate for each BIM category-family-type combination in the BIM model. While
the -606% difference in total time to complete seems large, it represents the first BIM
element in the first cost estimate completed. One purpose of the SQL database is to take
advantage of previously defined work-item maps by storing them in a searchable
database. So, for the second model-base estimate performed using this framework, the
time spent preparing the database to estimate any SOG should be zero. The SQL database
should have stored all possible options for concrete thickness, gravel fill thickness,
excavation, and re-compaction thickness, etc. With similar BIM elements, the estimator
only completes the selection of work-items to complete the cost estimate.
Preparation of the database involved manually transcribing work items while
adhering to the relational database structure. The researcher entered integer values for the
foreign key constraints that manually linked the data in one table to the data in another
table. The aggregate time to complete the cost estimate was 606% slower for the model-
based cost estimate when database preparation was considered. The report is presented to
depict the worst possible circumstances for completing a model-based cost estimate. The
worst circumstances for efficiency should be from evaluating the first few BIM elements
in a model and when work items are added to the database for this first time. This is
because the model-based estimating method is designed for repeatability. Subsequent
SOG estimates should be completed with limited additional database authoring.

102
The work items and parameter mappings can also be adapted to similar BIM
types. The following example explains how additional BIM elements would be added to
the database. Consider a concrete slab on metal deck. The category, floors, and family,
floor, are the same as the SOG. However, the type is a slab on metal deck instead of
SOG. So, the SOG parameter mapping could be copied, but new work items would be
mapped to those parameters. This feature is what creates a flexible map that associates a
group of work items to a specific BIM category-family-type combination. The flexible
mapping feature will further reduce the time taken to prepare the database.
5.7 Quality Control
The case study does not follow the entire proposed framework due to a few
limitations. First, this comparison was performed after construction was completed.
Therefore, module four, Construction Phase Data Collection, could not be evaluated.
Second, the Navisworks add-in is not fully developed. Manual data transcription, using
Excel, was employed to complete some steps that would otherwise occur in the SQL
database. The manual data transcription time was not included in the comparison. So, this
limitation was not incorporated into the comparisons in Table 5 or Table 6. This did
result in an increased time to prepare the database. Any reduction in the time to prepare
the database is a positive benefit for the model-based cost estimating process.
A single individual with one year of cost estimating experience completed each
cost estimate and kept time using a stopwatch. The times were rounded to the first
decimal place. All three cost estimates were performed by the same person in order that
they appear in this chapter. They were performed on different dates to counteract the
increase in efficiency due to practice and memory.

103
The complete model-based cost estimate add-in has not been fully developed. The
add-in should transfer BIM data into the SQL database table then transfer out the total
work item costs and durations. The case study employed a manual transfer of data using
Excel and the Navisworks’ “selection inspector” feature. Automatic data transfer should
only decrease the time to complete the model-based estimate and improve ease of use.
Therefore, any improvement should further strengthen the case of adopting the model-
based cost estimating framework.

104
The production rates and unit prices used in the estimate were acquired from the
R.S. Means cost estimating database (Giordian, 2019) and an example project provided
by a cost estimating professional (Roy, 2018). The cost data may not be representative of
the actual construction cost. However, the cost data is consistently used in each of the
three cost estimating methods. Therefore, any comparison made between the three
methods should accurately represent the difference in estimated cost between the
methods. The relative comparison made between methods is not adversely affected by
potentially inaccurate cost data.
5.8 Summary
The model-based cost estimate for the SOG element was completed quicker than
and with the same result as the traditional method. The model-based method increased
accuracy compared to the BIM QTO method. There is a single succinct audit trail stored
in a SQL database that is available to other stakeholders for quality control. The cost
estimate is completed entirely within the BIM model environment and therefore is easier
to visualize, attach work-items, and check completeness against the remaining BIM
elements. The results of this case study enforce that the model-based method should be
preferable to both traditional and BIM QTO methods of cost estimation.
105
6. CONCLUSIONS
6.1 Overview
Chapters Two through Five present a comprehensive analysis and framework to
conduct a model-based construction cost estimate. First, a literature review was
conducted to develop the limitations that exist within the body of knowledge that hinder
successful model-based cost estimation. Second, a methodology was presented that
synthesized these limitations into a plan for an improved system. Third, a framework was
developed to implement the system and address the limitations identified in the literature
review. Fourth a case study evaluation of three cost estimating methods was completed.
This evaluation compared the proposed framework and system to two methods of cost
estimation that are popular in the construction industry today. The results of this case
study exemplified the speed and completeness attainable with a succinct model-based
cost estimating framework and system. Finally, these conclusions are presented based on
the research findings. They include improvements yielded by the framework, prevailing
limitations, and a guide for future development regarding this model-based construction
cost estimation framework.
6.2 Contributions of the Proposed Framework
There are five improvements listed in this section. They are in direct response to
the seven of the eight limitations identified in the literature review. The construction
contract limitation is the only one that was addressed but not directly improved. The
reasoning for this is expanded in the Prevailing Limitations (Section 6.4). The other
seven limitations were improved upon in the development of the framework and are
discussed in this section.
106
Ease of use and software interoperability were addressed in conjunction with the
framework. The system’s suite of software includes SQL, Navisworks, Excel, Power BI,
and Revit. The first improvement was eliminating the need for the estimators to learn
SQL since they are not responsible for completing anything directly in SQL. All the
system’s features that employ SQL do so through the add-in. The other improvement was
implementing the Autodesk “switchback” feature. This feature enables the estimator to
author BIM in Revit and completes the estimate in Navisworks. These two features
reduce the additional training that an estimator should require prior to implementing the
model-based cost estimating framework.
The flexible mapping limitation was addressed by the system’s SQL data
structure. This data structure is presented in the Appendix. It enabled a detailed audit
trail, cost estimation within a BIM model environment, and reports for multiple
stakeholders derived from a single dataset. This data structure comprises the data model
that is available in conjunction with the BIM model. This flexible mapping feature was
the main driver behind the improvement in speed.
The subjective input limitation was addressed by the parametric estimate add-in.
This add-in provided a feature in the parametric estimate step to modify the productivity
and waste factors for a work item. These modifiable factors allow the estimators to
incorporate their subjective understanding of difficulty into the BIM model environment.
The premise of this framework is that no cost estimate information is blind to the BIM
model. This feature allows the incorporation of subjective human understanding into the
model-based cost estimate.
107
The VDC cost control limitation was addressed by the historical data refinement
module. This module incorporated a plan to harvest data and utilize it to reduce the risk
of cost uncertainty in future estimates. The first step towards achieving this was made
possible by the first three modules in the framework. The result of the first three modules
is that all cost estimate information can be accessed through BIM. With the same data
structure, the BIM elements can be utilized to control cost during construction. The data
that is available for comparison as a result of this combination can be utilized to improve
the assumptions of future cost estimates.
Addressing the parametric estimating limitation added a second improvement that
was mentioned in Section 4.4.4. This improvement is named polymorphism. In this
context, it is using a single BIM element to host the work items that belong to multiple
Scopes of Work. Using a structural concrete example, consider three work items
including rebar, concrete placing, and formwork all for a single SOG BIM element. All
work items are attached to the same wall, but they each belong to a different sub-contract.
This feature is not possible with traditional or BIM QTO methods. To represent this in
other methods, the object parameters should be copied. However, the model-based
method employs SQL to produce a “one-to-many” relationship. This allows all cost
information to be associated with specific BIM elements, without duplicating any
parameters or recycling data.
6.3 Limitations of the Proposed Framework
This framework requires the establishment of a relational SQL database. If a party
adopting this framework currently keeps its data in Excel, they can import it into SQL
using an import wizard. However, this excel data would need to be conditioned and

108
parsed for each of the 36 tables in the framework’s architecture. Excel data is not
relational by default, so the relationships would have to be manually described, by
manually establishing primary & foreign key relationships. Alternatively, a 3rd party
application could be developed that would automate this migration process. That app
would still have to be customized for each adopting party since there is no standard for
storing existing historical cost data. In this thesis, the data migration was done manually,
without any 3rd party app. In practice, this would require a database administration
professional to maintain and import new points into the database
The proposed framework was designed and tested only with Autodesk Revit BIM
authoring software. The computation platform was built exclusively for Revit 2019 &
Navisworks 2019. Different versions may have reduced interoperability. Adding
interoperability with other platforms would require the implementation of the IFC
architecture, which was avoided because IFC element definitions are not rigid (see page
22). This severely limits the interoperability potential of the proposed framework. Future
work should expand interoperability with other computation platforms.
The current solution to achieve flexible mapping is static. It depends on the static
definitions of Category, Family, and Type. I.e. if “ 4” steel tube ” was modified to “4”
Steel Tube” by the designer, then the flexible mapping definitions to that element would
be lost. Future work should evaluate a new flexible mapping strategy that does not solely
rely on the naming of the hierarchy. Implementation of this framework was limited to
Revit structural systems in BIM. It excluded architecture and MEP systems which have
slightly different properties and definitions. Completing a model-based cost estimate of

109
either MEP or architecture may require additional SQL columns for storing additional
cost estimating parameters.
The platform for sharing cost reports is Microsoft Power BI. It is a hybrid free
desktop and paid cloud computing application. Where the cloud computing service is
billed per each query. The reports have limited functionality when printed out. A future
project could be foregoing the Power BI platform and improving the cost reporting
capabilities from within Navisworks.
6.4 Future Developments
This section describes five additional developments to the existing body of
knowledge that should be emphasized in future related works. These developments were
outside the scope of this thesis and thus not addressed.
• One development is addressing the high economic barrier to entry of
adopting this framework. The barriers include training the estimators to
properly use the system, updating hardware and software to meet the
increased computational demand, seeding the cost estimate work item
database, and maintaining the system as new software releases are issued.
This limitation was identified by the AGCA, who surveyed firms that had
adopted 5D BIM. They found that it took anywhere from six to eighteen
months to see a return on monetary investment in 5D BIM software
(AGCA, 2007).
• Another development is addressing the proprietary nature of historical cost
data. Each construction firm accumulates its own production rate and cost
data as they complete projects. This data is specific to the structure of their

110
company and its operating procedures. Each firm uses its own data to
estimate the cost of new work that they compete to win. If another
competing firm were to gain access to their proprietary data, then that firm
may gain a competitive advantage in the bidding process. The proprietary
nature of this data is why the firm would likely hire an in-house database
administrator. One responsibility of this administrator would be to
maintain the security of the firm's cost and BIM data.
• Construction cost reporting is the practice of the contractor managing their
spending in order to bill the client for the work that is installed. This
framework can enable highly detailed cost reporting. This could be
achieved by field personnel specifying the work items that are installed to
specific BIM elements. The successful installation data could flow to the
project management team who would bill the client for the work. Future
research should integrate this framework with construction phase data
collection. This integration could automate certain portions of the cost
reporting process. Detailed cost reporting within the context of the model-
based cost estimate should also allow the project management team to
better control cost. They could easily compare the estimated and reported
cost for a work item when both data points are stored in the BIM model
environment.
• This framework could reduce the cost of evaluating design alternatives. In
current cost estimating practices, the overhead cost of evaluating design
changes increases as the design is developed. This is because estimators
111
spend more to complete an estimate as to the detail of the project
documents increases. The growing cost can be reduced by reuse of
previously established mappings and work items. The model-based
framework enables re-use by storing data in SQL. This data is then
available to other BIM models with similar data hierarchies. Successful
data re-use using the SQL enabled structure reduces the time and cost to
evaluate a design iteration. This reduction could lead to complex and
iterative design cycles. Adopting this framework could benefit the project
team since considering more alternatives in the design phase should
provide improved value to the project’s stakeholders.
• Perhaps the most promising future development that this framework
enables is a temporal breakdown of the model-based cost estimate. This is
commonly referred to as a “5D BIM cost estimate”. A 5D BIM cost
estimate synthesizes the three spatial dimensions along with the
construction schedule and cost for constructing the design in that 3D
model. A conceptual 5D estimate is achievable with current unit price
estimating methods. Simulating the estimated cost and schedule alongside
the BIM environment can provide valuable insights for many project
stakeholders. Current practices do not attain the accuracy necessary to
represent a bid-tender detailed estimate in the BIM environment. The
model-based estimating framework incorporates enough detail into a 5D
estimate for the bid-tender level of accuracy.
112
REFERENCES
AACE Technical Board. (2015). AACE Recommended Practice No. 10S-90, Cost
Engineering Terminology. AACE International.
ADEB-VBA. (2015, October). BIM-Belgian Guide for the Construction Industry.
Retrieved from ADEB-VBA: http://adeb-vba.be/the-guide-to-bim.pdf
Alzraiee, H. H. (2013). Hybrid Simulation for Construction Operations. Montreal:
Concordia University.
Antunes, R., Gonzalez, V., Walsh, K., Rojas, O., O'Sullivan, M., & Odeh, I. (2018).
Benchmarking Project-Driven Production in Construction Using Productivity
Function: Capacity and Cycle Time. ASCE Journal of Construction Engineering
and Management.
Arronson, R. (2018, September 25). Facilities Management Director, Preliminary
Discussion on the Cal Poly Student Housing South Project. (M. T. Clark,
Interviewer)
Autodesk. (2018). BIM and the Future of AEC. Retrieved from AUTODESK:
https://www.autodesk.com/solutions/bim
Azhar, S. (2011). Building Information Modeling (BIM): Trends, Benefits, Risks, and
Challenges for the AEC Industry. Leadership and Management in Engineering,
241-252.
Borhani, A., Dossick, C., Lee, H., & Osburn, L. (2017). MBEst, A Technical Report on
Standardization of Model-Based Estimating. Center for Education and Research
in Construction.
Borrmann, A., Konig, M., Koch, C., & Beetz, J. (2018). Building Information Modeling:
Technology Foundations and Industry Practice. Springer International Publishing
AG.
Brook, M. (2017). Estimating and Tendering for Construction Work. New York:
Routledge.
Burnham, R., & Nagata, M. (2016). Alternate Project Delivery: Claims in Design-Build,
Guaranteed Maximum Price, and Other Delivery Methods. In R. Burnham, & M.
Nagata, Construction Contract Claims, Changes, and Dispute Resolution, Third
Edition. ASCE.
Cal Poly. (2018, July 16). yakʔitʸutʸu Residential Community. Retrieved from Youtube:
https://www.youtube.com/watch?v=EPwFtJGafwM

113
Chan, A. P., Scott, D., & Chan, A. P. (2004). Factors Affecting the Success of a
Construction Project. Journal of Construction Engineering and Management,
153-155.
Chen, K., Lu, W., Peng, Y., Rowlinson, S., & Huang, G. (2015). Bridging BIM and
Building: From a Literature Review to an Integrated Conceptual Framework.
International Journal of Project Management, 1405-1416.
Chen, Y., John, D., & Cox, R. (2018). Qualitatively Exploring the Impact of BIM on
Construction Performance. ICCREM, (pp. 60-70).
Christensen, P., Dysert, L., Bates, J., Borowicz, J., Bredehoeft, P., Brown, R., . . . Creese,
R. (2011). AACE International Recommended Practice No. 17R-97, Cost
Estimating Classification System. AACE.
Der Kiureghian, A. (2009). Probabilistic Methods for Engineering Risk Analysis.
Berkeley: U.C. Berkeley.
Dodds, J., & Johnson, S. (2011). Mastering Autodesk Navisworks 2012. John Wiley &
Sons.
Farnsworth, C., Beveridge, S., Miller, K., & Christofferson, J. (2014). Application,
Advantages, and Methods Associated with Using BIM in Commercial
Construction. International Journal of Construction Education and Research,
218-236.
Fernández-Solís, J., & Chugh, K. (2018). Structured Literature Review of Design-
Build/Bridging, Design-Bid-Build & Design-Build. Retrieved from Texas A&M
University Libraries: http://hdl.handle.net/1969.1/166265
Franco, J., Mahdi, F., & Abaza, H. (2015). Using Building Information Modeling (BIM)
for Estimating and Scheduling, Adoption Barriers. Universal Journal of
Management, 376-384.
Fulford, R., & Standing, C. (2013). Construction industry productivity and the potential
for. International Journal of Project Management, 315-326.
Ghaffarianhoseini, A., Tookey, J., Ghaffariahoseini, A., Naismith, N., Azhar, S., &
Efimova, O. (2017). Building Information Modelling (BIM) uptake: Clear
benefits, understanding its implementation, risks, and challenges. Renewable and
Sustainable Energy Reviews, 1046-1053.
Giordian. (2019, January 15). RSMeans Data Estimating Solution. Retrieved from
RSMeans Data from Giordian : https://www.rsmeansonline.com/
Golaszewska, M., & Salamak, M. (2017). Challenges in Takeoff and Cost Estimating in
the BIM Technology, Based on the Example of a Road Bridge Model. Technical
Transactions in Civil Engineering, 71-79.

114
Hall, J. (2018, July 27). Top 10 Benefits of BIM in Construction. Retrieved from
Autodesk BIM 360: https://connect.bim360.autodesk.com/benefits-of-bim-in-
construction
Hollmann, J., Bates, J., Burton, D., Creese, R., Dysert, L., Humphreys, K., . . . Querns,
W. (2003). AACE International Recommended Practice No. 19R-97, Estimate
Preparation Costs in the Process Industries. AACE.
Hollmann, J., Borowicz, J., Bredehoeft, P., Brown, R., Dysert, L., Pickett, T., & Pietlock,
B. (2012). AACE International Recommended Practice No. 11R-88, Required
Skills and Knowledge of Cost Engineering. AACE.
Isherwood, J. P. (1999). United States of America Patent No. US08357417.
Kam, C., Song, M., & Senaratna, D. (2016). VDC Scorecard: Formulation, Application,
and Validation. ASCE Journal of Construction Engineering and Management.
Kim, K., Cho, Y., & Kim, K. (2018). BIM-Based Decision-Making Framework for
Scaffolding Planning. ASCE Journal of Management in Engineering.
Kreider, R., Messner, J., & Dubler, C. (2010). Determining the Frequency and Impact of
Applying BIM for Different Purposes on Projects. Proceedings of the 6th
International Conference on Innovation in Architecture, Engineering, and
Construction (AEC). University Park, PA: Penn State University. Retrieved from
http://bim.psu.edu/uses/
Lawrence, M., Pottinger, R., Staub-French, S., & Nepal, M. (2014). Creating Flexible
Mappings between Building Information Models and Cost Information.
Automation in Construction, 107-118.
Lee, D.-G., Park, J.-Y., & Song, S.-H. (2018). BIM-Based Construction Information
Management Framework for Site Information Management. Hindawi Advances in
Civil Engineering.
Lee, S.-K., Kim, K.-R., & Uy, J.-H. (2014). BIM and Ontology-based Approach for
Building Cost Estimation. Automation in Construction, 96-105.
Lobel, J. (2008). Building Information: Means and Methods of Communication in Design
and Construction. Retrieved from Massachusetts Institute of Technology:
https://dspace.mit.edu/bitstream/handle/1721.1/43747/263921735-
MIT.pdf;sequence=2
Ma, X., Xiong, F., Olawumi, T., Dong, N., & Chan, A. (2018). Conceptual Framework
and Roadmap Approach for Integrating BIM into Lifecycle Project Management.
ASCE Journal of Management in Engineering.

115
McDonald, D., Zack, J., Armstrong, D., Bess, J., Boyd, R., Bradley, B., & Brake, R.
(2004). AACE International Recommended Practice No. 25R-03, Estimating Lost
Labor Productivity in Construction Claims. AACE.
McPhee, A. (2013). Practical BIM. Retrieved from
http://practicalbim.blogspot.com/2013/03/what-is-this-thing-called-lod.html
Monteiro, A., & Martins, J. P. (2013). A Survey of Modeling Guidelines for Quantity
Takeoff-Oriented BIM-based Design. Automation in Construction, 238-253.
Niazi, A., Dai, J., Balabani, S., & Senviratne, L. (2005). Product Cost Estimation:
Technique Classification and Methodology Review. Journal of Manufacturing in
Science and Engineering, 563-575.
Niknam, M., & Karshenas, S. (2015). Integrating Distributed Sources of Information for
Construction Cost Estimating Using Semantic Web and Semantic Web Service
Technologies. Automation in Construction, 222-238.
Olsen, D., & Taylor, J. (2017). Quantity Take-Off Using Building Information Modeling
(BIM), and Its Limiting Factors. Procedia Engineering, 1098-1105.
Pickett, T., Bredehoeft, P., Dowen, T., Dysert, L., Elliot, B., Hollmann, J., & Jacobson, S.
(2014). AACE Recommended Practice No. 34R-05. AACE International.
Qian, L., & Ben-Arieh, D. (2008). Parametric Cost Estimation based on Activity-based
Costing: A Case Study for Design and Development of Rotational Parts.
International Journal of Production Economics, 805-818.
Roy, T. M. (2018, September 24). Senior Estimator at McClone Concrete Construction,
Preliminary Discussion on Traditional Estimating Methods. (M. T. Clark,
Interviewer)
Sabol, L. (2008). Challenges in Cost Estimating with Building Information Modeling.
Design + Construction Strategies, LLC.
Said, H., & Reginato, J. (2018). Impact of Design Changes on Virtual Design and
Construction Performance for Electrical Contractors. Journal of Construction
Engineering and Management.
Sattineni, A., & Bradford, H. (2011). Estimating with BIM: A Survey of US Construction
Companies. International Association for Automation and Robotics in
Construction (pp. 564-569). Seoul: IAARC.
Scroggins, M. (2018, March 7). How BIM Can Enable Construction Scheduling in 4D.
Retrieved from Oracle Construction and Engineering Blog:
https://blogs.oracle.com/construction-engineering/how-bim-can-transform-
construction-scheduling
116
Sillak, G., Aaron, L., Burton, D., Christensen, P., Cort, T., & Erickson, C. (2003). AACE
Recommended Practice No. 20R-98, Project Code of Accounts. AACE
International.
Stanford Engineering. (2018). VDC Program - Glossary of Terms. Retrieved from
Stanford Engineering: Center for Integrated Facility Engineering:
https://cife.stanford.edu/events/cifeppi-vdc-certificate-program/vdc-program-
glossary-terms
The American Institute of Architects. (2007). Integrated Project Delivery: A Guide.
Retrieved from https://info.aia.org/SiteObjects/files/IPD_Guide_2007.pdf
The Associated General Contractors of America. (2007). The Contractors' Guide to BIM.
Retrieved from
https://www.engr.psu.edu/ae/thesis/portfolios/2008/tjs288/Research/AGC_Guide
ToBIM.pdf
Trimble Navigation Limited. (2014). Trimble GCEstimator Suite. Retrieved from
http://trl.trimble.com/docushare/dsweb/Get/Document-746574/022519-
101_TrimbleGCEstimatorSuite_TN_1014_2pp_LR.pdf
Turner and Townsend. (2018). International Construction Market Survey. Retrieved from
Turner and Townsend:
http://www.turnerandtownsend.com/media/3352/international-construction-
market-survey-2018.pdf
Tuttle, J. (2018, September 24). Construction Superintendent, Preliminary Discussion on
the Cal Poly Student Housing South Project. (M. T. Clark, Interviewer)
Wu, J., & Zhang, J. (2018). Automated BIM Object Classification to Support BIM
Interoperability. Construction Research Congress, (pp. 706-715).
Wyatt, T. (2018, September 25). Project Manager at Kitchell, Preliminary Discussion on
the Cal Poly Student Housing South Project. (M. T. Clark, Interviewer)
Zhao, P., & Wang, C. (2014). A Comparison of Using Traditional Cost Estimating
Software and BIM for Construction Cost Control. Smart Construction and
Management in the Context of New Technology. ASCE.

117
APPENDICES
Appendix A: Power BI Cost Estimate Report
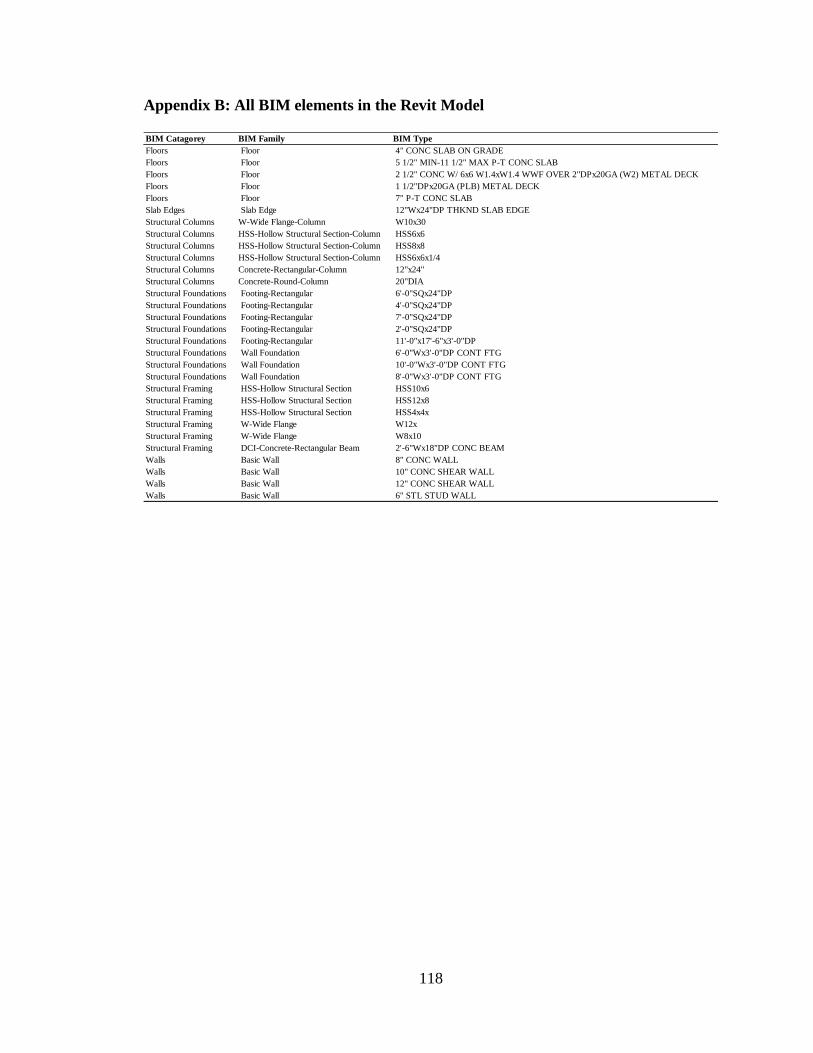
118
Appendix B: All BIM elements in the Revit Model
BIM Catagorey BIM Family BIM Type
Floors Floor 4" CONC SLAB ON GRADE
Floors Floor 5 1/2" MIN-11 1/2" MAX P-T CONC SLAB
Floors Floor 2 1/2" CONC W/ 6x6 W1.4xW1.4 WWF OVER 2"DPx20GA (W2) METAL DECK
Floors Floor 1 1/2"DPx20GA (PLB) METAL DECK
Floors Floor 7" P-T CONC SLAB
Slab Edges Slab Edge 12"Wx24"DP THKND SLAB EDGE
Structural Columns W-Wide Flange-Column W10x30
Structural Columns HSS-Hollow Structural Section-Column HSS6x6
Structural Columns HSS-Hollow Structural Section-Column HSS8x8
Structural Columns HSS-Hollow Structural Section-Column HSS6x6x1/4
Structural Columns Concrete-Rectangular-Column 12"x24"
Structural Columns Concrete-Round-Column 20"DIA
Structural Foundations Footing-Rectangular 6'-0"SQx24"DP
Structural Foundations Footing-Rectangular 4'-0"SQx24"DP
Structural Foundations Footing-Rectangular 7'-0"SQx24"DP
Structural Foundations Footing-Rectangular 2'-0"SQx24"DP
Structural Foundations Footing-Rectangular 11'-0"x17'-6"x3'-0"DP
Structural Foundations Wall Foundation 6'-0"Wx3'-0"DP CONT FTG
Structural Foundations Wall Foundation 10'-0"Wx3'-0"DP CONT FTG
Structural Foundations Wall Foundation 8'-0"Wx3'-0"DP CONT FTG
Structural Framing HSS-Hollow Structural Section HSS10x6
Structural Framing HSS-Hollow Structural Section HSS12x8
Structural Framing HSS-Hollow Structural Section HSS4x4x
Structural Framing W-Wide Flange W12x
Structural Framing W-Wide Flange W8x10
Structural Framing DCI-Concrete-Rectangular Beam 2'-6"Wx18"DP CONC BEAM
Walls Basic Wall 8" CONC WALL
Walls Basic Wall 10" CONC SHEAR WALL
Walls Basic Wall 12" CONC SHEAR WALL
Walls Basic Wall 6" STL STUD WALL
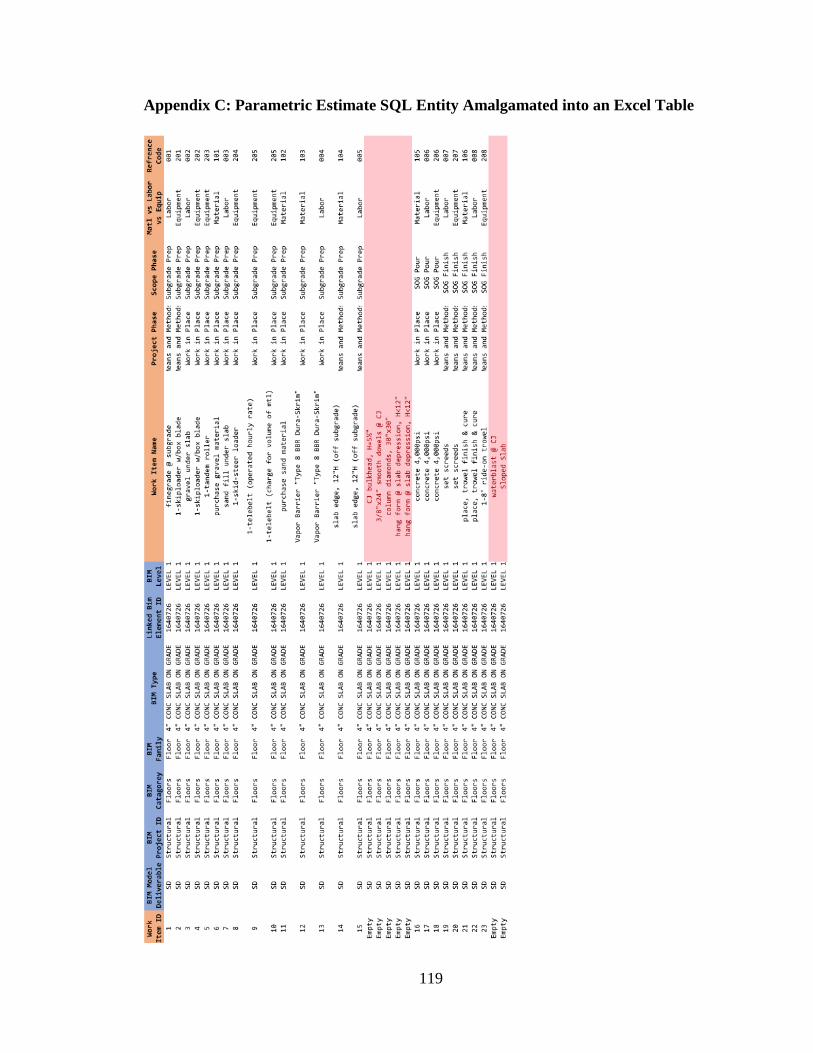
119
Appendix C: Parametric Estimate SQL Entity Amalgamated into an Excel Table
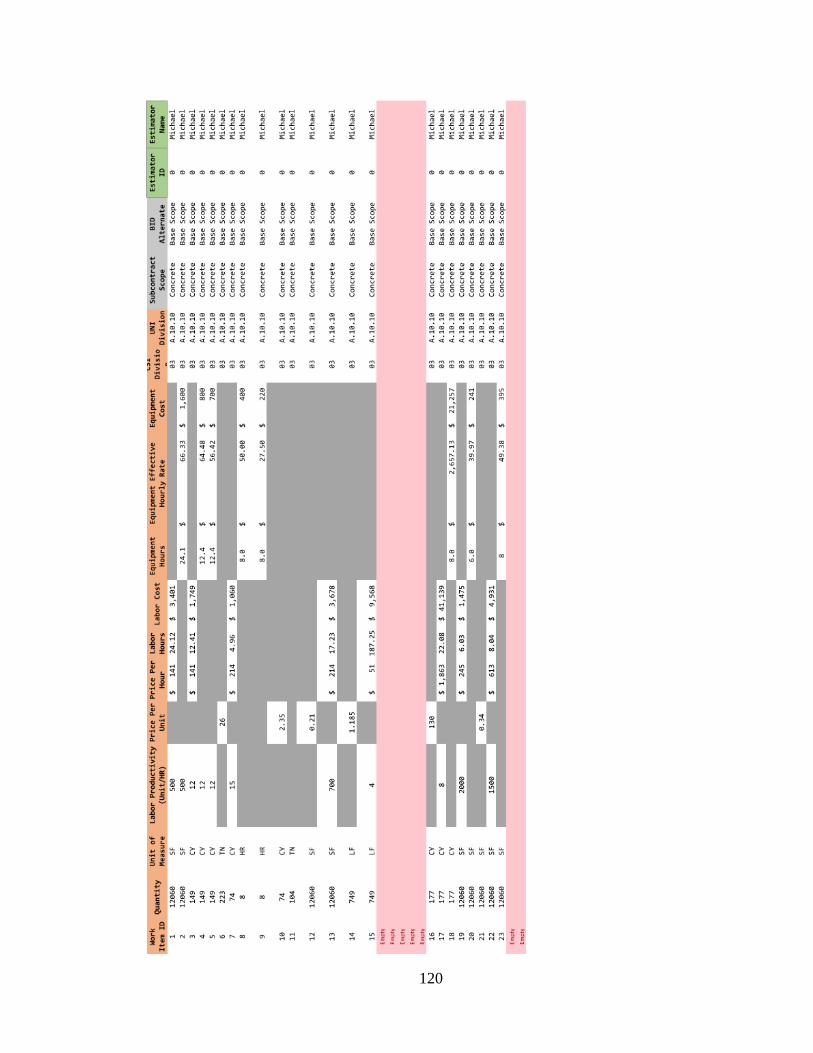
120