a focused demonstration project: the “cozy” by radiator labs
TRANSCRIPT
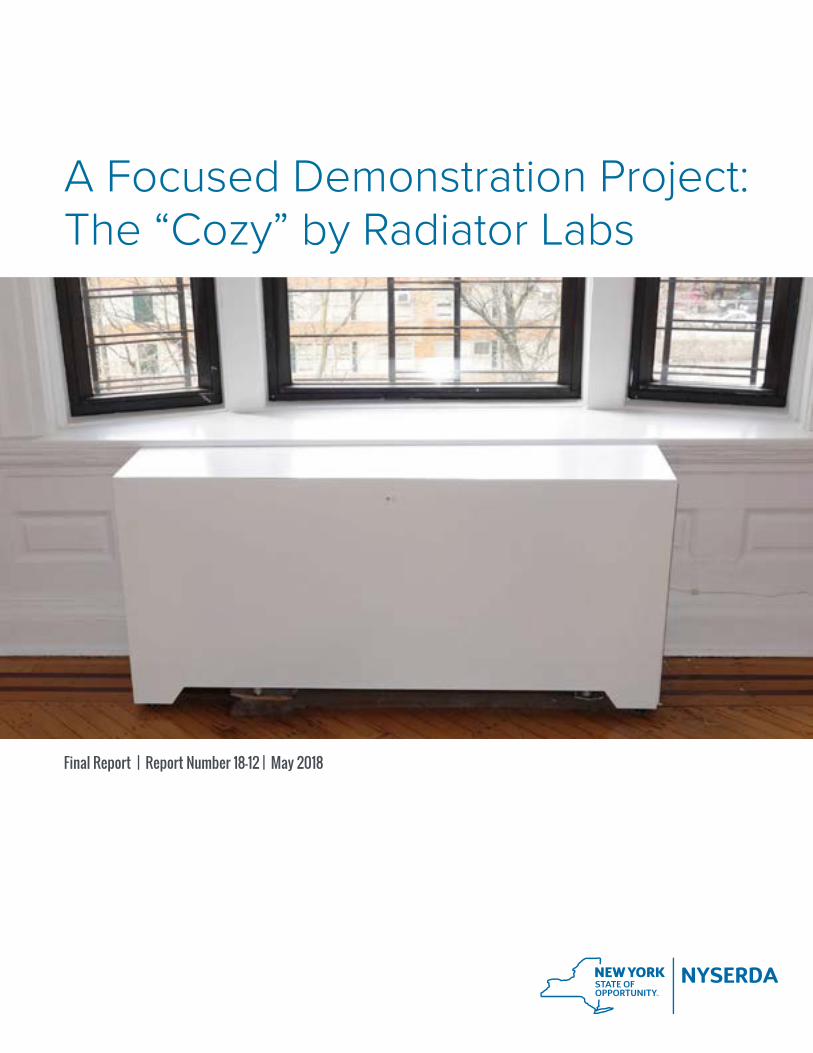
A Focused Demonstration Project:The “Cozy” by Radiator Labs
Final Report | Report Number 18-12 | May 2018
NYSERDA’s Promise to New Yorkers: NYSERDA provides resources, expertise, and objective information so New Yorkers can make confident, informed energy decisions.
Mission Statement:Advance innovative energy solutions in ways that improve New York’s economy and environment.
Vision Statement:Serve as a catalyst – advancing energy innovation, technology, and investment; transforming
New York’s economy; and empowering people to choose clean and efficient energy as part
of their everyday lives.
A Focused Demonstration Project: The “Cozy” by Radiator Labs
Final Report
Prepared for:
New York State Energy Research and Development Authority
Albany, NY
Andrew Tighe Project Manager
Prepared by:
Energy & Resource Solutions
George Zúñiga Project Manager
NYSERDA Report 18-12 NYSERDA Contract 53648 May, 2018
ii
Notice This report was prepared by Energy & Resource Solutions in the course of performing work contracted
for and sponsored by the New York State Energy Research and Development Authority (hereafter
“NYSERDA”). The opinions expressed in this report do not necessarily reflect those of NYSERDA
or the State of New York, and reference to any specific product, service, process, or method does not
constitute an implied or expressed recommendation or endorsement of it. Further, NYSERDA, the State
of New York, and the contractor make no warranties or representations, expressed or implied, as to the
fitness for particular purpose or merchantability of any product, apparatus, or service, or the usefulness,
completeness, or accuracy of any processes, methods, or other information contained, described,
disclosed, or referred to in this report. NYSERDA, the State of New York, and the contractor make
no representation that the use of any product, apparatus, process, method, or other information will
not infringe privately owned rights and will assume no liability for any loss, injury, or damage resulting
from, or occurring in connection with, the use of information contained, described, disclosed, or referred
to in this report.
NYSERDA makes every effort to provide accurate information about copyright owners and related
matters in the reports we publish. Contractors are responsible for determining and satisfying copyright
or other use restrictions regarding the content of reports that they write, in compliance with NYSERDA’s
policies and federal law. If you are the copyright owner and believe a NYSERDA report has not properly
attributed your work to you or has used it without permission, please email [email protected]
Information contained in this document, such as web page addresses, are current at the time
of publication.
iii
Abstract Radiator Labs has developed a technology that eliminates overheating in steam-heated buildings,
the predominant heating technology found in larger, older cities like NYC.
Beginning in 2013, with NYSERDA ETAC (Emerging Technologies Accelerated Commercialization)
support, Radiator Labs engaged in an ETAC focused demonstration to establish the technology's impact
in seven full-building deployments. After five years of third-party evaluation, the project team found
that the technology saved 25% on average in all buildings evaluated with savings as high as 45%. The
smallest efficiency gain (14.5%) was found in a building that, post retrofit, is among the most efficient
one-pipe steam buildings in the entire NYC area, demonstrating the impact of the technology even on
relatively efficient buildings.
Keywords Steam Heat, Radiator Labs, TRV, Cozy
iv
Table of Contents Notice .........................................................................................................................................ii Abstract ....................................................................................................................................iii Keywords ..................................................................................................................................iii List of Figures ...........................................................................................................................v
List of Tables .............................................................................................................................v
Summary ...................................................................................................................................1
1 Site Description..................................................................................................................1
2 Measurement and Verification Data Collection ................................................................2 2.1 3601 Kings Highway ................................................................................................................. 2 2.2 Butler Hall ................................................................................................................................ 3 2.3 The Lunt-Fontanne Theatre ...................................................................................................... 4 2.4 1215 Myrtle Avenue ................................................................................................................. 4 2.5 295 Clinton Avenue .................................................................................................................. 5
3 Analysis Methodology .......................................................................................................6 3.1 Billing Analysis ......................................................................................................................... 6
3.1.1 3601 Kings Highway ......................................................................................................... 6 3.1.2 Butler Hall ......................................................................................................................... 8 3.1.3 1215 Myrtle Avenue ........................................................................................................ 10 3.1.4 The Lunt-Fontanne Theatre ............................................................................................ 13 3.1.5 295 Clinton Avenue ........................................................................................................ 17
3.2 Boiler Run-Time Analysis ....................................................................................................... 18 3.3 Room-Temperature Analysis .................................................................................................. 21
4 Results Summary .............................................................................................................24
v
List of Figures Figure 1. Heating Gas Use Regression–1215 Myrtle Avenue ....................................................12 Figure 2. District Steam Use Regression–Lunt-Fontanne Theatre.............................................16 Figure 3. Boiler Run-Time Regression–3601 Kings Highway ....................................................19 Figure 4. Boiler 1 Run-Time Regression–Butler Hall .................................................................20 Figure 5. Average Room Temperature–3601 Kings Highway ....................................................22 Figure 6. Average Room Temperature–Butler Hall ....................................................................23
List of Tables Table 1. Key Site Features ..........................................................................................................1 Table 2. 3601 Kings Highway Metered Points .............................................................................2 Table 3. Butler Hall Metered Points .............................................................................................3 Table 4. Lunt-Fontanne Theatre Metered Points .........................................................................4 Table 5. 1215 Myrtle Avenue Metered Points ..............................................................................5 Table 6. 295 Clinton Avenue Metered Points ..............................................................................5 Table 7. 3601 Kings Highway Billing Data ...................................................................................7 Table 8. Pre-Installation Space Heating Energy Usage–3601 Kings Highway .............................7 Table 9. Post-Installation Space Heating Energy Usage–3601 Kings Highway ...........................7 Table 10. 3601 Kings Highway Billing Analysis Summary ...........................................................8 Table 11. Butler Hall Billing Data .................................................................................................8 Table 12. Pre-Installation Space Heating Energy Usage–Butler Hall ...........................................9 Table 13. Post-Installation Space Heating Energy Usage–Butler Hall .........................................9 Table 14. Butler Hall Billing Analysis Summary ...........................................................................9 Table 15. 1215 Myrtle Avenue Billing Data ................................................................................10 Table 16. Pre-Installation Space-Heating Energy Usage–1215 Myrtle Avenue .........................11 Table 17. Post-Installation Space Heating Energy Usage–1215 Myrtle Avenue ........................11 Table 18. 1215 Myrtle Avenue Billing Analysis Summary ..........................................................12 Table 19. 1215 Myrtle Avenue Billing Analysis Summary (Linear Regression Model) ...............13 Table 20. The Lunt-Fontanne Theatre Billing Data ....................................................................13 Table 21. The Lunt-Fontanne Theatre Billing Analysis Summary ..............................................15 Table 22. The Lunt-Fontanne Theatre Billing Analysis Summary ..............................................16 Table 23. 295 Clinton Avenue Billing Data ................................................................................17 Table 24. Pre-Installation Space-Heating Energy Usage–295 Clinton Avenue ..........................17 Table 25. Post-Installation Space-Heating Energy Usage–295 Clinton Avenue ........................17 Table 26. 295 Clinton Avenue Billing Analysis Summary ..........................................................18 Table 27. Summary of Results ..................................................................................................24
S-1
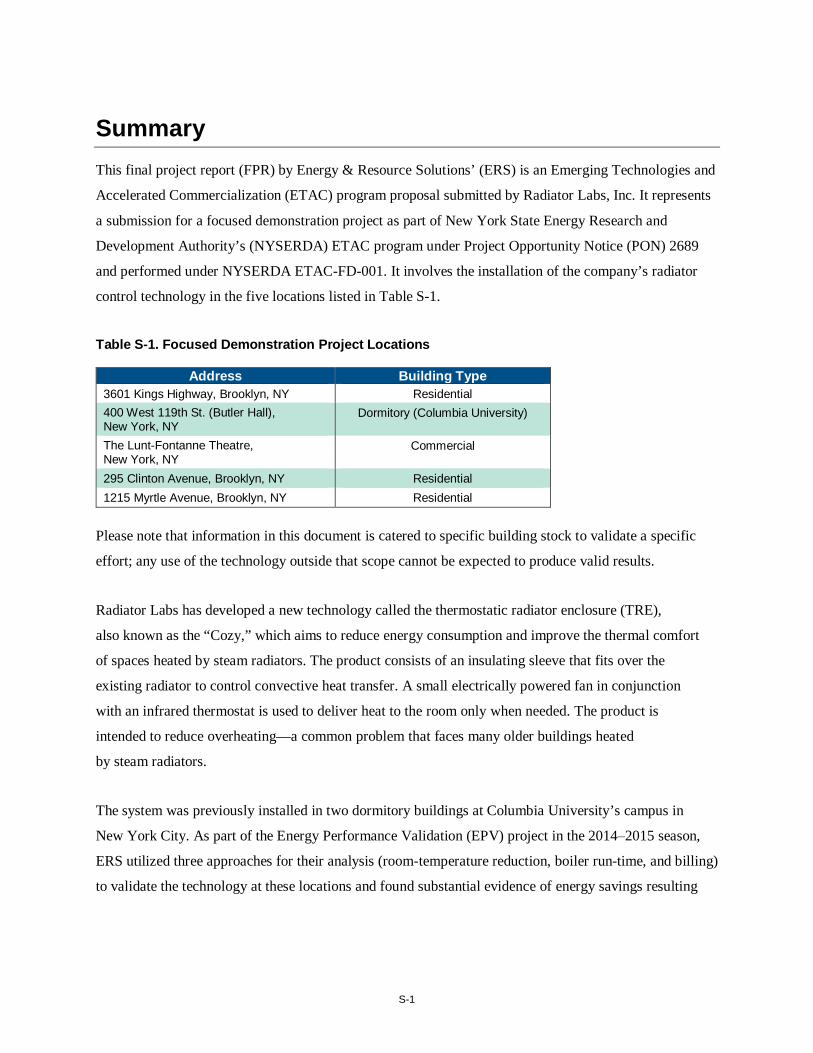
Summary This final project report (FPR) by Energy & Resource Solutions’ (ERS) is an Emerging Technologies and
Accelerated Commercialization (ETAC) program proposal submitted by Radiator Labs, Inc. It represents
a submission for a focused demonstration project as part of New York State Energy Research and
Development Authority’s (NYSERDA) ETAC program under Project Opportunity Notice (PON) 2689
and performed under NYSERDA ETAC-FD-001. It involves the installation of the company’s radiator
control technology in the five locations listed in Table S-1.
Table S-1. Focused Demonstration Project Locations
Address Building Type 3601 Kings Highway, Brooklyn, NY Residential 400 West 119th St. (Butler Hall), New York, NY
Dormitory (Columbia University)
The Lunt-Fontanne Theatre, New York, NY
Commercial
295 Clinton Avenue, Brooklyn, NY Residential 1215 Myrtle Avenue, Brooklyn, NY Residential
Please note that information in this document is catered to specific building stock to validate a specific
effort; any use of the technology outside that scope cannot be expected to produce valid results.
Radiator Labs has developed a new technology called the thermostatic radiator enclosure (TRE),
also known as the “Cozy,” which aims to reduce energy consumption and improve the thermal comfort
of spaces heated by steam radiators. The product consists of an insulating sleeve that fits over the
existing radiator to control convective heat transfer. A small electrically powered fan in conjunction
with an infrared thermostat is used to deliver heat to the room only when needed. The product is
intended to reduce overheating—a common problem that faces many older buildings heated
by steam radiators.
The system was previously installed in two dormitory buildings at Columbia University’s campus in
New York City. As part of the Energy Performance Validation (EPV) project in the 2014‒2015 season,
ERS utilized three approaches for their analysis (room-temperature reduction, boiler run-time, and billing)
to validate the technology at these locations and found substantial evidence of energy savings resulting
S-2
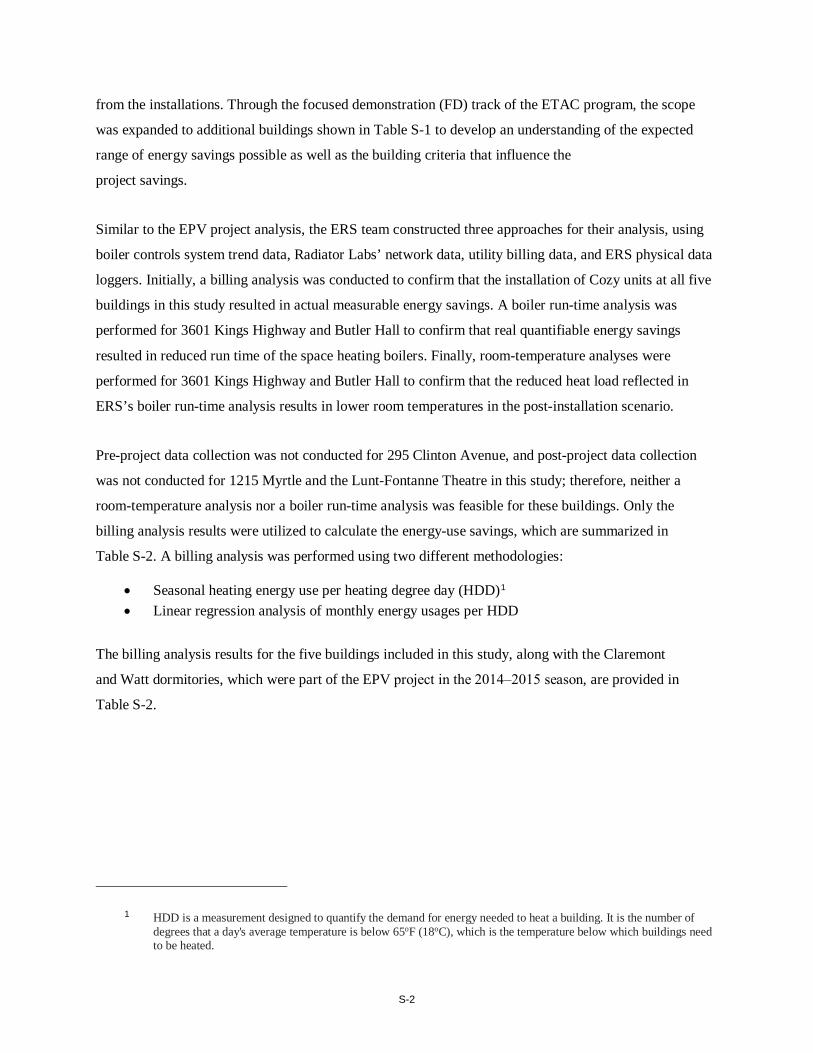
from the installations. Through the focused demonstration (FD) track of the ETAC program, the scope
was expanded to additional buildings shown in Table S-1 to develop an understanding of the expected
range of energy savings possible as well as the building criteria that influence the
project savings.
Similar to the EPV project analysis, the ERS team constructed three approaches for their analysis, using
boiler controls system trend data, Radiator Labs’ network data, utility billing data, and ERS physical data
loggers. Initially, a billing analysis was conducted to confirm that the installation of Cozy units at all five
buildings in this study resulted in actual measurable energy savings. A boiler run-time analysis was
performed for 3601 Kings Highway and Butler Hall to confirm that real quantifiable energy savings
resulted in reduced run time of the space heating boilers. Finally, room-temperature analyses were
performed for 3601 Kings Highway and Butler Hall to confirm that the reduced heat load reflected in
ERS’s boiler run-time analysis results in lower room temperatures in the post-installation scenario.
Pre-project data collection was not conducted for 295 Clinton Avenue, and post-project data collection
was not conducted for 1215 Myrtle and the Lunt-Fontanne Theatre in this study; therefore, neither a
room-temperature analysis nor a boiler run-time analysis was feasible for these buildings. Only the
billing analysis results were utilized to calculate the energy-use savings, which are summarized in
Table S-2. A billing analysis was performed using two different methodologies:
• Seasonal heating energy use per heating degree day (HDD)1 • Linear regression analysis of monthly energy usages per HDD
The billing analysis results for the five buildings included in this study, along with the Claremont
and Watt dormitories, which were part of the EPV project in the 2014‒2015 season, are provided in
Table S-2.
1 HDD is a measurement designed to quantify the demand for energy needed to heat a building. It is the number of degrees that a day's average temperature is below 65oF (18oC), which is the temperature below which buildings need to be heated.
S-3
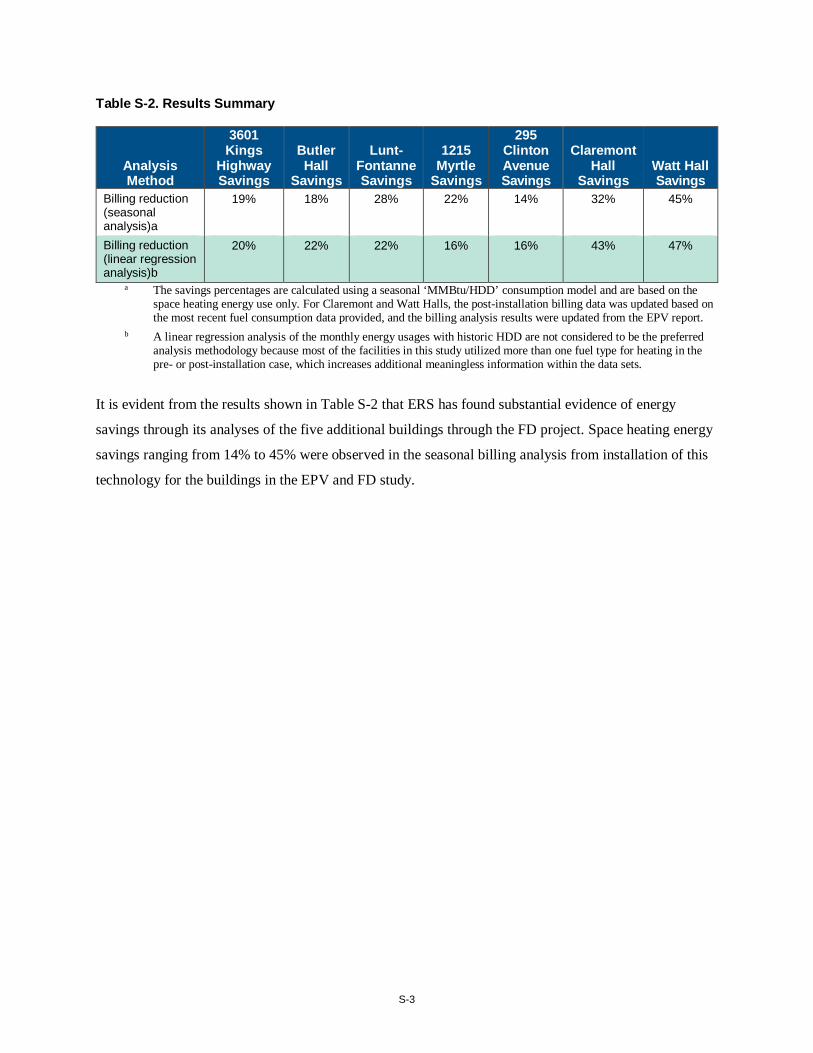
Table S-2. Results Summary
Analysis Method
3601 Kings
Highway Savings
Butler Hall
Savings
Lunt-Fontanne Savings
1215 Myrtle
Savings
295 Clinton Avenue Savings
Claremont Hall
Savings Watt Hall Savings
Billing reduction (seasonal analysis)a
19% 18% 28% 22% 14% 32% 45%
Billing reduction (linear regression analysis)b
20% 22% 22% 16% 16% 43% 47%
a The savings percentages are calculated using a seasonal ‘MMBtu/HDD’ consumption model and are based on the space heating energy use only. For Claremont and Watt Halls, the post-installation billing data was updated based on the most recent fuel consumption data provided, and the billing analysis results were updated from the EPV report.
b A linear regression analysis of the monthly energy usages with historic HDD are not considered to be the preferred analysis methodology because most of the facilities in this study utilized more than one fuel type for heating in the pre- or post-installation case, which increases additional meaningless information within the data sets.
It is evident from the results shown in Table S-2 that ERS has found substantial evidence of energy
savings through its analyses of the five additional buildings through the FD project. Space heating energy
savings ranging from 14% to 45% were observed in the seasonal billing analysis from installation of this
technology for the buildings in the EPV and FD study.
1
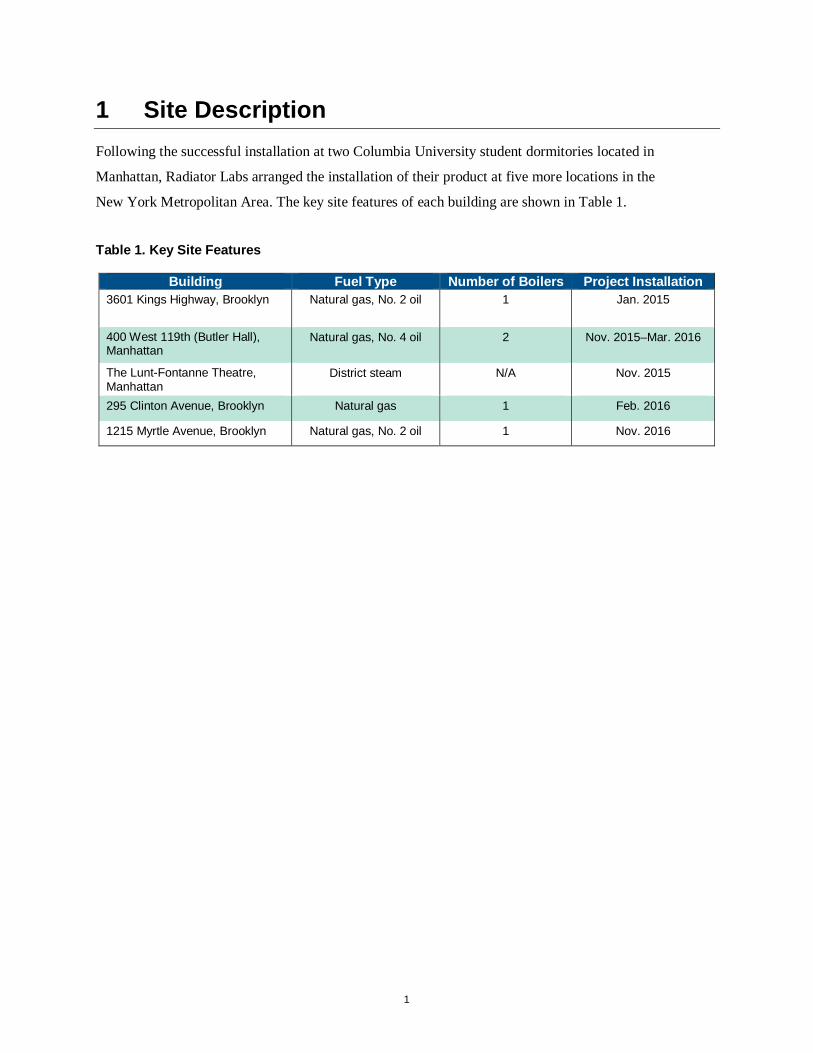
1 Site Description Following the successful installation at two Columbia University student dormitories located in
Manhattan, Radiator Labs arranged the installation of their product at five more locations in the
New York Metropolitan Area. The key site features of each building are shown in Table 1.
Table 1. Key Site Features
Building Fuel Type Number of Boilers Project Installation 3601 Kings Highway, Brooklyn Natural gas, No. 2 oil 1 Jan. 2015
400 West 119th (Butler Hall), Manhattan
Natural gas, No. 4 oil 2 Nov. 2015–Mar. 2016
The Lunt-Fontanne Theatre, Manhattan
District steam N/A Nov. 2015
295 Clinton Avenue, Brooklyn Natural gas 1 Feb. 2016
1215 Myrtle Avenue, Brooklyn Natural gas, No. 2 oil 1 Nov. 2016
2
2 Measurement and Verification Data Collection ERS worked with Radiator Labs to collect measurement and verification (M&V) data in a few different
ways. First, utility billing data was collected for all five buildings to analyze the pre- and post-installation
fuel use. Boiler controls system trend data, Radiator Labs’ network data, and ERS’s physical data loggers
were utilized to compile a variety of data points at 3601 Kings Highway and Butler Hall during the
pre- and post-installation periods to analyze the boiler run time and room-temperature reduction. Data
loggers were also installed on the boiler at 295 Clinton Avenue to analyze the post-installation boiler
run time, but the loggers were not returned as planned to ERS, and hence a boiler run-time reduction
analysis was not feasible. The following sections provide a list of data points collected, including the
type of point, measurement method, time increment, quantity, and metering duration for each site.
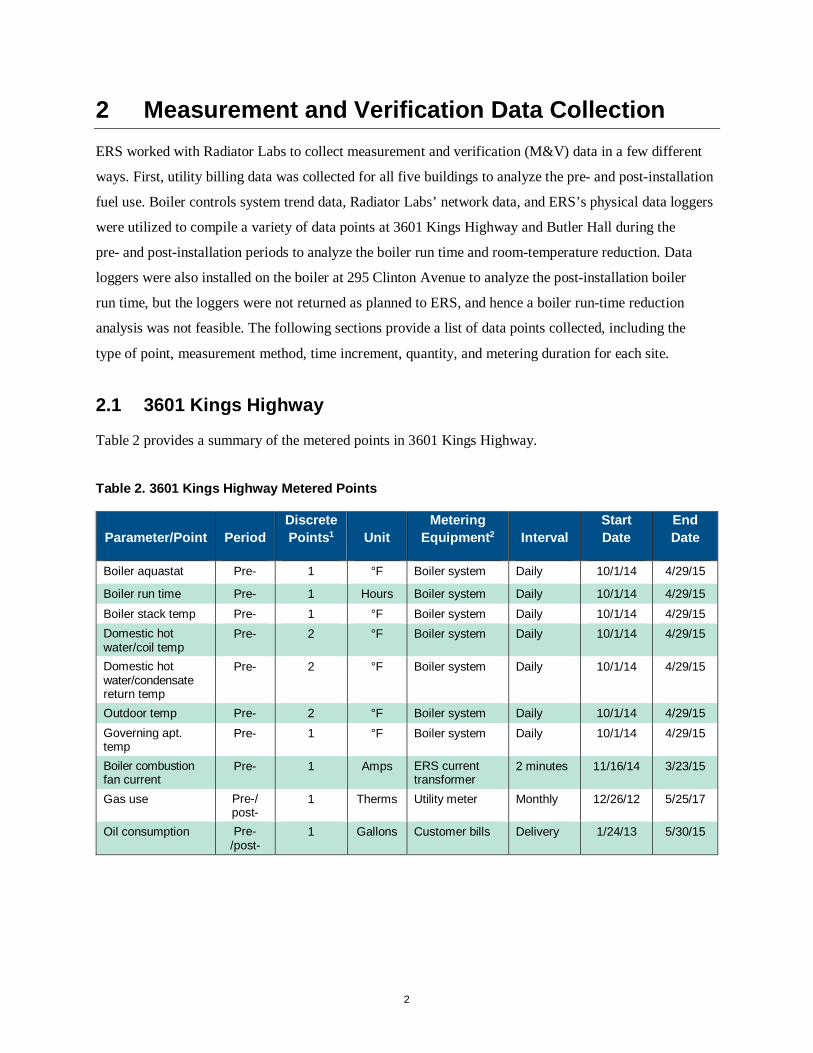
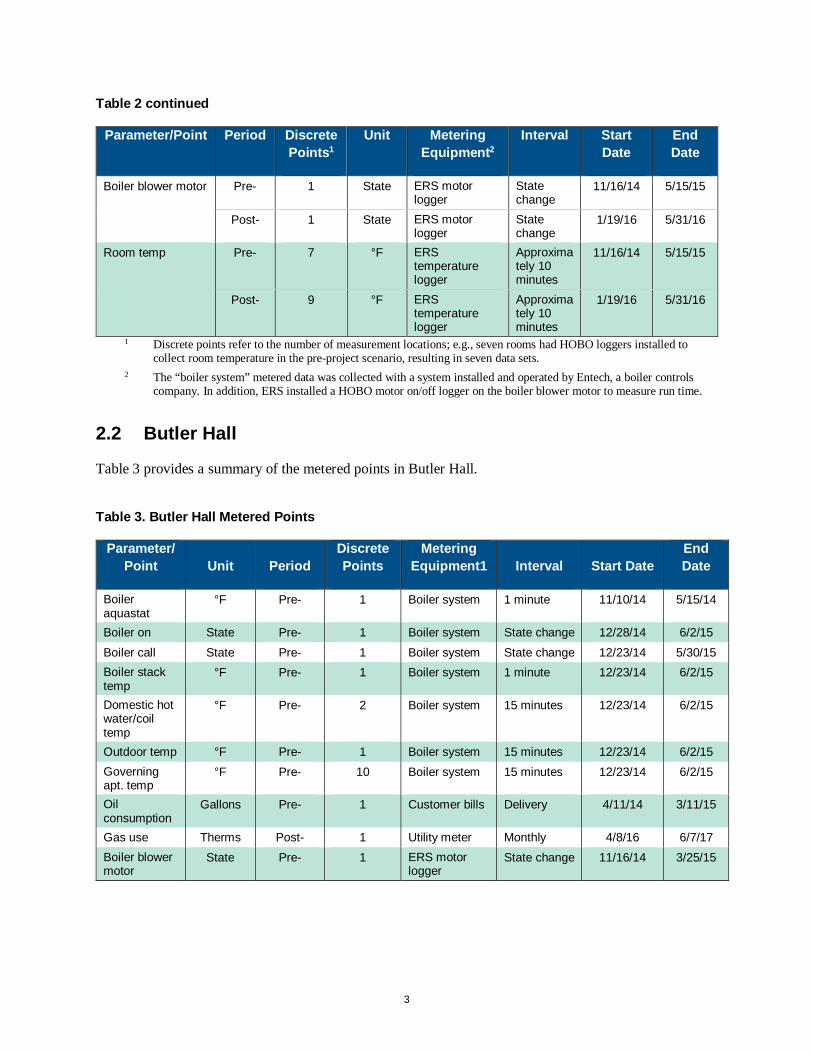
2.1 3601 Kings Highway
Table 2 provides a summary of the metered points in 3601 Kings Highway.
Table 2. 3601 Kings Highway Metered Points
Parameter/Point Period Discrete Points1 Unit
Metering Equipment2 Interval
Start Date
End Date
Boiler aquastat Pre- 1 °F Boiler system Daily 10/1/14 4/29/15
Boiler run time Pre- 1 Hours Boiler system Daily 10/1/14 4/29/15 Boiler stack temp Pre- 1 °F Boiler system Daily 10/1/14 4/29/15 Domestic hot water/coil temp
Pre- 2 °F Boiler system Daily 10/1/14 4/29/15
Domestic hot water/condensate return temp
Pre- 2 °F Boiler system Daily 10/1/14 4/29/15
Outdoor temp Pre- 2 °F Boiler system Daily 10/1/14 4/29/15 Governing apt. temp
Pre- 1 °F Boiler system Daily 10/1/14 4/29/15
Boiler combustion fan current
Pre- 1 Amps ERS current transformer
2 minutes 11/16/14 3/23/15
Gas use Pre-/ post-
1 Therms Utility meter Monthly 12/26/12 5/25/17
Oil consumption Pre-/post-
1 Gallons Customer bills Delivery 1/24/13 5/30/15
3
Table 2 continued
Parameter/Point Period Discrete Points1
Unit Metering Equipment2
Interval Start Date
End Date
Boiler blower motor Pre- 1 State ERS motor logger
State change
11/16/14 5/15/15
Post- 1 State ERS motor logger
State change
1/19/16 5/31/16
Room temp Pre- 7 °F ERS temperature logger
Approximately 10 minutes
11/16/14 5/15/15
Post- 9 °F ERS temperature logger
Approximately 10 minutes
1/19/16 5/31/16
1 Discrete points refer to the number of measurement locations; e.g., seven rooms had HOBO loggers installed to collect room temperature in the pre-project scenario, resulting in seven data sets.
2 The “boiler system” metered data was collected with a system installed and operated by Entech, a boiler controls company. In addition, ERS installed a HOBO motor on/off logger on the boiler blower motor to measure run time.
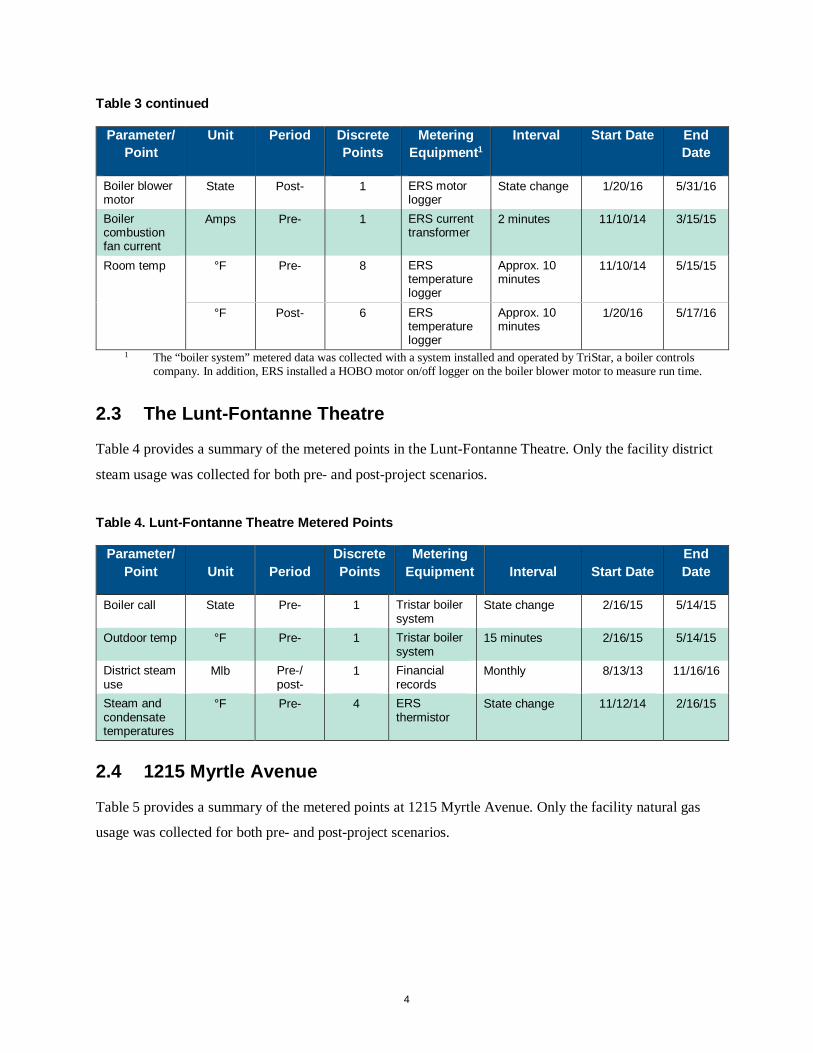
2.2 Butler Hall
Table 3 provides a summary of the metered points in Butler Hall.
Table 3. Butler Hall Metered Points
Parameter/ Point Unit Period
Discrete Points
Metering Equipment1 Interval Start Date
End Date
Boiler aquastat
°F Pre- 1 Boiler system 1 minute 11/10/14 5/15/14
Boiler on State Pre- 1 Boiler system State change 12/28/14 6/2/15 Boiler call State Pre- 1 Boiler system State change 12/23/14 5/30/15 Boiler stack temp
°F Pre- 1 Boiler system 1 minute 12/23/14 6/2/15
Domestic hot water/coil temp
°F Pre- 2 Boiler system 15 minutes 12/23/14 6/2/15
Outdoor temp °F Pre- 1 Boiler system 15 minutes 12/23/14 6/2/15 Governing apt. temp
°F Pre- 10 Boiler system 15 minutes 12/23/14 6/2/15
Oil consumption
Gallons Pre- 1 Customer bills Delivery 4/11/14 3/11/15
Gas use Therms Post- 1 Utility meter Monthly 4/8/16 6/7/17 Boiler blower motor
State Pre- 1 ERS motor logger
State change 11/16/14 3/25/15
4
Table 3 continued
Parameter/ Point
Unit Period Discrete Points
Metering Equipment1
Interval Start Date End Date
Boiler blower motor
State Post- 1 ERS motor logger
State change 1/20/16 5/31/16
Boiler combustion fan current
Amps Pre- 1 ERS current transformer
2 minutes 11/10/14 3/15/15
Room temp °F Pre- 8 ERS temperature logger
Approx. 10 minutes
11/10/14 5/15/15
°F Post- 6 ERS temperature logger
Approx. 10 minutes
1/20/16 5/17/16
1 The “boiler system” metered data was collected with a system installed and operated by TriStar, a boiler controls company. In addition, ERS installed a HOBO motor on/off logger on the boiler blower motor to measure run time.
2.3 The Lunt-Fontanne Theatre
Table 4 provides a summary of the metered points in the Lunt-Fontanne Theatre. Only the facility district
steam usage was collected for both pre- and post-project scenarios.
Table 4. Lunt-Fontanne Theatre Metered Points
Parameter/ Point Unit Period
Discrete Points
Metering Equipment Interval Start Date
End Date
Boiler call State Pre- 1 Tristar boiler system
State change 2/16/15 5/14/15
Outdoor temp °F Pre- 1 Tristar boiler system
15 minutes 2/16/15 5/14/15
District steam use
Mlb Pre-/ post-
1 Financial records
Monthly 8/13/13 11/16/16
Steam and condensate temperatures
°F Pre- 4 ERS thermistor
State change 11/12/14 2/16/15
2.4 1215 Myrtle Avenue
Table 5 provides a summary of the metered points at 1215 Myrtle Avenue. Only the facility natural gas
usage was collected for both pre- and post-project scenarios.
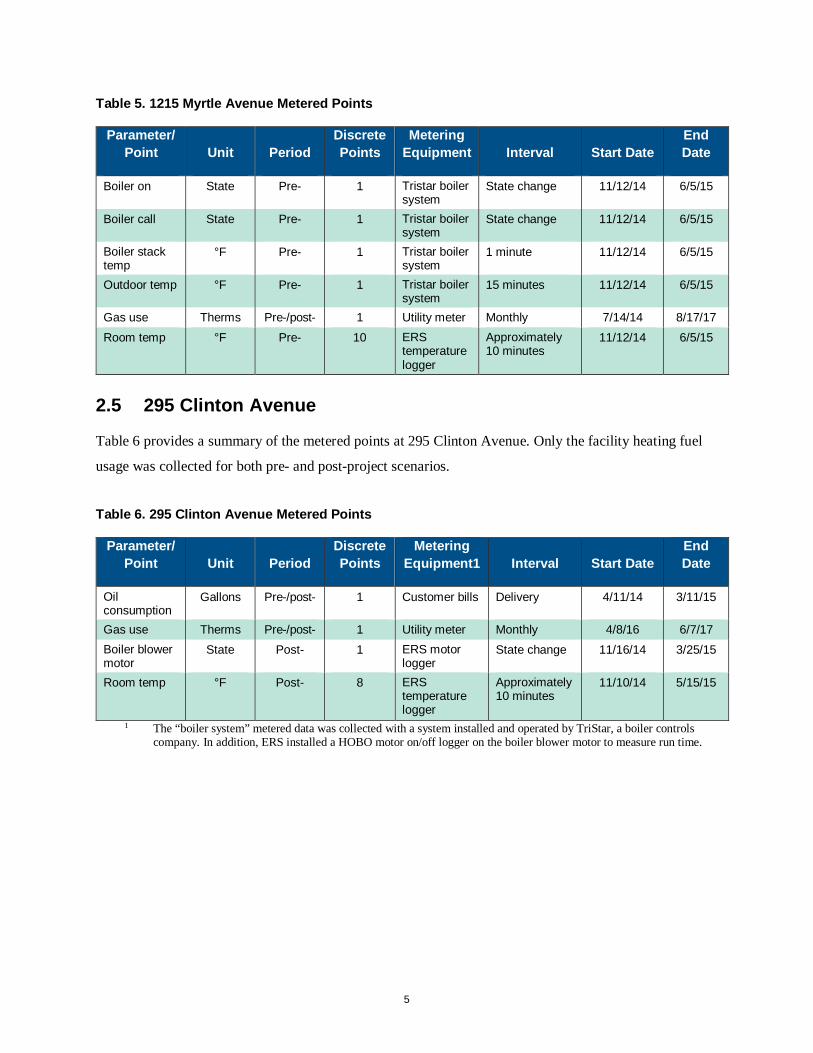
5
Table 5. 1215 Myrtle Avenue Metered Points
Parameter/ Point Unit Period
Discrete Points
Metering Equipment Interval Start Date
End Date
Boiler on State Pre- 1 Tristar boiler system
State change 11/12/14 6/5/15
Boiler call State Pre- 1 Tristar boiler system
State change 11/12/14 6/5/15
Boiler stack temp
°F Pre- 1 Tristar boiler system
1 minute 11/12/14 6/5/15
Outdoor temp °F Pre- 1 Tristar boiler system
15 minutes 11/12/14 6/5/15
Gas use Therms Pre-/post- 1 Utility meter Monthly 7/14/14 8/17/17 Room temp °F Pre- 10 ERS
temperature logger
Approximately 10 minutes
11/12/14 6/5/15
2.5 295 Clinton Avenue
Table 6 provides a summary of the metered points at 295 Clinton Avenue. Only the facility heating fuel
usage was collected for both pre- and post-project scenarios.
Table 6. 295 Clinton Avenue Metered Points
Parameter/ Point Unit Period
Discrete Points
Metering Equipment1 Interval Start Date
End Date
Oil consumption
Gallons Pre-/post- 1 Customer bills Delivery 4/11/14 3/11/15
Gas use Therms Pre-/post- 1 Utility meter Monthly 4/8/16 6/7/17 Boiler blower motor
State Post- 1 ERS motor logger
State change 11/16/14 3/25/15
Room temp
°F Post- 8 ERS temperature logger
Approximately 10 minutes
11/10/14 5/15/15
1 The “boiler system” metered data was collected with a system installed and operated by TriStar, a boiler controls company. In addition, ERS installed a HOBO motor on/off logger on the boiler blower motor to measure run time.
6
3 Analysis Methodology ERS utilized utility billing analysis methodology to calculate energy savings from the installation of Cozy
units at each of the buildings. A higher degree of confidence is achieved by substantiating the results of
the billing analysis methodology with boiler run-time analysis and room-temperature analysis.
• Billing analysis. The first approach uses utility billing data to confirm that the installation of TRE units actually led to a reduction in billed natural gas and fuel oil use in each affected building. The pre-installation and post-installation space heating fuel usage at each of the facilities per HDD data for a base temperature of 65°F are calculated and then normalized to typical meteorological year weather (TMY3) data on an annual basis to estimate the savings from the project.
• Boiler run-time analysis. Next, data collected about the boiler run time is used to create a regression to the outdoor weather conditions to confirm that the energy savings from the billing analysis results in reduced run time of the space heating boilers with the Radiator Labs system in place. Since pre- and post- project boiler run-time data was collected only for 3601 Kings Highway and Butler Hall, the boiler run-time analysis was completed only for these two buildings in this study.
• Room-temperature analysis. As a final check, the pre- and post-installation room-temperature data was used to confirm that the savings were from a drop-in temperature of the overheated rooms. Since pre- and post-project average room-temperature data was collected only for 3601 Kings Highway and Butler Hall, the room-temperature analysis was completed only for these two buildings in this study.
Due to inherent uncertainties in the methods, each had strengths and weaknesses. More emphasis was
placed on the first two methods, which were expected to yield the highest confidence in savings. Each
approach is discussed in greater detail in the following sections.
3.1 Billing Analysis
A billing analysis using natural gas or fuel oil deliveries during the pre- and post-installation periods was
used to determine whether the installation of Cozy units at all five buildings in this study resulted in an
actual decrease in energy consumption.
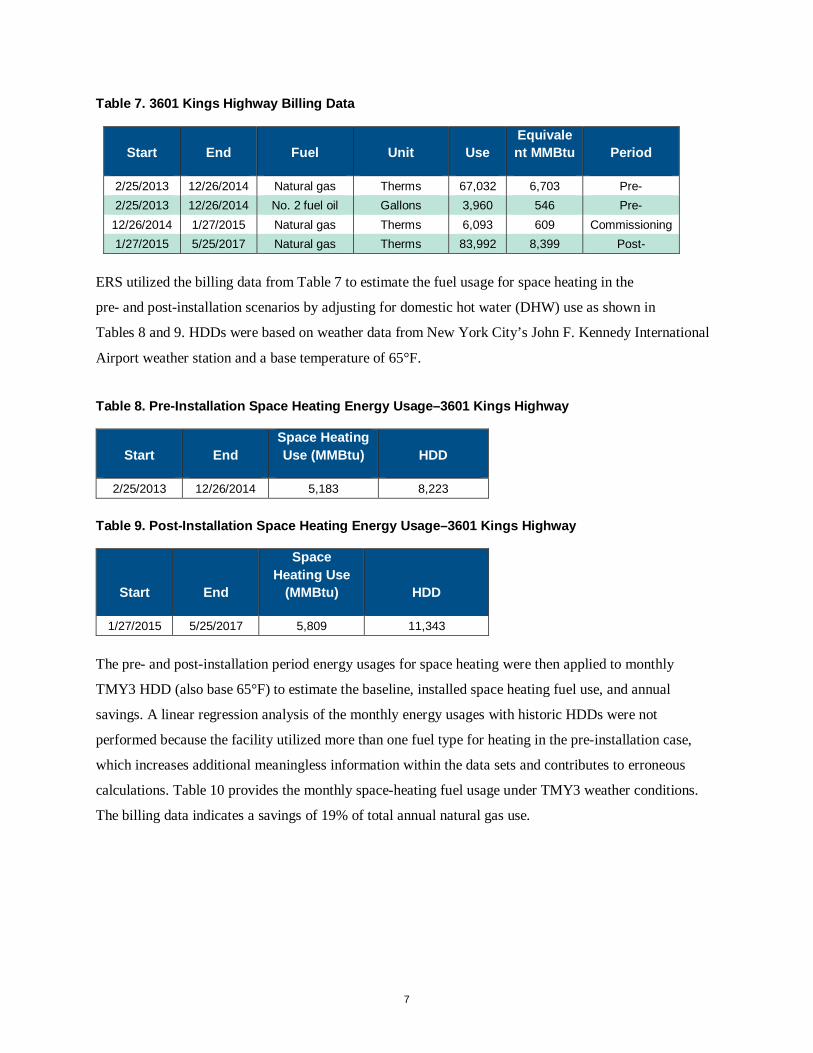
3.1.1 3601 Kings Highway
Data for fuel use during heating seasons from 2013 through 2017 for the 3601 Kings Highway facility
was obtained through billing data. Table 9 provides the billing data for gas use and fuel oil deliveries. The
facility has a dual-fired boiler, and billing data shows that both oil and natural gas were utilized by the
boiler for space heating during the analysis.
7
Table 7. 3601 Kings Highway Billing Data
Start End Fuel Unit Use Equivalent MMBtu Period
2/25/2013 12/26/2014 Natural gas Therms 67,032 6,703 Pre- 2/25/2013 12/26/2014 No. 2 fuel oil Gallons 3,960 546 Pre-
12/26/2014 1/27/2015 Natural gas Therms 6,093 609 Commissioning 1/27/2015 5/25/2017 Natural gas Therms 83,992 8,399 Post-
ERS utilized the billing data from Table 7 to estimate the fuel usage for space heating in the
pre- and post-installation scenarios by adjusting for domestic hot water (DHW) use as shown in
Tables 8 and 9. HDDs were based on weather data from New York City’s John F. Kennedy International
Airport weather station and a base temperature of 65°F.
Table 8. Pre-Installation Space Heating Energy Usage–3601 Kings Highway
Start End Space Heating Use (MMBtu) HDD
2/25/2013 12/26/2014 5,183 8,223
Table 9. Post-Installation Space Heating Energy Usage–3601 Kings Highway
Start End
Space Heating Use
(MMBtu) HDD
1/27/2015 5/25/2017 5,809 11,343
The pre- and post-installation period energy usages for space heating were then applied to monthly
TMY3 HDD (also base 65°F) to estimate the baseline, installed space heating fuel use, and annual
savings. A linear regression analysis of the monthly energy usages with historic HDDs were not
performed because the facility utilized more than one fuel type for heating in the pre-installation case,
which increases additional meaningless information within the data sets and contributes to erroneous
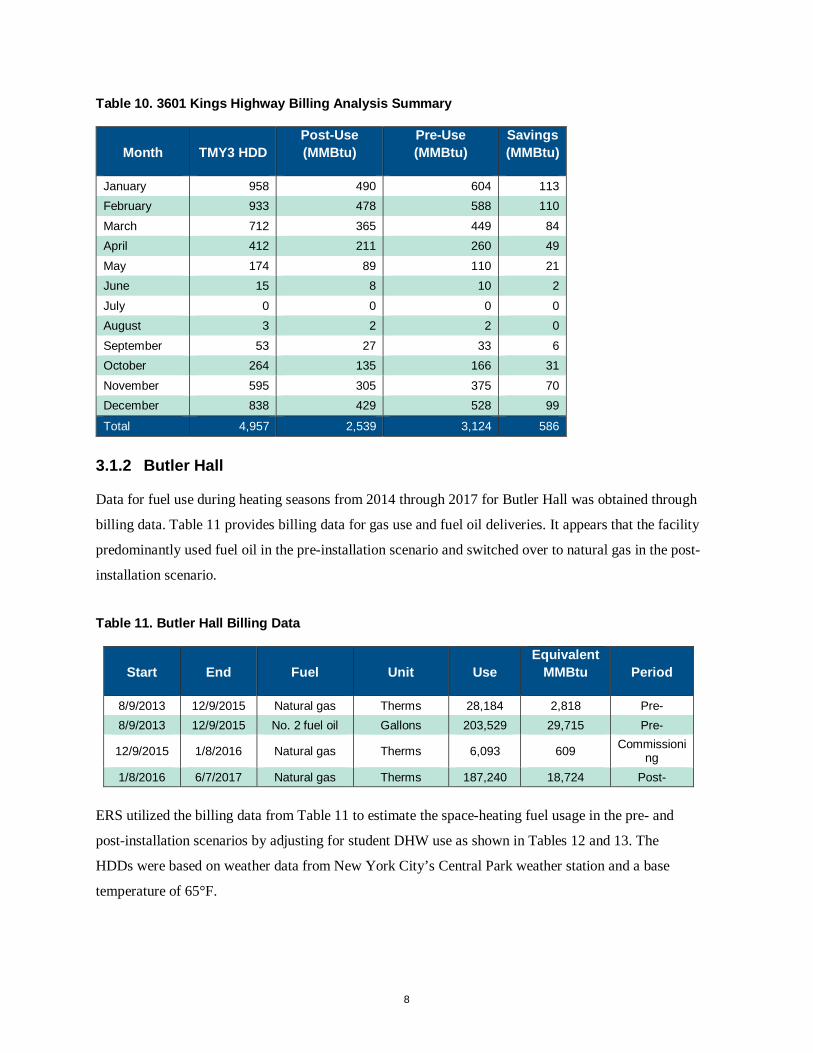
calculations. Table 10 provides the monthly space-heating fuel usage under TMY3 weather conditions.
The billing data indicates a savings of 19% of total annual natural gas use.
8
Table 10. 3601 Kings Highway Billing Analysis Summary
Month TMY3 HDD Post-Use (MMBtu)
Pre-Use (MMBtu)
Savings (MMBtu)
January 958 490 604 113 February 933 478 588 110 March 712 365 449 84 April 412 211 260 49 May 174 89 110 21 June 15 8 10 2 July 0 0 0 0 August 3 2 2 0 September 53 27 33 6 October 264 135 166 31 November 595 305 375 70 December 838 429 528 99
Total 4,957 2,539 3,124 586
3.1.2 Butler Hall
Data for fuel use during heating seasons from 2014 through 2017 for Butler Hall was obtained through
billing data. Table 11 provides billing data for gas use and fuel oil deliveries. It appears that the facility
predominantly used fuel oil in the pre-installation scenario and switched over to natural gas in the post-
installation scenario.
Table 11. Butler Hall Billing Data
Start End Fuel Unit Use Equivalent
MMBtu Period
8/9/2013 12/9/2015 Natural gas Therms 28,184 2,818 Pre- 8/9/2013 12/9/2015 No. 2 fuel oil Gallons 203,529 29,715 Pre-
12/9/2015 1/8/2016 Natural gas Therms 6,093 609 Commissioning
1/8/2016 6/7/2017 Natural gas Therms 187,240 18,724 Post-
ERS utilized the billing data from Table 11 to estimate the space-heating fuel usage in the pre- and
post-installation scenarios by adjusting for student DHW use as shown in Tables 12 and 13. The
HDDs were based on weather data from New York City’s Central Park weather station and a base
temperature of 65°F.
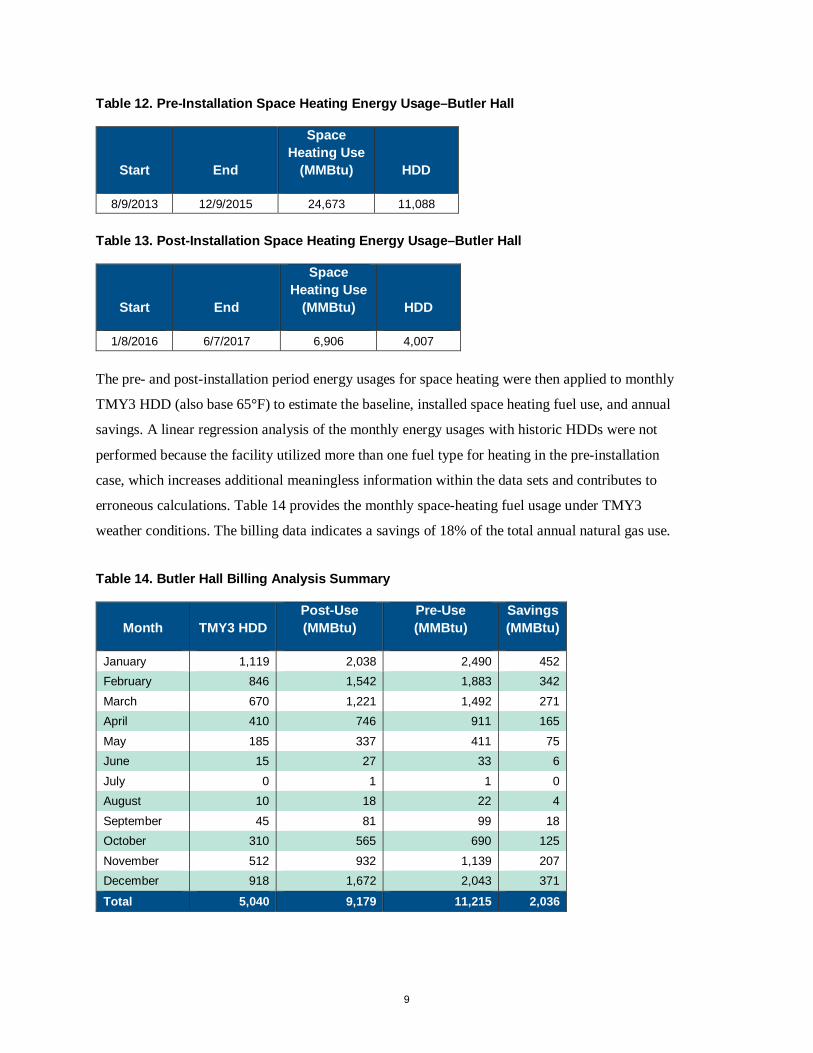
9
Table 12. Pre-Installation Space Heating Energy Usage–Butler Hall
Start End
Space Heating Use
(MMBtu) HDD
8/9/2013 12/9/2015 24,673 11,088
Table 13. Post-Installation Space Heating Energy Usage–Butler Hall
Start End
Space Heating Use
(MMBtu) HDD
1/8/2016 6/7/2017 6,906 4,007
The pre- and post-installation period energy usages for space heating were then applied to monthly
TMY3 HDD (also base 65°F) to estimate the baseline, installed space heating fuel use, and annual
savings. A linear regression analysis of the monthly energy usages with historic HDDs were not
performed because the facility utilized more than one fuel type for heating in the pre-installation
case, which increases additional meaningless information within the data sets and contributes to
erroneous calculations. Table 14 provides the monthly space-heating fuel usage under TMY3
weather conditions. The billing data indicates a savings of 18% of the total annual natural gas use.
Table 14. Butler Hall Billing Analysis Summary
Month TMY3 HDD Post-Use (MMBtu)
Pre-Use (MMBtu)
Savings (MMBtu)
January 1,119 2,038 2,490 452 February 846 1,542 1,883 342 March 670 1,221 1,492 271 April 410 746 911 165 May 185 337 411 75 June 15 27 33 6 July 0 1 1 0 August 10 18 22 4 September 45 81 99 18 October 310 565 690 125 November 512 932 1,139 207 December 918 1,672 2,043 371
Total 5,040 9,179 11,215 2,036
10
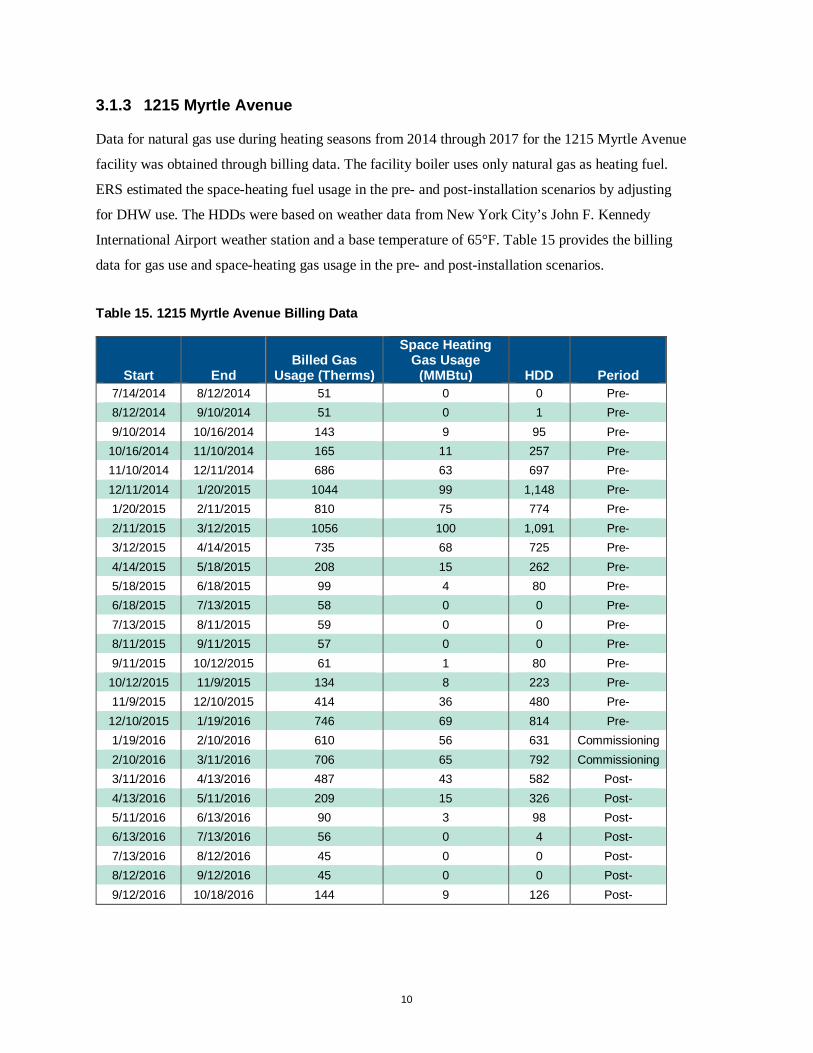
3.1.3 1215 Myrtle Avenue
Data for natural gas use during heating seasons from 2014 through 2017 for the 1215 Myrtle Avenue
facility was obtained through billing data. The facility boiler uses only natural gas as heating fuel.
ERS estimated the space-heating fuel usage in the pre- and post-installation scenarios by adjusting
for DHW use. The HDDs were based on weather data from New York City’s John F. Kennedy
International Airport weather station and a base temperature of 65°F. Table 15 provides the billing
data for gas use and space-heating gas usage in the pre- and post-installation scenarios.
Table 15. 1215 Myrtle Avenue Billing Data
Start End Billed Gas
Usage (Therms)
Space Heating Gas Usage
(MMBtu) HDD Period 7/14/2014 8/12/2014 51 0 0 Pre- 8/12/2014 9/10/2014 51 0 1 Pre- 9/10/2014 10/16/2014 143 9 95 Pre-
10/16/2014 11/10/2014 165 11 257 Pre- 11/10/2014 12/11/2014 686 63 697 Pre- 12/11/2014 1/20/2015 1044 99 1,148 Pre- 1/20/2015 2/11/2015 810 75 774 Pre- 2/11/2015 3/12/2015 1056 100 1,091 Pre- 3/12/2015 4/14/2015 735 68 725 Pre- 4/14/2015 5/18/2015 208 15 262 Pre- 5/18/2015 6/18/2015 99 4 80 Pre- 6/18/2015 7/13/2015 58 0 0 Pre- 7/13/2015 8/11/2015 59 0 0 Pre- 8/11/2015 9/11/2015 57 0 0 Pre- 9/11/2015 10/12/2015 61 1 80 Pre-
10/12/2015 11/9/2015 134 8 223 Pre- 11/9/2015 12/10/2015 414 36 480 Pre-
12/10/2015 1/19/2016 746 69 814 Pre- 1/19/2016 2/10/2016 610 56 631 Commissioning 2/10/2016 3/11/2016 706 65 792 Commissioning 3/11/2016 4/13/2016 487 43 582 Post- 4/13/2016 5/11/2016 209 15 326 Post- 5/11/2016 6/13/2016 90 3 98 Post- 6/13/2016 7/13/2016 56 0 4 Post- 7/13/2016 8/12/2016 45 0 0 Post- 8/12/2016 9/12/2016 45 0 0 Post- 9/12/2016 10/18/2016 144 9 126 Post-
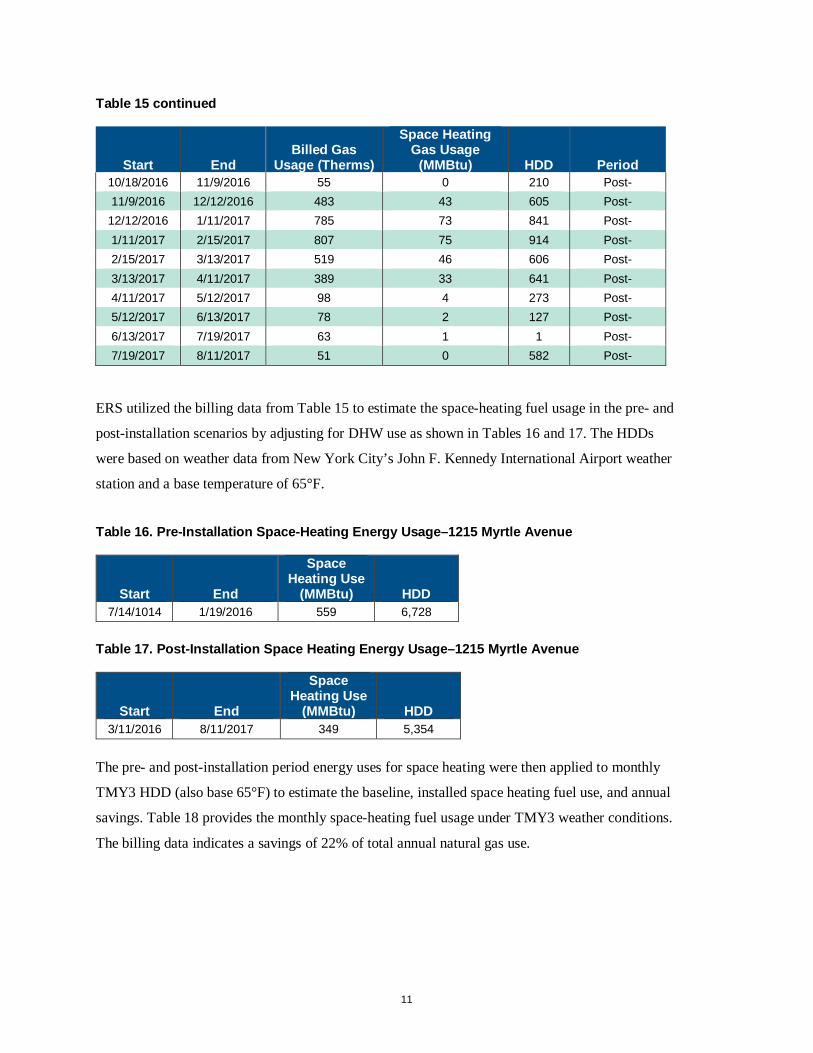
11
Table 15 continued
Start End Billed Gas
Usage (Therms)
Space Heating Gas Usage
(MMBtu) HDD Period 10/18/2016 11/9/2016 55 0 210 Post- 11/9/2016 12/12/2016 483 43 605 Post-
12/12/2016 1/11/2017 785 73 841 Post- 1/11/2017 2/15/2017 807 75 914 Post- 2/15/2017 3/13/2017 519 46 606 Post- 3/13/2017 4/11/2017 389 33 641 Post- 4/11/2017 5/12/2017 98 4 273 Post- 5/12/2017 6/13/2017 78 2 127 Post- 6/13/2017 7/19/2017 63 1 1 Post- 7/19/2017 8/11/2017 51 0 582 Post-
ERS utilized the billing data from Table 15 to estimate the space-heating fuel usage in the pre- and
post-installation scenarios by adjusting for DHW use as shown in Tables 16 and 17. The HDDs
were based on weather data from New York City’s John F. Kennedy International Airport weather
station and a base temperature of 65°F.
Table 16. Pre-Installation Space-Heating Energy Usage–1215 Myrtle Avenue
Start End
Space Heating Use
(MMBtu) HDD 7/14/1014 1/19/2016 559 6,728
Table 17. Post-Installation Space Heating Energy Usage–1215 Myrtle Avenue
Start End
Space Heating Use
(MMBtu) HDD 3/11/2016 8/11/2017 349 5,354
The pre- and post-installation period energy uses for space heating were then applied to monthly
TMY3 HDD (also base 65°F) to estimate the baseline, installed space heating fuel use, and annual
savings. Table 18 provides the monthly space-heating fuel usage under TMY3 weather conditions.
The billing data indicates a savings of 22% of total annual natural gas use.
12
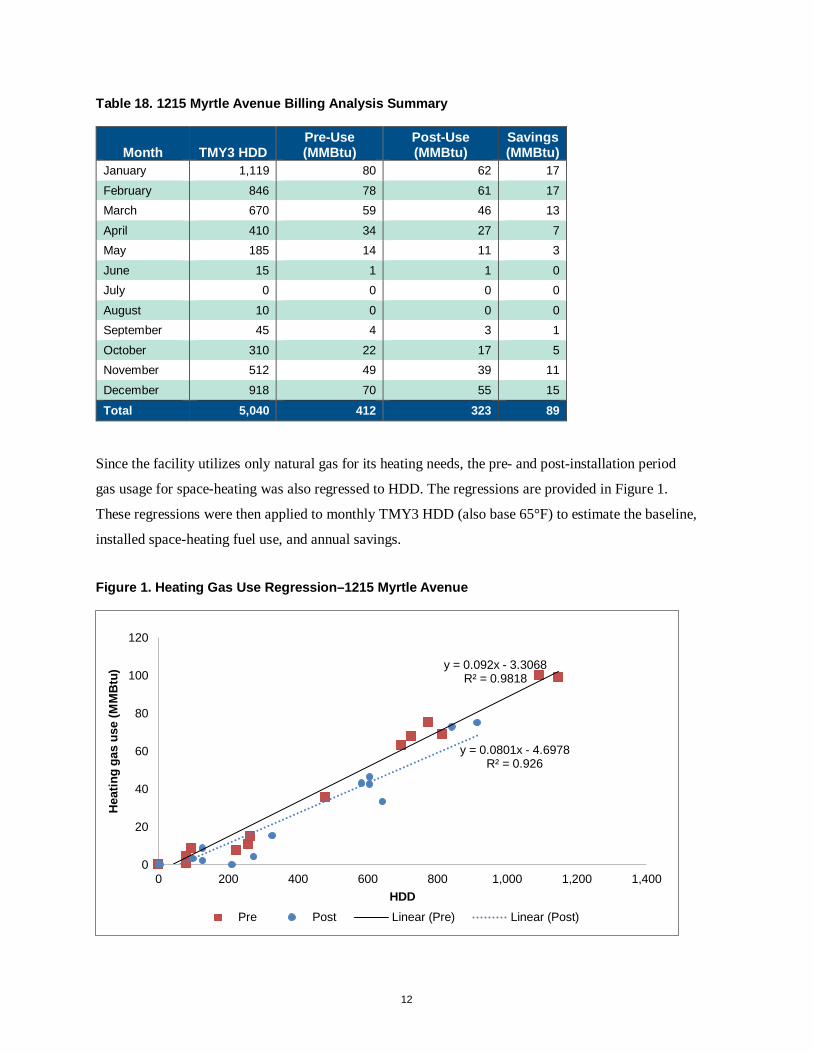
Table 18. 1215 Myrtle Avenue Billing Analysis Summary
Month TMY3 HDD Pre-Use (MMBtu)
Post-Use (MMBtu)
Savings (MMBtu)
January 1,119 80 62 17 February 846 78 61 17 March 670 59 46 13 April 410 34 27 7 May 185 14 11 3 June 15 1 1 0 July 0 0 0 0 August 10 0 0 0 September 45 4 3 1 October 310 22 17 5 November 512 49 39 11 December 918 70 55 15 Total 5,040 412 323 89
Since the facility utilizes only natural gas for its heating needs, the pre- and post-installation period
gas usage for space-heating was also regressed to HDD. The regressions are provided in Figure 1.
These regressions were then applied to monthly TMY3 HDD (also base 65°F) to estimate the baseline,
installed space-heating fuel use, and annual savings.
Figure 1. Heating Gas Use Regression–1215 Myrtle Avenue
y = 0.092x - 3.3068R² = 0.9818
y = 0.0801x - 4.6978R² = 0.926
0
20
40
60
80
100
120
0 200 400 600 800 1,000 1,200 1,400
Heat
ing
gas
use
(MM
Btu)
HDDPre Post Linear (Pre) Linear (Post)
13
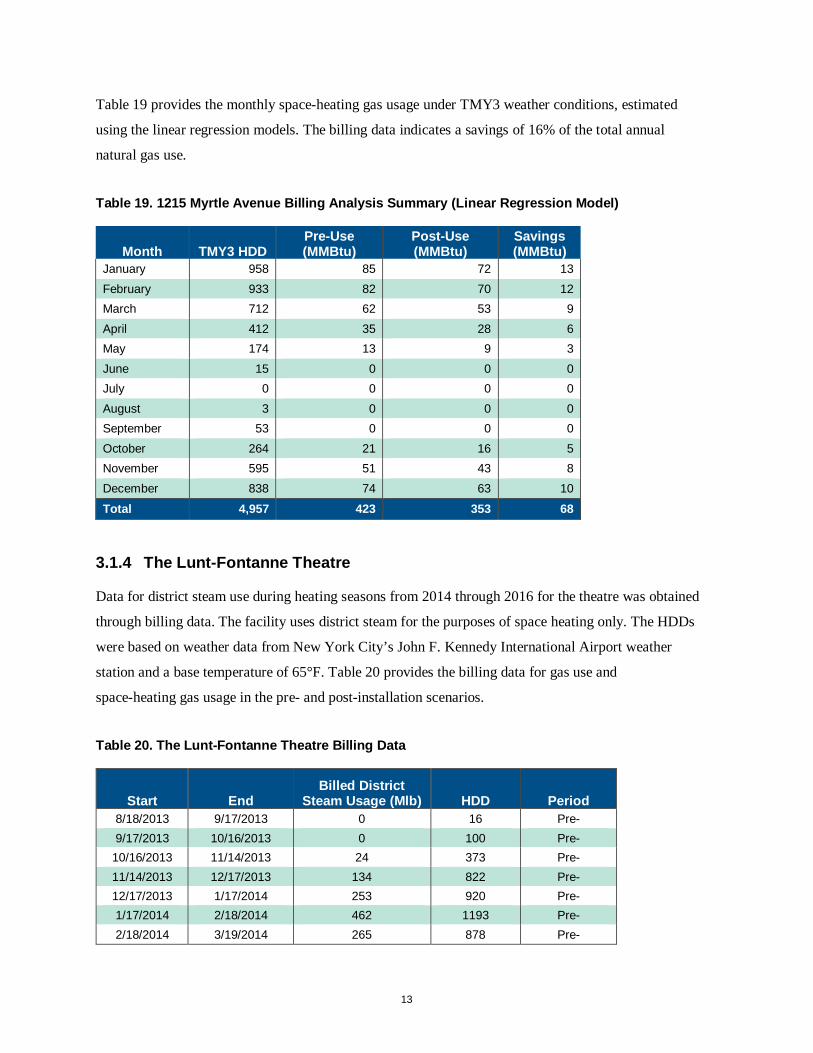
Table 19 provides the monthly space-heating gas usage under TMY3 weather conditions, estimated
using the linear regression models. The billing data indicates a savings of 16% of the total annual
natural gas use.
Table 19. 1215 Myrtle Avenue Billing Analysis Summary (Linear Regression Model)
Month TMY3 HDD Pre-Use (MMBtu)
Post-Use (MMBtu)
Savings (MMBtu)
January 958 85 72 13 February 933 82 70 12 March 712 62 53 9 April 412 35 28 6 May 174 13 9 3 June 15 0 0 0 July 0 0 0 0 August 3 0 0 0 September 53 0 0 0 October 264 21 16 5 November 595 51 43 8 December 838 74 63 10 Total 4,957 423 353 68
3.1.4 The Lunt-Fontanne Theatre
Data for district steam use during heating seasons from 2014 through 2016 for the theatre was obtained
through billing data. The facility uses district steam for the purposes of space heating only. The HDDs
were based on weather data from New York City’s John F. Kennedy International Airport weather
station and a base temperature of 65°F. Table 20 provides the billing data for gas use and
space-heating gas usage in the pre- and post-installation scenarios.
Table 20. The Lunt-Fontanne Theatre Billing Data
Start End Billed District
Steam Usage (Mlb) HDD Period 8/18/2013 9/17/2013 0 16 Pre- 9/17/2013 10/16/2013 0 100 Pre-
10/16/2013 11/14/2013 24 373 Pre- 11/14/2013 12/17/2013 134 822 Pre- 12/17/2013 1/17/2014 253 920 Pre- 1/17/2014 2/18/2014 462 1193 Pre- 2/18/2014 3/19/2014 265 878 Pre-
14
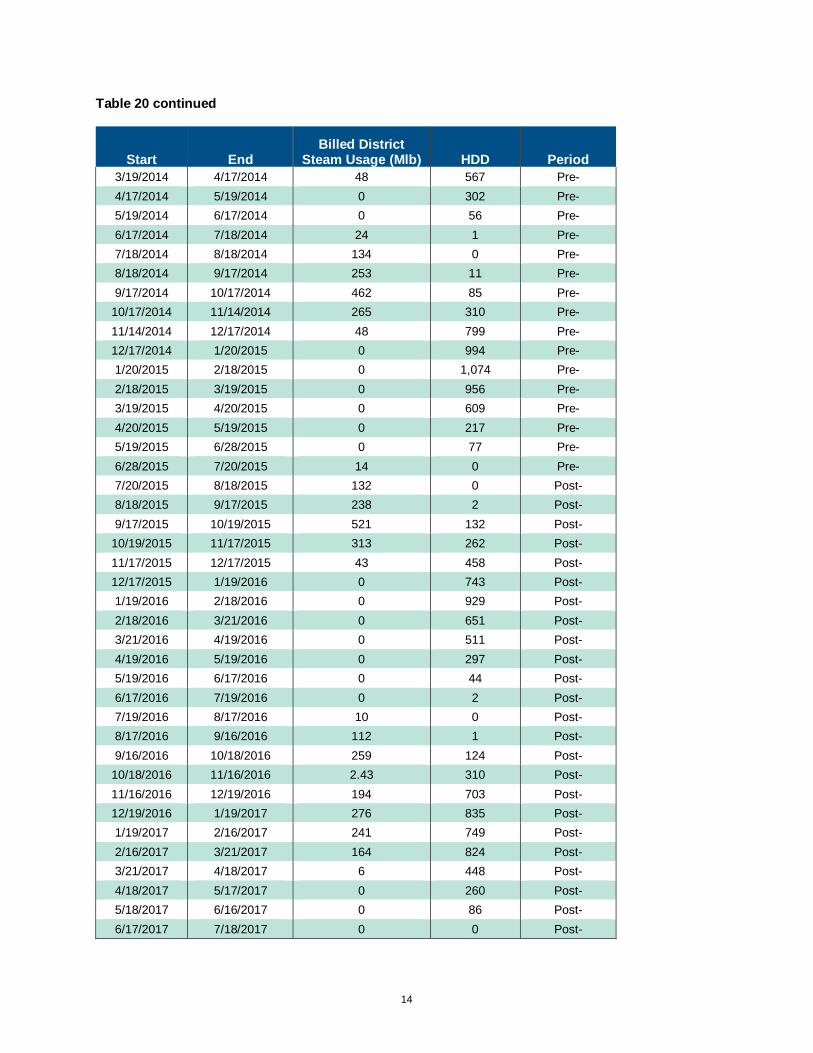
Table 20 continued
Start End Billed District
Steam Usage (Mlb) HDD Period 3/19/2014 4/17/2014 48 567 Pre- 4/17/2014 5/19/2014 0 302 Pre- 5/19/2014 6/17/2014 0 56 Pre- 6/17/2014 7/18/2014 24 1 Pre- 7/18/2014 8/18/2014 134 0 Pre- 8/18/2014 9/17/2014 253 11 Pre- 9/17/2014 10/17/2014 462 85 Pre-
10/17/2014 11/14/2014 265 310 Pre- 11/14/2014 12/17/2014 48 799 Pre- 12/17/2014 1/20/2015 0 994 Pre- 1/20/2015 2/18/2015 0 1,074 Pre- 2/18/2015 3/19/2015 0 956 Pre- 3/19/2015 4/20/2015 0 609 Pre- 4/20/2015 5/19/2015 0 217 Pre- 5/19/2015 6/28/2015 0 77 Pre- 6/28/2015 7/20/2015 14 0 Pre- 7/20/2015 8/18/2015 132 0 Post- 8/18/2015 9/17/2015 238 2 Post- 9/17/2015 10/19/2015 521 132 Post-
10/19/2015 11/17/2015 313 262 Post- 11/17/2015 12/17/2015 43 458 Post- 12/17/2015 1/19/2016 0 743 Post- 1/19/2016 2/18/2016 0 929 Post- 2/18/2016 3/21/2016 0 651 Post- 3/21/2016 4/19/2016 0 511 Post- 4/19/2016 5/19/2016 0 297 Post- 5/19/2016 6/17/2016 0 44 Post- 6/17/2016 7/19/2016 0 2 Post- 7/19/2016 8/17/2016 10 0 Post- 8/17/2016 9/16/2016 112 1 Post- 9/16/2016 10/18/2016 259 124 Post-
10/18/2016 11/16/2016 2.43 310 Post- 11/16/2016 12/19/2016 194 703 Post- 12/19/2016 1/19/2017 276 835 Post- 1/19/2017 2/16/2017 241 749 Post- 2/16/2017 3/21/2017 164 824 Post- 3/21/2017 4/18/2017 6 448 Post- 4/18/2017 5/17/2017 0 260 Post- 5/18/2017 6/16/2017 0 86 Post- 6/17/2017 7/18/2017 0 0 Post-
15
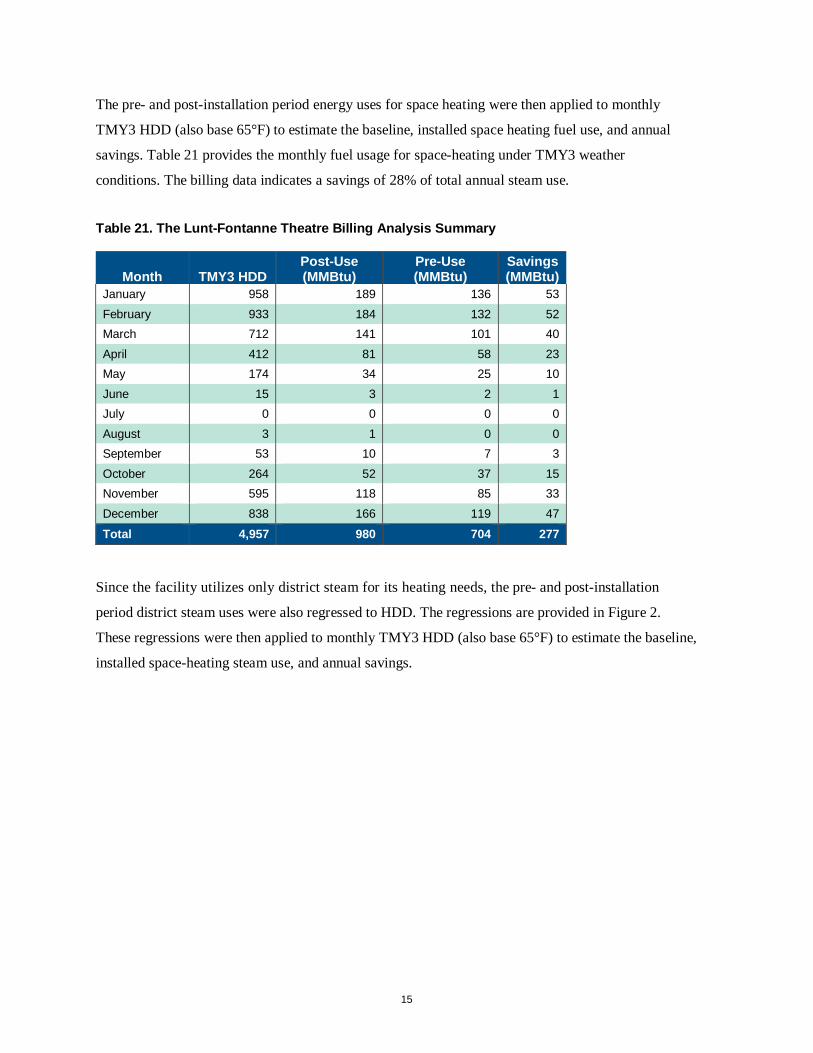
The pre- and post-installation period energy uses for space heating were then applied to monthly
TMY3 HDD (also base 65°F) to estimate the baseline, installed space heating fuel use, and annual
savings. Table 21 provides the monthly fuel usage for space-heating under TMY3 weather
conditions. The billing data indicates a savings of 28% of total annual steam use.
Table 21. The Lunt-Fontanne Theatre Billing Analysis Summary
Month TMY3 HDD Post-Use (MMBtu)
Pre-Use (MMBtu)
Savings (MMBtu)
January 958 189 136 53 February 933 184 132 52 March 712 141 101 40 April 412 81 58 23 May 174 34 25 10 June 15 3 2 1 July 0 0 0 0 August 3 1 0 0 September 53 10 7 3 October 264 52 37 15 November 595 118 85 33 December 838 166 119 47 Total 4,957 980 704 277
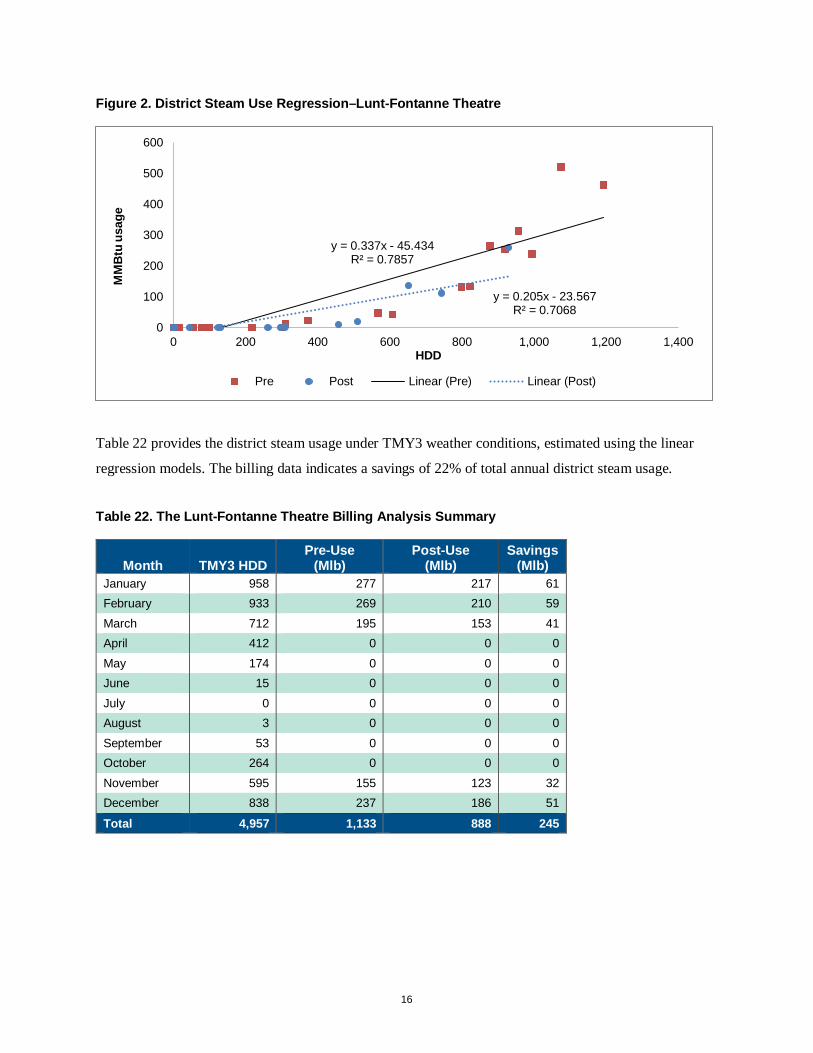
Since the facility utilizes only district steam for its heating needs, the pre- and post-installation
period district steam uses were also regressed to HDD. The regressions are provided in Figure 2.
These regressions were then applied to monthly TMY3 HDD (also base 65°F) to estimate the baseline,
installed space-heating steam use, and annual savings.
16
Figure 2. District Steam Use Regression–Lunt-Fontanne Theatre
Table 22 provides the district steam usage under TMY3 weather conditions, estimated using the linear
regression models. The billing data indicates a savings of 22% of total annual district steam usage.
Table 22. The Lunt-Fontanne Theatre Billing Analysis Summary
Month TMY3 HDD Pre-Use
(Mlb) Post-Use
(Mlb) Savings
(Mlb) January 958 277 217 61 February 933 269 210 59 March 712 195 153 41 April 412 0 0 0 May 174 0 0 0 June 15 0 0 0 July 0 0 0 0 August 3 0 0 0 September 53 0 0 0 October 264 0 0 0 November 595 155 123 32 December 838 237 186 51
Total 4,957 1,133 888 245
y = 0.337x - 45.434R² = 0.7857
y = 0.205x - 23.567R² = 0.7068
0
100
200
300
400
500
600
0 200 400 600 800 1,000 1,200 1,400
MM
Btu
usag
e
HDD
Pre Post Linear (Pre) Linear (Post)
17
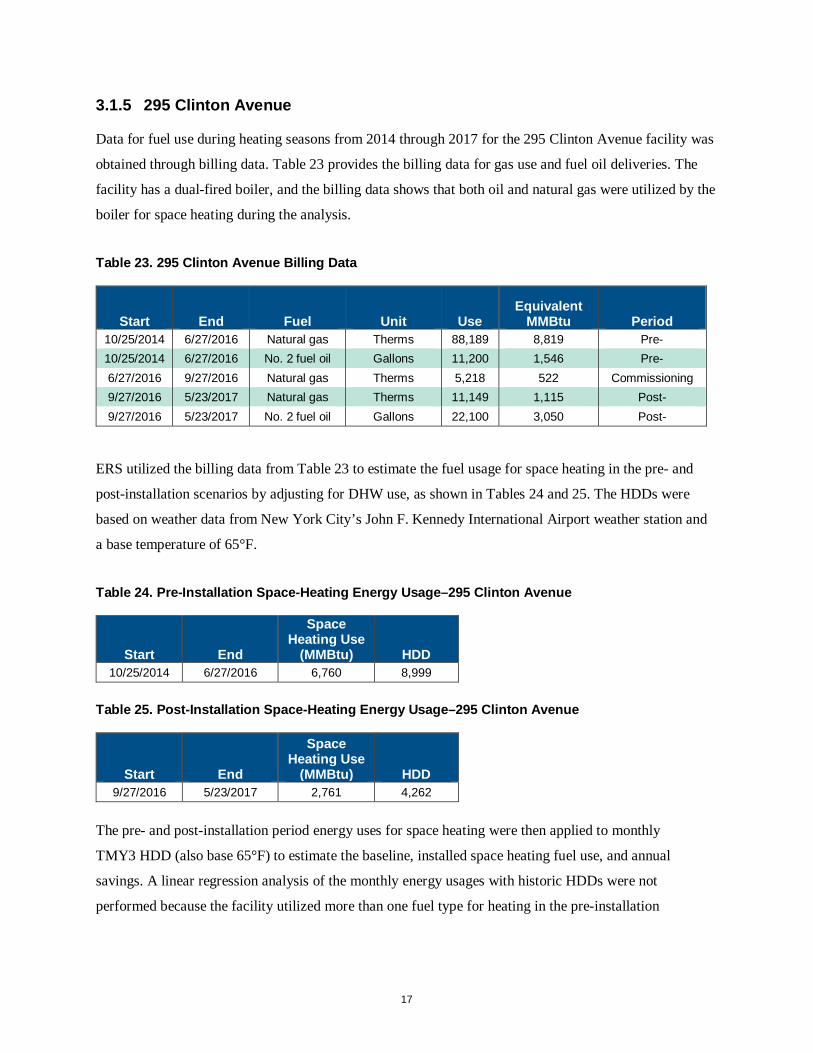
3.1.5 295 Clinton Avenue
Data for fuel use during heating seasons from 2014 through 2017 for the 295 Clinton Avenue facility was
obtained through billing data. Table 23 provides the billing data for gas use and fuel oil deliveries. The
facility has a dual-fired boiler, and the billing data shows that both oil and natural gas were utilized by the
boiler for space heating during the analysis.
Table 23. 295 Clinton Avenue Billing Data
Start End Fuel Unit Use Equivalent
MMBtu Period 10/25/2014 6/27/2016 Natural gas Therms 88,189 8,819 Pre- 10/25/2014 6/27/2016 No. 2 fuel oil Gallons 11,200 1,546 Pre- 6/27/2016 9/27/2016 Natural gas Therms 5,218 522 Commissioning 9/27/2016 5/23/2017 Natural gas Therms 11,149 1,115 Post- 9/27/2016 5/23/2017 No. 2 fuel oil Gallons 22,100 3,050 Post-
ERS utilized the billing data from Table 23 to estimate the fuel usage for space heating in the pre- and
post-installation scenarios by adjusting for DHW use, as shown in Tables 24 and 25. The HDDs were
based on weather data from New York City’s John F. Kennedy International Airport weather station and
a base temperature of 65°F.
Table 24. Pre-Installation Space-Heating Energy Usage–295 Clinton Avenue
Start End
Space Heating Use
(MMBtu) HDD 10/25/2014 6/27/2016 6,760 8,999
Table 25. Post-Installation Space-Heating Energy Usage–295 Clinton Avenue
Start End
Space Heating Use
(MMBtu) HDD 9/27/2016 5/23/2017 2,761 4,262
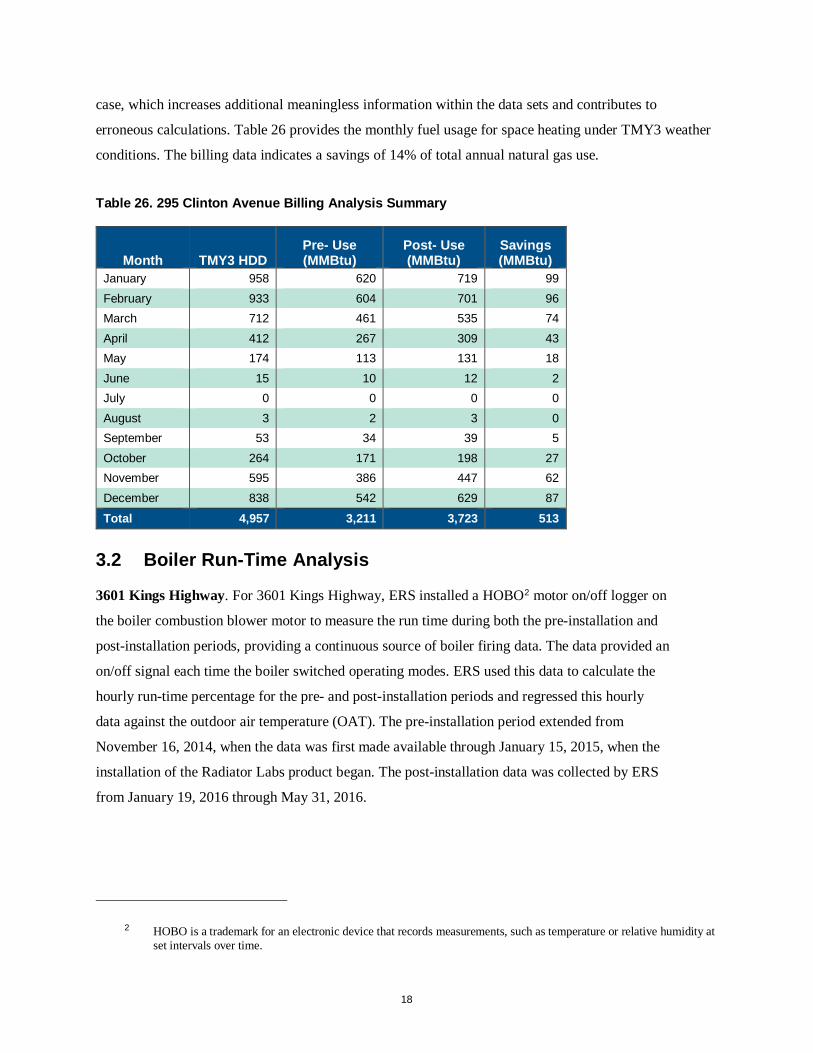
The pre- and post-installation period energy uses for space heating were then applied to monthly
TMY3 HDD (also base 65°F) to estimate the baseline, installed space heating fuel use, and annual
savings. A linear regression analysis of the monthly energy usages with historic HDDs were not
performed because the facility utilized more than one fuel type for heating in the pre-installation
18
case, which increases additional meaningless information within the data sets and contributes to
erroneous calculations. Table 26 provides the monthly fuel usage for space heating under TMY3 weather
conditions. The billing data indicates a savings of 14% of total annual natural gas use.
Table 26. 295 Clinton Avenue Billing Analysis Summary
Month TMY3 HDD Pre- Use (MMBtu)
Post- Use (MMBtu)
Savings (MMBtu)
January 958 620 719 99 February 933 604 701 96 March 712 461 535 74 April 412 267 309 43 May 174 113 131 18 June 15 10 12 2 July 0 0 0 0 August 3 2 3 0 September 53 34 39 5 October 264 171 198 27 November 595 386 447 62 December 838 542 629 87 Total 4,957 3,211 3,723 513
3.2 Boiler Run-Time Analysis
3601 Kings Highway. For 3601 Kings Highway, ERS installed a HOBO2 motor on/off logger on
the boiler combustion blower motor to measure the run time during both the pre-installation and
post-installation periods, providing a continuous source of boiler firing data. The data provided an
on/off signal each time the boiler switched operating modes. ERS used this data to calculate the
hourly run-time percentage for the pre- and post-installation periods and regressed this hourly
data against the outdoor air temperature (OAT). The pre-installation period extended from
November 16, 2014, when the data was first made available through January 15, 2015, when the
installation of the Radiator Labs product began. The post-installation data was collected by ERS
from January 19, 2016 through May 31, 2016.
2 HOBO is a trademark for an electronic device that records measurements, such as temperature or relative humidity at set intervals over time.
19
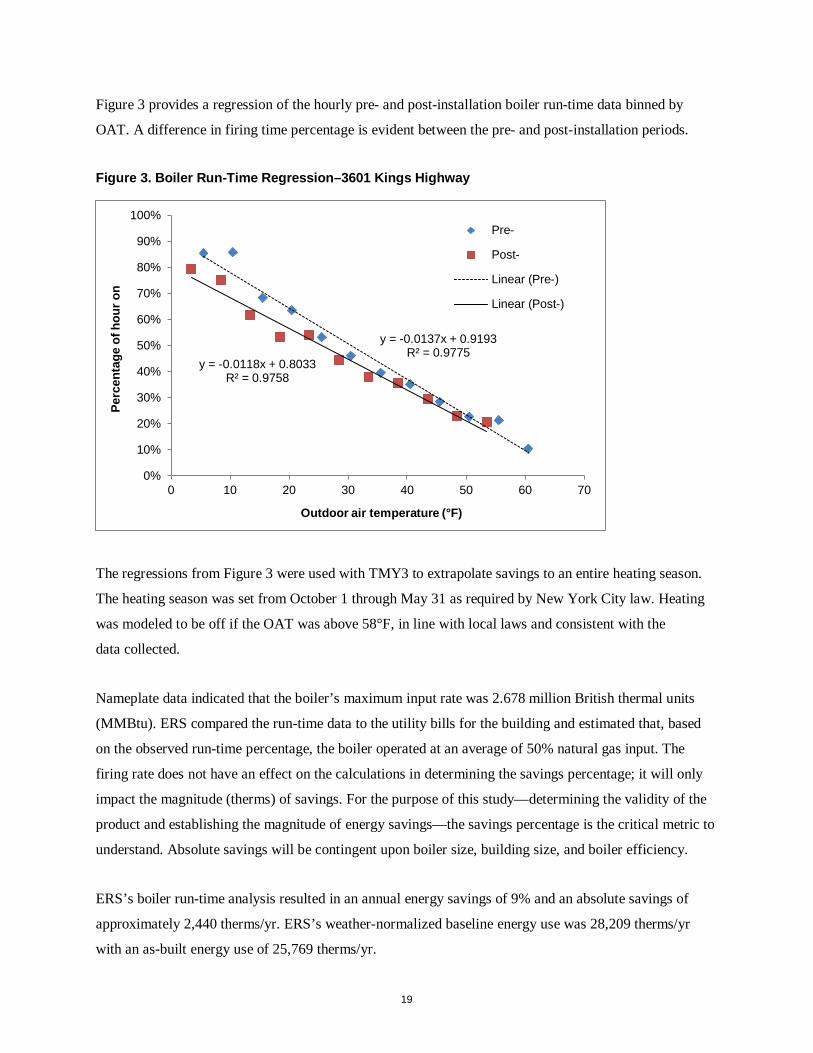
Figure 3 provides a regression of the hourly pre- and post-installation boiler run-time data binned by
OAT. A difference in firing time percentage is evident between the pre- and post-installation periods.
Figure 3. Boiler Run-Time Regression–3601 Kings Highway
The regressions from Figure 3 were used with TMY3 to extrapolate savings to an entire heating season.
The heating season was set from October 1 through May 31 as required by New York City law. Heating
was modeled to be off if the OAT was above 58°F, in line with local laws and consistent with the
data collected.
Nameplate data indicated that the boiler’s maximum input rate was 2.678 million British thermal units
(MMBtu). ERS compared the run-time data to the utility bills for the building and estimated that, based
on the observed run-time percentage, the boiler operated at an average of 50% natural gas input. The
firing rate does not have an effect on the calculations in determining the savings percentage; it will only
impact the magnitude (therms) of savings. For the purpose of this study—determining the validity of the
product and establishing the magnitude of energy savings—the savings percentage is the critical metric to
understand. Absolute savings will be contingent upon boiler size, building size, and boiler efficiency.
ERS’s boiler run-time analysis resulted in an annual energy savings of 9% and an absolute savings of
approximately 2,440 therms/yr. ERS’s weather-normalized baseline energy use was 28,209 therms/yr
with an as-built energy use of 25,769 therms/yr.
y = -0.0137x + 0.9193R² = 0.9775
y = -0.0118x + 0.8033R² = 0.9758
0%
10%
20%
30%
40%
50%
60%
70%
80%
90%
100%
0 10 20 30 40 50 60 70
Perc
enta
ge o
f hou
r on
Outdoor air temperature (°F)
Pre-
Post-
Linear (Pre-)
Linear (Post-)
20
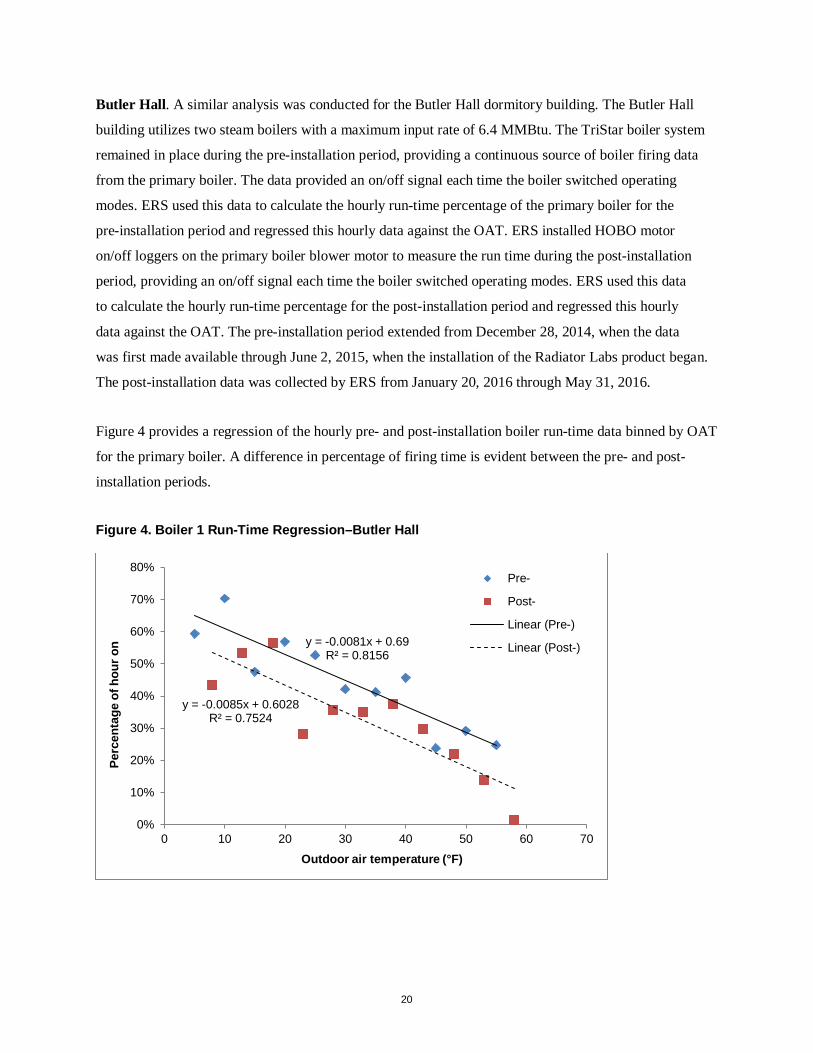
Butler Hall. A similar analysis was conducted for the Butler Hall dormitory building. The Butler Hall
building utilizes two steam boilers with a maximum input rate of 6.4 MMBtu. The TriStar boiler system
remained in place during the pre-installation period, providing a continuous source of boiler firing data
from the primary boiler. The data provided an on/off signal each time the boiler switched operating
modes. ERS used this data to calculate the hourly run-time percentage of the primary boiler for the
pre-installation period and regressed this hourly data against the OAT. ERS installed HOBO motor
on/off loggers on the primary boiler blower motor to measure the run time during the post-installation
period, providing an on/off signal each time the boiler switched operating modes. ERS used this data
to calculate the hourly run-time percentage for the post-installation period and regressed this hourly
data against the OAT. The pre-installation period extended from December 28, 2014, when the data
was first made available through June 2, 2015, when the installation of the Radiator Labs product began.
The post-installation data was collected by ERS from January 20, 2016 through May 31, 2016.
Figure 4 provides a regression of the hourly pre- and post-installation boiler run-time data binned by OAT
for the primary boiler. A difference in percentage of firing time is evident between the pre- and post-
installation periods.
Figure 4. Boiler 1 Run-Time Regression–Butler Hall
y = -0.0081x + 0.69R² = 0.8156
y = -0.0085x + 0.6028R² = 0.7524
0%
10%
20%
30%
40%
50%
60%
70%
80%
0 10 20 30 40 50 60 70
Perc
enta
ge o
f hou
r on
Outdoor air temperature (°F)
Pre-
Post-
Linear (Pre-)
Linear (Post-)
21
The regressions from Figure 4 above were used with TMY3 data to extrapolate savings to an entire
heating season. The heating season was set from October 1 through May 31 as required by New York
City law. Heating was modeled to be off if the OAT was above 58°F, in line with local laws and
consistent with the data collected. The system was also modeled to be off after May 16 when the
students moved out. The savings resulting from the run-time reduction of boiler 1 was extrapolated to
boiler 2 as well, to estimate the energy savings for space heating resulting from project installation.
ERS compared the run-time data to the utility bills for the building and estimated that, based on the
observed run-time percentage, the boilers operated at an average of 45% natural gas input. ERS’s boiler
run-time analysis resulted in an annual energy savings of 27% and an absolute savings of approximately
28,725 therms/yr. ERS’s weather-normalized baseline energy use was 106,061 therms/yr with an as-built
energy use of 77,336 therms/yr.
3.3 Room-Temperature Analysis
Although the boiler run time and billing analysis clearly show a decrease in energy usage, conducting
a room-temperature analysis traces the energy savings back to the source. ERS’s understanding is
that the installation of a Cozy on each radiator is the only change that has been made to the radiator
and room-temperature controls. Therefore, if the average temperature of the building is lower, it
indicates that the visible drop in energy use was a result of the installed Cozy units’ impact on
room-temperature control.
Of the three methods of analysis, estimating the energy savings using the room-temperature data is the
least certain analysis method. Energy loss from the building is highly dependent on the insulating value
of the building shell (walls and roof) and infiltration rates. Both parameters are difficult to measure
precisely. Adding further uncertainty to the analysis is occupancy behavior. Resident surveys conducted
by Radiator Labs indicate that many residents prior to the survey opened their windows to alleviate
overheating. Open windows would greatly increase the ventilation rate of the building and would impact
the observed room temperatures. Therefore, given the quality of the data collected and consistent results
of the billing analysis and boiler run-time analysis, the room-temperature analysis was used only to
qualitatively demonstrate the reduction in space temperature control and the reduced heating load.
22
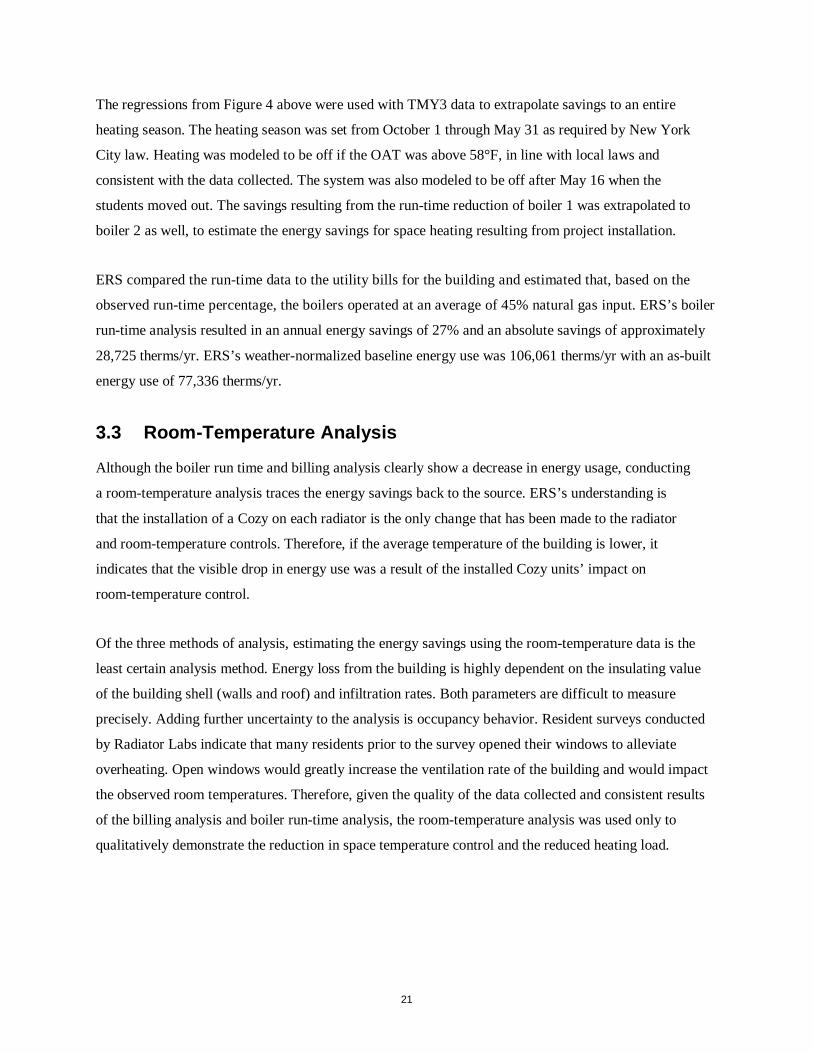
3601 Kings Highway. ERS installed HOBO temperature loggers in seven rooms to collect baseline
and post-case data. Baseline data was collected for three months, while post-installation case data was
collected for four months. The average temperature without the Cozy system was 77.0°F, while with the
Cozy system installed the average room temperatures dropped to 73.0°F, a drop of 4°F. Figure 5 shows
the average room temperature for the building during both the pre- and post-installation periods. Baseline
temperatures ranged from 62°F to 86°F. With the Cozy system installed, temperatures consistently ranged
between 66°F and 77°F, with most temperatures below 75°F.
Figure 5. Average Room Temperature–3601 Kings Highway
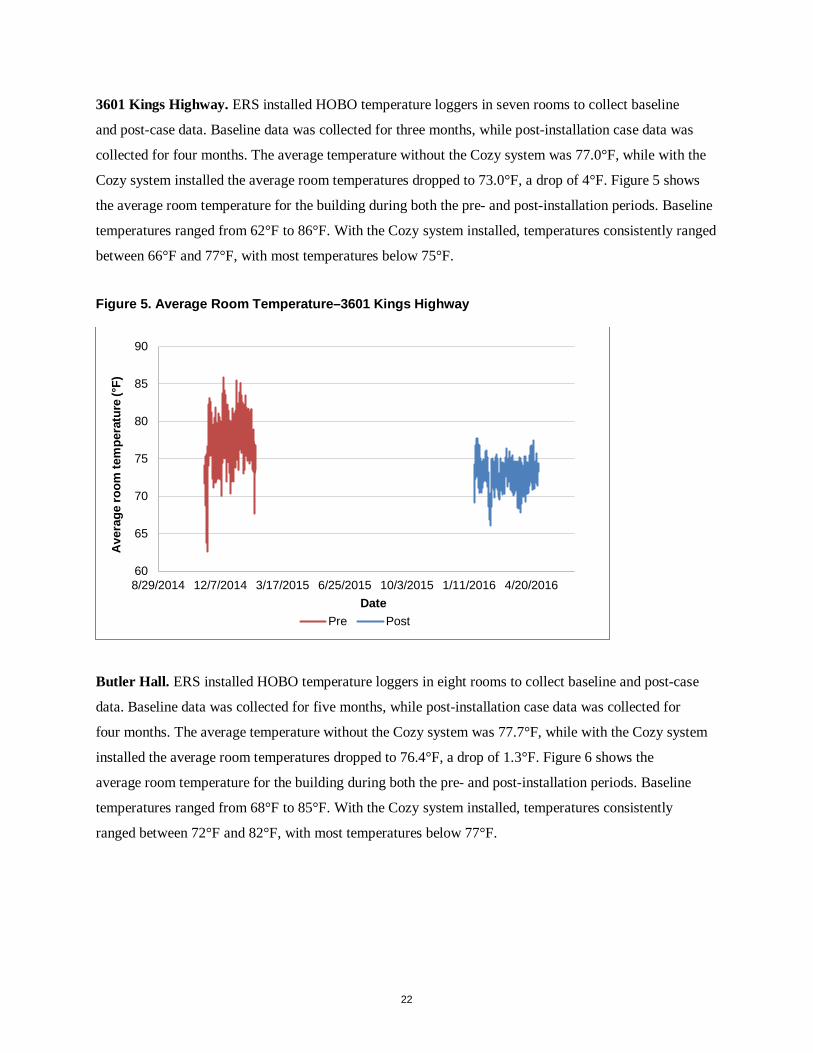
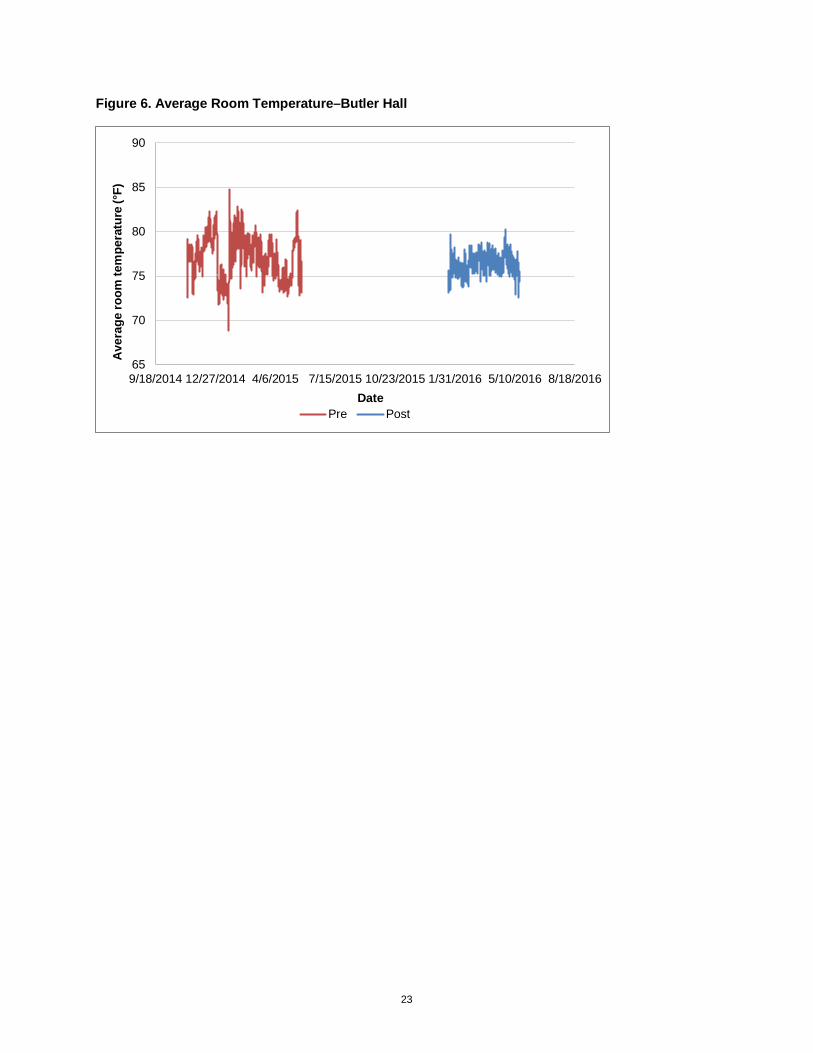
Butler Hall. ERS installed HOBO temperature loggers in eight rooms to collect baseline and post-case
data. Baseline data was collected for five months, while post-installation case data was collected for
four months. The average temperature without the Cozy system was 77.7°F, while with the Cozy system
installed the average room temperatures dropped to 76.4°F, a drop of 1.3°F. Figure 6 shows the
average room temperature for the building during both the pre- and post-installation periods. Baseline
temperatures ranged from 68°F to 85°F. With the Cozy system installed, temperatures consistently
ranged between 72°F and 82°F, with most temperatures below 77°F.
60
65
70
75
80
85
90
8/29/2014 12/7/2014 3/17/2015 6/25/2015 10/3/2015 1/11/2016 4/20/2016
Aver
age
room
tem
pera
ture
(°F)
DatePre Post
23
Figure 6. Average Room Temperature–Butler Hall
65
70
75
80
85
90
9/18/2014 12/27/2014 4/6/2015 7/15/2015 10/23/2015 1/31/2016 5/10/2016 8/18/2016
Aver
age
room
tem
pera
ture
(°F)
DatePre Post
24
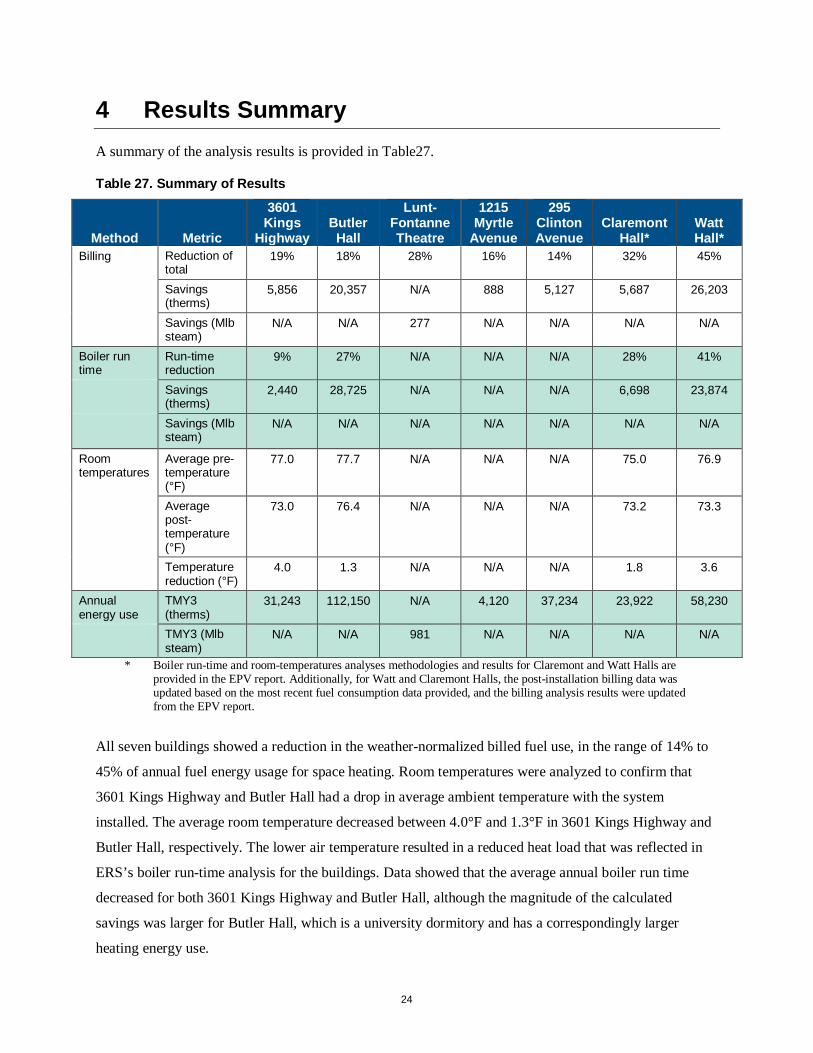
4 Results Summary A summary of the analysis results is provided in Table27.
Table 27. Summary of Results
Method Metric
3601 Kings
Highway Butler Hall
Lunt-Fontanne Theatre
1215 Myrtle
Avenue
295 Clinton Avenue
Claremont Hall*
Watt Hall*
Billing Reduction of total
19% 18% 28% 16% 14% 32% 45%
Savings (therms)
5,856 20,357 N/A 888 5,127 5,687 26,203
Savings (Mlb steam)
N/A N/A 277 N/A N/A N/A N/A
Boiler run time
Run-time reduction
9% 27% N/A N/A N/A 28% 41%
Savings (therms)
2,440 28,725 N/A N/A N/A 6,698 23,874
Savings (Mlb steam)
N/A N/A N/A N/A N/A N/A N/A
Room temperatures
Average pre- temperature (°F)
77.0 77.7 N/A N/A N/A 75.0 76.9
Average post- temperature (°F)
73.0 76.4 N/A N/A N/A 73.2 73.3
Temperature reduction (°F)
4.0 1.3 N/A N/A N/A 1.8 3.6
Annual energy use
TMY3 (therms)
31,243 112,150 N/A 4,120 37,234 23,922 58,230
TMY3 (Mlb steam)
N/A N/A 981 N/A N/A N/A N/A
* Boiler run-time and room-temperatures analyses methodologies and results for Claremont and Watt Halls are provided in the EPV report. Additionally, for Watt and Claremont Halls, the post-installation billing data was updated based on the most recent fuel consumption data provided, and the billing analysis results were updated from the EPV report.
All seven buildings showed a reduction in the weather-normalized billed fuel use, in the range of 14% to
45% of annual fuel energy usage for space heating. Room temperatures were analyzed to confirm that
3601 Kings Highway and Butler Hall had a drop in average ambient temperature with the system
installed. The average room temperature decreased between 4.0°F and 1.3°F in 3601 Kings Highway and
Butler Hall, respectively. The lower air temperature resulted in a reduced heat load that was reflected in
ERS’s boiler run-time analysis for the buildings. Data showed that the average annual boiler run time
decreased for both 3601 Kings Highway and Butler Hall, although the magnitude of the calculated
savings was larger for Butler Hall, which is a university dormitory and has a correspondingly larger
heating energy use.

NYSERDA, a public benefit corporation, offers objective information and analysis, innovative programs, technical expertise, and support to help New Yorkers increase energy efficiency, save money, use renewable energy, and reduce reliance on fossil fuels. NYSERDA professionals work to protect the environment and create clean-energy jobs. NYSERDA has been developing partnerships to advance innovative energy solutions in New York State since 1975.
To learn more about NYSERDA’s programs and funding opportunities,
visit nyserda.ny.gov or follow us on Twitter, Facebook, YouTube, or
Instagram.
New York State Energy Research and
Development Authority
17 Columbia CircleAlbany, NY 12203-6399
toll free: 866-NYSERDAlocal: 518-862-1090fax: 518-862-1091

State of New York Andrew M. Cuomo, Governor
New York State Energy Research and Development AuthorityRichard L. Kauffman, Chair | Alicia Barton, President and CEO