› files › pdf › disadvantage-behaviour... · disadvantage, behaviour and cognitive...
TRANSCRIPT
HAROON CHOWDRY AND TOM MCBRIDE
DISADVANTAGE, BEHAVIOUR AND COGNITIVE OUTCOMES
LONGITUDINAL ANALYSIS FROM AGE 5 TO 16

Disadvantage, behaviour and cognitive outcomes: Longitudinal analysis from age 5 to 16
Early Intervention Foundation
2
TABLE OF CONTENTS
Foreword 4
Executive summary 7
Data and methods 10
Analysis and findings 15
The relationship between economic disadvantage and child
behavioural and emotional problems 15
The relationship between early behavioural and emotional problems
at later cognitive scores 22
Conclusions and policy implications 26
Annex A 29
Annex B 31
Disadvantage, behaviour and cognitive outcomes: Longitudinal analysis from age 5 to 16
Early Intervention Foundation
3
ACKNOWLEDGEMENTS
We gratefully acknowledge the Joseph Rowntree Foundation whose support has
enabled this work. We also are grateful to Abigail McKnight at the London School of
Economics, who carried out the original analysis for this report.
This work has benefited from insightful and valuable comments from Kirsten
Asmussen, Leon Feinstein, Leslie Gutman, Jean Gross, Ben Lewing, Bilal Nasim, Carey
Oppenheim and Debbie Weekes‐Bernard. As ever, any conclusions, errors and
oversights in this report are the view and responsibility of the individual authors
only.
We would also like to thank the Joseph Rowntree Foundation for their generous
support of this research programme and report.
ABOUT THE AUTHORS
Haroon Chowdry, at the time of writing, was senior economist at the Early
Intervention Foundation.
Tom McBride is director of evidence at the Early Intervention Foundation.
Early Intervention Foundation
10 Salamanca Place
London SE1 7HB
W: www.EIF.org.uk
P: +44 (0)20 3542 2481
T: @TheEIFoundation
This paper was first published in March 2017. © 2017
The aim of this report is to support policy‐makers, practitioners and commissioners to make informed
choices. We have reviewed data from authoritative sources but this analysis must be seen as supplement
to, rather than a substitute for, professional judgment. The What Works Network is not responsible for,
and cannot guarantee the accuracy of, any analysis produced or cited herein.

Disadvantage, behaviour and cognitive outcomes: Longitudinal analysis from age 5 to 16
Early Intervention Foundation
4
Foreword
The social and emotional skills we develop as children impact on
many of the things we care about in adult life, including adult
physical and mental health, employment, and life satisfaction.1
Hence it is not surprising that the notion of developing young
people’s social and emotional skills for success in education,
work and life has gained cross‐party political support,2 and is
now firmly part of the national policy agenda. One example – the
‘character grants’ announced by the Department for Education –
aims to help schools share approaches for developing character
and resilience.3
Alongside this is a renewed focus on improving social mobility.4
However, progress is slow. Children from wealthy backgrounds
with lower academic ability are still more likely to become high‐
earning adults than children from poorer families with higher
academic ability.5 In fact, adults from working‐class backgrounds
can expect to earn less than their more privileged colleagues
even if they have the same qualifications, occupation and
experience.6
The challenge of creating a more equal society extends beyond
equality in exams results or access to jobs. Could ‘soft skills’,
which will reflect social and emotional competences, play a role?
Some evidence suggests employers are placing ever greater
value on this in recruitment and promotion processes.7 We also
know that children from wealthier families are likely to have
1 http://www.eif.org.uk/wp‐content/uploads/2015/03/EIF‐Strand‐1‐Report‐FINAL1.pdf 2 http://centreforum.org/publications/character‐and‐resilience‐manifesto/ 3 https://www.gov.uk/government/news/funding‐boost‐for‐schools‐helping‐pupils‐develop‐character 4 https://www.gov.uk/government/news/social‐mobility‐package‐unveiled‐by‐education‐secretary 5 https://www.gov.uk/government/news/new‐research‐exposes‐the‐glass‐floor‐in‐british‐society 6 https://www.gov.uk/government/news/new‐research‐uncovers‐class‐pay‐gap‐in‐britains‐professions 7 http://www.wsj.com/articles/employers‐find‐soft‐skills‐like‐critical‐thinking‐in‐short‐supply‐1472549400

Disadvantage, behaviour and cognitive outcomes: Longitudinal analysis from age 5 to 16
Early Intervention Foundation
5
more advanced social and emotional skills8 – a disparity which
will need to be reduced or reversed in order to boost social
mobility.
We contribute to this debate by presenting newly commissioned
research on social and emotional skills, and their interaction with
poverty. The work builds on previous research funded by Joseph
Rowntree Foundation,9 and research funded by EIF, the Cabinet
Office and the Social Mobility Commission.10 It is based on data
from the British Cohort Study, a representative sample of
children born in 1970, and focuses specifically on behavioural
and emotional problems from age 5 to 16. We explore how these
factors interact with poverty and impact on literacy and
numeracy, in order to gain new insights into how suitable these
are for future social mobility interventions.
Alongside this work, we are currently assessing the evidence on
specific interventions to determine what works to improve
children’s social and emotional skills. Once completed, this will
sit alongside our reviews of what works to support couple
relationships,11 promote child development12 and prevent
involvement in gang and youth violence13 – making a valuable
contribution to our growing evidence base on the kinds of
support that can generate better outcomes for children and
families.
Tom McBride
Director of Evidence, Early Intervention Foundation
8 http://www.eif.org.uk/wp‐content/uploads/2015/03/EIF‐Strand‐1‐Report‐FINAL1.pdf 9 https://www.jrf.org.uk/report/poorer‐children%E2%80%99s‐educational‐attainment‐how‐important‐
are‐attitudes‐and‐behaviour 10 www.eif.org.uk/publication/social‐and‐emotional‐learning‐skills‐for‐life‐and‐work/ 11 http://www.eif.org.uk/publication/what‐works‐to‐enhance‐inter‐parental‐relationships‐and‐improve‐
outcomes‐for‐children‐3/ 12 http://www.eif.org.uk/publication/foundations‐for‐life‐what‐works‐to‐support‐parent‐child‐
interaction‐in‐the‐early‐years/ 13 http://www.eif.org.uk/publication/preventing‐gang‐and‐youth‐violence/

Disadvantage, behaviour and cognitive outcomes: Longitudinal analysis from age 5 to 16
Early Intervention Foundation
6
Disadvantage, behaviour and cognitive outcomes: Longitudinal analysis from age 5 to 16
Early Intervention Foundation
7
Executive summary
The importance of children’s social and emotional skills for life outcomes is well
established, as is the link between these skills and family income. The combination
of both of these can serve to entrench the cycle of intergenerational disadvantage.
Previous work has shown that poorer children exhibit more behavioural and
emotional problems on average than their wealthier peers, and that this gap
appears early in childhood; less is known about the reasons why this might be and
how long it persists for. There is also limited evidence on what might drive the
interplay between early behaviour and later cognitive skills such as literacy and
numeracy.
In this report we present findings from new research on the following questions:
(1) What is the relationship between economic disadvantage and child
behavioural and emotional problems?
Our analysis shows that there is a higher prevalence of behavioural and emotional
problems among disadvantaged children. We also find that this discrepancy can be
fully accounted for by differences in maternal psychological wellbeing and parental
education.
This does not mean that economic disadvantage does not matter. However, it does
suggest that it is factors associated with disadvantage, rather than economic
disadvantage itself, that lead to the social gradient in child behavioural and
emotional problems.
Poor maternal psychological wellbeing explains around half of the socioeconomic
disparity in behavioural and emotional problems. However, its association with
these problems is only present in low‐ and medium‐income families, and the effect is
strongest for children in poverty. This suggests that higher family income (or factors
associated with it) may act as a protective factor against the risks from poor
maternal psychological wellbeing, or that factors associated with poverty may
amplify those risks.
There is a lower incidence of behavioural and emotional problems in children with
highly educated parents. It is likely that parental education is capturing a range of
influences, such as the quality of parenting, of the home learning environment and
of parent–child interactions. All of these factors may contribute to children’s socio‐
emotional development and behaviour throughout childhood.
(2) How do child behavioural and emotional problems influence later
cognitive skills and attainment?
Children with higher levels of behavioural and emotional problems at age 5 do less
well, on average, in cognitive assessments – specifically, literacy and numeracy
scores – at age 10 and age 16. This correlation remains, but to a lesser extent, after
taking into account other individual and family factors that may contribute to this

Disadvantage, behaviour and cognitive outcomes: Longitudinal analysis from age 5 to 16
Early Intervention Foundation
8
relationship. For example, parental education and maternal psychological wellbeing
together explain half of the correlation between age 5 behavioural and emotional
problems and age 10 cognitive skills.
There is a statistically significant link between behavioural and emotional problems
at age 5 and cognitive scores at age 16. However, this is fully explained when we
control for cognitive scores and behavioural and emotional problems at age 10. In
other words, after this is taken into account, there is no independent link between
behavioural and emotional problems at age 5 and cognitive skills at age 16. One
potential way to interpret this is that early childhood behavioural and emotional
problems need not present a risk for future educational attainment if they can be
turned around by age 10.
Higher parental education is associated with higher cognitive scores, even after
taking into account earlier cognitive scores and behaviours. This may reflect ongoing
features of the home environment or parenting style that continue to influence
children’s learning and ability even into adolescence.
Our findings highlight the interplay between cognitive and non‐cognitive outcomes,
and the family‐level factors that may contribute to these outcomes. Parental
education and poor maternal wellbeing contribute to higher behavioural and
emotional problems and lower cognitive scores, especially in early childhood.
Behavioural and emotional problems at age 5 then contribute to behavioural and
emotional problems and lower cognitive scores at age 10, which in turn contribute
to lower cognitive scores at 16. As a result these factors can cast ‘long shadows’ into
adolescence and early adulthood, if unaddressed through interventions or additional
support.
Implications for policy
Our results indicate that early behaviour may have a significant influence over future
outcomes, especially for children born into poverty. Parental education and
maternal mental health are important factors that help drive this relationship, and
explain much of its interaction with disadvantage.
However, more research is needed to understand whether these results hold for
more recent cohorts; as well as the underlying mechanisms at play; and what, if
anything, might serve as protective factors. The Department for Education should
consider the need for more work in this area as part of its commitment to improving
social mobility.
Addressing educational inequalities between adults could have a role to play in
improving outcomes for children, although this is clearly a long‐term project. In the
shorter term, improving maternal psychological wellbeing and early child behaviour
may be suitable targets for intervention.
Assuming the relationships we have uncovered are genuinely causal, then our results
suggest that evidence‐based programmes targeted at low‐income families – which
successfully improved maternal wellbeing, early child behaviour or early learning –
could undo much of the socioeconomic disparities in children’s outcomes. Such
programmes might take advantage of funding for disadvantaged two‐year‐olds while

Disadvantage, behaviour and cognitive outcomes: Longitudinal analysis from age 5 to 16
Early Intervention Foundation
9
being embedded within a wider local early‐years system. This would be another tool
to consider as part of attempts to promote social mobility and break
intergenerational cycles of disadvantage. Local commissioners and directors of
public health are well placed to lead work in this area as part of the Healthy Child
Agenda.
Our findings reinforce the value of investing in evidence‐based early‐years
programmes. Although work is needed to develop the evidence base around
identification and successful intervention for this target population, there are a
number of programmes that have been found to be effective, which EIF has
reviewed in its major review of parenting programmes, Foundations for Life.14 Our
findings can also be used to support the cost–benefit analysis of investing in these
programmes, which will be of interest to a range of local and national
commissioners.
14 http://www.eif.org.uk/publication/foundations‐for‐life‐what‐works‐to‐support‐parent‐child‐
interaction‐in‐the‐early‐years/
Disadvantage, behaviour and cognitive outcomes: Longitudinal analysis from age 5 to 16
Early Intervention Foundation
10
Data and methods
This report uses data from the British Cohort Study 1970 (BCS70), a longitudinal
study which followed a representative sample of children born in Britain in 1970.
The analysis uses behaviour and emotional measures collected at ages 5, 10 and 16,
and cognitive skill measures (literacy and numeracy scores) collected at age 10 and
age 16. The key benefit of this data source is that it provides rich information from
birth all the way into adolescence, for a cohort that was nationally representative at
the time. The key limitation is that the population in question grew up in the 1970s,
which should be borne in mind when applying our findings to current and future
generations of children.
Behaviour and cognitive measures
The behaviour measures are based on the Rutter scale (Rutter et al., 1970); the
constituent items are shown in Table A1 in the Annex. In BCS70, parents (largely
mothers) were asked the Rutter questions in relation to their children. A score was
calculated by adding up the responses (which capture the extent of agreement with
that particular statement), with higher values indicating greater severity of
behavioural and emotional problems. The scores are then standardised to have a
mean of 0 and a standard deviation of 1.
In some of the analysis, the total Rutter score is split up into two further scores.
The Rutter Externalising score, which captures behaviours that may be
signals for conduct disorder, hyperactivity or aggression. This was created
by combining items 1–4, 10, 11, 14, 15, 18, 19 in Table A1. Higher values
indicate greater severity.
The Rutter Internalising score, which captures behaviours that may be
signals for poor emotional health, including anxiety, loneliness or
depression. This was created by combining Rutter items 6, 9, 16 and 17 in
Table A1, as well as two further BCS70 survey questions: ‘My child is sullen
or sulky’ and ‘My child cries for little cause’.15 Higher values indicate greater
severity.
The following measures of cognitive skills were used in this analysis:
maths and reading tests at age 1016
15 This was done in order to be fully consistent with the analysis by Goodman et al. (2015). However,
these two additional variables are only available in the age 10 survey and therefore we do not have a
consistent measure of emotional health at age 5 or age 16. 16 These were the Friendly Maths Test (arithmetic, number skills, fractions, algebra, geometry and
statistics) and the Shortened Edinburgh Reading Test (word recognition, vocabulary, syntax, sequencing,
comprehension and retention).
Disadvantage, behaviour and cognitive outcomes: Longitudinal analysis from age 5 to 16
Early Intervention Foundation
11
arithmetic and vocabulary tests at age 16.17
As with the behaviour measures, the cognitive skill measures were standardised to
have a mean of 0 and a standard deviation of 1.
Family economic circumstances
Two measures of family economic circumstances are used in the analysis.
Gross family income was measured at age 10 in BCS70, and it is used in the analysis
of cognitive outcomes at age 16 outcomes. This measure was also ‘equivalised’ in
order to account for variations in family size.18 Based on this measure, three income
groups were created:
Low‐income – income less than the relative income poverty line (60% of
median income), which works out to be the poorest 24% of families in
BCS70
Middle‐income
High‐income group – this approximates the wealthiest quartile (top 22%) of
families.
Where this measure of family economic circumstances is used, the analysis focuses
on the difference in behavioural and emotional and cognitive outcomes between the
low‐income and high‐income groups, and the factors that might explain it.19
Family income was not collected in BCS70 until age 10, so social class measured at
the child’s birth is used as a proxy for family economic circumstances for analysis of
outcomes measured age 10.20 Social class is defined here as the highest occupational
class from either the mother or father. It was coded as follows:
Professional (I)
Managerial and Technical (II)
Skilled – Non‐Manual (III‐NM)
Skilled – Manual (III‐M)
Partly Skilled (IV)
Unskilled (V)
Based on these categories, the analysis classifies children as belonging to a
disadvantaged social class group if their parental social class at birth was Partly
Skilled (IV) or Unskilled (V).
17 These were the Applied Psychology Unit Arithmetic test (arithmetic, probabilities and area) and a 75‐
item vocabulary test where children had to identify words with the same meaning. 18 Family income was equivalised by dividing by the square root of family size. 19 The exception to this is the decompositions, which look at the difference between low‐income children
and the rest. 20 This is to ensure that outcomes of interest are related to prior factors rather than contemporaneous
factors, to reduce the chances of reverse causality confounding any of the relationships that are found.

Disadvantage, behaviour and cognitive outcomes: Longitudinal analysis from age 5 to 16
Early Intervention Foundation
12
Socio‐demographic characteristics
As a cohort study, BCS70 also contains detailed information on other aspects of
children’s lives and their family circumstances. The analysis in this report takes these
factors into account when attempting to disentangle the relationships between
disadvantage, behaviour and cognitive outcomes. We make use of the following
information:
ethnicity
the presence of elder siblings
child birth weight
whether the child was born premature21
disability status22
parental education23
mother’s age at birth24
mother’s psychological wellbeing, measured by the Malaise Inventory.25
Table 1 shows how some of these characteristics vary by family income, showing a
clear socioeconomic gradient for many of these factors. Compared to their peers,
poor children are more likely to:
belong to an ethnic minority group
have older siblings
have been born premature
have parents with low qualifications
have a younger mother
have a mother who exhibits poor levels of psychological wellbeing.
TABLE 1. KEY SOCIO‐DEMOGRAPHIC CHARACTERISTICS BY INCOME GROUP
Low Middle High
Ethnicity: White British 91% 96% 97%
Ethnicity: Irish 1% 0% 0%
Ethnicity: Other European 1% 0% 1%
Ethnicity: Caribbean 2% 1% 0%
Ethnicity: Indian 3% 1% 1%
Ethnicity: Pakistani 2% 0% 0%
Ethnicity: Bangladeshi 0% 0% 0%
21 Defined as a gestation of less than 37 weeks. 22 In the age 10 survey, parents were asked to indicate if they considered that their child had a physical or
mental disability or handicap, or any other disabling condition which interferes with normal everyday life,
or which might be a problem at school. 23 This is based on the highest qualification held by either of the child’s parents. 24 Specifically, whether the child’s mother was under 24 when the child was born. 25 This is a total score based on responses to the Malaise Inventory, a set of self‐completion questions
which combine to measure levels of physical ailments, psychological distress and depression. The Malaise
Inventory items can be found in Table A2.
Disadvantage, behaviour and cognitive outcomes: Longitudinal analysis from age 5 to 16
Early Intervention Foundation
13
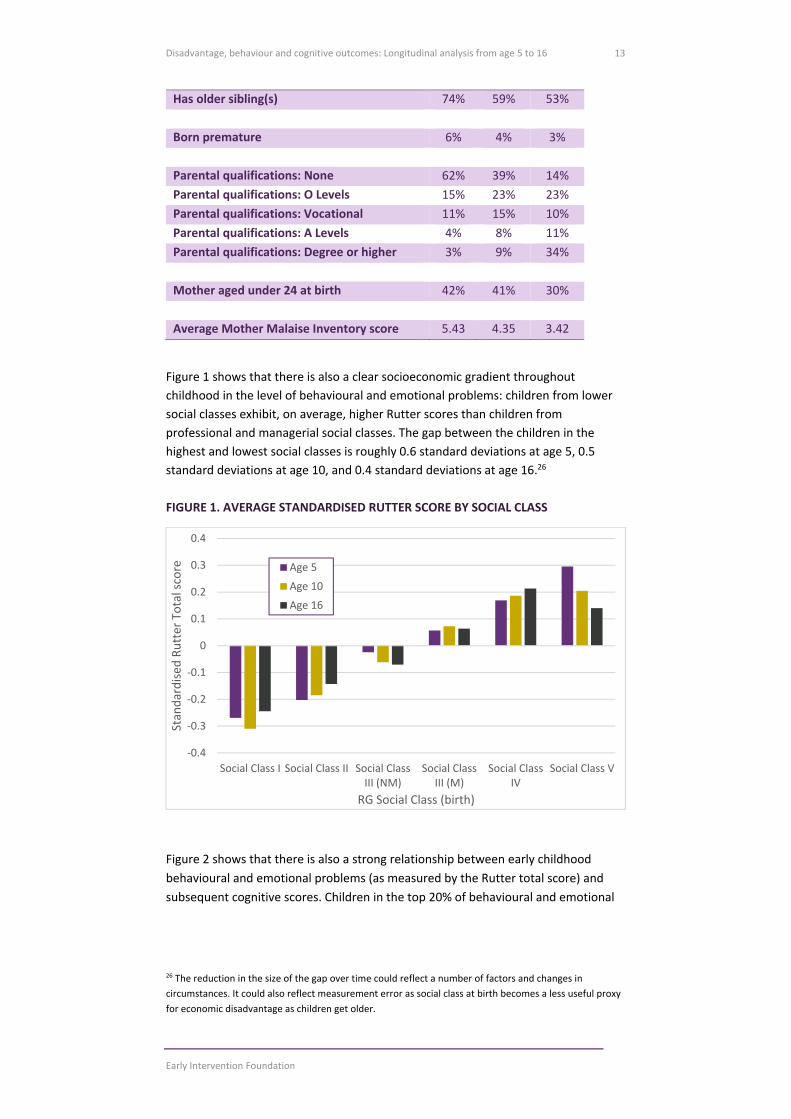
Has older sibling(s) 74% 59% 53%
Born premature 6% 4% 3%
Parental qualifications: None 62% 39% 14%
Parental qualifications: O Levels 15% 23% 23%
Parental qualifications: Vocational 11% 15% 10%
Parental qualifications: A Levels 4% 8% 11%
Parental qualifications: Degree or higher 3% 9% 34%
Mother aged under 24 at birth 42% 41% 30%
Average Mother Malaise Inventory score 5.43 4.35 3.42
Figure 1 shows that there is also a clear socioeconomic gradient throughout
childhood in the level of behavioural and emotional problems: children from lower
social classes exhibit, on average, higher Rutter scores than children from
professional and managerial social classes. The gap between the children in the
highest and lowest social classes is roughly 0.6 standard deviations at age 5, 0.5
standard deviations at age 10, and 0.4 standard deviations at age 16.26
FIGURE 1. AVERAGE STANDARDISED RUTTER SCORE BY SOCIAL CLASS
Figure 2 shows that there is also a strong relationship between early childhood
behavioural and emotional problems (as measured by the Rutter total score) and
subsequent cognitive scores. Children in the top 20% of behavioural and emotional
26 The reduction in the size of the gap over time could reflect a number of factors and changes in
circumstances. It could also reflect measurement error as social class at birth becomes a less useful proxy
for economic disadvantage as children get older.
‐0.4
‐0.3
‐0.2
‐0.1
0
0.1
0.2
0.3
0.4
Social Class I Social Class II Social ClassIII (NM)
Social ClassIII (M)
Social ClassIV
Social Class V
Standardised
Rutter Total score
RG Social Class (birth)
Age 5
Age 10
Age 16

Disadvantage, behaviour and cognitive outcomes: Longitudinal analysis from age 5 to 16
Early Intervention Foundation
14
problems at age 5 went to score, on average, 0.4–0.45 standard deviations worse on
cognitive tests compared to children in the bottom 20% of behavioural and
emotional problems at age 5. This gap appears to stay relatively stable from age 10
to age 16.
FIGURE 2. AVERAGE COGNITIVE TEST SCORE BY PRIOR RUTTER TOTAL SCORE
The relationships uncovered in Figures 1 and 2 are based on raw correlations, which
may not reflect the true nature or scale of the implied associations. These
relationships may be confounded by other factors that are also correlated with
economic disadvantage, behavioural and emotional problems or cognitive scores.
The analysis in the rest of this report uses multivariate regression models to further
unpick these relationships, by controlling for a range of factors simultaneously and
then exploring whether these associations still hold. These models are also used to
decompose relationships into portions that can be explained by each potential
confounding factor, and a remaining portion that cannot be explained.27 This helps
to judge the relative importance of each factor in terms of its contribution to the raw
correlations that are visible above.
27 This approach is based on Gelbach (2016).
‐0.3
‐0.2
‐0.1
0
0.1
0.2
0.3
Q1 Q2 Q3 Q4 Q5
Standardised
cognitive test scores (m
ean)
Quintiles of Standarised Rutter Total Behaviour score ‐ age 5
Age 10 Maths
Age 10 Reading
Age 16 Arithmetic
Age 16 Vocabulary
Disadvantage, behaviour and cognitive outcomes: Longitudinal analysis from age 5 to 16
Early Intervention Foundation
15
Analysis and findings
The relationship between economic disadvantage and child
behavioural and emotional problems
Behavioural and emotional outcomes at age 10
In the first stage of our analysis we explored the ‘raw differences’ by social class in
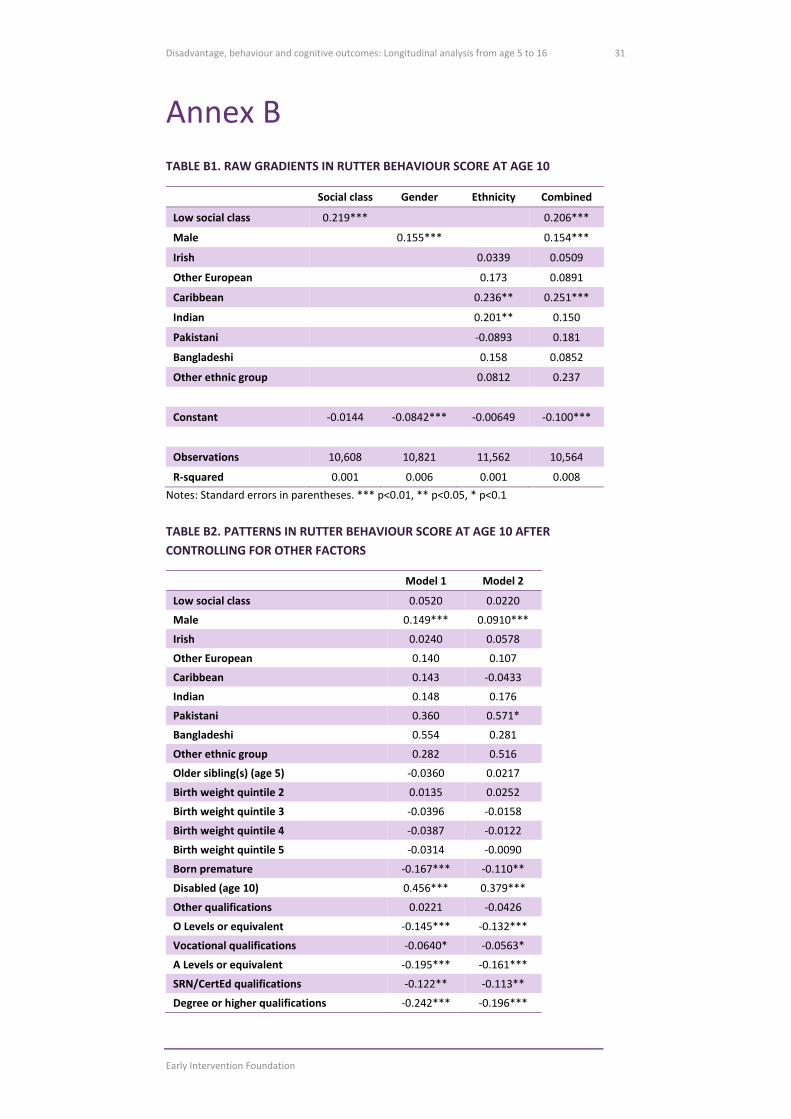
behavioural and emotional outcomes at age 10. Table B1 in the Annex provides
additional detail, with the following key findings.
Children from a lower social class had, on average, more behavioural and
emotional issues than their peers: their average Rutter score that was 0.2
standard deviations higher.
Boys had, on average, slightly more behavioural and emotional problems
than girls, with a Rutter score that was 0.15 standard deviations.
There are also some striking variations by ethnic group, with children from a
Caribbean background having a Rutter score that was 0.25 standard
deviations higher on average.
Next we controlled for the full range of family socio‐demographic characteristics,
listed in the previous section. There are two models here: Model 1, which takes
these characteristics into account; and Model 2, which additionally controls for the
child’s Rutter score at age 5.
Once these factors are taken into account, there is no statistically significant gap in
the level of behavioural and emotional problems at age 10 between children from
higher and lower social classes, or those from different ethnic groups. The gender
difference remains statistically significant, but is reduced in scale once early
behavioural and emotional problems (at age 5) are taken into account. On average,
boys had a Rutter score at age 10 that was 0.09 standard deviations higher than for
girls, even if they had the same Rutter score at age 5 (as well as the same
characteristics above).
Results can be found in Table B2 which also reveal a number of interesting
relationships between early factors and behavioural and emotional problems at age
10.
Unsurprisingly, higher behavioural and emotional problems at 5 are a very
strong predictor of higher behavioural and emotional problems at age 10.
All else equal, there is an effect size of 0.37 between Rutter at age 5 and
age 10: scoring one standard deviation higher on the Rutter scale at age 5 is
associated with scoring 0.37 standard deviations higher on the Rutter scale
at age 10.

Disadvantage, behaviour and cognitive outcomes: Longitudinal analysis from age 5 to 16
Early Intervention Foundation
16
There is a statistically significant effect of poor maternal psychological
wellbeing, as measured by the Mother Malaise Inventory, on child
behavioural and emotional problems.28
Being born to a younger mother is statistically significantly associated with
higher Rutter scores at age 10, but not when Rutter scores at age 5 are
controlled for. This indicates that the risk associated with being born to a
younger mother operates primarily through its influences on early
behavioural and emotional problems.
There remain statistically significant differences by parental education level
in the average level of behavioural and emotional problems: children with
highly educated parents have lower Rutter scores on average. This may
capture a range of influences, including home learning environments and
parenting style, that may be associated with parental education.
To shed more light on these factors, Table 2 shows the decomposition results, which
indicate how much of the social class gap in behavioural and emotional outcomes
can be explained by each one.
TABLE 2. DECOMPOSITION OF SOCIAL CLASS GAP IN RUTTER SCORE AT AGE 10
% of gap explained for:
Factor: Model 1 Model 2
Gender ‐4% ‐3%
Older siblings ‐4% 3%
Birth weight/premature ‐2% ‐1%
Ethnicity 3% 1%
Disability 5% 3%
Parental education 41% 36%
Younger mother ‐2% ‐1%
Mother's malaise 57% 24%
Total Rutter (age 5) N/A 76%
Total explained 94% 138%
Note: Columns may not sum to the totals given due to rounding.
In the decomposition for Model 1 (which does not control for early behavioural and
emotional problems) almost all of the social class gap in behavioural and emotional
problems can be explained, and it is mainly accounted for by maternal malaise (57%)
and parental education (41%). Together these two factors are able to explain 98% of
28 We note that maternal psychological wellbeing could be a symptom or indicator of a range of other
factors – substance misuse, inter‐parental violence or conflict, housing or employment problems, and so
forth. While such factors are outside the scope of the data and this report, we leave open the possibility
that these could be underlying causes that contribute to both poor maternal wellbeing and children’s
behavioural and emotional problems. The risk of reverse causality – that child behavioural problems
actually drive maternal wellbeing – cannot be ruled out entirely, although it should be small given that
maternal malaise is measured when the children are 5 years old.
Disadvantage, behaviour and cognitive outcomes: Longitudinal analysis from age 5 to 16
Early Intervention Foundation
17
the difference in behavioural and emotional problems at age 10 between children
from lower and higher social class backgrounds. In the decomposition for Model 2
(which additionally controls for early behavioural and emotional problems at age 5)
the Rutter score at age 5 explains 76% of the social class gap in behavioural and
emotional problems at age 10.29 Even under the Model 2 specification, maternal
malaise and parental education together explain 60% of the social class gap in
behavioural and emotional problems.
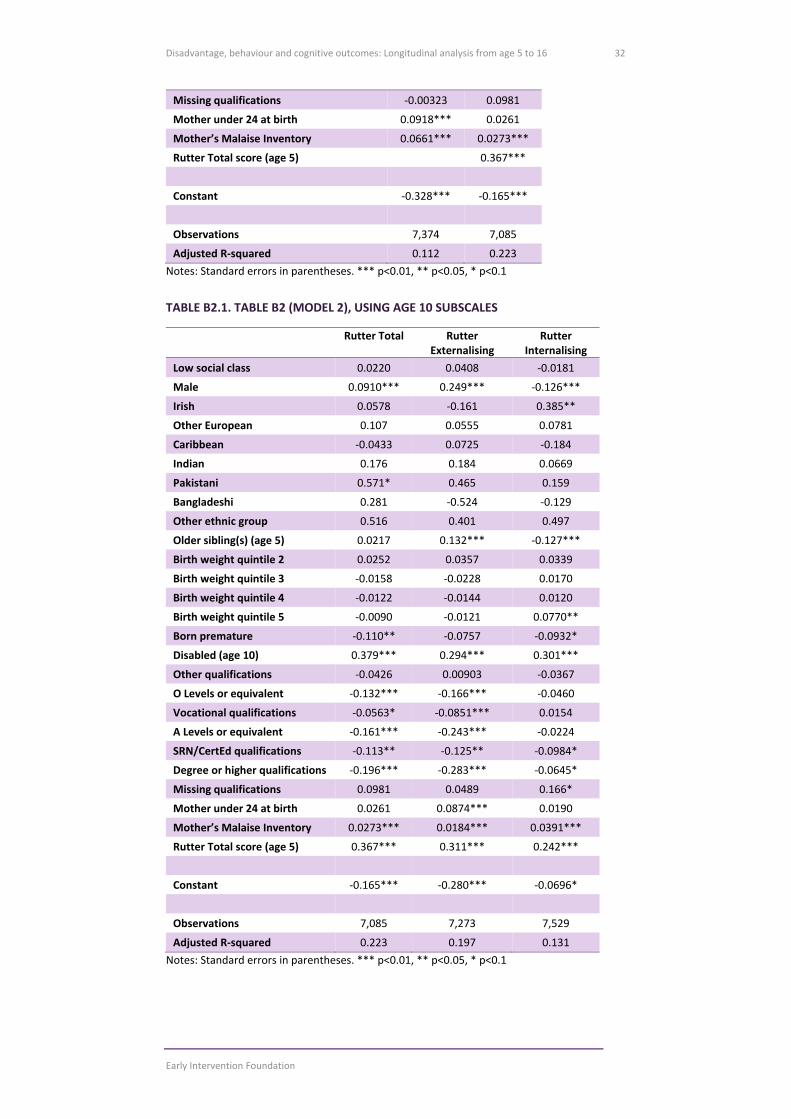
The analysis up to now has made use of total Rutter scales at ages 5 and 10. As a
sensitivity check, we repeated the analysis in Table B2 using, where possible, the
Rutter subscales – which capture externalising and internalising behaviour
separately.
Table B2.1 repeats the analysis, except that the outcome under consideration is
either the Rutter externalising subscale or the Rutter internalising subscale. The first
column of this table contains the results from Table B2 (Model 2), where the
outcome was the Rutter total. Reading across the columns reveals how the
relationships change when the Rutter externalising score (second column) and
Rutter internalising score (third column) included in the analysis. We conclude that:
There is no social class gap in any of Rutter score after controlling for the
other factors in the model.
On average, boys have higher externalising scores (0.25 standard
deviations) and lower internalising scores (0.13 standard deviations). The
combination of these is a total Rutter score that is slightly higher (0.1
standard deviations) compared to girls.
The importance of parental education relates mainly to externalising
behaviour only. Children with highly educated parents exhibit lower levels
of externalising behaviour on average; there is no statistically significant
relationship between parental education and internalising behaviour.
Poor maternal wellbeing is associated with higher scores across all of the
scales – total, externalising and internalising. However, poor maternal
wellbeing has a stronger effect on internalising behaviour than on
externalising behaviour.
Behavioural and emotional problems at age 5 (as measured by the total
Rutter score) are strongly related to all of the age‐10 measures, but are
most strongly related to the total Rutter score at age 10.
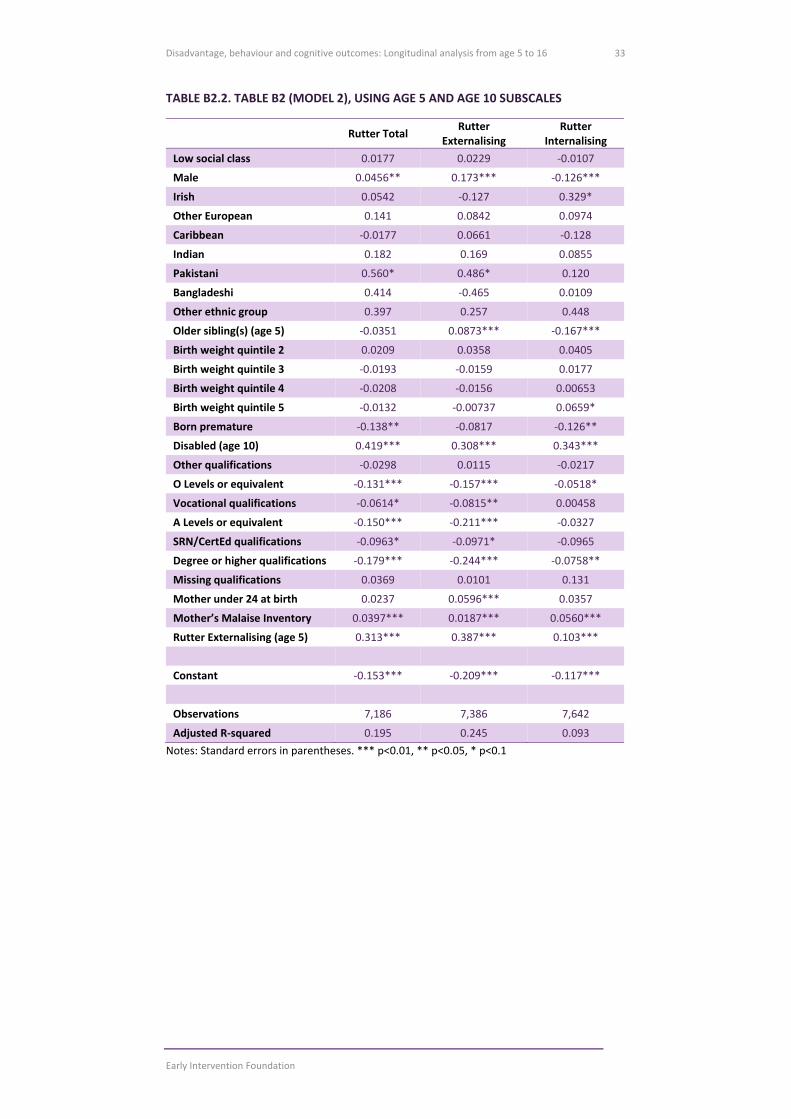
Table B2.2 repeats Table B2.1 with the only difference being that it controls for
Rutter externalising score at age 5 rather than the total.30 This reveals a qualitatively
similar story to above. The only difference here is, unsurprisingly, that the
behavioural problems at age 5 are most strongly related to the externalising score at
age 10.
29 Of course, 76% will be an overestimate of the relative importance of early behavioural problems vis‐à‐
vis maternal malaise and parental education, if the former is influenced by the latter. 30 The Rutter internalising scale at age 5 is not included, as this measure could not be created consistently
at age 5 due to some items only being available at age 10.
Disadvantage, behaviour and cognitive outcomes: Longitudinal analysis from age 5 to 16
Early Intervention Foundation
18
Behavioural and emotional outcomes at age 16
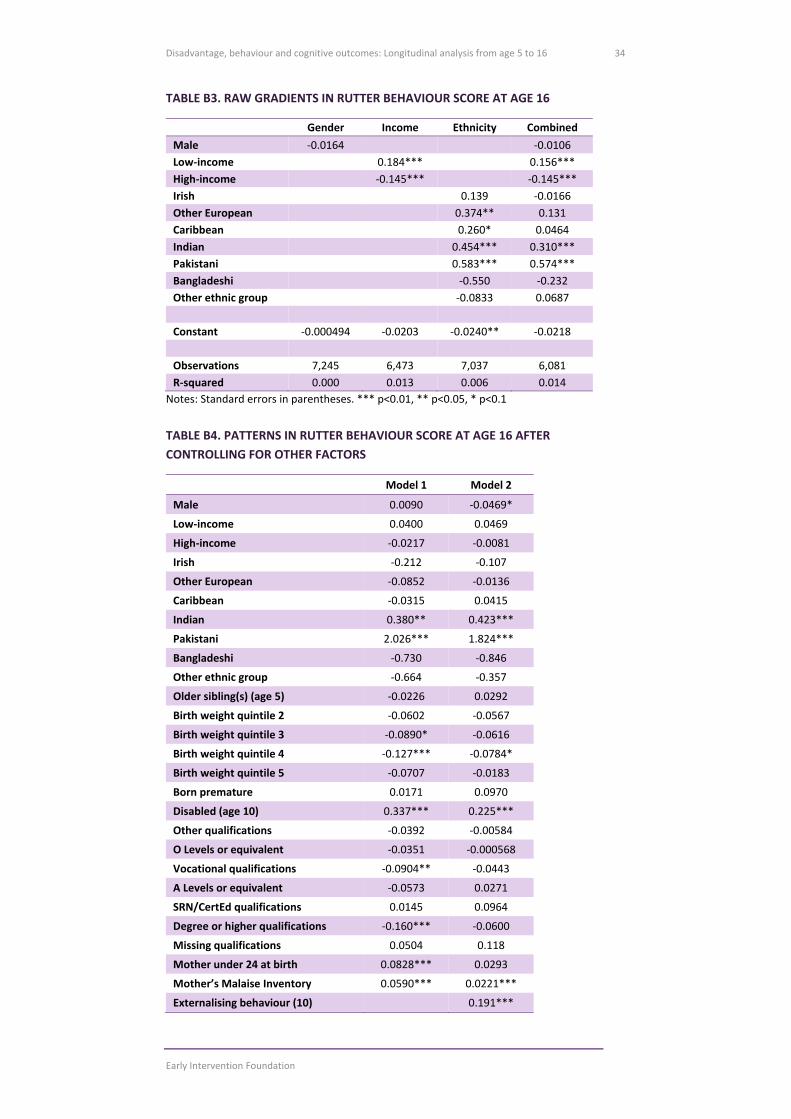
Table B3 in the Annex shows the initial raw differences in behavioural and emotional
outcomes at age 16. By this age, there is no longer a significant difference between
boys and girls in average Rutter scores. There is still a sizeable socioeconomic gap,
however: using income as the measure, low‐income children have on average more
behavioural and emotional problems than middle‐income children, while high‐
income children have fewer behavioural and emotional problems on average. The
gap in age‐16 Rutter scores between low‐income and high‐income children is 0.3
standard deviations. There are also statistically significant differences by ethnicity,
with Indian and Pakistani children standing out as displaying more behavioural and
emotional issues.
Once other factors are controlled for, as shown in Table B4, there is no statistically
significant difference between income groups in the average level of Rutter scores at
16. Some ethnic differences remain although these could be driven by small sample
sizes leading to unreliable estimates. In Table B4, Model 1 is a specification that
controls for the same set of individual and family factors as above, while Model 2
additionally controls for the total Rutter score at age 5, and the Rutter internalising
and externalising scales at age 10. As before, children of younger mothers exhibit
higher levels of behavioural and emotional problems, but not when early
behavioural and emotional problems are controlled for – this indicates that this
relationship is embedded via early behavioural and emotional influences.
Similarly, the statistically significant differences by parental education do not remain
once behavioural and emotional problems at age 5 and 10 are controlled for.
However, even when controlling for behavioural and emotional problems at age 5
and 10, there is still a statistically significant link between maternal malaise at age 5
and Rutter scores at age 16, and between child disability at age 10 and Rutter scores
at age 16.
Interestingly, there is still a significant effect of behaviour at age 5 (effect size of 0.2)
even after controlling for behaviour at age 10. This indicates that persistent
behavioural and emotional problems through childhood are more likely to
contribute to behavioural and emotional problems at age 16. It also illustrates a
potential ‘long shadow’ of behaviours at age 5.
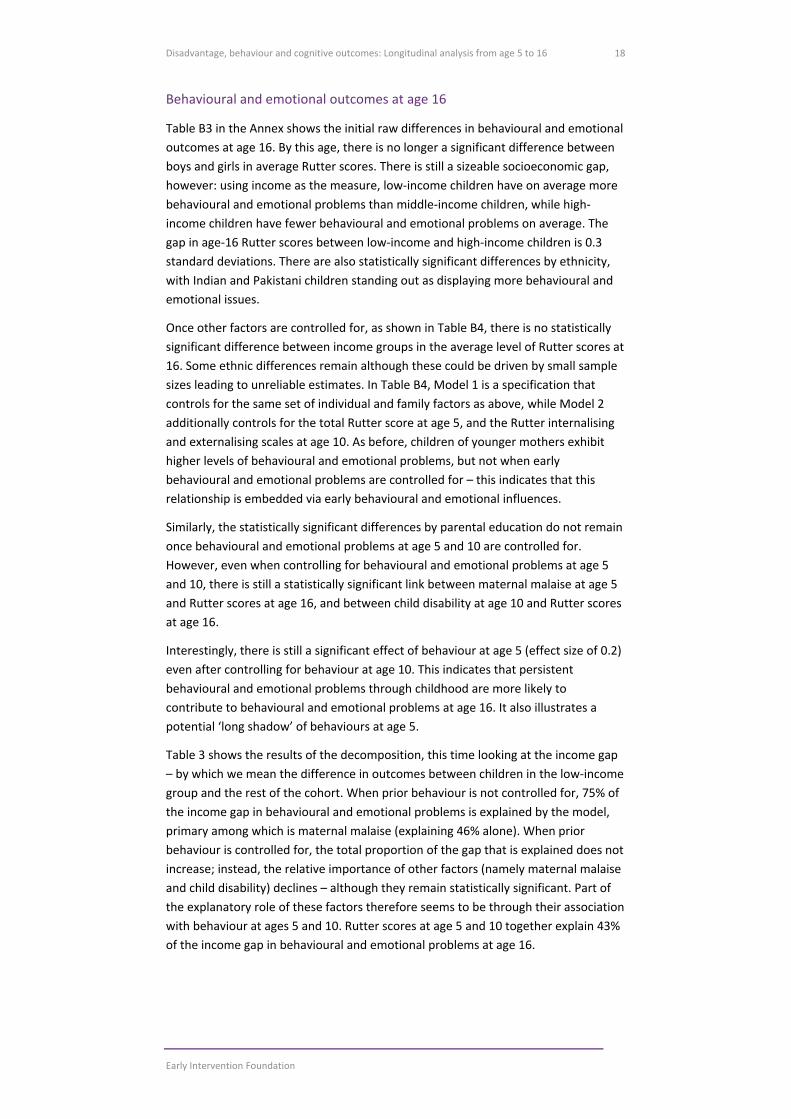
Table 3 shows the results of the decomposition, this time looking at the income gap
– by which we mean the difference in outcomes between children in the low‐income
group and the rest of the cohort. When prior behaviour is not controlled for, 75% of
the income gap in behavioural and emotional problems is explained by the model,
primary among which is maternal malaise (explaining 46% alone). When prior
behaviour is controlled for, the total proportion of the gap that is explained does not
increase; instead, the relative importance of other factors (namely maternal malaise
and child disability) declines – although they remain statistically significant. Part of
the explanatory role of these factors therefore seems to be through their association
with behaviour at ages 5 and 10. Rutter scores at age 5 and 10 together explain 43%
of the income gap in behavioural and emotional problems at age 16.
Disadvantage, behaviour and cognitive outcomes: Longitudinal analysis from age 5 to 16
Early Intervention Foundation
19
TABLE 3. DECOMPOSITION OF INCOME GAP IN RUTTER SCORE AT AGE 16
% of gap explained for:
Factor: Model 1 Model 2
Gender 0% ‐1%
Older siblings ‐2% 2%
Birth weight/premature 4% 4%
Ethnicity 2% 3%
Disability 4% 1%
Parental education 18% 4%
Younger mother 3% 1%
Mother's malaise 46% 15%
Externalising (age 10) N/A 26%
Emotional health (age 10) N/A 5%
Total Rutter (age 5) N/A 12%
Total explained 75% 74%
Note: Columns may not sum to the totals given due to rounding.
Table B4.1 in the Annex repeats the same analysis as Model 2 in Table B4, but using
the available subscales at age 5 and 16.31 The first column of this table matches the
Model 2 column of Table B4. Reading across, it remains the case that there is no
income gap in either total or externalising Rutter scores once other factors are
controlled for. The analysis also reveals that:
When looking at externalising scores at age 16, there is a statistically
significant gender gap: boys have slightly higher scores than girls. This
implies that boys would also have lower levels of internalising behaviour.
While there is a statistically significant link between poor maternal
wellbeing and externalising behaviour, the scale of the relationship is
smaller. This implies that there must be a larger relationship between poor
maternal wellbeing and internalising behaviour.
Regardless of the scale used, the link between behaviour at age 5 and
behaviour at age 16 is around 0.15–0.2 standard deviations, even after
controlling for behaviour at age 10.
Finally, Table B5 in the Annex shows the results of estimating Table B4’s analysis
separately by income group (low, medium, high), in order to explore whether the
relationships identified above differ or only apply to specific income groups. While
inferences are more difficult to draw given the smaller sample sizes, the analysis
reveals that maternal malaise is associated with a higher Rutter score only for
children in low‐ and medium‐income families, and the effect is strongest for the low‐
income group. This may suggest that higher family income is able to act as a
protective factor against the risks from poor maternal wellbeing, or that having a
low income amplifies those risks.
31 Only the externalising subscale was available at these ages – as previously stated, the Rutter
internalising subscale included information that was only available at age 10.
Disadvantage, behaviour and cognitive outcomes: Longitudinal analysis from age 5 to 16
Early Intervention Foundation
20
Summary of results
Children from disadvantaged backgrounds exhibit more reported behavioural and
emotional problems, on average, compared with their more well‐off peers. This
socioeconomic disparity amounts to around 0.2 standard deviations on the Rutter
scale. Boys also tend to have higher levels of behavioural problems (externalising
behaviours) but lower levels of emotional problems (internalising behaviours).
There are a number of other factors that may account for the socioeconomic
disparity in behavioural and emotional problems, or may indicate channels through
which socioeconomic disadvantage impacts on behavioural and emotional problems.
After taking into account a range of individual and family factors, there is no
statistically significant gap in the level of behavioural and emotional problems
between disadvantaged children and their peers.
Importantly, this does not mean that that economic disadvantage does not matter
for behavioural and emotional outcomes. However, it does suggest that it is factors
associated with disadvantage, rather than economic disadvantage or poverty in and
of itself, that drive the social gradient in child behavioural and emotional problems.
There remain statistically significant differences by parental education level in the
average level of behavioural problems: children with highly educated parents have
lower externalising and total Rutter scores at age 10. This may capture a range of
influences, including home learning environments and parenting style, that may be
associated with parental education.
Behavioural and emotional problems at age 5 are a very strong predictor of
behavioural and emotional problems at age 10: scoring one standard deviation
higher on the Rutter scale at age 5 is associated with scoring 0.37 standard
deviations higher on the Rutter scale at age 10 – even while controlling for a range of
other factors. Added to this, behavioural and emotional problems at age 5 are more
prevalent in poorer families (as found by Goodman et al., 2015). As a result, early
behavioural and emotional problems end up accounting for 76% of the social class
gap in behavioural and emotional problems at age 10.
There is a statistically significant effect of poor maternal psychological wellbeing on
the level of behavioural and emotional problems, and the effect on emotional
problems (internalising scores) is particularly strong. This remains even after
controlling for behavioural and emotional problems at age 5 and 10. Maternal
malaise is able to explain around half of the socioeconomic disparity in behavioural
and emotional problems, although some of this operates through the effects on
earlier behaviour at ages 5 and 10. Maternal malaise accounts for 20% of the gap on
top of these factors.
Subgroup analysis reveals that at age 16, maternal malaise is associated with a
higher Rutter score only for children in low‐ and medium‐income families, and the
effect is strongest for children in the low‐income group. This may suggest that higher
family income is able to act as a protective factor against the risks from poor
maternal wellbeing, or that having a low income amplifies those risks.
While parental education is confirmed as an important factor, these results also
bring to the fore new evidence about the importance of maternal wellbeing. Based
Disadvantage, behaviour and cognitive outcomes: Longitudinal analysis from age 5 to 16
Early Intervention Foundation
21
on our figures, we calculate that an intervention which improved maternal
psychological wellbeing for low‐income families by, for example, 0.5 standard
deviations might then be expected to improve child behavioural and emotional
problems by around 0.1 standard deviations (with a larger effect on emotional
problems). This would be sufficient to eliminate half or even most of the
socioeconomic disparities in early behavioural and emotional problems.
There is a strong link between early behavioural and emotional issues and
behavioural and emotional problems in late childhood and adolescence. This is
relevant to the discussions about the long‐run benefits of investing in programmes
that target early child behaviour. For example, based on our results, a hypothetical
programme that reduced early behavioural (externalising) problems by around 0.6
standard deviations32 could lead to sustained benefits, with predicted reductions of
around 0.2 standard deviations in future behavioural problems – even into
adolescence. Furthermore, targeting a programme at the socioeconomic groups with
the most need would then be enough to effectively eradicate the disparities seen
here in behavioural and emotional problems between the most disadvantaged
children and their peers.
32 Some child behaviour programmes, such as Incredible Years, have demonstrated in randomised
controlled trials improvements in early child behaviour of this magnitude (Hutchings et al., 2007, Scott et
al., 2001)
Disadvantage, behaviour and cognitive outcomes: Longitudinal analysis from age 5 to 16
Early Intervention Foundation
22
The relationship between early behavioural and emotional
problems at later cognitive scores
In this section we present analysis that explores the gaps in cognitive scores
according to early behavioural and emotional problems at age 5. Instead of
understanding and decomposing differences between social class or income groups,
we focus on differences in cognitive outcomes between children who had more or
less problematic behaviour at age 5.
Cognitive skills at age 10
Table B6 in the Annex shows the raw differences in maths scores at age 10. It reveals
an effect size of approximately ‐0.16 for the effect of early behavioural and
emotional problems: children who scored 1 standard deviation higher on the Rutter
scale at age 5 went on to score, on average, 0.16 standard deviations lower on the
maths assessment at age 10. Boys, on average, score slightly higher on this
assessment (0.09 standard deviations), while children from a lower social class fared
worse, scoring 0.6 standard deviations lower on average.
Table B7 shows the raw differences in reading scores at age 10. It reveals a similar
pattern to the maths results, except with boys performing more poorly than girls.
Next we take into account individual and family factors. This approximately halves
the effect size of behavioural and emotional problems at age 5. The statistically
significant differences by gender and social class remain. These results can be seen
in Table B8. The key findings are:
Children born with low birthweight scored worse, on average, on both
cognitive assessments, while children who were born prematurely also
scored worse, on average, on the maths assessment.
There is a strong gradient in cognitive outcomes by parental education
level: children whose parents had been educated to degree level or higher
scored 0.7 standard deviations higher, on average, on both assessments.
Children whose mother was under 24 when they were born scored less well
(by approximately 0.1 standard deviations) on both assessments.
Maternal malaise at age 5 was associated with a lower maths score
(although the effect is small).
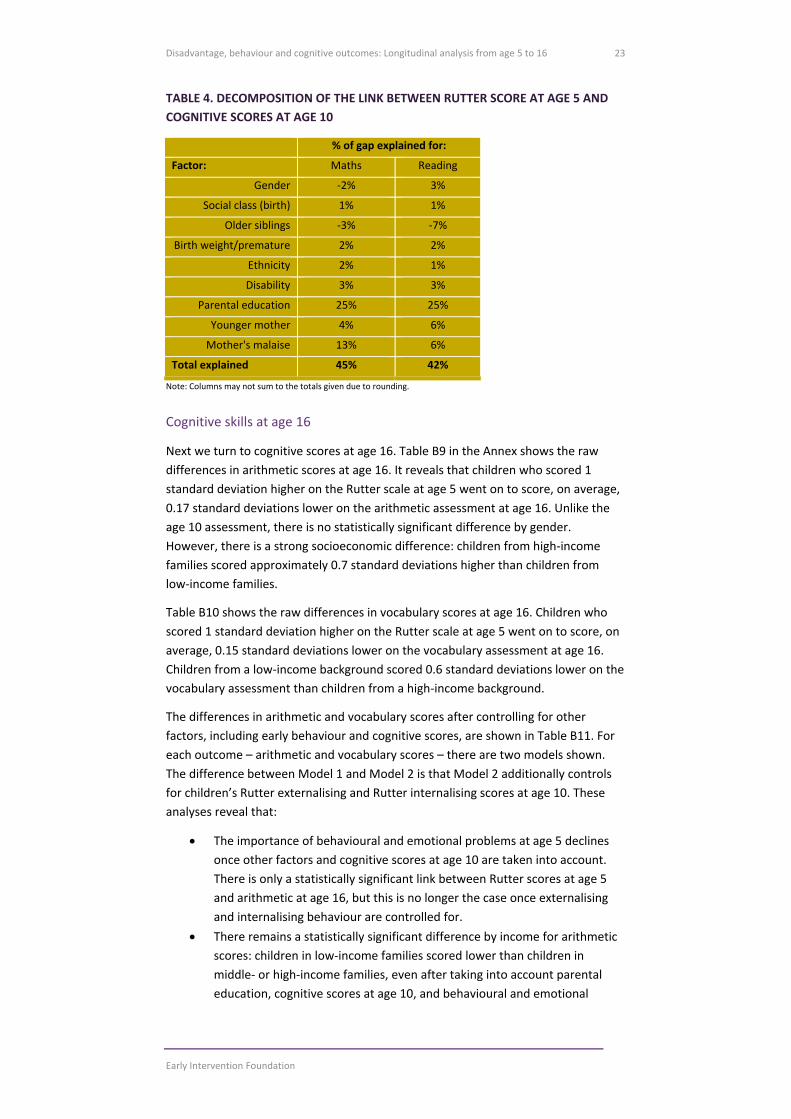
Finally, in Table 4 below we show the results of the decomposition. Controlling for
individual and family factors is able to explain just under half of the link between age
5 Rutter scores and age 10 maths and reading scores. A quarter of the gap is
explained by parental education, indicating that children with lower levels of
behavioural and emotional problems tend to have, on average, more well‐educated
parents, which tends to contribute to higher cognitive scores through other channels
as well as via early behaviour.
Disadvantage, behaviour and cognitive outcomes: Longitudinal analysis from age 5 to 16
Early Intervention Foundation
23
TABLE 4. DECOMPOSITION OF THE LINK BETWEEN RUTTER SCORE AT AGE 5 AND
COGNITIVE SCORES AT AGE 10
% of gap explained for:
Factor: Maths Reading
Gender ‐2% 3%
Social class (birth) 1% 1%
Older siblings ‐3% ‐7%
Birth weight/premature 2% 2%
Ethnicity 2% 1%
Disability 3% 3%
Parental education 25% 25%
Younger mother 4% 6%
Mother's malaise 13% 6%
Total explained 45% 42%
Note: Columns may not sum to the totals given due to rounding.
Cognitive skills at age 16
Next we turn to cognitive scores at age 16. Table B9 in the Annex shows the raw
differences in arithmetic scores at age 16. It reveals that children who scored 1
standard deviation higher on the Rutter scale at age 5 went on to score, on average,
0.17 standard deviations lower on the arithmetic assessment at age 16. Unlike the
age 10 assessment, there is no statistically significant difference by gender.
However, there is a strong socioeconomic difference: children from high‐income
families scored approximately 0.7 standard deviations higher than children from
low‐income families.
Table B10 shows the raw differences in vocabulary scores at age 16. Children who
scored 1 standard deviation higher on the Rutter scale at age 5 went on to score, on
average, 0.15 standard deviations lower on the vocabulary assessment at age 16.
Children from a low‐income background scored 0.6 standard deviations lower on the
vocabulary assessment than children from a high‐income background.
The differences in arithmetic and vocabulary scores after controlling for other
factors, including early behaviour and cognitive scores, are shown in Table B11. For
each outcome – arithmetic and vocabulary scores – there are two models shown.
The difference between Model 1 and Model 2 is that Model 2 additionally controls
for children’s Rutter externalising and Rutter internalising scores at age 10. These
analyses reveal that:
The importance of behavioural and emotional problems at age 5 declines
once other factors and cognitive scores at age 10 are taken into account.
There is only a statistically significant link between Rutter scores at age 5
and arithmetic at age 16, but this is no longer the case once externalising
and internalising behaviour are controlled for.
There remains a statistically significant difference by income for arithmetic
scores: children in low‐income families scored lower than children in
middle‐ or high‐income families, even after taking into account parental
education, cognitive scores at age 10, and behavioural and emotional
Disadvantage, behaviour and cognitive outcomes: Longitudinal analysis from age 5 to 16
Early Intervention Foundation
24
problems at age 10. But there are no significant differences in vocabulary
scores once these factors are taken into account.
Higher parental education is associated with higher cognitive scores at age
16, even after taking into account cognitive scores and behaviours at age
10. Children whose parents had a degree scored 0.3 standard deviations
higher on the arithmetic assessment and 0.4 standard deviations higher on
the vocabulary assessment, compared to children whose parents had no
qualifications.
Higher scores on the maths (reading) assessment at age 10 were
unsurprisingly associated with higher scores on the arithmetic (vocabulary)
assessment at age 16. However, higher maths scores at age 10 were also
associated with higher vocabulary scores at 16, while higher reading scores
at age 10 were also associated with higher arithmetic scores at 16.
In the models that additionally control for behavioural and emotional
problems at age 10, higher levels of externalising behaviour were also
associated with slightly lower cognitive scores at age 16, even after
controlling for cognitive scores at age 10.
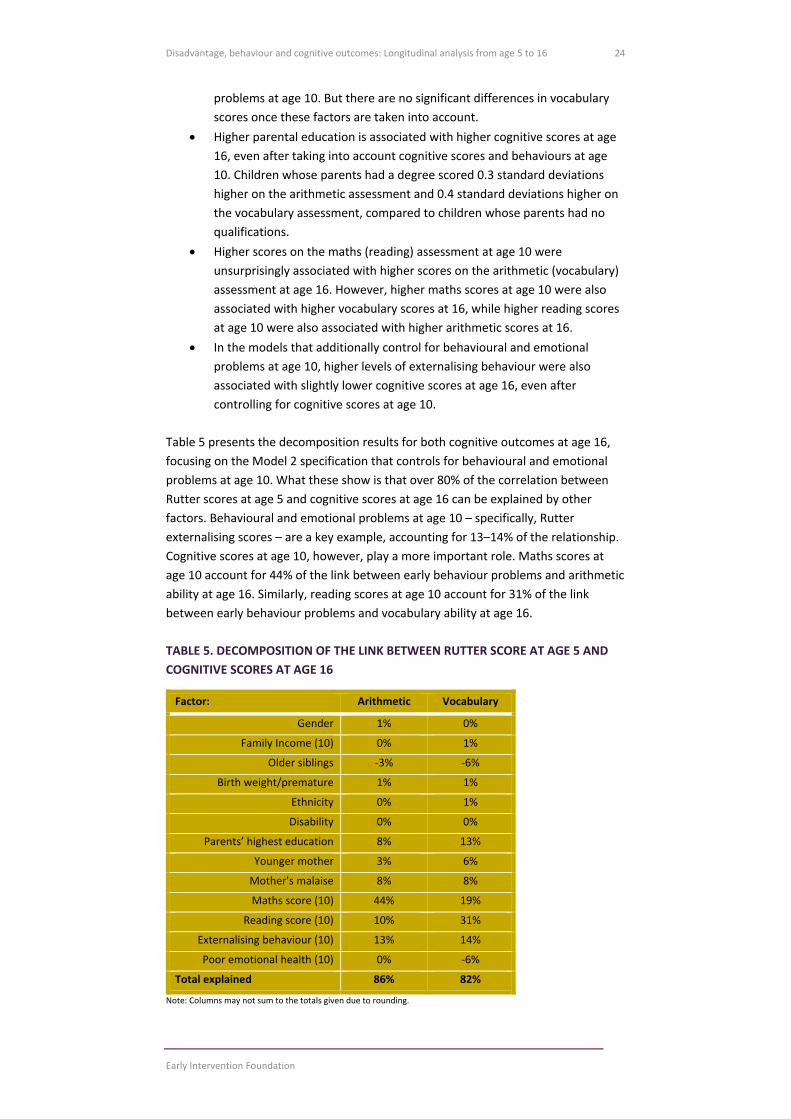
Table 5 presents the decomposition results for both cognitive outcomes at age 16,
focusing on the Model 2 specification that controls for behavioural and emotional
problems at age 10. What these show is that over 80% of the correlation between
Rutter scores at age 5 and cognitive scores at age 16 can be explained by other
factors. Behavioural and emotional problems at age 10 – specifically, Rutter
externalising scores – are a key example, accounting for 13–14% of the relationship.
Cognitive scores at age 10, however, play a more important role. Maths scores at
age 10 account for 44% of the link between early behaviour problems and arithmetic
ability at age 16. Similarly, reading scores at age 10 account for 31% of the link
between early behaviour problems and vocabulary ability at age 16.
TABLE 5. DECOMPOSITION OF THE LINK BETWEEN RUTTER SCORE AT AGE 5 AND
COGNITIVE SCORES AT AGE 16
Factor: Arithmetic Vocabulary
Gender 1% 0%
Family Income (10) 0% 1%
Older siblings ‐3% ‐6%
Birth weight/premature 1% 1%
Ethnicity 0% 1%
Disability 0% 0%
Parents’ highest education 8% 13%
Younger mother 3% 6%
Mother's malaise 8% 8%
Maths score (10) 44% 19%
Reading score (10) 10% 31%
Externalising behaviour (10) 13% 14%
Poor emotional health (10) 0% ‐6%
Total explained 86% 82%
Note: Columns may not sum to the totals given due to rounding.
Disadvantage, behaviour and cognitive outcomes: Longitudinal analysis from age 5 to 16
Early Intervention Foundation
25
Summary of results
Children with higher levels of behavioural and emotional problems at age 5 go on to
score less well on measures of cognitive attainment: across different ages and
assessments, the effect size is approximately ‐0.15.
Once other individual and family factors are taken into account, the effect size of
behavioural and emotional problems at age 5 is approximately halved for cognitive
outcomes at age 10, and is usually statistically insignificant for cognitive outcomes at
age 16. The majority of the impact of early behavioural and emotional problems on
future cognitive outcomes can be accounted for by other factors, which may be
linked to early behavioural and emotional problems. For example, parental
education and maternal psychological wellbeing together explain half of the
correlation between age 5 behaviour problems and age 10 cognitive skills.
Of the original correlation between Rutter scores at age 5 and cognitive scores at 16,
over 80% can be explained by other factors that contribute to cognitive scores (and
are also associated with behavioural and emotional problems at age 5). In fact, there
is no independent link between behavioural and emotional problems at age 5 and
cognitive skills at age 16, except via cognitive scores and behaviour at age 10.
Externalising behaviour seems to play more of a role than internalising behaviour. Of
course, these factors themselves will be influenced by behaviour at age 5, so this
does not mean that early behaviour is unimportant. However, it does indicate that if
it can be addressed, early behavioural and emotional problems do not necessarily
have to lead to poorer outcomes at age 16.
Higher parental education is associated with higher cognitive scores, even after
taking into account earlier cognitive scores and behaviours perhaps by being a signal
of ongoing home environments and parenting styles that continue to support
children’s learning into adolescence. Children whose parents had a degree scored
0.3–0.4 standard deviations higher, compared to children whose parents had no
qualifications.
Our findings highlight that cognitive and non‐cognitive trajectories are influenced by
a range of family‐level factors. Parental education and maternal wellbeing
contribute to behaviour and cognitive outcomes, especially earlier in life.
Behavioural and emotional problems at age 5 contribute to behavioural and
emotional problems and lower cognitive scores at age 10, which in turn contribute
to lower cognitive scores at 16. As a result these factors can cast ‘long shadows’.
Disadvantage, behaviour and cognitive outcomes: Longitudinal analysis from age 5 to 16
Early Intervention Foundation
26
Conclusions and policy
implications
Our work identifies significant socioeconomic disparities in behavioural and
emotional and cognitive outcomes. Much of this can be explained by early
environmental and family factors, including parental education and maternal
wellbeing – especially in low‐income families. Since low levels of parental education
and poor psychological wellbeing are more prevalent in disadvantaged communities,
it is not the case that economic disadvantage is irrelevant. Rather, our analysis
identifies a range of channels through which economic disadvantage may negatively
impact on children’s skills and personalities as they develop through childhood and
adolescence.
The results also highlight the potential impact of policies which aim to improve
family circumstances and children’s early behaviour or learning. The evidence
suggests that these factors may be crucial for improving the future outcomes of
disadvantaged children, which may in turn support attempts to improve life chances
and ultimately tackle intergenerational disadvantage. Addressing educational
inequalities between adults has an important role to play, although this is clearly a
long‐term project. In the shorter term, improving maternal psychological wellbeing
and early child behaviour and learning may be suitable targets for intervention.
Assuming the relationships we have uncovered are genuinely causal, our results
suggest that evidence based programmes targeted at low‐income families – which
successfully improved maternal wellbeing and early child behaviour or learning –
could offset or eliminate the socioeconomic disparities in behavioural and emotional
problems or in cognitive outcomes. Such programmes would sit within a local early‐
years system and could be linked to funding for disadvantaged two‐year‐olds. This
would be another tool to consider as part of attempts to promote social mobility and
break intergenerational cycles of disadvantage. Local commissioners and directors of
public health are well placed to lead work in this area as part of the Healthy Child
Agenda.
A number of programmes are available to commission in the UK which have been
found to be effective for addressing these issues: these can be found in EIF’s major
review of parenting programmes, Foundations for Life.33 Child‐Parent
Psychotherapy, Infant‐Parent Psychotherapy, Child First, Incredible Years, Helping
the Noncompliant Child and Family Check‐up also all have evidence of improving
child behaviour and maternal mental health or psychological functioning.
Meanwhile, Family Nurse Partnership, Child First, Let’s Play in Tandem and REAL
33 http://www.eif.org.uk/publication/foundations‐for‐life‐what‐works‐to‐support‐parent‐child‐
interaction‐in‐the‐early‐years/

Disadvantage, behaviour and cognitive outcomes: Longitudinal analysis from age 5 to 16
Early Intervention Foundation
27
have all shown evidence of improving children’s early learning in disadvantaged
communities.34 We do not recommend that these programmes be commissioned off
the shelf as a quick fix. Rather, commissioners should explore these programmes,
along with other evidence‐based activities and innovative local practices, in order to
implement solutions that will work locally given the needs, assets and existing
provision in their area.
Finally, the persistence of early behavioural and emotional issues in to late childhood
and adolescence is relevant to the ongoing debate about the long‐run benefits of
investing in programmes that target early child behaviour. Our findings can be used
in cost–benefit analyses of behaviour programmes, especially when combined with
‘late intervention’ costs that may be associated with behavioural and emotional
problems. As such, this analysis should inform local and national commissioning
strategies for a range of public sector organisations, including not just local
authorities but also police and crime commissioners, and clinical commissioning
groups.
34 See http://www.eif.org.uk/foundationsforlife‐programmereports/ for detailed information on these
programmes.

Disadvantage, behaviour and cognitive outcomes: Longitudinal analysis from age 5 to 16
Early Intervention Foundation
28
REFERENCES
Gelbach, J.B. (2016). When do Covariates Matter? And Which Ones, and How Much?
Journal of Labor Economics, 34(2), 509–543.
Goodman, A., Joshi, H., Nasim, B., & Tyler C. (2015). Social and emotional skills in
childhood and their long‐term effects on adult life: A review for the Early
Intervention Foundation, UCL Institute of Education, University College London.
Hutchings, J., Bywater, T., Daley, D., Gardner, F., Whitaker, C., Jones, K., Eames, C., &
Edwards, R.T., (2007). Parenting intervention in Sure Start services for children at
risk of developing conduct disorder: pragmatic randomised controlled trial. BMJ,
334.
Rutter, M., Tizard, J., & Whitmore K. (1970). Education, health and behaviour,
London: Longman.
Scott, S., Briskman, J., & O’Connor, T. (2014). Early Prevention of Antisocial
Personality: Long‐Term Follow‐Up of Two Randomized Controlled Trials
Comparing Indicated and Selective Approaches. American Journal of Psychiatry,
171, 649–657.
Scott, S., Spender, Q., Doolan, M., Jacobs, B., & Aspland, H. (2001). Multicentre
controlled trial of parenting groups for childhood antisocial behaviour in clinical
practice. BMJ, 323, 1–7.

Disadvantage, behaviour and cognitive outcomes: Longitudinal analysis from age 5 to 16
Early Intervention Foundation
29
Annex A
TABLE A1. ITEMS INCLUDED IN THE RUTTER TOTAL BEHAVIOUR SCORE
Item Statement about child
1 Very restless. Often running about or jumping up and down. Hardly ever still.
2 Is squirmy or fidgety.
3 Often destroys own or others’ belongings.
4 Frequently fights other children.
5 Not much liked by other children.
6 Often worried, worries about many things.
7 Tends to do things on his/her own – rather solitary.
8 Irritable. Is quick to fly off the handle.
9 Often appears miserable, unhappy, tearful or distressed.
10 Sometimes takes things belonging to others.
11 Has twitches, mannerisms or tics of the face or body.
12 Frequently sucks thumb or finger.
13 Frequently bites nails or fingers.
14 Is often disobedient.
15 Cannot settle to anything for more than a few moments.
16 Tends to be fearful or afraid of new things or new situations.
17 Is over fussy or over particular.
18 Often tells lies.
19 Bullies other children.

Disadvantage, behaviour and cognitive outcomes: Longitudinal analysis from age 5 to 16
Early Intervention Foundation
30
TABLE A2. ITEMS INCLUDED IN THE MALAISE INVENTORY
Item Statement about child
1 Do you often have backache?
2 Do you feel tired most of the time?
3 Do you often feel depressed?
4 Do you often have bad headaches?
5 Do you often get worried about things?
6 Do you usually have great difficulty in falling or staying asleep?
7 Do you usually wake unnecessarily early in the morning?
8 Do you wear yourself out worrying about your health?
9 Do you often get into a violent rage?
10 Do people annoy and irritate you?
11 Have you at times had a twitching of the face, head or shoulders?
12 Do you suddenly become scared for no good reason?
13 Are you scared to be alone when there are not friends near you?
14 Are you easily upset or irritated?
15 Are you frightened of going out alone or of meeting people?
16 Are you constantly keyed up and jittery?
17 Do you suffer from indigestion?
18 Do you suffer from an upset stomach?
19 Is your appetite poor?
20 Does every little thing get on your nerves and wear you out?
21 Does your heart often race like mad?
22 Do you often have bad pain in your eyes?
23 Are you troubled with rheumatism or fibrosis?
24 Have you ever had a nervous breakdown?
Disadvantage, behaviour and cognitive outcomes: Longitudinal analysis from age 5 to 16
Early Intervention Foundation
31
Annex B
TABLE B1. RAW GRADIENTS IN RUTTER BEHAVIOUR SCORE AT AGE 10
Social class Gender Ethnicity Combined
Low social class 0.219*** 0.206***
Male 0.155*** 0.154***
Irish 0.0339 0.0509
Other European 0.173 0.0891
Caribbean 0.236** 0.251***
Indian 0.201** 0.150
Pakistani ‐0.0893 0.181
Bangladeshi 0.158 0.0852
Other ethnic group 0.0812 0.237
Constant ‐0.0144 ‐0.0842*** ‐0.00649 ‐0.100***
Observations 10,608 10,821 11,562 10,564
R‐squared 0.001 0.006 0.001 0.008
Notes: Standard errors in parentheses. *** p<0.01, ** p<0.05, * p<0.1
TABLE B2. PATTERNS IN RUTTER BEHAVIOUR SCORE AT AGE 10 AFTER
CONTROLLING FOR OTHER FACTORS
Model 1 Model 2
Low social class 0.0520 0.0220
Male 0.149*** 0.0910***
Irish 0.0240 0.0578
Other European 0.140 0.107
Caribbean 0.143 ‐0.0433
Indian 0.148 0.176
Pakistani 0.360 0.571*
Bangladeshi 0.554 0.281
Other ethnic group 0.282 0.516
Older sibling(s) (age 5) ‐0.0360 0.0217
Birth weight quintile 2 0.0135 0.0252
Birth weight quintile 3 ‐0.0396 ‐0.0158
Birth weight quintile 4 ‐0.0387 ‐0.0122
Birth weight quintile 5 ‐0.0314 ‐0.0090
Born premature ‐0.167*** ‐0.110**
Disabled (age 10) 0.456*** 0.379***
Other qualifications 0.0221 ‐0.0426
O Levels or equivalent ‐0.145*** ‐0.132***
Vocational qualifications ‐0.0640* ‐0.0563*
A Levels or equivalent ‐0.195*** ‐0.161***
SRN/CertEd qualifications ‐0.122** ‐0.113**
Degree or higher qualifications ‐0.242*** ‐0.196***
Disadvantage, behaviour and cognitive outcomes: Longitudinal analysis from age 5 to 16
Early Intervention Foundation
32
Missing qualifications ‐0.00323 0.0981
Mother under 24 at birth 0.0918*** 0.0261
Mother’s Malaise Inventory 0.0661*** 0.0273***
Rutter Total score (age 5) 0.367***
Constant ‐0.328*** ‐0.165***
Observations 7,374 7,085
Adjusted R‐squared 0.112 0.223
Notes: Standard errors in parentheses. *** p<0.01, ** p<0.05, * p<0.1
TABLE B2.1. TABLE B2 (MODEL 2), USING AGE 10 SUBSCALES
Rutter Total Rutter
Externalising Rutter
Internalising
Low social class 0.0220 0.0408 ‐0.0181
Male 0.0910*** 0.249*** ‐0.126***
Irish 0.0578 ‐0.161 0.385**
Other European 0.107 0.0555 0.0781
Caribbean ‐0.0433 0.0725 ‐0.184
Indian 0.176 0.184 0.0669
Pakistani 0.571* 0.465 0.159
Bangladeshi 0.281 ‐0.524 ‐0.129
Other ethnic group 0.516 0.401 0.497
Older sibling(s) (age 5) 0.0217 0.132*** ‐0.127***
Birth weight quintile 2 0.0252 0.0357 0.0339
Birth weight quintile 3 ‐0.0158 ‐0.0228 0.0170
Birth weight quintile 4 ‐0.0122 ‐0.0144 0.0120
Birth weight quintile 5 ‐0.0090 ‐0.0121 0.0770**
Born premature ‐0.110** ‐0.0757 ‐0.0932*
Disabled (age 10) 0.379*** 0.294*** 0.301***
Other qualifications ‐0.0426 0.00903 ‐0.0367
O Levels or equivalent ‐0.132*** ‐0.166*** ‐0.0460
Vocational qualifications ‐0.0563* ‐0.0851*** 0.0154
A Levels or equivalent ‐0.161*** ‐0.243*** ‐0.0224
SRN/CertEd qualifications ‐0.113** ‐0.125** ‐0.0984*
Degree or higher qualifications ‐0.196*** ‐0.283*** ‐0.0645*
Missing qualifications 0.0981 0.0489 0.166*
Mother under 24 at birth 0.0261 0.0874*** 0.0190
Mother’s Malaise Inventory 0.0273*** 0.0184*** 0.0391***
Rutter Total score (age 5) 0.367*** 0.311*** 0.242***
Constant ‐0.165*** ‐0.280*** ‐0.0696*
Observations 7,085 7,273 7,529
Adjusted R‐squared 0.223 0.197 0.131
Notes: Standard errors in parentheses. *** p<0.01, ** p<0.05, * p<0.1
Disadvantage, behaviour and cognitive outcomes: Longitudinal analysis from age 5 to 16
Early Intervention Foundation
33
TABLE B2.2. TABLE B2 (MODEL 2), USING AGE 5 AND AGE 10 SUBSCALES
Rutter Total Rutter
Externalising Rutter
Internalising
Low social class 0.0177 0.0229 ‐0.0107
Male 0.0456** 0.173*** ‐0.126***
Irish 0.0542 ‐0.127 0.329*
Other European 0.141 0.0842 0.0974
Caribbean ‐0.0177 0.0661 ‐0.128
Indian 0.182 0.169 0.0855
Pakistani 0.560* 0.486* 0.120
Bangladeshi 0.414 ‐0.465 0.0109
Other ethnic group 0.397 0.257 0.448
Older sibling(s) (age 5) ‐0.0351 0.0873*** ‐0.167***
Birth weight quintile 2 0.0209 0.0358 0.0405
Birth weight quintile 3 ‐0.0193 ‐0.0159 0.0177
Birth weight quintile 4 ‐0.0208 ‐0.0156 0.00653
Birth weight quintile 5 ‐0.0132 ‐0.00737 0.0659*
Born premature ‐0.138** ‐0.0817 ‐0.126**
Disabled (age 10) 0.419*** 0.308*** 0.343***
Other qualifications ‐0.0298 0.0115 ‐0.0217
O Levels or equivalent ‐0.131*** ‐0.157*** ‐0.0518*
Vocational qualifications ‐0.0614* ‐0.0815** 0.00458
A Levels or equivalent ‐0.150*** ‐0.211*** ‐0.0327
SRN/CertEd qualifications ‐0.0963* ‐0.0971* ‐0.0965
Degree or higher qualifications ‐0.179*** ‐0.244*** ‐0.0758**
Missing qualifications 0.0369 0.0101 0.131
Mother under 24 at birth 0.0237 0.0596*** 0.0357
Mother’s Malaise Inventory 0.0397*** 0.0187*** 0.0560***
Rutter Externalising (age 5) 0.313*** 0.387*** 0.103***
Constant ‐0.153*** ‐0.209*** ‐0.117***
Observations 7,186 7,386 7,642
Adjusted R‐squared 0.195 0.245 0.093
Notes: Standard errors in parentheses. *** p<0.01, ** p<0.05, * p<0.1
Disadvantage, behaviour and cognitive outcomes: Longitudinal analysis from age 5 to 16
Early Intervention Foundation
34
TABLE B3. RAW GRADIENTS IN RUTTER BEHAVIOUR SCORE AT AGE 16
Gender Income Ethnicity Combined
Male ‐0.0164 ‐0.0106
Low‐income 0.184*** 0.156***
High‐income ‐0.145*** ‐0.145***
Irish 0.139 ‐0.0166
Other European 0.374** 0.131
Caribbean 0.260* 0.0464
Indian 0.454*** 0.310***
Pakistani 0.583*** 0.574***
Bangladeshi ‐0.550 ‐0.232
Other ethnic group ‐0.0833 0.0687
Constant ‐0.000494 ‐0.0203 ‐0.0240** ‐0.0218
Observations 7,245 6,473 7,037 6,081
R‐squared 0.000 0.013 0.006 0.014
Notes: Standard errors in parentheses. *** p<0.01, ** p<0.05, * p<0.1
TABLE B4. PATTERNS IN RUTTER BEHAVIOUR SCORE AT AGE 16 AFTER
CONTROLLING FOR OTHER FACTORS
Model 1 Model 2
Male 0.0090 ‐0.0469*
Low‐income 0.0400 0.0469
High‐income ‐0.0217 ‐0.0081
Irish ‐0.212 ‐0.107
Other European ‐0.0852 ‐0.0136
Caribbean ‐0.0315 0.0415
Indian 0.380** 0.423***
Pakistani 2.026*** 1.824***
Bangladeshi ‐0.730 ‐0.846
Other ethnic group ‐0.664 ‐0.357
Older sibling(s) (age 5) ‐0.0226 0.0292
Birth weight quintile 2 ‐0.0602 ‐0.0567
Birth weight quintile 3 ‐0.0890* ‐0.0616
Birth weight quintile 4 ‐0.127*** ‐0.0784*
Birth weight quintile 5 ‐0.0707 ‐0.0183
Born premature 0.0171 0.0970
Disabled (age 10) 0.337*** 0.225***
Other qualifications ‐0.0392 ‐0.00584
O Levels or equivalent ‐0.0351 ‐0.000568
Vocational qualifications ‐0.0904** ‐0.0443
A Levels or equivalent ‐0.0573 0.0271
SRN/CertEd qualifications 0.0145 0.0964
Degree or higher qualifications ‐0.160*** ‐0.0600
Missing qualifications 0.0504 0.118
Mother under 24 at birth 0.0828*** 0.0293
Mother’s Malaise Inventory 0.0590*** 0.0221***
Externalising behaviour (10) 0.191***

Disadvantage, behaviour and cognitive outcomes: Longitudinal analysis from age 5 to 16
Early Intervention Foundation
35
Internalising behaviour (10) 0.125***
Rutter Total score (age 5) 0.202***
Constant ‐0.226*** ‐0.0909*
Observations 4,467 3,816
R‐squared 0.083 0.212
Notes: Standard errors in parentheses. *** p<0.01, ** p<0.05, * p<0.1
TABLE B4.1. TABLE B4 (MODEL 2), USING AGE 5 AND AGE 16 SUBSCALES
Rutter Total
Rutter Externalising
Rutter Total
Rutter Externalising
Male ‐0.0469* 0.105*** 0.0382 0.103***
Low‐income 0.0469 ‐0.00427 ‐0.00109 0.00212
High‐income ‐0.0081 0.0658** ‐0.0618** 0.0486*
Irish ‐0.107 0.0597 ‐0.146 0.0440
Other European ‐0.0136 0.0249 ‐0.0201 0.0234
Caribbean 0.0415 0.258 0.0315 0.226
Indian 0.423*** 0.244 0.406** 0.254
Pakistani 1.824*** 1.466** 1.837*** 1.524***
Bangladeshi ‐0.846 ‐0.775 ‐0.791 ‐0.763
Other ethnic group ‐0.357 ‐0.601 ‐0.313 ‐0.595
Older sibling(s) (age 5) 0.0292 0.0873*** 0.00334 0.0731***
Birth weight quintile 2 ‐0.0567 ‐0.0307 ‐0.0633 ‐0.0335
Birth weight quintile 3 ‐0.0616 ‐0.0745* ‐0.0715 ‐0.0832*
Birth weight quintile 4 ‐0.0784* ‐0.0213 ‐0.0959** ‐0.0356
Birth weight quintile 5 ‐0.0183 ‐0.0101 ‐0.0273 ‐0.0159
Born premature 0.0970 0.0440 0.0697 0.0266
Disabled (age 10) 0.225*** 0.210*** 0.222*** 0.207***
Other qualifications ‐0.00584 ‐0.201 ‐0.0123 ‐0.209*
O Levels or equivalent ‐0.000568 ‐0.0200 ‐0.00497 ‐0.0261
Vocational qualifications ‐0.0443 ‐0.0312 ‐0.0634 ‐0.0498
A Levels or equivalent 0.0271 0.00594 0.0260 0.00971
SRN/CertEd qualifications 0.0964 0.0289 0.0916 0.0251
Degree or higher qualifications ‐0.0600 ‐0.0297 ‐0.0649 ‐0.0334
Missing qualifications 0.118 0.162 0.0804 0.129
Mother under 24 at birth 0.0293 0.0758*** 0.0256 0.0675**
Mother’s Malaise Inventory 0.0221*** 0.0115*** 0.0277*** 0.0129***
Externalising behaviour (10) 0.191*** 0.335*** 0.173*** 0.304***
Internalising behaviour (10) 0.125*** ‐0.0622*** 0.159*** ‐0.0344**
Rutter Total score (5) 0.202*** 0.151***
Rutter Externalising score (5) 0.174*** 0.177***
Constant ‐0.0909* ‐0.181*** ‐0.0719 ‐0.150***
Observations 3,816 4,023 3,858 4,068
R‐squared 0.212 0.206 0.202 0.212
Notes: Standard errors in parentheses. *** p<0.01, ** p<0.05, * p<0.1

Disadvantage, behaviour and cognitive outcomes: Longitudinal analysis from age 5 to 16
Early Intervention Foundation
36
TABLE B5. PATTERNS IN RUTTER BEHAVIOUR SCORE AT AGE 16 AFTER
CONTROLLING FOR OTHER FACTORS, BY INCOME GROUP
Low income Middle income High income
Male ‐0.0245 ‐0.0700* 0.0442
Irish 0.243 ‐0.600* ‐
Other European 0.533 0.121 ‐0.0819
Caribbean ‐0.155 0.0110 ‐0.563
Indian 1.202*** 0.148 0.235
Pakistani 3.565*** 0.292 ‐
Bangladeshi ‐ ‐ ‐
Other ethnic group ‐0.261 ‐ ‐
Older sibling(s) (age 5) 0.0420 ‐0.0368 0.151**
Birth weight quintile 2 ‐0.0804 ‐0.0417 ‐0.0963
Birth weight quintile 3 ‐0.127 ‐0.0724 ‐0.176*
Birth weight quintile 4 ‐0.00640 ‐0.0696 ‐0.136
Birth weight quintile 5 ‐0.0193 ‐0.00119 ‐0.125
Born premature 0.196 0.0577 ‐0.0572
Disabled (age 10) 0.0897 0.195** 0.122
Other qualifications ‐0.0740 ‐0.0850 ‐0.221
O Levels or equivalent 0.0521 0.0625 ‐0.0514
Vocational qualifications ‐0.197 0.0105 ‐0.108
A Levels or equivalent 0.276 0.0634 ‐0.0521
SRN/CertEd qualifications 0.00614 0.216** ‐0.0640
Degree or higher qualifications ‐0.0021 0.0487 ‐0.190*
Missing qualifications 0.0160 0.128 0.176
Mother under 24 at birth 0.0479 ‐0.00528 0.0286
Mother’s Malaise Inventory 0.0329*** 0.0232*** 0.0135
Maths (10) ‐0.133** ‐0.0490* ‐0.0909**
Reading (10) 0.0394 ‐0.0223 0.0355
Externalising behaviour (10) 0.165*** 0.202*** 0.166***
Poor emotional health (10) 0.133*** 0.109*** 0.129***
Rutter total behaviour score (5) 0.220*** 0.184*** 0.209***
Constant ‐0.137 ‐0.0810 0.0145
Observations 582 1,927 776
R‐squared 0.257 0.219 0.192
Notes: Standard errors in parentheses. *** p<0.01, ** p<0.05, * p<0.1
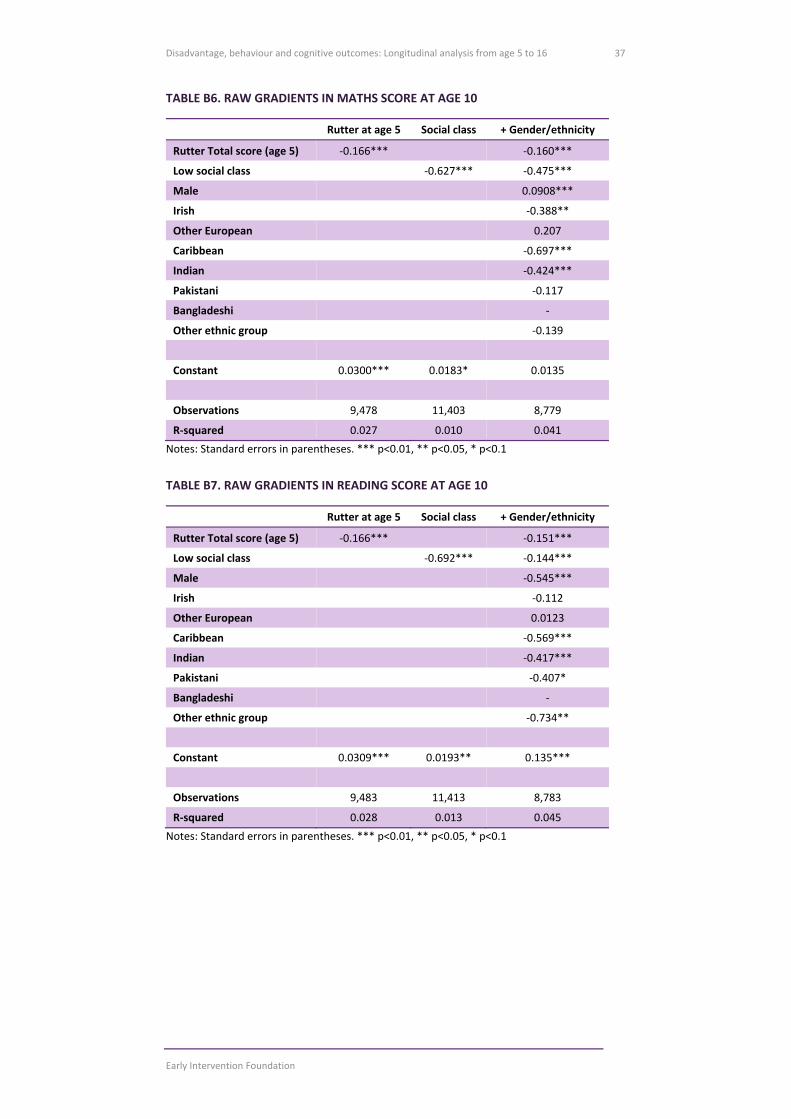
Disadvantage, behaviour and cognitive outcomes: Longitudinal analysis from age 5 to 16
Early Intervention Foundation
37
TABLE B6. RAW GRADIENTS IN MATHS SCORE AT AGE 10
Rutter at age 5 Social class + Gender/ethnicity
Rutter Total score (age 5) ‐0.166*** ‐0.160***
Low social class ‐0.627*** ‐0.475***
Male 0.0908***
Irish ‐0.388**
Other European 0.207
Caribbean ‐0.697***
Indian ‐0.424***
Pakistani ‐0.117
Bangladeshi ‐
Other ethnic group ‐0.139
Constant 0.0300*** 0.0183* 0.0135
Observations 9,478 11,403 8,779
R‐squared 0.027 0.010 0.041
Notes: Standard errors in parentheses. *** p<0.01, ** p<0.05, * p<0.1
TABLE B7. RAW GRADIENTS IN READING SCORE AT AGE 10
Rutter at age 5 Social class + Gender/ethnicity
Rutter Total score (age 5) ‐0.166*** ‐0.151***
Low social class ‐0.692*** ‐0.144***
Male ‐0.545***
Irish ‐0.112
Other European 0.0123
Caribbean ‐0.569***
Indian ‐0.417***
Pakistani ‐0.407*
Bangladeshi ‐
Other ethnic group ‐0.734**
Constant 0.0309*** 0.0193** 0.135***
Observations 9,483 11,413 8,783
R‐squared 0.028 0.013 0.045
Notes: Standard errors in parentheses. *** p<0.01, ** p<0.05, * p<0.1
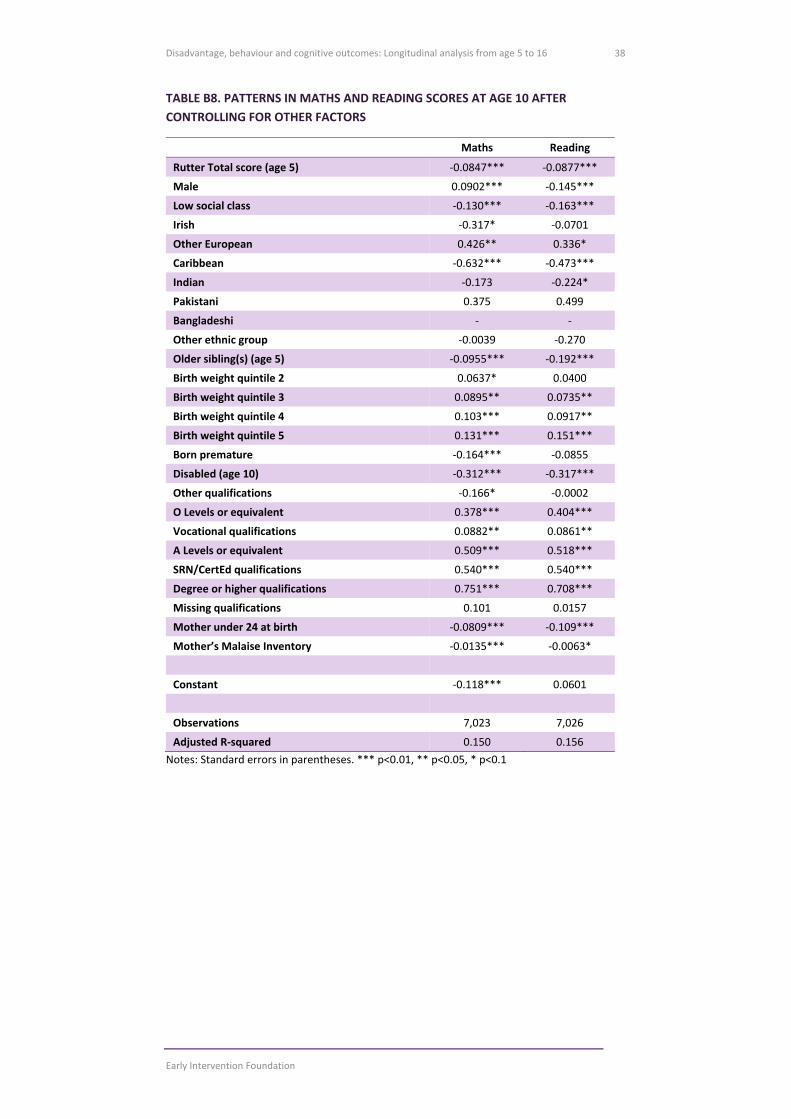
Disadvantage, behaviour and cognitive outcomes: Longitudinal analysis from age 5 to 16
Early Intervention Foundation
38
TABLE B8. PATTERNS IN MATHS AND READING SCORES AT AGE 10 AFTER
CONTROLLING FOR OTHER FACTORS
Maths Reading
Rutter Total score (age 5) ‐0.0847*** ‐0.0877***
Male 0.0902*** ‐0.145***
Low social class ‐0.130*** ‐0.163***
Irish ‐0.317* ‐0.0701
Other European 0.426** 0.336*
Caribbean ‐0.632*** ‐0.473***
Indian ‐0.173 ‐0.224*
Pakistani 0.375 0.499
Bangladeshi ‐ ‐
Other ethnic group ‐0.0039 ‐0.270
Older sibling(s) (age 5) ‐0.0955*** ‐0.192***
Birth weight quintile 2 0.0637* 0.0400
Birth weight quintile 3 0.0895** 0.0735**
Birth weight quintile 4 0.103*** 0.0917**
Birth weight quintile 5 0.131*** 0.151***
Born premature ‐0.164*** ‐0.0855
Disabled (age 10) ‐0.312*** ‐0.317***
Other qualifications ‐0.166* ‐0.0002
O Levels or equivalent 0.378*** 0.404***
Vocational qualifications 0.0882** 0.0861**
A Levels or equivalent 0.509*** 0.518***
SRN/CertEd qualifications 0.540*** 0.540***
Degree or higher qualifications 0.751*** 0.708***
Missing qualifications 0.101 0.0157
Mother under 24 at birth ‐0.0809*** ‐0.109***
Mother’s Malaise Inventory ‐0.0135*** ‐0.0063*
Constant ‐0.118*** 0.0601
Observations 7,023 7,026
Adjusted R‐squared 0.150 0.156
Notes: Standard errors in parentheses. *** p<0.01, ** p<0.05, * p<0.1
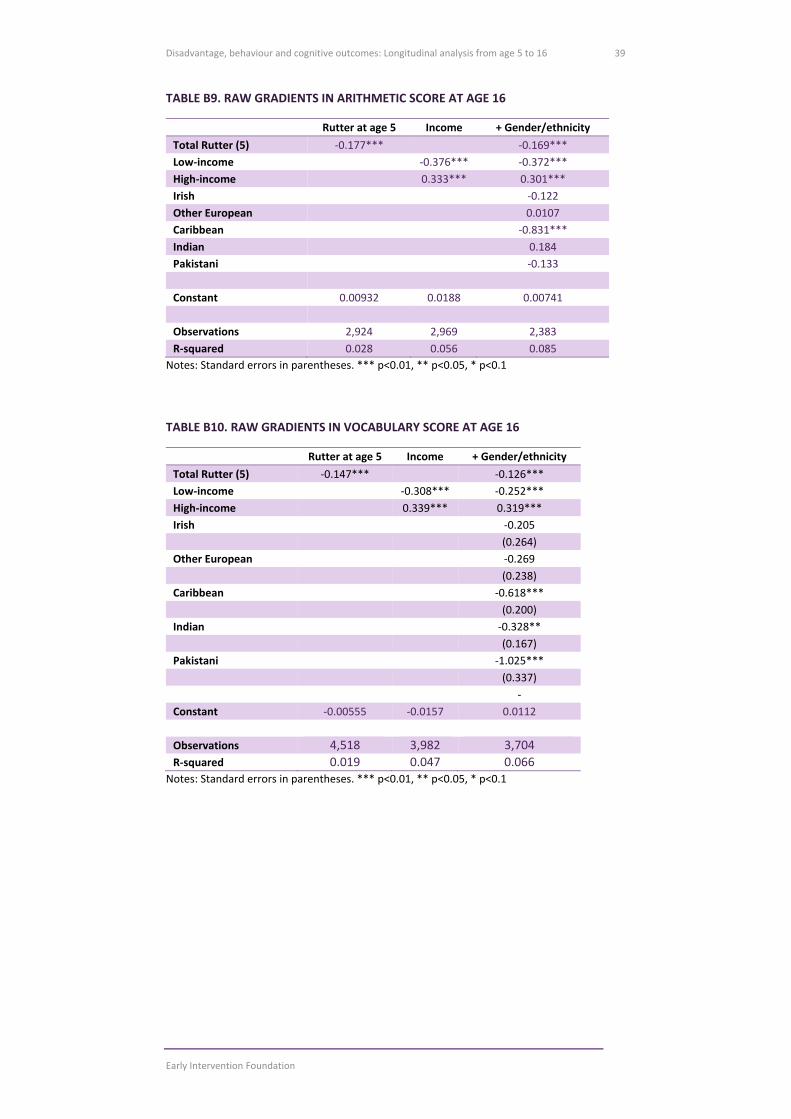
Disadvantage, behaviour and cognitive outcomes: Longitudinal analysis from age 5 to 16
Early Intervention Foundation
39
TABLE B9. RAW GRADIENTS IN ARITHMETIC SCORE AT AGE 16
Rutter at age 5 Income + Gender/ethnicity
Total Rutter (5) ‐0.177*** ‐0.169***
Low‐income ‐0.376*** ‐0.372***
High‐income 0.333*** 0.301***
Irish ‐0.122
Other European 0.0107
Caribbean ‐0.831***
Indian 0.184
Pakistani ‐0.133
Constant 0.00932 0.0188 0.00741
Observations 2,924 2,969 2,383
R‐squared 0.028 0.056 0.085
Notes: Standard errors in parentheses. *** p<0.01, ** p<0.05, * p<0.1
TABLE B10. RAW GRADIENTS IN VOCABULARY SCORE AT AGE 16
Rutter at age 5 Income + Gender/ethnicity
Total Rutter (5) ‐0.147*** ‐0.126***
Low‐income ‐0.308*** ‐0.252***
High‐income 0.339*** 0.319***
Irish ‐0.205
(0.264)
Other European ‐0.269
(0.238)
Caribbean ‐0.618***
(0.200)
Indian ‐0.328**
(0.167)
Pakistani ‐1.025***
(0.337)
‐
Constant ‐0.00555 ‐0.0157 0.0112
Observations 4,518 3,982 3,704
R‐squared 0.019 0.047 0.066 Notes: Standard errors in parentheses. *** p<0.01, ** p<0.05, * p<0.1
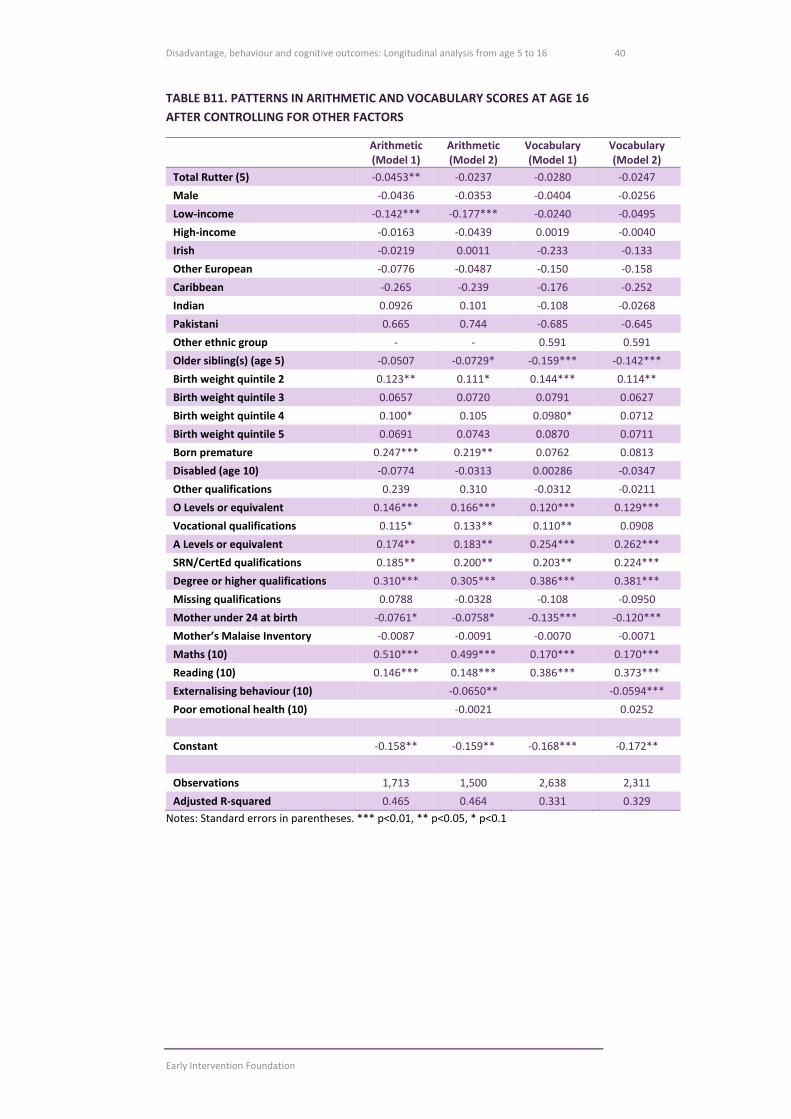
Disadvantage, behaviour and cognitive outcomes: Longitudinal analysis from age 5 to 16
Early Intervention Foundation
40
TABLE B11. PATTERNS IN ARITHMETIC AND VOCABULARY SCORES AT AGE 16
AFTER CONTROLLING FOR OTHER FACTORS
Arithmetic (Model 1)
Arithmetic (Model 2)
Vocabulary (Model 1)
Vocabulary (Model 2)
Total Rutter (5) ‐0.0453** ‐0.0237 ‐0.0280 ‐0.0247
Male ‐0.0436 ‐0.0353 ‐0.0404 ‐0.0256
Low‐income ‐0.142*** ‐0.177*** ‐0.0240 ‐0.0495
High‐income ‐0.0163 ‐0.0439 0.0019 ‐0.0040
Irish ‐0.0219 0.0011 ‐0.233 ‐0.133
Other European ‐0.0776 ‐0.0487 ‐0.150 ‐0.158
Caribbean ‐0.265 ‐0.239 ‐0.176 ‐0.252
Indian 0.0926 0.101 ‐0.108 ‐0.0268
Pakistani 0.665 0.744 ‐0.685 ‐0.645
Other ethnic group ‐ ‐ 0.591 0.591
Older sibling(s) (age 5) ‐0.0507 ‐0.0729* ‐0.159*** ‐0.142***
Birth weight quintile 2 0.123** 0.111* 0.144*** 0.114**
Birth weight quintile 3 0.0657 0.0720 0.0791 0.0627
Birth weight quintile 4 0.100* 0.105 0.0980* 0.0712
Birth weight quintile 5 0.0691 0.0743 0.0870 0.0711
Born premature 0.247*** 0.219** 0.0762 0.0813
Disabled (age 10) ‐0.0774 ‐0.0313 0.00286 ‐0.0347
Other qualifications 0.239 0.310 ‐0.0312 ‐0.0211
O Levels or equivalent 0.146*** 0.166*** 0.120*** 0.129***
Vocational qualifications 0.115* 0.133** 0.110** 0.0908
A Levels or equivalent 0.174** 0.183** 0.254*** 0.262***
SRN/CertEd qualifications 0.185** 0.200** 0.203** 0.224***
Degree or higher qualifications 0.310*** 0.305*** 0.386*** 0.381***
Missing qualifications 0.0788 ‐0.0328 ‐0.108 ‐0.0950
Mother under 24 at birth ‐0.0761* ‐0.0758* ‐0.135*** ‐0.120***
Mother’s Malaise Inventory ‐0.0087 ‐0.0091 ‐0.0070 ‐0.0071
Maths (10) 0.510*** 0.499*** 0.170*** 0.170***
Reading (10) 0.146*** 0.148*** 0.386*** 0.373***
Externalising behaviour (10) ‐0.0650** ‐0.0594***
Poor emotional health (10) ‐0.0021 0.0252
Constant ‐0.158** ‐0.159** ‐0.168*** ‐0.172**
Observations 1,713 1,500 2,638 2,311
Adjusted R‐squared 0.465 0.464 0.331 0.329
Notes: Standard errors in parentheses. *** p<0.01, ** p<0.05, * p<0.1