a feature extraction method for vibration signal of bearing incipient degradation · 2016-06-08 ·...
TRANSCRIPT

MEASUREMENT SCIENCE REVIEW, 16, (2016), No. 3, 149-159
_________________ DOI: 10.1515/msr-2016-0018
149
A Feature Extraction Method for Vibration Signal of Bearing Incipient Degradation Haifeng Huang1,2, Huajiang Ouyang1,3, Hongli Gao1, Liang Guo1, Dan Li1, Juan Wen1
1 School of Mechanical Engineering, Southwest Jiaotong University, 111 Section One, North Second Ring Road, 610031, Chengdu, China, [email protected] 2 School of Transportation and Logistics, Southwest Jiaotong University, 111 Section One, North Second Ring Road, 610031, Chengdu, China 3 School of Engineering, University of Liverpool, the Quadrangle, L69 3GH, Liverpool, U.K.
Detection of incipient degradation demands extracting sensitive features accurately when signal-to-noise ratio (SNR) is very poor, which appears in most industrial environments. Vibration signals of rolling bearings are widely used for bearing fault diagnosis. In this paper, we propose a feature extraction method that combines Blind Source Separation (BSS) and Spectral Kurtosis (SK) to separate independent noise sources. Normal, and incipient fault signals from vibration tests of rolling bearings are processed. We studied 16 groups of vibration signals (which all display an increase in kurtosis) of incipient degradation after they are processed by a BSS filter. Compared with conventional kurtosis, theoretical studies of SK trends show that the SK levels vary with frequencies and some experimental studies show that SK trends of measured vibration signals of bearings vary with the amount and level of impulses in both vibration and noise signals due to bearing faults. It is found that the peak values of SK increase when vibration signals of incipient faults are processed by a BSS filter. This pre-processing by a BSS filter makes SK more sensitive to impulses caused by performance degradation of bearings. Keywords: Feature extraction, incipient degradation, bearing, Blind Separation Source, Spectral Kurtosis. 1. INTRODUCTION
Rolling bearings play a very important role in modern industry and they are widely used for bearing radial and axial loads of rotating components in many machines [1]. The performance of rolling bearings affects the performance of vehicles, airplanes and other machines installed with bearings. Once bearing faults occur they may cause machines to malfunction and even fail, which leads to financial losses and even fatal incidents. Nowadays, people employ excessive maintenance to try reducing accidents of trains and airplanes caused by rolling bearing faults. However, excessive maintenance may not help rolling bearings reach their designed life and it incurs serious economic costs. Thus, condition-based maintenance (CBM) is being implemented to avoid excessive maintenance. A CBM program consists of three key steps: data acquisition, data processing, and maintenance decision-making [1]-[3].
Evaluating performance and fault diagnosis accurately are very important for maintenance decision-making and people have paid more attention to bearing fault diagnosis. Liu et al. analyzed acoustic signals for locomotive bearing fault diagnosis based on correlation filtering analysis and constructed Parametric-Mother-Doppler-Wavelet (PMDW) model with six parameters [4]. Liang and Faghidi reported
an enhanced energy operator (EEO) method to detect bearing faults and this method has its simplicity, computational efficiency and the elimination of the band pass filtering step [5]. Wang and Shen introduced an equivalent cyclic energy indicator (ECEI) based on the cyclic spectral analysis method for bearing performance degradation assessment [6]. Fatima et al. classified faults and unbalance using support vector machines (SVMs) and provided a classification of 75 % or better [7]. Shen et al. developed a parameterized Doppler distorted model by which bearing faults can be successfully detected from the parameters of the Doppler distorted correlation matching model due to its maximum similarity to the real signal [8]. Chen et al. developed an innovative anomaly bearing fault detection strategy based on multi-sensing variables and a series of statistical data-driven approaches by which the false alarm rate could be reduced by 20 % compared with other conventional threshold methods [9]. Shen et al. proposed a new two-layer structure consisting of support vector regression machines (SVRMs) to recognize bearing fault patterns and track the fault sizes [10].
In practice, real vibration signals of rolling bearings usually have a poor signal-to-noise ratio (SNR), especially in early stages of performance degradation. SNR of early
Journal homepage: http://www.degruyter.com/view/j/msr

MEASUREMENT SCIENCE REVIEW, 16, (2016), No. 3, 149-159
150
degradation signals of bearings is very poor in real noisy environment and it is more difficult to capture a slight change of bearing performance [3].
Some signal processing techniques and algorithms have been presented in literatures for processing poor SNR signals of bearing vibration. Hamadache and Lee proposed a feature extraction framework based on principal component analysis (PCA) for improving SNR of vibration signals of rolling elements [11]. They assumed that all principal components followed a Gaussian distribution.
Wavelet methods are used widely in de-noising. Bao et al. proposed an anti-aliasing lifting scheme to solve frequency aliasing of wavelet transforms [12] and test results showed that the anti-aliasing lifting scheme performed better than the conventional lifting scheme and the redundant lifting scheme. The key of an anti-aliasing lifting scheme is how to select the right thresholds.
Han et al. improved the FastICA (Fast Independent Component Analysis) algorithm by using an algorithm with third-order convergence and increased the convergence speed over the second-order Newton iterative method, and extracted features from vibration signals of bearings having a mixed fault [13]. Compressed sensing, dictionary learning and two-dimensional edge detection were all used for extracting features of weak signals [14]-[15].
Another method for processing poor SNR signals is presented in this paper based on Blind Source Separation (BSS) and Spectral Kurtosis (SK) by which features of bearing performance states are extracted. For clarification, we define measured vibration data as measured vibration signals which consist of pure vibration signals and noise signals. It is the pure vibration signals we want to deal with but we have to cope with measured vibration signals that contain noise.
In real applications pure vibration signals of bearings are always buried in measured vibration signals. SK levels would be affected by noise impulses. This drawback of SK can be overcome effectively in this paper by using the BSS filter. On the other hand, the FastICA method, one of the BSS methods, can only separate independent signals. Faced with this shortcoming, pure vibration signals of bearings are perceived as one vibration source and noise signals are perceived as another signal source. In this sense, the FastICA method can filter noise signals successfully.
The paper is organized as follows. In section 2 we present the characteristics of bearing vibration and describe a bearing test rig. We briefly provide a definition of Blind Source Separation (BSS) and compare BSS results of some typical signals. Then we propose a signal processing program in section 2. Section 3 introduces Spectral Kurtosis (SK) and demonstrates advantages of feature extraction by BSS and SK methods by means of three simple cases. The method is applied in section 4 to a complicated real case of processing vibration signals of faulty bearings and simulation results show that this method is effective to extract features of incipient degradation of bearings when compared with experimental results.
2. VIBRATION OF ROLLING BEARINGS A performance change of rolling bearings is a slow
gradual process during service. As a result, vibration characteristics are always varying along with a performance decline. However, performance varying processes of rolling balls, rings or cage are very different. Their declining performance trends are related to loads, working environment and installation of rolling bearings. Some vibration data of rolling bearings are posted by the NSF I/UCR Center for Intelligent Maintenance Systems (IMS – www.imscenter.net) from Rexnord Corp. in Milwaukee, WI [16]-[17], which include normal, incipient degradation and fault signals and are used in this paper.
Those vibration data in 3 sets from Rexnord were obtained on the bearing test rig shown in Fig.1. It is mainly composed of a motor, rolling bearings, sensors, and loading machine. All vibration signals of bearings are measured by accelerometers at different locations of the test rig [16]-[17].
Four Rexnord ZA-2115 double row bearings are installed on a shaft and force lubricated. Two High Sensitivity Quartz ICP accelerometers are installed on each bearing housing (one on the vertical x-axis which is normal to this plane and one on the horizontal y-axis) for data set No.1. Sensor placements are also shown in Fig.1. All failures occur after exceeding designed life of these bearings which is 100 million revolutions [16]-[19].
Test rotation speed is 2000RPM and sampling rate is 20 Hz. The test of performance of bearing is carried out for 35 days and at the end of test-to-failure experiment, the inner race failure occurs in bearing 3 [16]-[17].
Fig.1. Bearing test rig in NSF I/UCR center.
Many models and algorithms are tested with the data sets of NSF I/UCR center. Ali et al. proposed a useful life prediction model of rolling bearings based on neural network and used data sets mentioned above to test the model [17]. He et al. put forward a boundary extension method to solve mitigating end effects of the Hilbert–Huang transform (HHT) and also used the data sets for testing the boundary extension method [18]. With the same data sets, Guo et al. [20] developed a novel denoising method based on sparse vectors and learned dictionary for denoising vibration signals of bearings. Wang et al. adopted active SK to diagnose faulty bearings with the same data sets and
AccelerometersRadial Load
Thermocouples
Bearing 1 Bearing 2 Bearing 3 Bearing4Motor

MEASUREMENT SCIENCE REVIEW, 16, (2016), No. 3, 149-159
151
pointed out that the SK technique exhibited high sensitivity to faults in the early stage of development [21]. Gautier et al. presented a subspace-based damage indicator and took the bearing data sets as an experimental case [22].
We use normal, incipient degradation and fault vibration signals of bearing 3 in the x-direction and the y-direction in this paper to extract performance features in different degradation states of bearing 3.
In different stages of degradation of bearings, noise always exists in real measured vibration signals. How to extract sensitive degradation features from measured vibration signals is a key to performance prognostics. However, a measured vibration signal is produced by more than one vibration source, which includes rolling bearing itself, motor and loading machines. Therefore SNRs of rolling bearing signals are usually not the same in their whole service periods. Actually, SNRs of bearing signals are very poor during the early-stage of degradation, which makes feature extraction difficult by normal signal processing methods. In view of the difficulties in extracting sensitive features from vibration signals with poor SNRs, a signal processing method is presented here by combining Blind Source Separation (BSS) and Spectral Kurtosis (SK). 3. BSS PROCEDURE
BSS is a method by which real measured signals mixed by several different signal sources can be separated into different single signals and each one is generated by only one signal source [23]. A BSS method is feasible for separating independent signals, even though signal models and numbers of signal sources are not known in advance.
Measured vibration signals of rolling bearings are a mixture of vibration from motor, rolling bearings and other sources on the test rig. And they usually have poor SNRs which make feature extraction difficult, especially when the performance of rolling bearings declines slowly. In view of this problem, a BSS method is used to separate noises of measured vibration signals and then Spectral Kurtosis as one of sensitive features is obtained to estimate performances of bearings in this paper.
Linear BSS problems can be expressed by (1) as
𝐱𝐱 = 𝐀𝐀𝐀𝐀+ 𝐧𝐧 (1)
𝐱𝐱(𝑡𝑡) = [𝑥𝑥1(𝑡𝑡),𝑥𝑥2(𝑡𝑡), … … , 𝑥𝑥𝑛𝑛(𝑡𝑡)]T
𝐀𝐀(𝑡𝑡) = [𝑠𝑠1(𝑡𝑡), 𝑠𝑠2(𝑡𝑡), … … , 𝑠𝑠𝑚𝑚(𝑡𝑡)]T
𝐧𝐧(𝑡𝑡) = [𝑛𝑛1(𝑡𝑡),𝑛𝑛2(𝑡𝑡), … … , 𝑛𝑛𝑛𝑛(𝑡𝑡)]T
where 𝐱𝐱(𝑡𝑡) is a vector of signals from m sources (components) measured at n locations on a structure,and 𝐀𝐀(𝑡𝑡) is a vector of source signals of all components which are independent of each other, 𝐧𝐧(𝑡𝑡) is a vector of noise and A is an unknown mixing matrix [24]-[25]. For a specific machine, the elements of 𝐧𝐧(𝑡𝑡) can be absorbed into the corresponding elements of 𝐱𝐱(𝑡𝑡) .
Blind Separation Source is based on estimation of separating matrix W to calculate y, which can be expressed in (2):
𝐲𝐲(𝑡𝑡) = 𝐖𝐖𝐱𝐱(𝑡𝑡) ≅ 𝐀𝐀(𝑡𝑡) (2)
The BBS procedure is illustrated in Fig.2.
Mixing matrix ∑ Separation matrix s(t) A W
x(t)n(t)
y(t)
Fig.2. Vectors and matrixes of BSS.
It can be noted that most of BSS methods can only separate signals when single pure vibration signals are independent of each other. By ‘a single pure vibration signal’, we mean a signal from a single vibration source which has not been contaminated with noise.
However, many real signals are not mixed by independent single pure vibration signals so BSS methods do not work in these common situations.
In most cases, noise signals are independent of single pure vibration signals in the context of bearing fault detection, but single pure vibration signals from different vibrating sources may be correlative with each other. We consider all single pure vibration signals as from one source and noise signals as from another source. At first, how BSS methods work on different SNRs is investigated by means of simulation signals.
In section 3, we carry out some simulations to test whether noise signals can be separated from vibration signals by a BSS method if they are independent.
We simulate three different situations by means of three cases: (i) all single pure vibration signals are independent and non-Gaussian in case 1 and case 2, (ii) the noise signals buried in ‘measured’ vibration signals are independent and (iii) the single pure vibration signals are non-Gaussian and dependent in case 3.
3.1. Mix independent signals In this section, three simulation signals are mixed into three cases and the three simulation signals are: sinusoidal signal y1 and sawtooth wave y2 as they have not been contaminated with noise, and Gaussian random noise y3 which is independent of y1 and y2. Then they are mixed with different SNRs, with y1 and y2 being independent in case 1 and case 2, but y1 and y2 are correlation signals in case 3. y1, y2 and y3 are called original signals. The three cases are adopted to test separated results of a BSS method on different SNRs and how the BSS method behaves when mixed signals are mixed with dependent or independent signals.
ty ωsin1 = (3)
−
=0
)(2
nTtky
nTtTnnTt
=+∈ ))1(,(
(4)

MEASUREMENT SCIENCE REVIEW, 16, (2016), No. 3, 149-159
152
By changing the value of 𝜔𝜔 in relation to T, y1 and y2 are independent signals in case 1 and case 2 but they are correlation signals in case 3. In the case of mixed signals formed from independent components as shown in case 1, y1, y2 and y3 are mixed by matrix A1, shown in (5) and (6). Three mixed signals in case 1 have high SNRs which are 12.18, 8.61, and 10.46, respectively, as shown in Table 1. The independent components and mixed signals are shown in Fig.3. and Fig.4. Separated results are shown in Fig.5. The simulations above show that independent components with high SNRs (>8) can be separated successfully by BSS.
Gaussian random noise 3y which is 𝐧𝐧(𝑡𝑡) in (1), can be viewed as one element of 𝐀𝐀(𝑡𝑡) in (1). Then
𝐱𝐱(𝑡𝑡) = 𝐀𝐀𝐀𝐀(𝑡𝑡) = 𝐀𝐀 �𝑦𝑦1𝑦𝑦2𝑦𝑦3� (5)
where 𝐀𝐀 equates 𝐀𝐀1 in case 1 , but 𝐀𝐀2 in case 2 and case 3. 𝐀𝐀1 and 𝐀𝐀2 are given below:
𝐀𝐀1 =� 5 2 1 3 2.3 0.7
1.23 5 1.12 � , 𝐀𝐀2 =�
1.13 1.5 1.3 1 2.3 1.5 1.23 0.97 2.33
�
(6)
Fig.3. Independent components of case 1.
Fig.4. Mixed signals of case 1.
Table 1. SNRs of mixed signals.
Mixed signals No. 1 No. 2 No. 3 Original signals
Case 1 12.18 8.61 10.46 Independent signals Case 2 2.17 4.43 4.73 Independent signals Case 3 2.17 4.43 4.73 Correlation signals
In case 2, y1, y2 and y3 are mixed by matrix A2 and SNRs
are now reduced to 2.17, 4.43, and 4.73, respectively. The separated results exhibit the same wave forms compared with the original signals. The simulation results show that BSS can separate independent signal sources successfully even when SNRs are below 5.
Fig.5. Separated results of case 1 by BSS.
Fig.6. Original signals in case 2.
When comparing original signals and signals separated by BSS of case 1 and case 2, amplitudes and phases of the original signals and separated signals shown in Fig.3. and Fig.5., and in Fig.6. and Fig.8. are different, but the original signals and separated signals have the same waveform. The amplitudes and phases of signals cannot change kurtosis values and SK distributions which are explained in sect. 4.

MEASUREMENT SCIENCE REVIEW, 16, (2016), No. 3, 149-159
153
Case 1 and case 2 show that BSS filter can separate independent signal sources when SNRs are more than 5 and below 5.
Fig.7. Mixed signals of case 2.
Fig.8. Separated results of case 2 by BSS.
3.2. Mix dependent signals
In case 3, the period of y1 is 2π and the period of y2 is 4π. The original signals are mixed by matrix A2 and the mixed signals are shown in Fig.10. Here y3 is independent of y1 and y2. Results of separation are shown in Fig.11.
As a conclusion from the three cases, the BSS method can separate independent signals but cannot separate dependent signals successfully.
Fig.9. Original signals in case 3.
In all cases, the BSS method can separate the independent noise successfully from mixed signals whether the original signals are independent or not.
As a consequence, we can reduce the level of influence of the independent noises with the BSS method if source signals are correlation ones, even when SNRs are very poor (below 5).
Fig.10. Mixed signals in case 3.
Real measured vibration signals consist of noise signals and single pure vibration signals. Sources of noise signals are usually different from sources of rolling bearing vibration signals, and it is generally accepted that noise signals are independent of single pure vibration signals in the context of rolling bearings. Therefore, a BSS filter method is presented to reduce the contributions of independent noises and improve SNRs of vibration signals. A signal processing program is shown in Fig.12.
Many traditional filters must be set band-pass or band-reject frequencies in advance, but it is difficult to set those frequencies in most real cases for real measured vibration signals. In with traditional filters, the BSS filter can separate noises without setting band-pass or band-reject frequencies.
Fig.11. Separated results of case 3 by BSS.

MEASUREMENT SCIENCE REVIEW, 16, (2016), No. 3, 149-159
154
Input vectorx(t)
Mean normalization
Spectral Kurtosis calculation
Form feature vectors
Estimate model of performance of rolling
bearing
FastICA processing
Separating n(t)
BSS filter
Output invector y(t)
Set hamming window size and overlap
Set hamming window size and overlap
Fig.12. Signal processing program.
4. THE SPECTRAL KURTOSIS (SK) OF VIBRATION SIGNALS
Kurtosis values are widely used to describe characteristics of vibration signals; however, in practice, kurtosis may not be suitable for analysis of a non-stationary signal and some incipient degradation-induced transient vibration may be hardly detectable. SK is adopted to calculate kurtosis values of each spectrum by which a relationship of impulses and frequencies of non-stationary signal can be reviewed.
SK was firstly presented by Dwyer in 1983 [26]-[28], and several studies have shown that SK can be successfully used to identify transient impacts caused by faults of rolling bearings [29]-[30]. The SK is the fourth-order cumulant of each frequency component of a signal. A formal definition of SK was presented based on Wold–Cramér decomposition of conditionally nonstationary processes as [27]
,2)()()( 2
2
4 −=fSfSfK
Y
YY
0≠f . (7)
where )(4 fS Y is the fourth-order spectral moments and
)(2 fS Y is the second-order spectral moments. The SK can be a measure of temporal dispersion of the time-frequency energy distribution [27].
Frequency bands dominated by high-impulsivity signals exhibit high levels of SK; whereas in those frequency bands where Gaussian signals are prevalent, SK is zero. Furthermore, SK is not affected by the magnitude of a signal. For example, signals )(tx and 5 )(tx have the same kurtosis and SK distribution. In a word, SK levels can reveal impact intensity of bearing vibration, but Gaussian noise will weaken this. In summary, SK can provide a measurement of impulsivity of vibration signals and be very useful for incipient fault diagnosis of bearings if noise signals are removed in advance.
Combet and Gelman [31] confirmed that SK was approximately inversely related to the probability of an occurrence of vibration impulses so it is very sensitive to random impulses, especially isolated impulses [26]-[28]. However, real vibration data of rolling bearings are often mixed with impact noises which may lead to misdiagnosis of bearing degradation. This effect was actually observed in situations where SK levels were high at the beginning of a test-to-failure experiment and then went back to normal [32].
In this regard, a noise signal is viewed as one signal source in measured vibration signals (named mixed signals), and then a BSS method is used to separate the noise signals from the measured vibration signals to overcome the afore-mentioned drawback of SK. 5. A BSS FILTER
Kurtosis values and SK distributions with and without a BSS filter are compared to test how the BSS filter works on kurtosis values and SK distributions of vibration signals in different states of bearings. In this section, a square root filter and a BSS filter are used to pre-process vibration signals and both results are compared. The square root filter is a common filter adopted to test performance of the BSS filter here. 5.1. Kurtosis analysis
Firstly, vibration of rolling bearings in normal, incipient degradation and fault states was measured [9]-[10]. Kurtosis values of vibration data are a good reflection of impulses and 16 groups of real vibration data (mixed signals) of each state are processed. Kurtosis values of three states are compared as shown in Table 2. and these kurtosis values in Table 2. are expressed by the fourth central moment, and the kurtosis value is 3 when the shape of spectrum is relative to the normal distribution.
A key problem of incipient degradation diagnosis on bearings is how to distinguish an incipient degradation state from a normal state since the characteristics of these two states have little difference. In this paper, we processed vibration signals of rolling bearings with the BSS method, and then SK levels were calculated, as presented in Fig.13.
Firstly, it should be noted that kurtosis values decrease slightly after being processed by a BSS filter compared with kurtosis values after being processed by a square root filter. Bearing faults are seen to generate noise signals on components of the test rig. Larger noise impulses enter the measured vibration signals, which make kurtosis achieve higher values than those of measured vibration signals not processed by the BSS filter. Vibration signals of bearings in a normal state have poor SNRs and noise impulses may be stronger than those of vibration of bearings themselves. Therefore, kurtosis values of vibration signals in a normal state processed by a BSS filter decrease slightly compared with those filtered by the square root filter, as shown in Fig.13., as the square root filter cannot filter noise signals effectively and noise impulses increase the kurtosis values of vibration of bearings in a normal state to some extent.

MEASUREMENT SCIENCE REVIEW, 16, (2016), No. 3, 149-159
155
Table 2. Kurtosis values of different states.
Groups Fault state 𝒌𝒌𝒌𝒌
Fault state after BSS
𝒌𝒌𝒌𝒌
Incipient degradation
𝒌𝒌𝒌𝒌
Incipient degradation after BSS
𝒌𝒌𝒌𝒌
Normal state 𝒌𝒌𝒌𝒌
Normal state after BSS
𝒌𝒌𝒌𝒌 1 9.6 10.3 5.3 5.5 2.6 2.0 2 16.3 17.4 4.7 5.0 2.4 2.0 3 5.8 6.6 5.5 5.8 2.5 1.9 4 4.7 5.1 4.5 4.8 2.6 2.2 5 4.2 4.4 3.8 3.9 2.5 2.1 6 6.6 6.4 5.4 5.5 2.8 2.2 7 5.7 5.5 4.5 4.9 2.5 2.1 8 7.9 7.3 5.0 5.3 2.6 2.1 9 4.0 3.0 4.2 4.5 2.5 2.1
10 13.4 12.9 6.8 7.3 2.7 2.3 11 3.5 3.5 3.9 3.9 2.6 2.1 12 5.5 5.3 6.5 7.3 2.7 2.0 13 6.6 6.2 4.8 5.2 2.4 2.0 14 7.2 6.7 4.2 4.4 2.6 2.3 15 8.7 8.4 5.6 6.0 2.6 2.5 16 6.3 6.1 6.1 6.0 2.5 2.1
In the case of incipient degradation, slight wear, cracking
and pitting may occur. These forms of degradation excite vibration of bearings. However, SNRs of vibration signals in this state are also very poor in a real working environment and noises may have the same order of magnitude as pure vibration signals of bearings. They produce same-scale impulses and a large number of these impulses of noise signals reduce kurtosis values by means of a square root filter. Interestingly, kurtosis values get larger when vibration signals are processed by a BSS filter, which is also shown in Fig.13. This effect can be explained by the fact that kurtosis is relatively sensitive to impulses but it will also decrease when signals contain a large number of same-scale impulses.
Fig.13. Kurtosis curve filtered by a BSS filter.
Comparing kurtosis values with and without the BSS filter
in a normal state, we can recognize a kurtosis trend which declines slightly, as shown in Fig.13. This tendency can be explained as follows: noise impulses have a stronger influence to signals in normal states than to those in incipient degradation states. Noise impulses are main components of real vibration signals which make kurtosis values larger. 5.2. Spectral Kurtosis analysis
A fault occurred on the inner race of bearing 3 in the tested structure (shown in Fig.1.) at the end of the test-to-failure experiment. x-direction and y-direction vibration signals were collected by accelerometers on bearing seats.
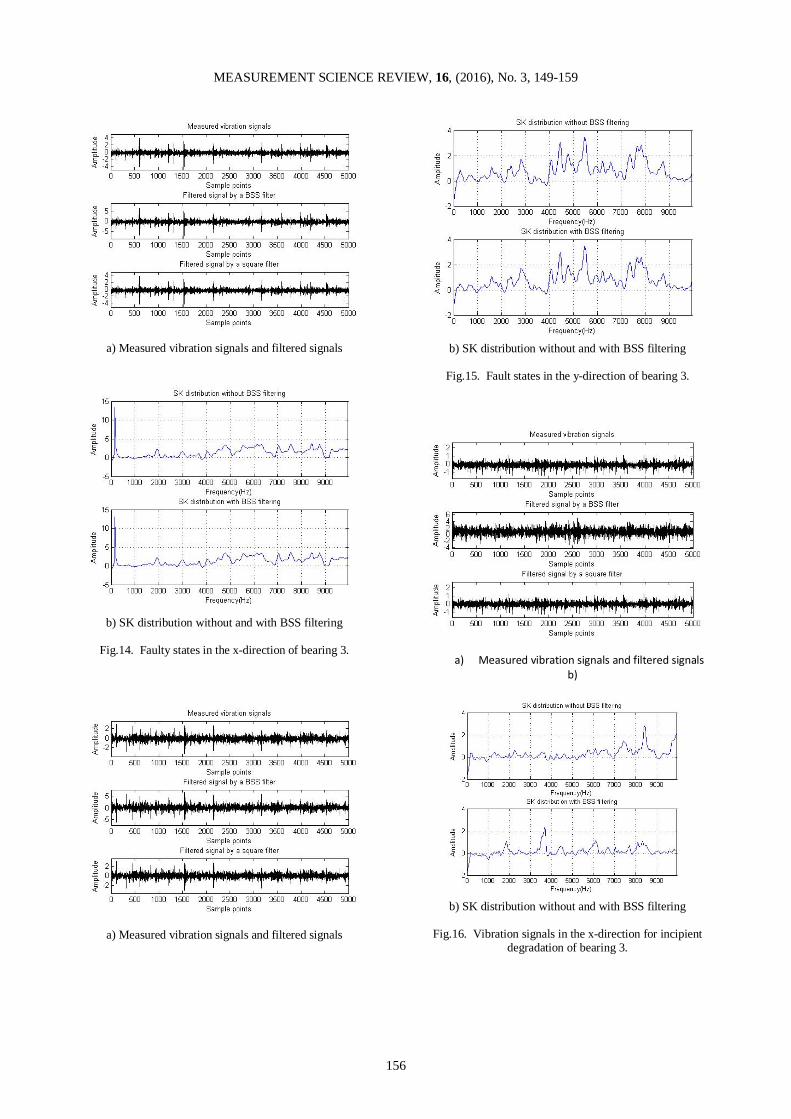
Measured signals of vibration in the x-direction are filtered by a BSS filter and a square root filter. The filtered signals are shown in Fig.14.a).
We attempt to analyze SK trends processed by the BSS filter using a hamming window size of 256 samples with a 75 % overlap. Each frame is multiplied by a hamming window of 256 samples.
Distribution of SK may experience a few changes when we examine Fig.14.b) for signals of bearing vibration in the x-direction in faulty states.
A similar trend occurs in the signals of bearing vibration in the y-direction (shown in Fig.15.). Bearing vibration impulses are seen to be stronger than those of noise signals. There is not a visible change in the SK distributions of vibration in either the x-direction or the y-direction after BSS filtering. Maximum values of SK are all over 12 in the x-direction and over 3 in the y-direction, and peak frequencies are almost identical, as shown in Fig.14.b) and Fig.15.b). From these results we can conclude that SK is always fairly sensitive to fully developed faults of bearings with or without the BSS filter.
MEASUREMENT SCIENCE REVIEW, 16, (2016), No. 3, 149-159
156
a) Measured vibration signals and filtered signals
b) SK distribution without and with BSS filtering
Fig.14. Faulty states in the x-direction of bearing 3.
a) Measured vibration signals and filtered signals
b) SK distribution without and with BSS filtering
Fig.15. Fault states in the y-direction of bearing 3.
a) Measured vibration signals and filtered signals
b)
b) SK distribution without and with BSS filtering
Fig.16. Vibration signals in the x-direction for incipient
degradation of bearing 3.

MEASUREMENT SCIENCE REVIEW, 16, (2016), No. 3, 149-159
157
Fig.16.b) shows SK distributions of incipient degradation signals processed with and without the BSS filter in the x-direction, respectively and Fig.17.b) shows those in the y-direction, respectively.
Contrasted with real measured vibration signals, the signals filtered by the BSS filter have different amplitudes and phases and they can be expressed as in (8).
𝑦𝑦(𝑡𝑡) = C𝑥𝑥(𝑡𝑡) (8)
where 𝑦𝑦(𝑡𝑡) is filtered signals by the BSS filter, 𝑥𝑥(𝑡𝑡) is real measured vibration signals, and C can be a constant. The signal filtered by the BSS filter has an inverse polarity to the one measured when C is -2.5 in Fig.15.a).
a) Measured vibration signals and filtered signals
b) SK distribution without and with BSS filtering
Fig.17. Vibration signals in the y-direction of incipient
degradation of bearing 3. The peak frequencies are shown to be different in the x-
direction and the y-direction; especially in the y-direction, maximum value of SK increases by nearly 3 after BSS filtering rather than by less than 1 after square root filtering. So the BSS filter is very effective in ‘cleaning’ vibration signals of incipient degradations of bearings.
a) Filtered signal with a BSS filter and a square root filter
b) SK distribution without and with BSS filtering
Fig.18. Normal states in the x-direction of bearing 3.
Normal vibration signals are also processed in the same way, and peak frequencies and SK distributions are illustrated in Fig.18. and Fig.19. It is noted that SK levels are almost less than 2 for vibration in both the x-direction and the y-direction whether processed by the BSS filter or not. The results are consistent with those of section 2.1.
a) Filtered signal with a BSS filter and a square root filter

MEASUREMENT SCIENCE REVIEW, 16, (2016), No. 3, 149-159
158
b) SK distribution without and with BSS filtering
Fig.19. Normal states in the y-direction of bearing 3.
6. CONCLUSIONS
This paper presents a feature extraction method that combines Blind Source Separation (BSS) and Spectral Kurtosis (SK), named BSS-SK filter, and an analysis to detect incipient degradation of bearings even when Signal-to-Noise Ratios (SNRs) are quite poor (below 5). A BSS filter is used to separate independent noise signals from measured vibration signals and SK distributions are computed to reveal different health states of rolling bearings.
It is assumed that noise signals are independent of single pure vibration signals but single pure vibration signals do not need to be independent of each other in the numerical simulation. Then the BSS filter’s performance is tested at first. The simulation results show that the BSS filter is effective only when a noise signal is independent of single pure vibration signals. Then this method is applied to assess bearings of an experimental setup in healthy, normal, incipient degradation and faulty states, respectively.
The assumption above is largely valid for vibration of real bearings. The results presented in this paper indicate that incipient degradation can be detected from SK distributions after BSS filtering signals of vibration of simulated examples and examples of real bearings. It is found that the method can separate single pure vibration signals from measured vibration signals contaminated by noise signals and thus obtain enhanced kurtosis values for bearings in incipient degradation states, which afford accurate detection of such early-stage faults. ACKNOWLEDGEMENTS
The authors would like to thank the Center on Intelligent Maintenance System (IMS) University of Cincinnati, USA, for the bearing vibration dataset. This paper is also supported by the Science and Technology Plan Project of Sichuan Province (No. 2015HH0015) and the Fundamental Research Funds for the Central University (No. 2682014CX034 and No. 2682014BR024). The first author gratefully acknowledges the financial support for the visit to the University of Liverpool from China Scholarship Council.
REFERENCES [1] Tiwari, R., Gupta, V.K., Kankar, P.K. (2015). Bearing
fault diagnosis based on multi-scale permutation entropy and adaptive neuro fuzzy classifier. Journal of Vibration and Control, 21 (3), 461-467.
[2] Jardine, A.K., Lin, D., Banjevic, D. (2006). A review on machinery diagnostics and prognostics implementing condition-based maintenance. Mechanical Systems and Signal Processing, 20 (7), 1483-1510.
[3] Kankar, P.K., Sharma, S.C., Harsha, S.P. (2011). Fault diagnosis of high speed rolling element bearings due to localized defects using response surface method. Journal of Dynamic Systems, Measurement, and Control, 133 (3), 031007.
[4] Liu, F., Shen, C., He, Q., Zhang, A., Liu, Y., Kong, F. (2014). Wayside bearing fault diagnosis based on a data-driven Doppler effect eliminator and transient model analysis. Sensors, 14 (5), 8096-8125.
[5] Liang, M., Faghidi, H. (2014). An enhanced energy operator for bearing fault detection. In Proceedings of the 3rd International Conference on Mechanical Engineering and Mechatronics, 14-15 August 2014, Prague, Czech Republic.
[6] Wang, D., Shen, C. (2014). An equivalent cyclic energy indicator for bearing performance degradation assessment. Journal of Vibration and Control, doi 10.1177/1077546314547224.
[7] Fatima, S., Guduri, B., Mohanty, A.R., Naikan, V.N.A. (2014). Transducer invariant multi-class fault classification in a rotor-bearing system using support vector machines. Measurement, 58, 363-374.
[8] Shen, C., Cai, G., He, Z., Huang, W., Zhu, Z. (2015). A parameterized Doppler distorted matching model for periodic fault identification in locomotive bearing. Proceedings of the Institution of Mechanical Engineers, Part C: Journal of Mechanical Engineering Science, doi 10.1177/0954406215616416.
[9] Chen, S.L., Wang, L., Wood, R.J.K., Callan, R., Powrie, H.E.G. (2010). Anomaly detection of the tapered roller bearings with statistical data-driven approaches. Insight - Non-Destructive Testing and Condition Monitoring, 52 (8), 428-436.
[10] Shen, C., Wang, D., Liu, Y., Kong, F., Tse, P.W. (2014). Recognition of rolling bearing fault patterns and sizes based on two-layer support vector regression machines. Smart Structures and Systems, 13 (3), 453-471.
[11] Hamadache, M., Lee, D. (2014). Improving signal-to-noise ratio (SNR) for inchoate fault detection based on principal component analysis (PCA). In 14th International Conference on Control, Automation and Systems (ICCAS), 22-25 October 2014, Seoul. IEEE, 561-566.
[12] Bao, W., Zhou, R., Yang, J., Yu, D., Li, N. (2009). Anti-aliasing lifting scheme for mechanical vibration fault feature extraction. Mechanical Systems and Signal Processing, 23 (5), 1458-1473.

MEASUREMENT SCIENCE REVIEW, 16, (2016), No. 3, 149-159
159
[13] Han, L., Li, C.W., Guo, S.L., Su, X.W. (2015). Feature extraction method of bearing AE signal based on improved FAST-ICA and wavelet packet energy. Mechanical Systems and Signal Processing, 62, 91-99.
[14] Chen, X., Du, Z., Li, J., Li, X., Zhang, H. (2014). Compressed sensing based on dictionary learning for extracting impulse components. Signal Processing, 96, 94-109.
[15] Zhu, T., Xiao, X., He, Q., Diao, D. (2013). Enhancement of SNR and spatial resolution in-OTDR system by using two-dimensional edge detection method. Journal of Lightwave Technology, 31 (17), 2851-2856.
[16] National Aeronautics and Space Administration. PCoE Datasets. http://ti.arc.nasa.gov/tech/dash/pcoe/ prognostic-data-repository/.
[17] Ali, J.B., Chebel-Morello, B., Saidi, L., Malinowski, S., Fnaiech, F. (2015). Accurate bearing remaining useful life prediction based on Weibull distribution and artificial neural network. Mechanical Systems and Signal Processing, 56, 150-172.
[18] He, Z., Shen, Y., Wang, Q. (2012). Boundary extension for Hilbert–Huang transform inspired by gray prediction model. Signal Processing, 92 (3), 685-697.
[19] Tobon-Mejia, D.A., Medjaher, K., Zerhouni, N., Tripot, G. (2012). A data-driven failure prognostics method based on mixture of Gaussians Hidden Markov Models. IEEE Transactions on Reliability, 61 (2), 491-503.
[20] Guo, L., Gao, H., Li, J., Huang, H., Zhang, X. (2015). Machinery vibration signal denoising based on learned dictionary and sparse representation. In Journal of Physics: Conference Series, 628 (1), 012124.
[21] Wang, Y., Xiang, J., Markert, R., Liang, M. (2016). Spectral kurtosis for fault detection, diagnosis and prognostics of rotating machines: A review with applications. Mechanical Systems and Signal Processing, 66, 679-698.
[22] Gautier, G., Serra, R., Mencik, J.M. (2015). Roller bearing monitoring by new subspace-based damage indicator. Shock and Vibration, 501, 828093.
[23] Knuth, K.H. (2015). Difficulties applying recent blind source separation techniques to EEG and MEG. arXiv:1501.05068.
[24] Comon, P., Jutten, C. (eds.). (2010). Handbook of Blind Source Separation: Independent Component Analysis and Applications. Academic Press.
[25] Langlois, D., Chartier, S., Gosselin, D. (2010). An introduction to independent component analysis: InfoMax and FastICA algorithms. Tutorials in Quantitative Methods for Psychology, 6 (1), 31-38.
[26] Boškoski, P., Urevc, A. (2011). Bearing fault detection with application to PHM Data Challenge. International Journal of Prognostics and Health Management, 2 (1), 003.
[27] Antoni, J. (2006). The spectral kurtosis: A useful tool for characterising non-stationary signals. Mechanical Systems and Signal Processing, 20 (2), 282-307.
[28] Elasha, F., Ruiz-Carcel, C., Mba, D., Chandra, P. (2014). A comparative study of the effectiveness of adaptive filter algorithms, spectral kurtosis and linear prediction in detection of a naturally degraded bearing in a gearbox. Journal of Failure Analysis and Prevention, 14 (5), 623-636.
[29] Immovilli, F., Cocconcelli, M., Bellini, A., Rubini, R. (2009). Detection of generalized-roughness bearing fault by spectral-kurtosis energy of vibration or current signals. IEEE Transactions on Industrial Electronics, 56 (11), 4710-4717.
[30] Leite, V.C.M.N., Borges da Silva, J.G., Veloso, G.F.C. et al. (2015). Detection of localized bearing faults in induction machines by spectral kurtosis and envelope analysis of stator current. IEEE Transactions on Industrial Electronics, 62 (3), 1855-1865.
[31] Combet, F., Gelman, L. (2009). Optimal filtering of gear signals for early damage detection based on the spectral kurtosis. Mechanical Systems and Signal Processing, 23 (3), 652-668.
[32] Antoni, J., Randall, R.B. (2006). The spectral kurtosis: Application to the vibratory surveillance and diagnostics of rotating machines. Mechanical Systems and Signal Processing, 20 (2), 308-331.
Received January 5, 2016. Accepted May 27, 2016.