a faÇade integrated micro-heat pump … · a faÇade integrated micro-heat pump – energy...
TRANSCRIPT

A FAÇADE INTEGRATED MICRO-HEAT PUMP – ENERGY PERFORMANCE
SIMULATIONS
Georgios Dermentzis1, Fabian Ochs
1, Dietmar Siegele
1, Wolfgang Feist
1,2
1University of Innsbruck, Energy Efficient Buildings, Innsbruck, Austria
2Passive House Institute, Darmstadt, Germany
Technikerstrasse. 13, A-6020 Innsbruck, email: [email protected]
ABSTRACT
A façade integrated micro-heat pump in combination
with mechanical ventilation with heat recovery is
developed in the framework of the European project
iNSPiRe. A set of system simulations (building
combined with HVAC) has been performed to
investigate the energy performance of a micro-heat
pump. The performance of the system is investigated
for different renovation standards (EnerPHit with
25 kWh/(m2∙a) and Passive House with
15 kWh/(m2∙a)) and for seven different European
climate conditions. The potential of the micro-heat
pump and the system optimization are investigated
within dynamic simulations. Different control
strategies using standard hysteresis on/off or PI
controller are investigated.
INTRODUCTION - MOTIVATION
The majority of existing building stock in Europe and
worldwide is low energy performance buildings.
Deep renovation solutions in combination with
integrated Heating Ventilation and Air Conditioning
(HVAC) systems are developed within the
framework of the European project iNSPiRe. The
present study focuses on one approach about a façade
integrated micro-heat pump (HP) in combination
with mechanical ventilation with heat recovery
(MVHR). The main advantages of the proposed
system are the compactness, providing the possibility
of integration into the façade, and cost reduction. A
prototype will be later monitored in a demo building
in Ludwigsburg, Germany. It is an example of social
housing built in the 1970s, which contains four flats
on four stories. During the renovation process a
timber frame façade will be fitted onto the building.
The HP with the MVHR will be integrated into the
prefabricated façade.
The prefabricated unit is designed as a compact
system for minimal space use. Renovations with
minimum intervention are enabled (minimum
invasive renovation). A minimal installation effort is
desirable for economic reasons. By means of this
system, cold ducts inside the thermal envelope can be
completely avoided.As the whole solution will be
façade integrated and prefabricated,construction and
installation time can be kept very short. Building
physical aspects have to be carefully investigated
(avoiding/reduction of thermal bridges, avoidance of
moisture related damage, sound protection).
Solutions for easy maintenance need to be developed
and tested. The performance of the mechanical
ventilation unit with heat recovery and the micro-heat
pump are tested in two PASSYS test cells and in an
acoustic test rig at university of Innsbruck.
CONCEPT
The considered system is developed and integrated in
a test façade. The heat pump uses the exhaust air of
the MVHR as source and provides heat to the supply
air of the ventilation system (Figure 1). Thus, one
compact unit can be used for combined ventilation
and heating or cooling. Fresh outdoor air flows into
the MVHR, where it is heated with an energy
recovery coefficient of up to 95 %. It is then further
heated by the micro-heat pump up to maximum
52 °C in order to supply space heating (reverse
operation for cooling would be possible in future
versions).
Figure 1: Simplified concept of the micro-heat pump
(µHP with MVHR)
The concept addresses very good building standards
(e.g. EnerPhit 25 kWh/(m² a) (see [Zeno et al.,
2012]) or better), corresponding to a specific heat
load in the range of 10 W/m². Hence, the typical heat
power of the heat pump will be in the range of 1 kW.
The proposed system is suggested with a radiator in
the bathroom for comfort reasons. If the capacity of
the HP is lower than the design heating load of the
building an additional backup heater has to be used.
Fifth German-Austrian IBPSA Conference RWTH Aachen University
- 344 -

Basically, the µHP concept would work for water
(radiator, floor heating, radiant ceiling) and air based
systems (supply air and principally also recirculated
air). As source ambient air and/or exhaust air or brine
are possible. The exhaust air-to-supply air has the
highest potential to be micro and thus compact.
Figure 2 shows the hydraulic scheme of the unit.The
ambient air (1) will be heated with the defroster (5) if
the ambient temperature drops below -3 °C
(optionally -5 °C). The filter for the ambient air (6) is
situated in front of the heat exchanger (16). The
ventilator for the supply air (8) is situated after the
heat exchanger. The supply air will be heated in the
condenser (13) of the micro-heat pump. If the
temperature of the supply air after the condenser is
too low to cover the heat load a supplementary heater
(15) will heat the supply air (3) up to 52 °C. The
extract air (2) is filtered (7) before the heat
exchanger. After the heat exchanger the ventilator for
the exhaust air (9) is situated. The frequency
controlled compressor (10) of the heat pump is
situated in the air flow of the exhaust air in front of
the evaporator (11). The optimum position of the
compressor issuggested to be in the supply air side.
The expansion valve (12) reduces the pressure
between condenser and evaporator. Hot gas defrost
(14) is necessary in case of ice formation in the
evaporator.
Figure 2: Hydraulic scheme of the micro-heat pump
LABORATORY MEASUREMENTS
Until now two prototypes (dimensions: 2.75 m x
2.75 m) were built for the tests in PASSYS(Passive
Solar Systems and Component Testing) test cells.
PASSYS cells
One of the test cells is a so called PAS cell (Pseudo
Adiabatic Shell) which allows better accuracy. The
test cells allow controlling the temperature with high-
power heater and cooler. A ventilator and an air
distribution system avoid temperature layers in the
test cell. Furthermore with a so called cold box the
external boundary conditions (temperatures down to -
15 °C) can be simulated. For a realistic measurement
of the performance of the MVHR and the coefficient
of performance (COP) of the heat pump a simple
humidifier was installed in the test cells that allow
measurements with different relative humidity in the
test cells.
Prototypes
In the first prototype the ventilation system with heat
recovery is integrated in the façade. Special silencers
are developed which are also filter boxes. Therefore
the filters for the ambient and extract air can be
placed outside of the unit – easier accessibility from
the windows reveal. Figure 3 shows a sketch of the
prototype in the PASSYS cell with description of the
components.
Figure 3: Sketch of 1st prototype with MVHR unit
With the second prototype (Figure 4 and Figure 5)
the micro-heat pump in combination with the MVHR
integrated in the façade is realized. This prototype
was primarily designed to measure the performance
of the MVHR and of the micro-heat pump.
Figure 6 shows both prototypes installed in the
PASSYS test cells at university of |Innsbruck.
Fifth German-Austrian IBPSA Conference RWTH Aachen University
- 345 -
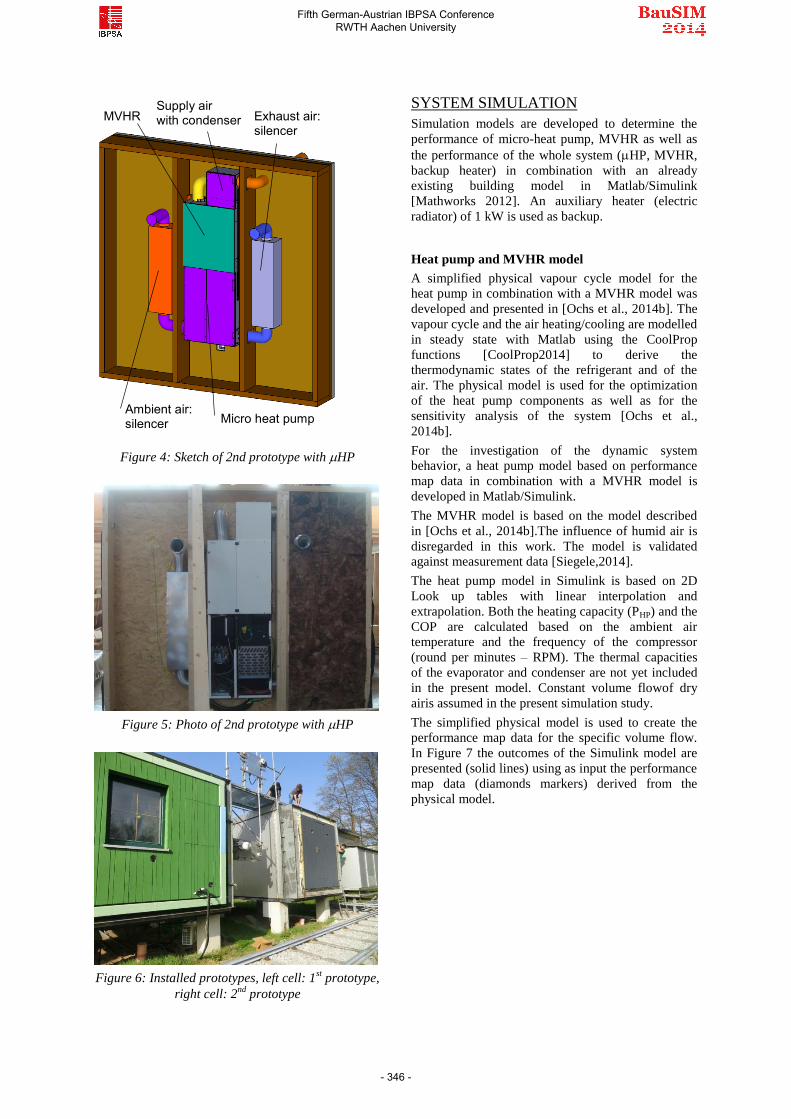
Figure 4: Sketch of 2nd prototype with HP
Figure 5: Photo of 2nd prototype with HP
Figure 6: Installed prototypes, left cell: 1st prototype,
right cell: 2nd
prototype
SYSTEM SIMULATION
Simulation models are developed to determine the
performance of micro-heat pump, MVHR as well as
the performance of the whole system (HP, MVHR,
backup heater) in combination with an already
existing building model in Matlab/Simulink
[Mathworks 2012]. An auxiliary heater (electric
radiator) of 1 kW is used as backup.
Heat pump and MVHR model
A simplified physical vapour cycle model for the
heat pump in combination with a MVHR model was
developed and presented in [Ochs et al., 2014b]. The
vapour cycle and the air heating/cooling are modelled
in steady state with Matlab using the CoolProp
functions [CoolProp2014] to derive the
thermodynamic states of the refrigerant and of the
air. The physical model is used for the optimization
of the heat pump components as well as for the
sensitivity analysis of the system [Ochs et al.,
2014b].
For the investigation of the dynamic system
behavior, a heat pump model based on performance
map data in combination with a MVHR model is
developed in Matlab/Simulink.
The MVHR model is based on the model described
in [Ochs et al., 2014b].The influence of humid air is
disregarded in this work. The model is validated
against measurement data [Siegele,2014].
The heat pump model in Simulink is based on 2D
Look up tables with linear interpolation and
extrapolation. Both the heating capacity (PHP) and the
COP are calculated based on the ambient air
temperature and the frequency of the compressor
(round per minutes – RPM). The thermal capacities
of the evaporator and condenser are not yet included
in the present model. Constant volume flowof dry
airis assumed in the present simulation study.
The simplified physical model is used to create the
performance map data for the specific volume flow.
In Figure 7 the outcomes of the Simulink model are
presented (solid lines) using as input the performance
map data (diamonds markers) derived from the
physical model.
Micro heat pump
MVHR
Ambient air: silencer
Exhaust air: silencer
Supply air with condenser
Fifth German-Austrian IBPSA Conference RWTH Aachen University
- 346 -

Figure 7: Heating capacity (top) and COP (bottom)
of theHPas a function of ambient air (air)
temperature with RPM as parameter.
Validation
Measurements are ongoing in PASSYS test cells.
There are not enough measured data currently
available for the validation of the physical heat pump
simulation model. Validation is planned as the next
step.
Instead, the results of the physical heat pump
simulation model are compared to measured data of
existing certified compact units (Figure 8). The
compact units cover both heating and domestic hot
water demand. From the certificate of compact units,
the COP data only for heating are used for the
comparison:
a) Comparison of the measured COP
(certificate of compact units) and simulated
COP (physical model) shows that the
simulation results are in the same order of
magnitude as the existing compact units.
b) The trends coming from the simulations are
verified by the certified measured compact
units.
The trend of COP as function of the ambient
temperature coming from the simulation is same as
the compact units of Genvex, but different to D&W
and Nilan. The reason has to be clarified.
Preliminary laboratory measurement results show
same trends as the physical simulation model for the
COP: a) the ambient air temperature almost does not
influence the COP, b) by decreasing the RPM the
COP increases.The measured COP values are in a
lower range than the simulations results and the
compact units measured data, therefore optimization
can be realized.
Figure 8: Performance map data of the physical heat
pump model in comparison to performance data of
certified compact units (with fixed speed compressor)
Building model
The building considered in this study is a semi-
detached single family house, with a tempered floor
area of 78 m². It is defined within the project
iNSPiRe[iNSPiRe, 2014] as a typical European
single family house construction. The actual building
is located in London, UK, and consists of two floors
and an unheated attic, with an insulated ceiling
between the top floor and the attic [Gustafsson, et al.,
2014]. The ventilation rate is taken to be 0.4 h-1
and
the infiltration rate 0.1 h-1
. Climate data for seven
different European locations are used. The chosen
locations are the ones used in WP2 [iNSPiRe, 2014]
and represent continental and coastal climates as well
as a range of average ambient temperature and
relative humidity.
For each climate, two renovation levels (i.e. U-values
of roof, floor, walls and windows) are defined.
EnerPHit standard (PH) and Passive House standard
(EN) are used to define houses with heating demands
of 25 kWh/(m²∙a) and 15 kWh/(m²∙a), respectively,
assuming an air heat recovery efficiency of 85 %
according to PHI definition [PHI] and disregarding
cooling demand. In MATLAB Simulink the complex
building model of the Carnot Blockset is used. The
applied U-values for each climate and renovation
level are listed inTable 1and Table 2.
In this study only space heating is investigated; see
e.g. [Ochs, et al., 2014a] for DHW options. Total
energy consumption includes heat pump compressor
and backup heater as well as defroster of heat
recovery.Thus all energy consumed is electricity. The
consumption of ventilator fans of MVHR is
disregarded in this study.
-10 -5 0 5 10 15 20300
400
500
600
700
800
900
1000P
HP /
[W
]
amb
/ [°C]
RPM:2000
RPM:2500
RPM:3000
RPM:3500
RPM:4000
RPM:4500
Perf. Map
-10 -5 0 5 10 15 202
2.5
3
3.5
4
4.5
CO
P
amb
/ [°C]
RPM:2000
RPM:2500
RPM:3000
RPM:3500
RPM:4000
RPM:4500
Perf. Map 2,0
2,5
3,0
3,5
4,0
-10 -5 0 5 10 15
CO
PJamb / [°C]
D&W Nilan
Nilan Genvex
Genvex
RPM:
2000
2500
3000
3500
4000
4500
Fifth German-Austrian IBPSA Conference RWTH Aachen University
- 347 -
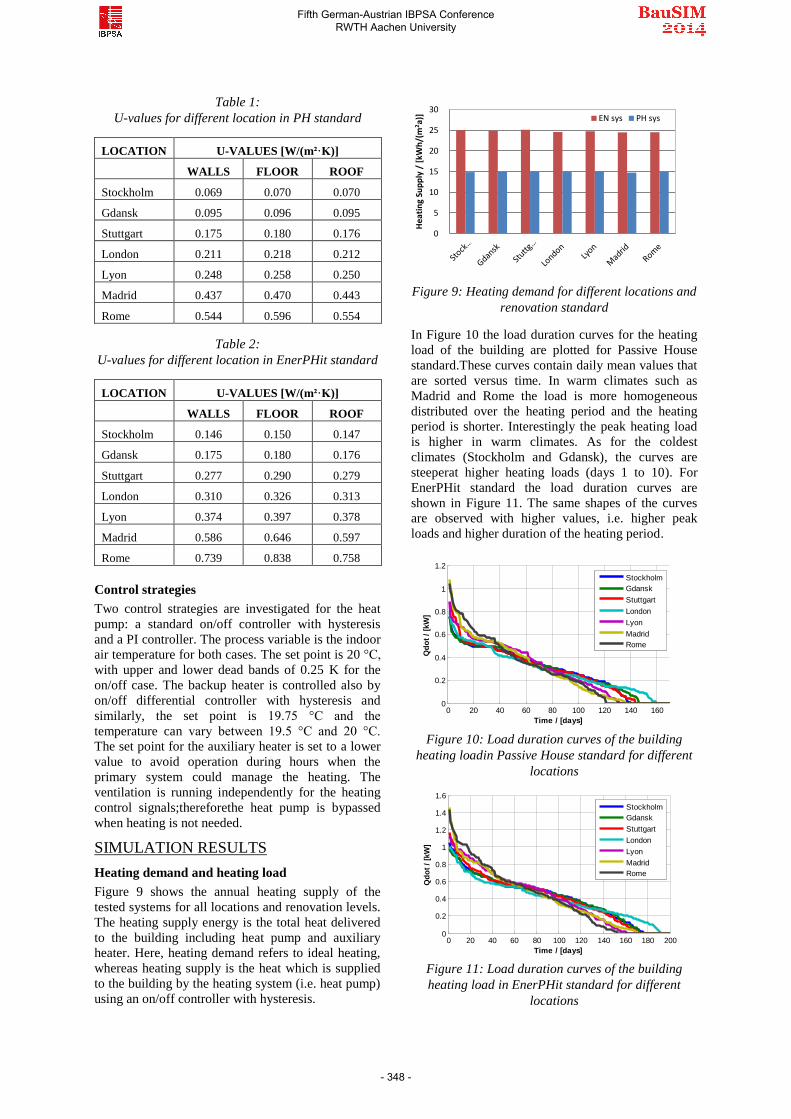
Table 1:
U-values for different location in PH standard
LOCATION U-VALUES [W/(m²·K)]
WALLS FLOOR ROOF
Stockholm 0.069 0.070 0.070
Gdansk 0.095 0.096 0.095
Stuttgart 0.175 0.180 0.176
London 0.211 0.218 0.212
Lyon 0.248 0.258 0.250
Madrid 0.437 0.470 0.443
Rome 0.544 0.596 0.554
Table 2:
U-values for different location in EnerPHit standard
LOCATION U-VALUES [W/(m²·K)]
WALLS FLOOR ROOF
Stockholm 0.146 0.150 0.147
Gdansk 0.175 0.180 0.176
Stuttgart 0.277 0.290 0.279
London 0.310 0.326 0.313
Lyon 0.374 0.397 0.378
Madrid 0.586 0.646 0.597
Rome 0.739 0.838 0.758
Control strategies
Two control strategies are investigated for the heat
pump: a standard on/off controller with hysteresis
and a PI controller. The process variable is the indoor
air temperature for both cases. The set point is 20 °C,
with upper and lower dead bands of 0.25 K for the
on/off case. The backup heater is controlled also by
on/off differential controller with hysteresis and
similarly, the set point is 19.75 °C and the
temperature can vary between 19.5 °C and 20 °C.
The set point for the auxiliary heater is set to a lower
value to avoid operation during hours when the
primary system could manage the heating. The
ventilation is running independently for the heating
control signals;thereforethe heat pump is bypassed
when heating is not needed.
SIMULATION RESULTS
Heating demand and heating load
Figure 9 shows the annual heating supply of the
tested systems for all locations and renovation levels.
The heating supply energy is the total heat delivered
to the building including heat pump and auxiliary
heater. Here, heating demand refers to ideal heating,
whereas heating supply is the heat which is supplied
to the building by the heating system (i.e. heat pump)
using an on/off controller with hysteresis.
Figure 9: Heating demand for different locations and
renovation standard
In Figure 10 the load duration curves for the heating
load of the building are plotted for Passive House
standard.These curves contain daily mean values that
are sorted versus time. In warm climates such as
Madrid and Rome the load is more homogeneous
distributed over the heating period and the heating
period is shorter. Interestingly the peak heating load
is higher in warm climates. As for the coldest
climates (Stockholm and Gdansk), the curves are
steeperat higher heating loads (days 1 to 10). For
EnerPHit standard the load duration curves are
shown in Figure 11. The same shapes of the curves
are observed with higher values, i.e. higher peak
loads and higher duration of the heating period.
Figure 10: Load duration curves of the building
heating loadin Passive House standard for different
locations
Figure 11: Load duration curves of the building
heating load in EnerPHit standard for different
locations
0
5
10
15
20
25
30
Hea
tin
g Su
pp
ly /
[kW
h/(
m2a)
] EN sys PH sys
0 20 40 60 80 100 120 140 1600
0.2
0.4
0.6
0.8
1
1.2
Qd
ot
/ [k
W]
Time / [days]
Stockholm
Gdansk
Stuttgart
London
Lyon
Madrid
Rome
0 20 40 60 80 100 120 140 160 180 2000
0.2
0.4
0.6
0.8
1
1.2
1.4
1.6
Qd
ot
/ [k
W]
Time / [days]
Stockholm
Gdansk
Stuttgart
London
Lyon
Madrid
Rome
Fifth German-Austrian IBPSA Conference RWTH Aachen University
- 348 -

SPF as a function of climate and building
standard
Two seasonal performance factors (SPF) of the tested
system are presented. The first SPFsys refers to the
ratio of the heating supply and the total electrical
consumption (Eq. (1)). The second one, SPFHP,
accounts only for theperformance of the micro-heat
pump (Eq. (2)):
𝑆𝑃𝐹𝑠𝑦𝑠 =𝑄𝑠𝑦𝑠
𝑊𝑒𝑙 _𝑠𝑦𝑠
(1)
𝑆𝑃𝐹𝐻𝑃 =𝑄𝐻𝑃
𝑊𝑒𝑙 _𝐻𝑃
(2)
Here SPFsysis seasonal performance factor of the
system (-), 𝑄𝑠𝑦𝑠 heating supply of the system (kWh),
SPFHPseasonal performance factor of the micro-heat
pump (-), 𝑄𝐻𝑃 heating supply of heat pump (kWh)
and 𝑊𝑒𝑙 _𝐻𝑃 electrical consumption of heat pump
(kWh).
The heating demand is almost the same in all
climates.The SPF can be used for the system
comparison. In Figure 12 the SPFHP and SPFsysare
presented. The performance of the micro-heat pump
is hardly influenced by the different climatic
conditions and energy standards. This happens since
the influence of the ambient temperature on the COP
is almost negligible (see Figure 7 bottom). The
increase of ambient air temperature leads to higher
exhaust air temperature (source temperature of the
heat pump) but also to a higher power at the
condenser resulting a higher supply air temperature
(sink temperature of the heat pump). Thus, the
benefit of higher source temperature is eliminatedby
the higher sink temperature of the heat pump
(Eq.(3)).
COP = 𝜂𝑐𝑎𝑟𝑛𝑜𝑡𝑇𝑠𝑛𝑘
𝑇𝑠𝑛𝑘 − 𝑇𝑠𝑟𝑐 (3)
Here 𝜂𝑐𝑎𝑟𝑛𝑜𝑡 is the Carnot performance factor, 𝑇𝑠𝑟𝑐
the source and 𝑇𝑠𝑛𝑘 the sink air temperature of the
heat pump.
The system performance depends on both building
standards and climatic conditions. In case of Passive
House standard, the SPFsysis higher since the share of
backup heater of electricity consumption is less (max
share in PH standard is 4.9 % when in EnerPHit is
18.3 %). By varying the climatic conditions,both the
shares of defroster of the MVHRand backup heater
are changing influencing the SPFsys. The higher
SPFsys is observed for PH standard in climate of
London (Figure 12), since there is almost no need for
backup heater (see Figure 10) and no use of the
defroster.
Figure 12: SPF of the micro-heatpump (HP) and of
the system (sys) for different energy building
standard and locations (climates).
Influence of the size of the heat pump power and
of the control strategy on the performance
A set of dynamic simulations is performed to
investigate the influence of the controller. At a first
step sensitivity analysis is performed assuming
constant compressor frequency. The on/off controller
with hysteresis is used. The different RPM
correspond to different heating capacity of the micro-
heat pump (see Table 3).
Table 3:
Heating capacity of micro-heat pump at 0 °C
ambient temperature
RPM PHP / [W] COP
2000 384 3.84
2500 453 3.33
3000 520 2.96
3500 584 2.68
4000 646 2.40
4500 710 2.11
In Figure 13 and Figure 14 the system SPF is plotted
as a function of the RPM and having as parameter the
climate for PH and EnerPHit standard, respectively.
With the present boundary conditions the SPFsys is
higher with RPM range is from 2000 to 3000 for PH
and 3000 to 3500 for EnePHit standard. A heat pump
with lower heating capacity than the maximum
building heating load increases the system
performance despite the higher share of backup
heater.
The optimum RPM varying also with the climate, i.e.
for PH standard, the highest SPF is observed for
2000 RPM in climate of London, 2500 RPM in
Stuttgart and 3000 RPM in Lyon. In case of EnerPHit
standard, the optimum RPM is 2500 in London, 3000
in Gdansk and 3500 in Rome.
1,0
1,2
1,4
1,6
1,8
2,0
2,2
2,4
SPF
/ [-
]
PH HP EN HP PH sys EN sys
Fifth German-Austrian IBPSA Conference RWTH Aachen University
- 349 -
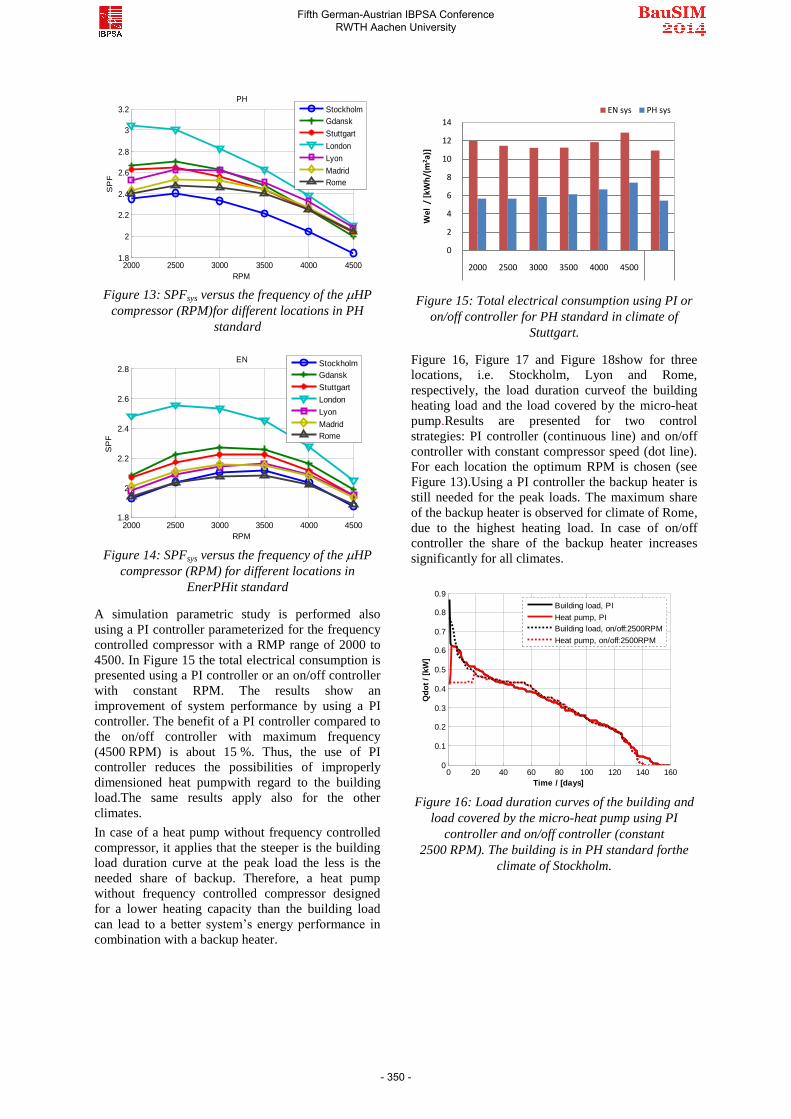
Figure 13: SPFsys versus the frequency of the HP
compressor (RPM)for different locations in PH
standard
Figure 14: SPFsys versus the frequency of the HP
compressor (RPM) for different locations in
EnerPHit standard
A simulation parametric study is performed also
using a PI controller parameterized for the frequency
controlled compressor with a RMP range of 2000 to
4500. In Figure 15 the total electrical consumption is
presented using a PI controller or an on/off controller
with constant RPM. The results show an
improvement of system performance by using a PI
controller. The benefit of a PI controller compared to
the on/off controller with maximum frequency
(4500 RPM) is about 15 %. Thus, the use of PI
controller reduces the possibilities of improperly
dimensioned heat pumpwith regard to the building
load.The same results apply also for the other
climates.
In case of a heat pump without frequency controlled
compressor, it applies that the steeper is the building
load duration curve at the peak load the less is the
needed share of backup. Therefore, a heat pump
without frequency controlled compressor designed
for a lower heating capacity than the building load
can lead to a better system’s energy performance in
combination with a backup heater.
Figure 15: Total electrical consumption using PI or
on/off controller for PH standard in climate of
Stuttgart.
Figure 16, Figure 17 and Figure 18show for three
locations, i.e. Stockholm, Lyon and Rome,
respectively, the load duration curveof the building
heating load and the load covered by the micro-heat
pump.Results are presented for two control
strategies: PI controller (continuous line) and on/off
controller with constant compressor speed (dot line).
For each location the optimum RPM is chosen (see
Figure 13).Using a PI controller the backup heater is
still needed for the peak loads. The maximum share
of the backup heater is observed for climate of Rome,
due to the highest heating load. In case of on/off
controller the share of the backup heater increases
significantly for all climates.
Figure 16: Load duration curves of the building and
load covered by the micro-heat pump using PI
controller and on/off controller (constant
2500 RPM). The building is in PH standard forthe
climate of Stockholm.
2000 2500 3000 3500 4000 45001.8
2
2.2
2.4
2.6
2.8
3
3.2
RPM
SP
F
PH
Stockholm
Gdansk
Stuttgart
London
Lyon
Madrid
Rome
2000 2500 3000 3500 4000 45001.8
2
2.2
2.4
2.6
2.8
RPM
SP
F
EN
Stockholm
Gdansk
Stuttgart
London
Lyon
Madrid
Rome
0
2
4
6
8
10
12
14
2000 2500 3000 3500 4000 4500
Wel
/ [
kWh
/(m
2a)
]
EN sys PH sys
0 20 40 60 80 100 120 140 1600
0.1
0.2
0.3
0.4
0.5
0.6
0.7
0.8
0.9
Qd
ot
/ [k
W]
Time / [days]
Building load, PI
Heat pump, PI
Building load, on/off:2500RPM
Heat pump, on/off:2500RPM
Fifth German-Austrian IBPSA Conference RWTH Aachen University
- 350 -
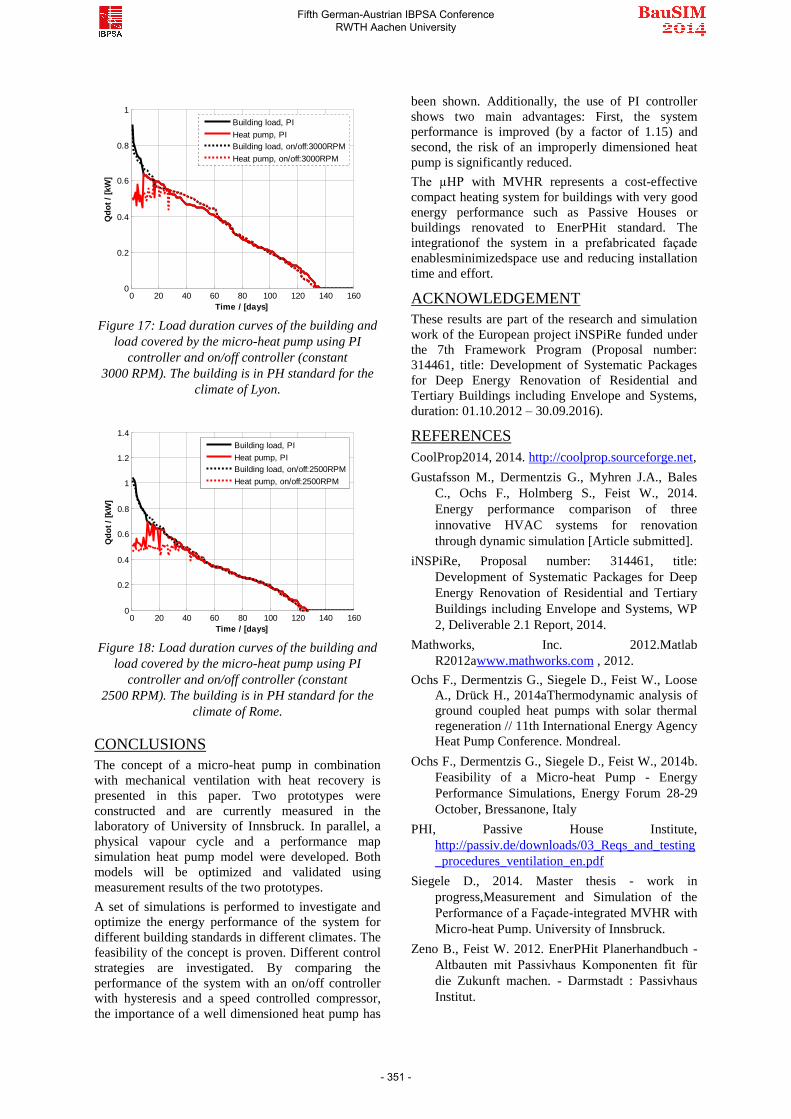
Figure 17: Load duration curves of the building and
load covered by the micro-heat pump using PI
controller and on/off controller (constant
3000 RPM). The building is in PH standard for the
climate of Lyon.
Figure 18: Load duration curves of the building and
load covered by the micro-heat pump using PI
controller and on/off controller (constant
2500 RPM). The building is in PH standard for the
climate of Rome.
CONCLUSIONS
The concept of a micro-heat pump in combination
with mechanical ventilation with heat recovery is
presented in this paper. Two prototypes were
constructed and are currently measured in the
laboratory of University of Innsbruck. In parallel, a
physical vapour cycle and a performance map
simulation heat pump model were developed. Both
models will be optimized and validated using
measurement results of the two prototypes.
A set of simulations is performed to investigate and
optimize the energy performance of the system for
different building standards in different climates. The
feasibility of the concept is proven. Different control
strategies are investigated. By comparing the
performance of the system with an on/off controller
with hysteresis and a speed controlled compressor,
the importance of a well dimensioned heat pump has
been shown. Additionally, the use of PI controller
shows two main advantages: First, the system
performance is improved (by a factor of 1.15) and
second, the risk of an improperly dimensioned heat
pump is significantly reduced.
The µHP with MVHR represents a cost-effective
compact heating system for buildings with very good
energy performance such as Passive Houses or
buildings renovated to EnerPHit standard. The
integrationof the system in a prefabricated façade
enablesminimizedspace use and reducing installation
time and effort.
ACKNOWLEDGEMENT
These results are part of the research and simulation
work of the European project iNSPiRe funded under
the 7th Framework Program (Proposal number:
314461, title: Development of Systematic Packages
for Deep Energy Renovation of Residential and
Tertiary Buildings including Envelope and Systems,
duration: 01.10.2012 – 30.09.2016).
REFERENCES
CoolProp2014, 2014. http://coolprop.sourceforge.net,
Gustafsson M., Dermentzis G., Myhren J.A., Bales
C., Ochs F., Holmberg S., Feist W., 2014.
Energy performance comparison of three
innovative HVAC systems for renovation
through dynamic simulation [Article submitted].
iNSPiRe, Proposal number: 314461, title:
Development of Systematic Packages for Deep
Energy Renovation of Residential and Tertiary
Buildings including Envelope and Systems, WP
2, Deliverable 2.1 Report, 2014.
Mathworks, Inc. 2012.Matlab
R2012awww.mathworks.com , 2012.
Ochs F., Dermentzis G., Siegele D., Feist W., Loose
A., Drück H., 2014aThermodynamic analysis of
ground coupled heat pumps with solar thermal
regeneration // 11th International Energy Agency
Heat Pump Conference. Mondreal.
Ochs F., Dermentzis G., Siegele D., Feist W., 2014b.
Feasibility of a Micro-heat Pump - Energy
Performance Simulations, Energy Forum 28-29
October, Bressanone, Italy
PHI, Passive House Institute,
http://passiv.de/downloads/03_Reqs_and_testing
_procedures_ventilation_en.pdf
Siegele D., 2014. Master thesis - work in
progress,Measurement and Simulation of the
Performance of a Façade-integrated MVHR with
Micro-heat Pump. University of Innsbruck.
Zeno B., Feist W. 2012. EnerPHit Planerhandbuch -
Altbauten mit Passivhaus Komponenten fit für
die Zukunft machen. - Darmstadt : Passivhaus
Institut.
0 20 40 60 80 100 120 140 1600
0.2
0.4
0.6
0.8
1Q
do
t /
[kW
]
Time / [days]
Building load, PI
Heat pump, PI
Building load, on/off:3000RPM
Heat pump, on/off:3000RPM
0 20 40 60 80 100 120 140 1600
0.2
0.4
0.6
0.8
1
1.2
1.4
Qd
ot
/ [k
W]
Time / [days]
Building load, PI
Heat pump, PI
Building load, on/off:2500RPM
Heat pump, on/off:2500RPM
Fifth German-Austrian IBPSA Conference RWTH Aachen University
- 351 -