a dot-matrix program with dynamic threshold control suited...
TRANSCRIPT

Ž .Gene 167 1996 GC1–10
A dot-matrix program with dynamic threshold control suited for genomicDNA and protein sequence analysis
Erik L.L. Sonnhammer a,), Richard Durbin a,b,1
a Sanger Centre, Hinxton Hall, Cambridge CB10 1RQ, UKb MRC Laboratory of Molecular Biology, Hills Road, Cambridge CB2 2QH, UK
Received 30 June 1995; revised 17 September 1995; accepted 4 October 1995Published 17 October 1995
Abstract
Graphical dot-matrix plots can provide the most complete and detailed comparison of two sequences. Presented here is DOTTER 2, adot-plot program for X-windows which can compare DNA or protein sequences, and also DNA versus protein.
The main novel feature of DOTTER is that the user can vary the stringency cutoffs interactively, so that the dot-matrix only needs tobe calculated once. This is possible thanks to a ‘Greyramp tool’ that was developed to change the displayed stringency of the matrix bydynamically changing the greyscale rendering of the dots. The Greyramp tool allows the user to interactively change the lower and upperscore limit for the greyscale rendering. This allows exploration of the separation between signal and noise, and fine-grained visualisationof different score levels in the dot-matrix.
Other useful features are dot-matrix compression, mouse-controlled zooming, sequence alignment display and savingrloading ofdot-matrices. Since the matrix only has to be calculated once and since the algorithm is fast and linear in space, DOTTER is practical touse even for sequences as long as cosmids.
DOTTER was integrated in the gene-modelling module of the genomic database system ACEDB 3. This was done via the homologyviewer BLIXEM in a way that also allows segments from the BLAST suite of searching programs to be superimposed on top of the fulldot-matrix. This feature can also be used for very quick finding of the strongest matches. As examples, we analyse a Caenorhabditiselegans cosmid with several tandem repeat families, and illustrate how DOTTER can improve gene modelling.
Keywords: Sequence analysis, DNA; Genome analysis; User interface; Analysis; Software, package; Laboratory informatics; Community informatics
1. Introduction
Ever since the introduction of graphical dot-matrix plotsw xto sequence analysis 1,2 , they have been among the most
popular methods for analysing similarity between twosequences, particularly for gaining a good picture of thesimilarity between repeated domains.
The original dot-plot concept of drawing one sequencealong the horizontal axis and the other along the verticalaxis of a coordinate system, and drawing a dot where tworesidues match has essentially stayed the same. Regions of
Abbreviations: MSP: Maximal Segment Pair) Corresponding author. Fax: q44 1223 494919; Tel.: q44 1223
494991. E-mail: [email protected] Fax: q44 1223 494978. E-mail: [email protected] http:rrwww.sanger.ac.ukrdotter.html3 ftp:rrftp.sanger.ac.ukrpubracedb
similarity between the sequences will result in a diagonalrow of dots, whereas spurious matches give rise to abackground of single dots. A standard filtering techniqueto reduce the noise is to apply a window along thediagonals and only draw a dot in the centre of the windowif the sum of all dots in the window exceeds some scorethreshold.
One problem is that the optimal threshold for drawing adot is hard to guess a priori. Poor choice of threshold mayresult in dot-plots either too full of noise or lacking therelevant diagonals. This can be frustrating, since changingthe threshold usually requires recalculation of the entiredot-plot, which often is very time consuming. Estimating
w xthe threshold by probabilistic methods 3–7 can be of usefor finding the approximate border region between signaland noise, but still usually requires recalculation of thedot-matrix at different score levels. Inspecting the dot-plotat different thresholds is very informative since it gives a
0378-1119r95r$09.50 q 1995 Elsevier Science B.V. All rights reservedŽ .SSDI 0378-1119 95 00714-8

( )E.L.L. Sonnhammer, R. DurbinrGene 167 1996 1–102
better picture of the strength of a diagonal relative to thew x 4noise and other 8 . DOTTER was created to make this
interactive aspect of dot-plots more powerful than in previ-ous implementations.
ŽImprovements on the classical single-bit dot-plot where.dots are either on or off have been to encode the score of
w xa dot by colours 9–11 or by lines of varying thicknessw x7 . However, none of these programs can plot more than16 different colours or shapes, and since they can not bemodified dynamically to other thresholds, they do noteliminate the need for recalculation if another stringencyrendering is required.
Modern graphics hardware offers new possibilities foraddressing this problem. DOTTER allows the user to setscore thresholds dynamically after the dot-matrix has beencalculated, using the X-windows system for changingscreen colours on 8-bit displays. This is done by a mouse-controlled ‘Greyramp’ tool which lets the user modify twoscore thresholds which can either be used as a strict - all ornothing - cutoff, or as a smooth rendering of many differ-ent score levels at once. Dots scoring below the firstthreshold are invisible and dots scoring above the secondthreshold get the maximum intensity while dots scoringbetween the thresholds are rendered with an intensityproportional to their score. Employing 128 differentgreyscale colours ensures a smooth range of intensityvalues.
Computationally, the main problem with dot-plots isthat the execution time is proportional to the product of thelengths of the sequences, which makes long sequencesvery time consuming. This problem has been attacked by
w xheuristic approaches 12,13 and trees combined withw xheuristics 14 . Such techniques can give improvements in
speed of several orders of magnitude, at the cost ofgenerating a not entirely correct dot-matrix. For long se-quences, where an overview of the strongest matches is ofmain interest, such approximations may be acceptable, butfor detailed analysis of weak similarities the full matrixstill needs to be calculated. We recognise the usefulness ofsuch fast methods and have therefore equipped DOTTERwith the ability to also read in matches produced by the
w xBLAST suite 15 . Displaying ungapped matches fromBLAST is also informative since it shows the extent ofhigh-scoring segments.
DOTTER is a versatile tool for dot-matrix comparisonsof DNA and protein sequences. It can produce dot-plots
4 http:rrwww.sanger.ac.ukrdotter.html
for DNA vs. DNA, protein vs. protein, and DNA vs.Protein. For DNA, it can draw the reverse complementdiagonals in the same dot-matrix as the forward ones. ForDNA vs. protein, it translates the DNA sequence in thethree forward frames and draws them all in the samedot-matrix. All modes feature tools to inspect the sequencealignment of any diagonal.
2. Materials and methods
DOTTER 5 was written in the ANSI C language, usingthe graphics routines from the ACEDB 6 graphics libraryw x16 . Supported platforms are UNIX X-windows worksta-tions from Silicon Graphics, Digital and SUN.
2.1. Generating the dot-matrix
Here, the dot-matrix will not simply contain a zero or aŽ .one one bit for each dot as in the traditional dot-plot, but
Ž .a value between 0 and 255 8 bits s one byte . Thedot-matrix thus contains scores, averaged over a chosenwindow-span, but we prefer not to call it a ‘score matrix’to avoid confusion with the well-known pairwise scorematrices, such as PAM120 and BLOSUM62. The dot-ma-trix needs only to be calculated once for a given window-span.
For maximum speed, we precalculate score vectors forevery possible symbol in the vertical sequence along the
w xhorizontal sequence 17 . For DNA, this requires 4q1Ž .score vectors 1 extra for unknown symbols , and for
Žprotein 20q2q1 20 amino acids, 2 for ambiguity sym-.bols and 1 for unknowns . This makes execution faster
since the few score vectors only have to be calculated onceand are later added to and removed from the slidingwindow-sums. The window-sums are calculated for con-secutive windows along the diagonal in a sliding mannerby simply adding the next score and subtracting the lastscore inside the window. Instead of calculating the win-dow-sums for one diagonal at a time however, we keep ahorizontal vector of all window-sums and add and subtractthe precalculated score vectors row by row.
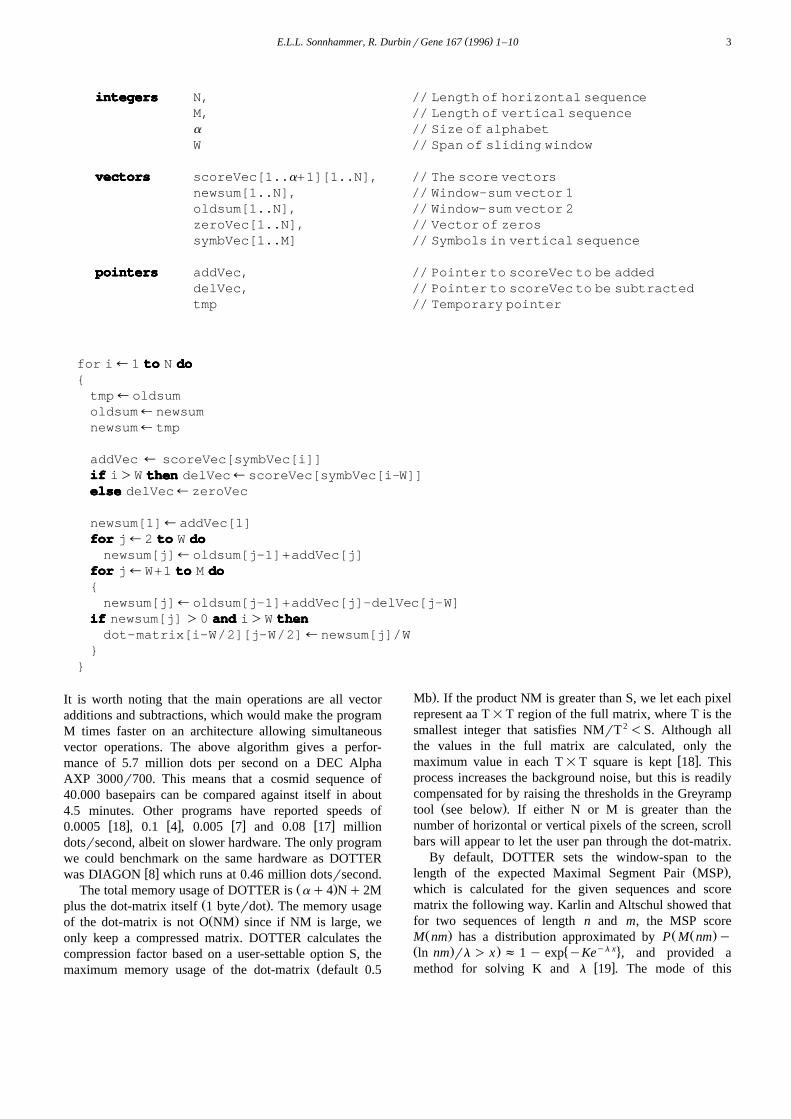
The following pseudocode outlines the algorithm. Thescore vectors are assumed to be initialised with the scoresfrom the pairwise score matrix used.
5 http:rrwww.sanger.ac.ukrdotter.html6 ftp:rrftp.sanger.ac.ukrpubracedb
( )E.L.L. Sonnhammer, R. DurbinrGene 167 1996 1–10 3
iiiiinnnnnttttteeeeegggggeeeeerrrrrsssss N, // Length of horizontal sequenceM, // Length of vertical sequencea // Size of alphabetW // Span of sliding window
vvvvveeeeeccccctttttooooorrrrrsssss scoreVec[1..a+1][1..N], // The score vectorsnewsum[1..N], // Window-sum vector 1oldsum[1..N], // Window-sum vector 2zeroVec[1..N], // Vector of zerossymbVec[1..M] // Symbols in vertical sequence
pppppoooooiiiiinnnnnttttteeeeerrrrrsssss addVec, // Pointer to scoreVec to be addeddelVec, // Pointer to scoreVec to be subtractedtmp // Temporary pointer
for i¤1 tttttooooo N dddddooooo{tmp¤oldsumoldsum¤newsumnewsum¤tmp
addVec ¤ scoreVec[symbVec[i]]iiiiifffff i)W ttttthhhhheeeeennnnn delVec¤scoreVec[symbVec[i-W]]eeeeelllllssssseeeee delVec¤zeroVec
newsum[1]¤addVec[1]fffffooooorrrrr j¤2 tttttooooo W dddddooooonewsum[j]¤oldsum[j-1]+addVec[j]
fffffooooorrrrr j¤W+1 tttttooooo M dddddooooo{newsum[j]¤oldsum[j-1]+addVec[j]-delVec[j-W]
iiiiifffff newsum[j] )0 aaaaannnnnddddd i)W ttttthhhhheeeeennnnndot-matrix[i-W/2][j-W/2]¤newsum[j]/W
}}
It is worth noting that the main operations are all vectoradditions and subtractions, which would make the programM times faster on an architecture allowing simultaneousvector operations. The above algorithm gives a perfor-mance of 5.7 million dots per second on a DEC AlphaAXP 3000r700. This means that a cosmid sequence of40.000 basepairs can be compared against itself in about4.5 minutes. Other programs have reported speeds of
w x w x w x w x0.0005 18 , 0.1 4 , 0.005 7 and 0.08 17 milliondotsrsecond, albeit on slower hardware. The only programwe could benchmark on the same hardware as DOTTER
w xwas DIAGON 8 which runs at 0.46 million dotsrsecond.Ž .The total memory usage of DOTTER is aq4 Nq2M
Ž .plus the dot-matrix itself 1 byterdot . The memory usageŽ .of the dot-matrix is not O NM since if NM is large, we
only keep a compressed matrix. DOTTER calculates thecompression factor based on a user-settable option S, the
Žmaximum memory usage of the dot-matrix default 0.5
.Mb . If the product NM is greater than S, we let each pixelrepresent aa T=T region of the full matrix, where T is thesmallest integer that satisfies NMrT2 -S. Although allthe values in the full matrix are calculated, only the
w xmaximum value in each T=T square is kept 18 . Thisprocess increases the background noise, but this is readilycompensated for by raising the thresholds in the Greyramp
Ž .tool see below . If either N or M is greater than thenumber of horizontal or vertical pixels of the screen, scrollbars will appear to let the user pan through the dot-matrix.
By default, DOTTER sets the window-span to theŽ .length of the expected Maximal Segment Pair MSP ,
which is calculated for the given sequences and scorematrix the following way. Karlin and Altschul showed thatfor two sequences of length n and m, the MSP scoreŽ . Ž Ž .M nm has a distribution approximated by P M nm y
Ž . . � yl x4ln nm rl ) x f 1 y exp yKe , and provided aw xmethod for solving K and l 19 . The mode of this

( )E.L.L. Sonnhammer, R. DurbinrGene 167 1996 1–104

( )E.L.L. Sonnhammer, R. DurbinrGene 167 1996 1–10 5
Fig. 2. DOTTER plot of DNA vs. protein with gene predictions from ACEDB. Shown here is a stretch of genomic DNA from the C. elegans cosmidŽ . Ž . Ž .ZK637 EMBL Z11115 compared to the protein glutathione reductase from Escherichia coli SWISSPROT P06715 . The gene prediction ZK637.10
w xwas made in ACEDB, but some exons have only very weak homology. Matches found by BLASTrMSPcrunch 20 are superimposed in the dot-plot asred lines. The match at exon 3 was too weak to be reported by BLASTrMSPcrunch, but it is visible in the dot-plot. Also, the BLAST match at the end ofexon 5 was extended past an insertion, whereas the dot-plot shows the correct diagonal. The Alignment tool shows the alignment of the three translated
Ž .forward frames of ZK637 with GSHR_ECOLI at the end of exon 5 see crosshair position . Frame 2 contains the match missed by BLAST. Thecalculation took 0.6 seconds.
Ždistribution, or the expected MSP score is then ln nmq.ln K rl. The expected score per residue in an MSP is
� 4RsSq S ; q sp p exp lS , where p and p are thei j i j i j i j i j i j
symbol frequencies in the sequences. By dividing theexpected MSP score with the expected score per residuewe obtain a simple approximation to the expected MSP
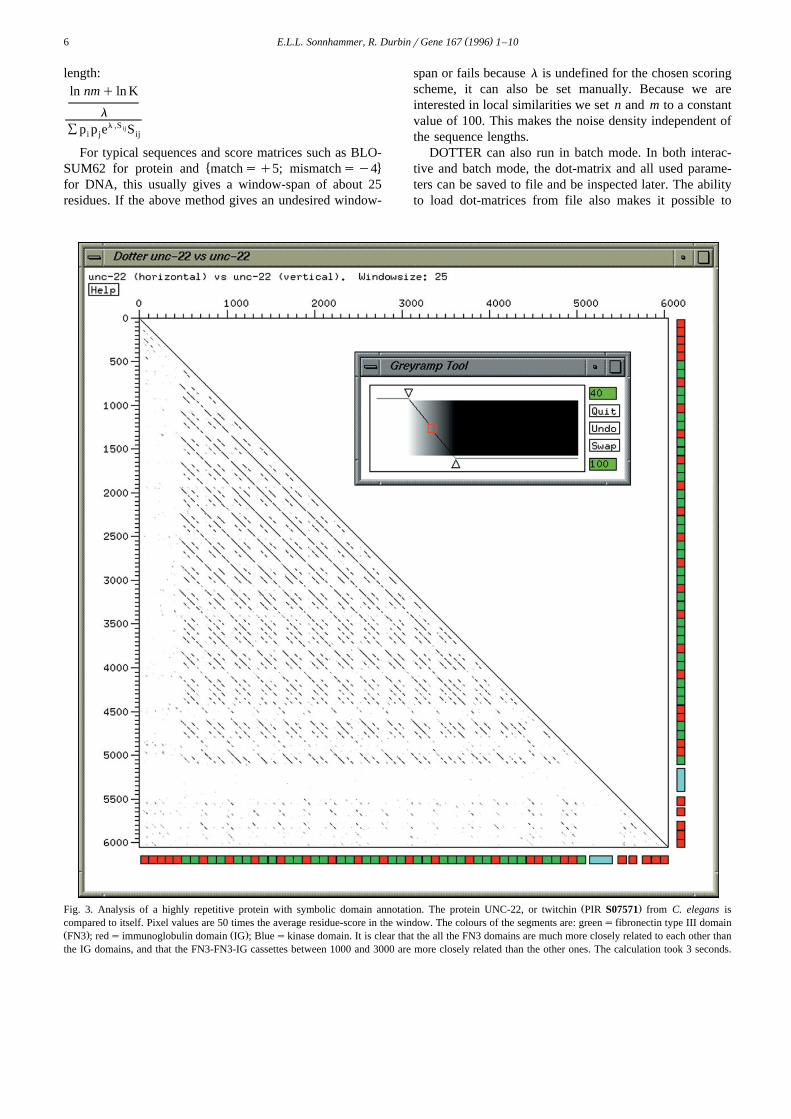
Ž . Ž .Fig. 1. Dot-matrix analysis of the C. elegans cosmid ZK1307, EMBL Z47358 with DOTTER. a The entire cosmid compared to itself, with the forwardand reverse direction diagonals superimposed. Only half the dot-matrix is drawn since the other half is an identical mirror image. Features that can be seenat this level are an inverted repeat at 4000–6000, a region containing a multitude of small tandem direct and inverted repeats at 6700–9500 and aduplicated gene repeat at 25000–28000. The alignment in both directions at the position of the crosshair is shown in the Alignment tool window in the
Ž . Ž .middle. b Zoomed in detail of a in a tandem repeat region of about 100 10 bp repeats between 6700 and 8100. The Greyramp Tool is used to view thedot-matrix at different stringencies. The pixel values are 50 times the average residue-score in the window, meaning that a 100% identical match wouldscore 250, given the scoring scheme of q5 for matches and y4 for mismatches. Any dot scoring below the min threshold of 10 will be invisible, dots
Ž .above the max threshold of 70 will be completely black, and dots in between will be drawn in a greyscale proportional to their score. c If the renderingthresholds are moved up to 70–130, it becomes clear that every 4 of the 10 bp repeats have stronger similarity with each other, suggesting a super-structure
Ž .repeat unit of 40 bp. d Moving the thresholds up to 130–190 shows only the 40 bp repeat structure in the forward direction and only faint invertedŽ . Ž . Ž . Ž .diagonals, also with a pitch of 40 bp. The calculation of a took 170 seconds and of b , c and d , which are different renderings of one dot-matrix, 0.1
seconds.
( )E.L.L. Sonnhammer, R. DurbinrGene 167 1996 1–106
length:ln nmq ln K
ll ,S ijÝ p p e Si j ij
For typical sequences and score matrices such as BLO-� 4SUM62 for protein and matchsq5; mismatchsy4
for DNA, this usually gives a window-span of about 25residues. If the above method gives an undesired window-
span or fails because l is undefined for the chosen scoringscheme, it can also be set manually. Because we areinterested in local similarities we set n and m to a constantvalue of 100. This makes the noise density independent ofthe sequence lengths.
DOTTER can also run in batch mode. In both interac-tive and batch mode, the dot-matrix and all used parame-ters can be saved to file and be inspected later. The abilityto load dot-matrices from file also makes it possible to
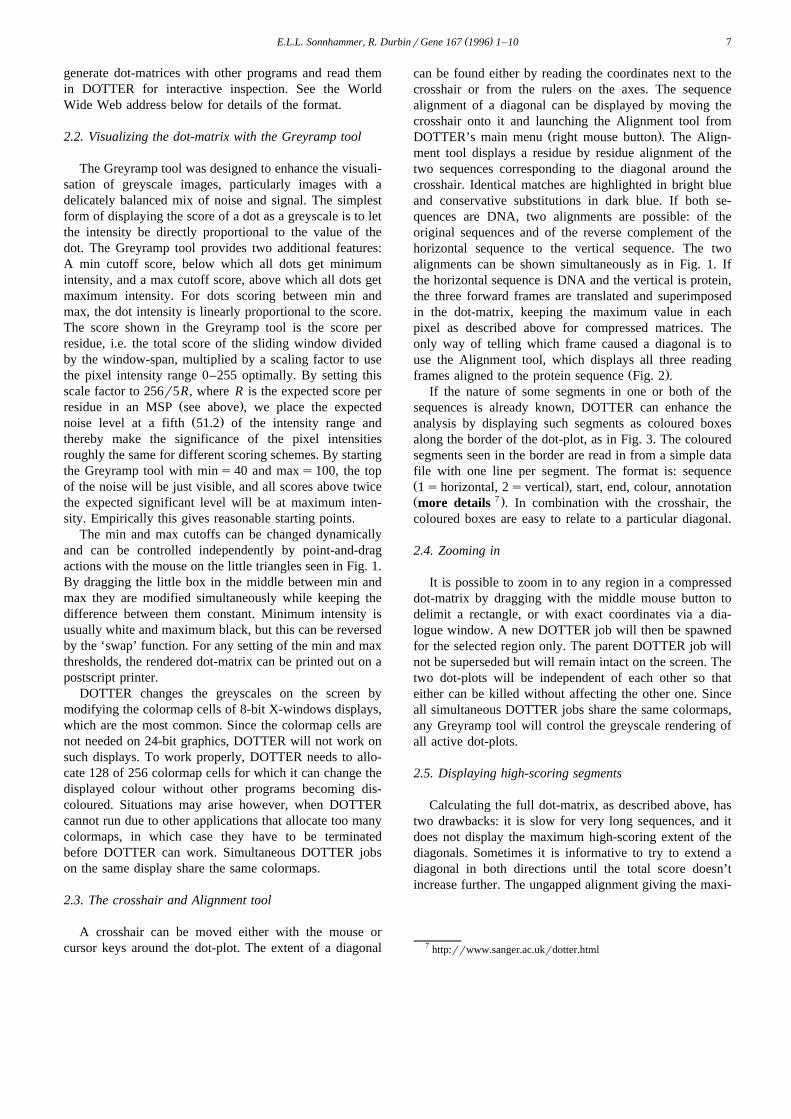
Ž .Fig. 3. Analysis of a highly repetitive protein with symbolic domain annotation. The protein UNC-22, or twitchin PIR S07571 from C. elegans iscompared to itself. Pixel values are 50 times the average residue-score in the window. The colours of the segments are: greens fibronectin type III domainŽ . Ž .FN3 ; reds immunoglobulin domain IG ; Blueskinase domain. It is clear that the all the FN3 domains are much more closely related to each other thanthe IG domains, and that the FN3-FN3-IG cassettes between 1000 and 3000 are more closely related than the other ones. The calculation took 3 seconds.
( )E.L.L. Sonnhammer, R. DurbinrGene 167 1996 1–10 7
generate dot-matrices with other programs and read themin DOTTER for interactive inspection. See the WorldWide Web address below for details of the format.
2.2. Visualizing the dot-matrix with the Greyramp tool
The Greyramp tool was designed to enhance the visuali-sation of greyscale images, particularly images with adelicately balanced mix of noise and signal. The simplestform of displaying the score of a dot as a greyscale is to letthe intensity be directly proportional to the value of thedot. The Greyramp tool provides two additional features:A min cutoff score, below which all dots get minimumintensity, and a max cutoff score, above which all dots getmaximum intensity. For dots scoring between min andmax, the dot intensity is linearly proportional to the score.The score shown in the Greyramp tool is the score perresidue, i.e. the total score of the sliding window dividedby the window-span, multiplied by a scaling factor to usethe pixel intensity range 0–255 optimally. By setting thisscale factor to 256r5R, where R is the expected score per
Ž .residue in an MSP see above , we place the expectedŽ .noise level at a fifth 51.2 of the intensity range and
thereby make the significance of the pixel intensitiesroughly the same for different scoring schemes. By startingthe Greyramp tool with mins40 and maxs100, the topof the noise will be just visible, and all scores above twicethe expected significant level will be at maximum inten-sity. Empirically this gives reasonable starting points.
The min and max cutoffs can be changed dynamicallyand can be controlled independently by point-and-dragactions with the mouse on the little triangles seen in Fig. 1.By dragging the little box in the middle between min andmax they are modified simultaneously while keeping thedifference between them constant. Minimum intensity isusually white and maximum black, but this can be reversedby the ‘swap’ function. For any setting of the min and maxthresholds, the rendered dot-matrix can be printed out on apostscript printer.
DOTTER changes the greyscales on the screen bymodifying the colormap cells of 8-bit X-windows displays,which are the most common. Since the colormap cells arenot needed on 24-bit graphics, DOTTER will not work onsuch displays. To work properly, DOTTER needs to allo-cate 128 of 256 colormap cells for which it can change thedisplayed colour without other programs becoming dis-coloured. Situations may arise however, when DOTTERcannot run due to other applications that allocate too manycolormaps, in which case they have to be terminatedbefore DOTTER can work. Simultaneous DOTTER jobson the same display share the same colormaps.
2.3. The crosshair and Alignment tool
A crosshair can be moved either with the mouse orcursor keys around the dot-plot. The extent of a diagonal
can be found either by reading the coordinates next to thecrosshair or from the rulers on the axes. The sequencealignment of a diagonal can be displayed by moving thecrosshair onto it and launching the Alignment tool from
Ž .DOTTER’s main menu right mouse button . The Align-ment tool displays a residue by residue alignment of thetwo sequences corresponding to the diagonal around thecrosshair. Identical matches are highlighted in bright blueand conservative substitutions in dark blue. If both se-quences are DNA, two alignments are possible: of theoriginal sequences and of the reverse complement of thehorizontal sequence to the vertical sequence. The twoalignments can be shown simultaneously as in Fig. 1. Ifthe horizontal sequence is DNA and the vertical is protein,the three forward frames are translated and superimposedin the dot-matrix, keeping the maximum value in eachpixel as described above for compressed matrices. Theonly way of telling which frame caused a diagonal is touse the Alignment tool, which displays all three reading
Ž .frames aligned to the protein sequence Fig. 2 .If the nature of some segments in one or both of the
sequences is already known, DOTTER can enhance theanalysis by displaying such segments as coloured boxesalong the border of the dot-plot, as in Fig. 3. The colouredsegments seen in the border are read in from a simple datafile with one line per segment. The format is: sequenceŽ .1shorizontal, 2svertical , start, end, colour, annotationŽ 7.more details . In combination with the crosshair, thecoloured boxes are easy to relate to a particular diagonal.
2.4. Zooming in
It is possible to zoom in to any region in a compresseddot-matrix by dragging with the middle mouse button todelimit a rectangle, or with exact coordinates via a dia-logue window. A new DOTTER job will then be spawnedfor the selected region only. The parent DOTTER job willnot be superseded but will remain intact on the screen. Thetwo dot-plots will be independent of each other so thateither can be killed without affecting the other one. Sinceall simultaneous DOTTER jobs share the same colormaps,any Greyramp tool will control the greyscale rendering ofall active dot-plots.
2.5. Displaying high-scoring segments
Calculating the full dot-matrix, as described above, hastwo drawbacks: it is slow for very long sequences, and itdoes not display the maximum high-scoring extent of thediagonals. Sometimes it is informative to try to extend adiagonal in both directions until the total score doesn’tincrease further. The ungapped alignment giving the maxi-
7 http:rrwww.sanger.ac.ukrdotter.html
( )E.L.L. Sonnhammer, R. DurbinrGene 167 1996 1–108
Ž .mum score is called a high-scoring segment pair HSP .w xThe BLAST programs 15 search for HSPs in a fast,
heuristic fashion. Instead of replicating the BLAST algo-rithm, DOTTER simply reads in HSPs reported by BLASTand draws them in the dot-plot as in Fig. 2, similarly to
w xPLFASTA 12 for FASTA output. Here it is accomplishedw xvia the BLAST output viewer BLIXEM 20 , which con-
structs a multiple alignment of HSPs reported by BLASTand displays it graphically in a scrollable window. Theadvantage of this is that BLIXEM first can give an overviewof all sequences that match a given query. The mostinteresting homologies can then be explored in much finerdetail by calling up DOTTER ‘on the fly’. BLIXEM handsthe HSPs over to DOTTER, which can display the HSPs intwo different ways: by greyscale according the total HSPscore, or by monochrome red lines which can be superim-posed over the full dot-matrix. It is also possible tosuperimpose four different shades of red to reflect thescore of the HSP.
2.6. Using DOTTER for gene prediction
8 w xThe genomic database ACEDB 21 allows interactivegene modelling, with full display of relevant features suchas splice sites, open reading frames, segments of highcoding potential, sequence homology, etc. If the gene inquestion has homologous sequences, the multiple align-ment of the homologues can be viewed by calling upBLIXEM from ACEDB, which also passes on the tentativegene prediction coordinates. For a more detailed analysisof how the homology fits with the gene prediction, thecoordinates of the predicted gene are also passed on fromBLIXEM to DOTTER, which then displays the dot-plotcomparison between the genomic DNA where the gene
Ž .was predicted and the homologous protein Fig. 2 . Havingthe gene prediction displayed in the dot-plot significantlyaids the ability to accept weakly conserved exons, and toreject ones that are inconsistent with the homology.
3. Application
Sequenced cosmids from the C. elegans genome se-w xquencing project 22 are routinely compared to themselves
with DOTTER 9 for analysis of the extent and nature ofdirect and inverted DNA repeats. Such repeats are inter-spersed throughout the genome, and there are many differ-
w xent recurring families 23 . For example, the C. elegansŽ .cosmid ZK1307 Fig. 1 contains several repeat families:
33q4 copies of a 40-mer, 22 copies of a 35-mer, 21copies of a 15-mer and 2 copies of a 123-mer whichcontain 5 copies of an 11-mer in the middle. Naclerio et al.
8 ftp:rrftp.sanger.ac.ukrpubracedb9 http:rrwww.sanger.ac.ukrdotter.html
previously described the first 3 of these repeat families andnamed them RcC9, Rc35 and RcD1, respectively. The 40
w xbp repeat RcC9 24 , between 6750 and 8050, shown indetail in Fig. 1b–d is especially interesting since it has aless strongly conserved subunit of 10 bp which itself ispalindromic, giving a minimal repeat unit in alternateorientations of only 5 bp: -TTC-. The smaller repeat unitsare however much less conserved than the 40 bp repeat. Atvery low stringency the dot-plot hence shows 10 bp spaced
Ž .diagonals in both orientations Fig. 1b . As the stringencyŽ .is raised Fig. 1c–d , the 10 bp spaced diagonals fade
away, leaving only the strongest conserved 40 bp repeatsin the dot-plot.
For arrays of tandem repeats such as this, DOTTERmakes it very easy to find the start and end of therepetitive unit and the number of repeats, which is espe-cially important for constructing high-quality multiplealignments. As illustrated in Fig. 1, it is often far fromtrivial to determine the length of the main repeat unit,since multiples or fractions thereof are plausible units too.With the Greyramp and Alignment tools, this becomes arelatively easy task.
The need for a dot-plot program that can compare DNAto protein sequences was also prompted by the C. elegansgenome project, where most primary protein homologyanalysis is carried out by comparing DNA to protein. Thereason for doing this is that using predicted coding seg-ments may miss homologies if the gene prediction wasincorrect. Database searching is usually done with theprogram BLASTX in conjunction with the filtering pro-
w xgram MSPcrunch 20 to increase sensitivity and selectiv-ity. The DNA-protein HSPs are then aligned in the X-windows viewer BLIXEM. Integration of DOTTER intoACEDB and BLIXEM hence made it natural to carry overthe DNA vs. protein philosophy to DOTTER, as shown inFig. 2. One could envisage using a different colour foreach translated frame, but given that real homologies arenormally confined to a single frame, and that the frame caneasily be determined with the Alignment tool, we foundthe best solution was to leave them in the standard greyscalecolours. The exons and introns of the gene prediction areshown just below the dot-plot border.
Fig. 3 shows a self-comparison of the protein UNC-22or twitchin, a large muscle protein which probably inter-
w x w xacts with myosin 25 26 . It consists of repeated fi-Ž . Ž .bronectin type III FN3 and immunoglobulin IG do-
mains and one kinase domain. At the N- and C-termini,five tandemly repeated IG domains are present, while theinterior contains repeated ‘cassettes’ of usually two FN3and one IG domain. With the coloured segment boxes, it iseasy to see how the similarity levels vary for the differentdomains. For instance, while the FN3 and IG domains inthe N-terminal portion of the cassette repeat region arevery similar, they are less conserved towards the ends.Especially the IG domains are very poorly conservedexcept in the middle of the cassette region. The five

( )E.L.L. Sonnhammer, R. DurbinrGene 167 1996 1–10 9
N-terminal IG domains are more similar to each other thanto other ones, whereas for the five C-terminal IG domainsthis is not the case. The dot-plots in Figs. 2 and 3 were
w xgenerated using the score matrix BLOSUM62 27 .
4. Discussion
DOTTER 10 is a new type of dot-plot program whichis well suited to handle demanding homology analysistasks involving weak and difficult to assess matches inboth traditional protein or DNA comparisons and in morecomplex situations when genomic DNA is compared toproteins or DNA. Its main strength is that the dot-matrixonly has to be calculated once, after which the stringencythresholds are varied dynamically, avoiding tedious reitera-tion of the dot-matrix calculation. This is particularlyuseful when no optimal stringency exists, for instance if adiagonal can only be seen when the background noise isalso visible. Such diagonals may still be biologically sig-nificant if they make good sense with other diagonalsandror if they contain important key residues. In caseslike this, it is desirable to view the dot-plot under manydifferent stringency conditions and be able to change themin a scrolling fashion.
w xThe program XSauci 28 also uses colormaps for dy-namic threshold control, for a variant of dot-plots called‘correlation images’, which transforms diagonals to hori-zontal lines. XSauci uses greyscales differently than DOT-TER however, in that the pixel intensity reflects the lengthof a match instead of the score, and it employs only onethreshold.
The integration of DOTTER into the multiple alignmentviewer for BLAST matches, BLIXEM, makes a verypowerful combination. With the add-on MSPcrunch,BLAST usually picks up at least one local match tohomologous sequences, but may miss weak matches ormatches to repeated domains. DOTTER can then be calledup directly from BLIXEM for a particular protein to showthe true extent of the homology. This system provides veryefficient and comfortable sequence homology analysis,with a minimal risk of overlooking similarities or assessingthem incorrectly.
Alignment algorithms based on dynamic programmingare a popular method of pairwise sequence similarityanalysis which can be very sensitive if the gap weights areset correctly. However, for weak similarities the alignmentis often very vulnerable to small changes in the gapweights, and often only a narrow range of parameters gives
w x w xthe correct alignment 29 30 . Dot-plots do not sufferfrom this problem, since no attempt is made to stringmatching segments together with gaps in between. Several
10 http:rrwww.sanger.ac.ukrdotter.html
users have asked if it would be possible to generate agapped alignment by dynamic programming from DOT-TER. Since this would not improve over the standardimplementations of dynamic programming, we have notincluded this feature. One might envisage however, thatthe user could select a number of diagonals, which areconsidered relevant. These segments could then be strungtogether in an alignment, possibly using dynamic program-ming to fill in the gaps, but allowing interactive control of
w xthe alignment path 31 .DOTTER is available by anonymous FTP 11, World
W id e W e b 1 2 o r b y se n d in g E -m a il [email protected]. ACEDB is available by anony-mous FTP 13.
Acknowledgements
We are grateful to Friedemann Wobus for work on theGreyramp tool and various other image handling softwarein the ACEDB graphics library, and to the C. eleganssequencing consortium, in particular Mary Berks for se-quencing the cosmid ZK1307. We thank Gos Micklem andSean Eddy for helpful discussions and John Sulston forreading the manuscript. The Sanger Centre is supported bythe Wellcome Trust and the MRC.
References
w x Ž .1 Fitch, W.M. 1969 Locating gaps in amino acid sequences tooptimize the homology between two proteins. Biochem. Genet. 3,99–108.
w x Ž .2 Gibbs, A.J. and McIntyre, G.A. 1970 The diagram: a method forcomparing sequences. Its use with amino acid and nucleotide se-quences. Eur. J. Biochem. 16, 1–11.
w x Ž .3 McLachlan, A.D. 1971 Test for comparing related amino acidsequences. Cytochrome c and cytochrome c551. J. Mol. Biol. 61,409–424.
w x Ž .4 McLachlan, A.D. 1983 Analysis of gene duplication repeats in themyosin rod. J. Mol. Biol. 169, 15–30.
w x Ž .5 McLachlan, A.D. and Boswell, D.R. 1985 Confidence limits forhomology in protein or gene sequences. The c-myc oncogene andAdenovirus E1A protein. J. Mol. Biol. 185, 39–49.
w x Ž .6 Reich, J.G. and Meiske, W. 1987 A simple statistical significancetest of window scores in large dot matrices obtained from protein ornucleic acid sequences. Comput. Appl. Biosci. 3, 25–30.
w x Ž .7 Argos, P. 1987 A sensitive procedure to compare amino acidsequences. J. Mol. Biol. 193, 385–396.
w x Ž .8 Staden, R. 1982 An interactive graphics program for comparingand aligning nucleic acid and amino acid sequences. Nucleic AcidsRes. 10, 2951–2961.
w x Ž .9 Maizel, J.V. Jr. and Lenk, R.P. 1981 Enhanced graphic matrixanalysis of nucleic acid and amino acid sequences. Proc. Natl. Acad.Sci. USA 78, 7665–7669.
11 ftp:rrftp.sanger.ac.ukrpubrdotter12 http:rrwww.sanger.ac.ukrdotter.html13 ftp:rrftp.sanger.ac.ukrpubracedb
( )E.L.L. Sonnhammer, R. DurbinrGene 167 1996 1–1010
w x Ž .10 Reisner, A.H. and Bucholtz, C.A. 1988 The use of various proper-ties of amino acids in color and monochrome dot-matrix analyses forprotein homologies. Comput. Appl. Biosci. 4, 395–402.
w x Ž .11 Zuker, M. 1991 Suboptimal sequence alignment in molecularbiology. Alignment with error analysis. J. Mol. Biol. 221, 403–420.
w x Ž .12 Pearson, W.R. and Lipman, D.J. 1988 Improved tools for biologi-cal sequence comparison. Proc. Natl. Acad. Sci. USA 85, 2444–2448.
w x Ž .13 Schwartz, S., Miller, W., Yang, C.M. and Hardison, R.C. 1991Software tools for analyzing pairwise alignments of long sequences.Nucleic Acids Res. 19, 4663–4667.
w x Ž .14 Lefevre, C. and Ikeda, J.E. 1994 A fast word search algorithm forthe representation of sequence similarity in genomic DNA. NucleicAcids Res. 22, 404–411.
w x15 Altschul, S.F., Gish, W., Miller, W., Myers, E.W. and Lipman, D.J.Ž .1990 Basic local alignment search tool. J. Mol. Biol. 215, 403–410.
w x Ž . ( )16 Durbin, R. 1995 unpublished ,w x Ž .17 Karreman C. 1992 A dotplot program for the Atari ST, for the
analysis of DNA and protein sequences. Comput. Appl. Biosci. 8,75–77.
w x Ž .18 Pustell, J.M. and Kafatos, F.C. 1982 A high speed, high capacityhomology matrix: zooming through SV40 and Polyoma. NucleicAcids Res. 10, 4765–4782.
w x Ž .19 Karlin, S. and Altschul, S.F. 1990 Methods for assessing thestatistical significance of molecular sequence features by usinggeneral scoring schemes. Proc. Natl. Acad. Sci. USA 87, 2264–2268.
w x Ž .20 Sonnhammer, E.L.L. and Durbin, R. 1994 A workbench for large-scale sequence homology analysis. Comput. Appl. Biosci. 10, 301–307.
w x Ž . ( )21 Durbin, R. and Thierry-Mieg, J. 1995 unpublished ,w x22 Wilson, R., Ainscough, R., Anderson, K., Baynes, C., Berks, M.,
Bonfield, J., Burton, J., Connell, M., Copsey, T., Cooper, J., Coul-son, A., Craxton, M., Dear, S., Du, Z., Durbin, R., Favello, A.,Fulton, L., Gardner, A., Green, P., Hawkins, T., Hillier, L., Jier, M.,Johnston, L., Jones, M., Kershaw, J., Kirsten, J., Laisster, N.,Latreille, P., Lightning, J., Lloyd, C., Mortimore, B., O’Callaghan,M., Parsons, J., Percy, C., Rifken, L., Roopra, A., Saunders, D.,
Shownkeen, R., Sims, M., Smaldon, N., Smith, A., Smith, M.,Sonnhammer, E., Staden, R., Sulston, J., Thierry-Mieg, J., Thomas,K., Vaudin, M., Vaughan, K., Waterston, R., Watson, A., Wein-
Ž .stock, L., Wilkinson-Sproat, J. and Wohldman, P. 1994 2.2 Mb ofcontiguous nucleotide sequence from chromosome III of C. elegans.Nature 368, 32–38.
w x23 Naclerio, G., Cangiano, G., Coulson, A., Levitt, A., Ruvolo, V. andŽ .La Volpe, A. 1992 Molecular and Genomic Organization of Clus-
ters of Repetitive DNA Sequences in Caenorhabditis elegans. J.Mol. Biol. 226, 159–168.
w x Ž .24 La Volpe, A., Ciaramella, M. and Bazzicalupo, P. 1988 Structure,evolution and properties of a novel repetitive DNA family inCaenorhabditis elegans. Nucleic Acids Res. 16, 8213–8231.
w x25 Benian, G.M., Kiff, J.E., Neckelmann, N., Moerman, D.G. andŽ .Waterston, R.H. 1989 Sequence of an unusually large protein
implicated in regulation of myosin activity in C. elegans. Nature342, 45–50.
w x Ž .26 Benian, G.M., L’Hernault, S.W. and Morris, M.E. 1993 AdditionalSequence Complexity in the Muscle Gene, unc-22, and Its EncodedProtein, Twitchin, of Caenorhabditis elegans. Genetics 134, 1097–1104.
w x Ž .27 Henikoff, S. and Henikoff, J.G. 1992 Amino acid substitutionmatrices from protein blocks. Proc. Natl. Acad. Sci. USA 89,10915–10919.
w x Ž .28 Nedde, D.N. and Ward, M.O. 1993 Visualizing relationships be-tween nucleic acid sequences using correlation images. Comput.Appl. Biosci. 9, 331–335.
w x Ž .29 Argos, P. and Vingron M. 1990 Sensitivity comparison of proteinamino acid sequences. Methods Enzymol. 183, 352–365.
w x Ž .30 Vingron, M. and Waterman, M.S. 1994 Sequence alignment andpenalty choice. Reviews of concepts, case studies and implications.J. Mol. Biol. 235, 1–12.
w x Ž .31 Rechid, R., Vingron, M. and Argos P. 1989 A new interactiveprotein sequence alignment program and comparison of its resultswith widely used algorithms. Comput. Appl. Biosci. 5, 107–113.