a dissertation presented to the department of biology
TRANSCRIPT
THE ROLE OF AUDITORY CORTEX IN SOUND DISCRIMINATION AND
PERCEPTION: INSIGHTS FROM OPTOGENETICS
by
CONOR THOMAS O’SULLIVAN
A DISSERTATION
Presented to the Department of Biology And the Graduate School of the University of Oregon
in partial fulfillment for the requirements for the degree of
Doctor of Philosophy
September 2019

DISSERTATION APPROVAL PAGE
Student: Conor Thomas O’Sullivan
Title: The Role of Auditory Cortex in Sound Perception and Discrimination: Insights from Optogenetics
This dissertation has been accepted and approved in partial fulfillment of the requirements for the Doctor of Philosophy degree in the Biology Department by:
Shawn Lockery Chairperson Michael Wehr Advisor Cris Niell Core Member Terry Takahashi Core Member Matt Smear Institutional Representative
and
Janet Woodruff-Borden Vice Provost and Dean of the Graduate School
Original approval signatures are on file with the University of Oregon Graduate School.
Degree awarded September 2019
!ii

© 2019 Conor Thomas O’Sullivan
!iii

DISSERTATION ABSTRACT
Conor Thomas O’Sullivan
Doctor of Philosophy
Department of Biology
September 2019
Title: The Role of Auditory Cortex in Sound Perception and Discrimination: Insights from Optogenetics
The modern era of neuroscience is characterized by massive amounts of data from
various methods of recording neuronal activity, but the role of this activity in behavior
remains elusive in many cases. Traditional manipulations of activity such as surgical
lesions or muscimol application often provide inconclusive information due to their
limitations. In this dissertation, I focus on the role of mouse auditory cortex in simple and
complex sound discrimination, using PV-ChR2 optogenetic suppression to establish a
causal relationship between activity and behavioral performance.
I first examined pure tone discrimination, comparing the effects of optogenetic
suppression and electrolytic lesions. Performance was unaffected by lesions but impaired
by optogenetic suppression time-locked to stimulus presentation, showing the necessity
of auditory cortex activity for successful discrimination. When optogenetic suppression
was extended to multiple trials and then the entire lesion recovery duration, the
impairment remained, suggesting a fundamental difference between the brain’s
adaptation to optogenetic suppression and permanent lesion damage.
!iv
Optogenetic suppression also impaired phoneme discrimination ability in mice.
This effect remained when either the “consonant” or “vowel” segments were temporally
targeted for suppression. Finally, I observed potential laser-related learning that could
complicate optogenetic suppression analysis, showing that mice can learn to associate
random rewards with the laser light cue or adapt to suppression when laser trials are
reinforced.
This dissertation includes previously published co-authored material.
!v

CURRICULUM VITAE
NAME OF AUTHOR: Conor Thomas O’Sullivan
GRADUATE AND UNDERGRADUATE SCHOOLS ATTENDED:
University of Oregon, Eugene Princeton University, Princeton
DEGREES AWARDED:
Doctor of Philosophy, Biology, 2019, University of Oregon Bachelor of Arts, Molecular Biology, 2011, Princeton University
AREAS OF SPECIAL INTEREST:
Neuroscience
PROFESSIONAL EXPERIENCE:
Graduate Teaching Fellow, Department of Biology, University of Oregon, Eugene, 2011- 2019
Undergraduate Researcher, Princeton University Department of Molecular Biology, 2010-2011
PUBLICATIONS:
O’Sullivan C. T., Weible A. P., Wehr M. (2019) Auditory cortex contributes to discrimination of pure tones. In review at eNeuro.
O’Sullivan C. T., Weible A. P., Wehr M. (2019) Auditory cortex contributes to discrimination of phonemes. Pending submission to Frontiers in Neuroscience.
!vi
ACKNOWLEDGMENTS:
First, I would like to thank my PI, Mike Wehr, for all his contributions and
guidance throughout my graduate work. He provided a lab environment where I felt
empowered to come up with my own ideas and experiments, even if they were outside
the traditional topics of the lab. In addition to the general contributions of the members of
the Wehr lab, I would especially acknowledge Aldis Weible for his expertise with surgical
and electrophysiological techniques, Lucas Ott for countless hours running the mice
through behavior, Alexandra Moore for general science ability and a voice that sounds
much less weird than mine when pitch-shifted, and Jonny Saunders for coding and
analysis advice. Also, these experiments would have never been possible without the
contributions of Erik Flister, who provided the behavioral software known as the
“Ratrix”.
My family has provided curiosity and interest in my project, especially when my
own was lacking. Perhaps it was just payback for all the random questions I asked about
economics and the world when I was a kid, but thank you Dad for the (usually) insightful
questions that forced me to think carefully about my own ideas. Thank you Mom for the
support and encouragement that helped me persevere through difficult times.
!vii

TABLE OF CONTENTS
Chapter Page I. INTRODUCTION 1 .........................................................................................................
Using Lesions to Identify Necessity of Activity 1 ...................................................
Benefits of Optogenetic Approach 2 ........................................................................
The Mouse as a Model Organism 3 .........................................................................
Auditory Cortex 4 ....................................................................................................
Prior Studies on Auditory Cortex and Tone Discrimination 5 .................................
Prior Studies on Auditory Cortex and Phoneme Discrimination 5 ..........................
Experimental Design 6 .............................................................................................
II: AUDITORY CORTEX CONTRIBUTES TO PURE TONE DISCRIMINATION 8 .....
Introduction 8 .......................................................................................................... Methods 10 .................................................................................................................
Results 21 ..................................................................................................................
Transient Full Stimulus Suppression Impairs Tone Discrimination 21 .........
Electrolytic Lesions Do Not Affect Tone Discrimination 27 .........................
Cycle Suppression Shows a Sustained Deficit 30 ..........................................
Sustained Optogenetic Suppression Impairs Tone Discrimination 33 ...........
Discussion 36 .............................................................................................................
III: AUDITORY CORTEX CONTRIBUTES TO PHONEME DISCRIMINATION 44 ......
Introduction 44 ...........................................................................................................
!viii

Chapter Page
Methods 47 .................................................................................................................
Results 56 ...................................................................................................................
Full Stimulus Suppression 57 ........................................................................
Multiple Suppression Windows 57 ...............................................................
Laser-related Learning 61 .............................................................................
Discussion 65 .............................................................................................................
IV: CONCLUSION 70 ...........................................................................................................
Tone Discrimination Summary 70 .............................................................................
Phoneme Discrimination Summary 71 ......................................................................
Remaining Questions for Future Research 71 ........................................................... Lesions versus Optogenetic Suppression 72 ..............................................................
Phoneme Suppression Timing 72 ..............................................................................
Pure Tone Suppression Timing 73 .............................................................................
Laser-related Learning 74 .......................................................................................... What Have We Learned? 76 .....................................................................................
REFERENCES CITED 77 .....................................................................................................
!ix

LIST OF FIGURES Figure Page CHAPTER II
1. Transient optogenetic suppression of auditory cortex impaired pure tone discrimination 25 ...........................................................................................................................................
2. Electrolytic lesions of auditory cortex did not impair pure tone discrimination 28 ..........
3. Cycle suppression 34 .........................................................................................................
4. Sustained optogenetic suppression impairs pure tone discrimination 37 ..........................
CHAPTER III
1. Transient optogenetic suppression during the full stimulus duration of auditory cortex impaired phoneme discrimination 58 .....................................................................................
2. Suppression during either early or late timing windows had equivalent effects 61 ..........
3. Mice show sensitivity to task parameters and can exhibit laser-related learning 66 .........
!x

LIST OF TABLES Table Page
1. Training steps - optogenetic suppression 13 ......................................................................
2. Training steps 50 ................................................................................................................
!xi

CHAPTER I: INTRODUCTION
Throughout the history of sensory neuroscience, researchers have constantly
developed new ways of connecting brain activity to perception. Advances in recording
techniques and data processing have generated massive amounts of data, facilitating
detailed analysis of how neurons represent information. Recent developments in calcium
imaging and multisite electrode recordings have continued this trend and enable
recording from many neurons within a population simultaneously (Stosiek et al., 2003;
Sakata et al., 2009), but interpretation of the role of this activity remains a challenge.
Using Lesions to Identify Necessity of Activity
Despite extensive characterization of activity patterns, it has remained difficult to
determine what is actually necessary for accurate perception and decision making. During
any given behavioral task, there is an abundance of activity across the brain that is
possibly related to the task demands, but what areas or neurons are actually used or
interpreted to make decisions? To establish a causal relationship between activity and
behavior, the effects of manipulating or suppressing that activity must be directly tested.
Historically, studies using permanent surgical or electrolytic lesions targeted to specific
brain areas have been used to show whether performance suffers following damage and
interpreted as revealing the necessity of activity in that area (Talwar et al., 2001, Ohl et
al., 1999). While this may be a valid interpretation in some cases, compensatory
mechanisms or plasticity could be obscuring the true role of targeted areas. If a brain area
is normally used for stimulus discrimination but is fully replaced by another pathway or
!1

area following damage, lesion studies would generate results equivalent to a scenario
where the targeted area was never involved. There is typically a recovery period for the
animal following the lesion due to the disturbance caused by surgery or electric shock,
further increasing the opportunity for plasticity before the animal can be tested again to
evaluate its behavior. An alternative suppression method, application of muscimol, has
the benefit of not being permanent, but it is difficult to control the exact spatial area of its
effect as it diffuses through cortex. Additionally, analysis is similarly restricted to
comparison of two epochs: before and after muscimol application (Gimenez et al., 2015).
Benefits of Optogenetic Approach
Recent advances in manipulation of neuronal activity have opened a new avenue
for investigation that has the potential to resolve this ambiguity. Through the combination
of transgenic animals and light-sensitive proteins, optogenetics allows manipulation of
specific neuronal populations on millisecond timescales. Crucially, this process is
reversible, as neurons quickly return to their normal state following the end of laser
stimulation. Rather than being restricted to analysis before and after a lesion, optogenetic
techniques allow suppression trials interleaved with control trials during a behavioral
task. This reduces potential confounding variables by allowing direct comparisons of
performance within the same behavioral session. In addition, the structure of targeted
brain areas remains intact, increasing the validity of comparing control and laser trials
and reducing the potential for activation of plasticity mechanisms. In several examples,
!2

optogenetic suppression experiments have revealed a role for activity that is not indicated
by lesion studies.
In my experiments, I used the specific optogenetic technique of
Channelrhodopsin-2 (ChR2) stimulation of parvalbumin(PV)-expressing neurons in
transgenic mice. PV neurons are distributed throughout cortex and form local inhibitory
connections onto thousands of principal neurons. By activating PV neurons, it is possible
to take advantage of the natural inhibitory circuitry to achieve widespread suppression of
principal neurons. Alternate strategies such as directly using archaerhodopsin (Arch)
expressed in principal neurons for suppression are limited by expression patterns. In that
case, only neurons expressing Arch will be suppressed, while all other principal neurons
will have normal activity. The PV-ChR2 strategy takes advantage of the high penetrance
(~90%) of the PV promoter and the highly connected nature of PV interneurons to
reliably achieve nearly total suppression of targeted areas (Moore and Wehr, 2013). Since
this technique uses transgenic mice, all PV-expressing cells will have ChR2, so control of
spatial extent of suppression in the brain is determined by laser fiber location and power.
Prior work in my lab (Weible et al., 2014) has established the spatial extent of potential
laser powers, which guided my experimental design.
The Mouse as a Model Organism
As a model organism, mice provide a variety of advantages for examining the link
between behavior and neuronal activity. There are bountiful genetic tools available,
allowing the use of transgenic mice and removing the need for viral injections of
!3

optogenetic proteins. This leads to more consistent levels of suppression across individual
animals by removing the potential randomness and variability involved in the injection
and infection process. In addition, mice can be bred quickly to generate large pools of
subjects for behavioral experiments. They can be trained via restricted water, only
receiving it while performing the discrimination task. Training can be largely automated
with behavioral software, only requiring an experimenter to place the mouse in the
behavior box, open its file, and then take the mouse out once the session is complete
(Saunders and Wehr, 2019). With proper management of water restriction, mice can run
hundreds of trials each day, supporting rapid collection of data.
Auditory Cortex
To learn more about the general link between activity and behavior, I focused on
the specific example of auditory cortex and sound discrimination. Mouse auditory cortex
is tonotopically arranged in a similar manner to humans and other mammals, allowing
some generalization of results. Mice can be trained to discriminate both simple and
complex (Saunders and Wehr, 2019) sound stimuli. Simpler sounds have the advantage of
being easier for mice to learn to discriminate, reducing the time required before
optogenetic testing, but have less relation to the complexities involved in human sound
perception. Speech perception is of particular interest because it is often impaired as
humans age and this deficit can be very detrimental to quality of life (Helfer and
Freyman, 2008). Determining the role of auditory cortex in speech discrimination could
!4
help guide further investigation into potential therapies or treatments for age-related
deficits in humans.
Prior Studies on Auditory Cortex and Tone Discrimination
Prior lesion studies examining pure tone discrimination have not found significant
deficits in performance following destruction of auditory cortex (Ohl et al., 1999, Talwar
et al., 2001). Muscimol studies have provided conflicting results, with some evidence for
impairment and no effect in other cases (Gimenez et al., 2015; Talwar et al., 2001). The
lack of clarity from these results provides an opportunity for insights from optogenetic
suppression.
Prior Studies on Auditory Cortex and Phoneme Discrimination
Since phonemes are spectrotemporally complex sound stimuli thought to be
processed in auditory cortex, prior work has examined neuronal responses and the effects
of lesions. Through the use of a variety of phoneme stimuli, discriminability of auditory
cortex neuronal responses, measured by classifier accuracy on pairs of phonemes, has
been shown to be correlated with behavioral discrimination accuracy of those pairs
(Engineer et al., 2008; Centanni et al., 2013). Using only the first 40ms of responses is
sufficient to establish this correlation, but the effect disappears if spike timing
information is scrambled, providing further support for the role of auditory cortex in
phoneme discrimination. Lesions of rat auditory cortex impair discrimination ability on
!5

phoneme stimuli (Porter et al., 2011), but the effects of optogenetic suppression have not
been investigated.
Experimental Design
To investigate the necessity of auditory cortex in tone discrimination, I compared
the effects on behavioral performance of optogenetic suppression using the PV-ChR2
strategy and electrolytic lesions. These experiments are described in chapter II and
correspond to the first paper submitted for publication, which is co-authored by Aldis
Weible and Mike Wehr. Optogenetic suppression impaired behavior while lesions did not,
so after initially testing optogenetic suppression exclusively during stimulus presentation,
I modified the parameters in order to make the manipulation more analogous to the
timing and structure of the lesion procedure. Even in the most similar conditions possible,
optogenetic suppression still generated a deficit in performance. This supported the idea
that there is a fundamental difference between the brain’s response to lesions and
optogenetic suppression.
I tested the link between phoneme discrimination ability and auditory cortex
activity by using the same PV-ChR2 suppression strategy while mice discriminated
between the words “sad” and “dad”. These experiments are described in chapter III and
correspond to the second paper in the submission process for publication, which is co-
authored by Aldis Weible and Mike Wehr. Mice showed a behavioral deficit during laser
suppression, with further testing of suppression isolated to the “consonant” or “vowel”
segments of the stimuli showing equivalent effects. I also manipulated task reward
!6

structure and laser visibility to observe laser-relating learning, showing that mice can
adapt their behavior to some changes in task parameters.
!7

CHAPTER II: AUDITORY CORTEX CONTRIBUTES TO DISCRIMINATION OF PURE TONES
JOURNAL STYLE INFORMATION: submitted to eNeuro AUTHOR CONTRIBUTION: Conor T. O’Sullivan, Aldis Weible, Mike Wehr
This chapter is a manuscript that has been submitted to eNeuro. In this paper, I
was the primary person responsible for experimental design, data collection/analysis, and
the bulk of writing. I received assistance from the second author (Aldis Weible), who
carried out and analyzed electrophysiology experiments as well as assisting with surgical
procedures. Mike Wehr, the final author, is my lab’s PI and assisted throughout the
experiment and writing process.
Introduction
Neurons in auditory cortex are well-tuned for frequency, and are organized into
multiple tonotopic maps across the cortical surface. Is auditory cortex involved in the
perception and discrimination of sound frequencies? For pure tones, across a wide range
of species and behavioral paradigms, the consensus view has been that the answer
appears to be no. Although there are conflicting results, lesion studies have generally
shown that frequency discrimination of pure tones is not affected by ablation of auditory
cortex, even after extensive lesions of all known auditory cortical fields (Meyer and
Woolsey, 1952; Butler et al., 1957; Thompson, 1960; Goldberg and Neff, 1961; Sellick,
1983; Buser and Imbert, 1992; Ohl et al., 1999; Talwar et al., 2001; Rybalko et al., 2006;
Porter et al., 2011; Gimenez et al., 2015). Discrimination of more spectrotemporally
complex sounds such as frequency-modulated tones is impaired by lesions of auditory
!8

cortex, suggesting that auditory cortex is recruited when task demands require spectral or
temporal integration (Ohl et al., 1999). The effects of transient inactivation on pure tone
discrimination (for example, with local muscimol application) have been inconsistent,
with some studies reporting no effect while others reporting complete impairment
(Talwar et al., 2001; Gimenez et al., 2015). The fact that some transient inactivation
studies observed complete impairment suggests that auditory cortex could potentially be
involved in frequency discrimination, and that the effects of lesions could differ from
those of transient inactivation because of cortical reorganization or some other long-term
recovery or compensatory processes. Lesion studies typically include at least several days
of recovery after surgery, which could allow time for cortical or subcortical plasticity to
eventually allow alternative structures or pathways to mediate frequency discrimination.
More recently, optogenetic suppression experiments in other neural systems have
shown that acute suppression can reveal involvement of a brain structure in specific tasks
even when lesions of the same structure have no effect (e.g. Goshen et al., 2011; Kumar
et al., 2013; Otchy et al., 2015; Hong et al., 2018). For example, remote contextual fear
memories are unaffected by hippocampal lesions, but can be abolished by transient
optogenetic hippocampal suppression (Goshen et al., 2011). This suggests that a brain
structure could be critically involved in specific functions when it is intact and "online,"
despite the existence of alternative pathways that are adequate for that function.
Optogenetic studies such as these are thus providing new insights into redundancy and
interactive processing in the brain, aspects which can be both evolutionarily adaptive and
experimentally vexing. Such findings also prompt a re-evaluation of conclusions that
!9

structures (such as auditory cortex) are not involved in a task (such as frequency
discrimination) based on lesions that produced no deficit in task performance.
Here we compared the effects of lesions and optogenetic suppression of auditory
cortex on frequency discrimination in mice. For suppression, we used mice that expressed
Channelrhodopsin2 in parvalbumin-expressing interneurons (PV-ChR2), and trained
them in an operant task to discriminate the frequency of brief pure tones for a water
reward. We found that transient bilateral optogenetic suppression partially but
significantly impaired discrimination performance. In contrast, bilateral electrolytic
lesions of auditory cortex had no effect on performance of the identical task, even when
tested only 4 hours after lesion. This suggests that when auditory cortex is destroyed, an
alternative pathway is adequate for mediating frequency discrimination. Yet this
alternative pathway is insufficient for task performance when auditory cortex is intact but
has its activity suppressed. These results indicate a fundamental difference between the
effects of brain lesions and optogenetic suppression, and suggest the existence of a rapid
compensatory process possibly induced by injury.
Methods
Mice
For optogenetic suppression of auditory cortex, we used mice that were offspring
from a cross of homozygous Pvalb-IRES-Cre (“PV”, 008069; The Jackson Laboratory)
and homozygous CAG-ChR2-eYFP (“ChR2”, 012569; The Jackson Laboratory) lines,
which are on a C57Bl6/J background (n = 19 mice in total). In these mice (“PV-ChR2”),
!10

ChR2 was expressed in parvalbumin-expressing (PV+) interneurons, with 97%
specificity in auditory cortex (Moore and Wehr, 2013). We used C57Bl6/J mice that did
not express ChR2 as controls (n = 5 mice; 3 were -/ChR2, 1 was -/-, 1 was GPR26-cre/-).
For electrolytic lesion experiments, we used wild-type C57Bl6/J mice (n = 5 mice).
Surgical procedures
We administered dexamethasone (0.1 mg/kg) and atropine (0.03 mg/kg) pre-
surgically to reduce inflammation and respiratory irregularities. Surgical anesthesia was
maintained with isoflurane (1.25-2.0%). For optogenetic manipulation, we implanted 200
µm optic fibers in each hemisphere at AP ~2.3 mm (relative to bregma), ML 4.4 mm, and
depth 0.5 mm below the dura (just dorsal to primary auditory cortex). The implants were
painted with black acrylic paint to minimize light leakage. For electrophysiological
verification of optogenetic suppression, we implanted 2 mice (not used in behavioral
experiments) with a unilateral optrode array, consisting of 8 tetrodes and a 200 µm fiber
terminating 1 mm above the recording sites. The 8 tetrodes passed through two 28-gauge
stainless steel hypodermic tubes, with 4 tetrodes per tube. The optic fiber was fixed in
position immediately adjacent to, and between, these tubes. Tetrodes were made of 18 µm
(25 µm coated) tungsten wire (California Fine Wire). The entire array was mounted on a
custom microdrive. The optrode array was inserted vertically through a small craniotomy
(2 mm x 1 mm) dorsal to auditory cortex, and cemented into place. For electrolytic
lesions, we implanted a pair of stainless steel wires (112 µm diameter, 150 µm coated)
spaced ~750 µm apart into auditory cortex in each hemisphere. The teflon coating was
!11

stripped 500 µm from the tips. Pairs were implanted at ML 4.2 mm, DV: 1.0 mm,
centered on AP: -2.9 mm. We administered ketoprofen (4.0 mg/kg) post-operatively to
minimize discomfort. Mice were housed individually following the surgery and were
allowed 7 days of post-operative recovery.
Histology
Brains of mice used for electrophysiological validation were sectioned (100 µm)
in the coronal plane to verify the position of single neuron recording sites. Only data
corresponding to tracks located within auditory cortex were included.
Behavioral Setup
Mice performed the task in sound-attenuating behavioral chambers. Within the
chamber, mice were placed in a plastic arena, one wall of which contained 3 combination
ports for lick-sensing and water delivery. Each port had an IR beam-break sensor, at
which mice responded by licking, and a tube to deliver water rewards for correct
responses. Sound stimuli were controlled by a computer running custom behavioral
software (modified from Meier et al., 2011), and delivered through 2 speakers placed
outside the arena facing the ports. Since laser illumination was delivered with blue light
that could potentially be visible to the mouse, we used a color-matched blue strobe light
(full-field illumination at approximately 10 Hz) to mask laser stimulation. Mice were
trained for an hour each day for 5-7 days a week, corresponding to 300-500 trials and 1-2
g of water reward per day.
!12

Table 1: Training steps - Optogenetic Suppression
Prior to any behavioral training, the mice underwent surgical implantation of
optical fibers or lesion electrodes (step 1, see Table 1). Mice started training with a simple
lick-for-water task to familiarize them with the operation of the ports in the absence of
sound stimuli (step 2, “Free drinks”). Next, they advanced to the first stage of the main
task (step 3). In the main task, mice requested trials by licking the center port, which
triggered stimulus delivery. Mice responded by licking at the left port (for 4 kHz, 500 ms
pure tones) or the right port (for 13 kHz, 500 ms pure tones). Correct responses triggered
an 80 µl water reward followed by a 1 second delay before the next trial could be
Training Step Description Advancement criterion
1. Surgery Fiber implantation 1 day of water restriction post-recovery
2. Free drinks Ports give water, no stimulus
Trial rate (cannot trigger the same port repeatedly)
3. Requests rewarded Rewards given for center-port trial requests and for correct responses
Trial rate (7 trials in 30 s)
4. Only correct responses rewarded
Rewards only given for correct responses
400 trials completed
5. Longer penalty Increased timeout for incorrect responses, no correction trials
Sustained performance > ~85%
6. Optogenetic suppression
Laser on for 10% of trials
N/A
!13

requested. Incorrect responses gave no water and produced an additional 1 second
penalty timeout before the next trial. To increase the number of trials performed, some
mice had their water rewards reduced to 40 or 60 µl. During an initial shaping stage of
the main task (step 3), mice received water rewards at the center port for requesting trials
(as well as for correct answers at the side ports) until reaching a rate of 7 completed trials
in 30 seconds. Once the mice achieved this rate of trials, the rewards for requesting at the
center port were removed (step 4). In steps 3 and 4, we included “correction trials” to
reduce the development of response bias to one side or the other. After an incorrect
response, there was a 50% chance that a mouse would go into a correction trial sequence,
in which the same stimulus was repeated until the mouse responded correctly. Correction
trials provide contextual information that could conceivably allow a task strategy that did
not depend solely on stimulus discrimination, so we disabled correction trials during the
final training stage. After 400 trials at step 4, the penalty timeout for incorrect responses
was increased to 3 s and correction trials were turned off (step 5). When mice were
performing at 85% or higher on step 5 for approximately 5 days, they were run for at
least 2 days with fibers attached to the ferrules on their head but without light delivery, to
allow the mice to become accustomed to the tethers. Then mice advanced to the final
stage (step 6) for optogenetic suppression experiments, using one or more of the
illumination protocols described below.
Stimuli were 500 ms pure tones at two frequencies, 4 kHz and 13 kHz. Sound
levels were not identical for all behavior boxes (range: 73 - 82 dB SPL, mean: 77 dB,
S.D. 3 dB) but within a given box the sound levels were similar for the two frequencies
!14

(mean difference: 0.3 dB) and were consistent from day to day. Reaction times were
measured from tone onset to response port entry, with video frame resolution (16.6ms).
Optogenetic Suppression
In order to suppress auditory cortex, 445 nm wavelength (blue) diode laser pulses
were delivered to the implanted bilateral optical fibers, with an output power of 9.5 mW
as measured at the fiber tip (corresponding to an irradiance of 300 mW/mm2). In a
previous study using identical fiber implantation and lasers, we electrophysiologically
characterized the spatial extent of cortical suppression, which was 1750 µm at this power
level (Weible et al., 2014). This extent includes all tonotopic fields of auditory cortex,
throughout the cortical depth, but does not include thalamic, collicular, or other
subcortical regions. In a subset of mice we also tested a power level of 6.3 mW (200 mW/
mm2), which has a spatial extent of 1500 µm. We used three different temporal patterns
of light delivery, which we refer to as transient suppression, cycle suppression, and
sustained suppression.
Transient Suppression
On 10% of the trials, the laser was turned on for the full 500 ms duration of the
stimulus (Fig. 1a). Whether the laser would be turned on was decided randomly for each
trial with a 10% probability. Laser trials were randomly rewarded in order to avoid the
potential learning of new stimulus-reward associations. To control for the possibility of
non-optogenetic effects of laser illumination on behavior, we also used identical fiber
!15
implantation and illumination with wild-type mice (n = 5 mice). Although we minimized
light leakage with tight fiber connections and black paint on implants, it is conceivable
that stray light from laser illumination could be distracting to the mouse, which could be
a confounding effect with the intended suppression of auditory cortex. Using non-ChR2-
expressing control mice isolates the effect of this potential distractor.
Cycle Suppression
To investigate the effects of prolonged suppression of auditory cortex, we used a
cyclic pattern of laser activation, alternating between sets of 20 normal and 20 suppressed
trials. For this cyclic laser suppression, we used 100 Hz pulsed illumination trains (5 ms
on, 5 ms off) instead of stimulus-locked 500 ms laser pulses (Fig. 3a). Output power
during each 5 ms pulse was 9.5 mW. For each cycle, illumination started with stimulus
request on trial 1, and ended with response selection on trial 20. Because illumination
was sustained for a fixed number of trials, the actual duration of illumination depended
on trial rate. In this “Cycle suppression” condition, all trials were rewarded normally
(according to the tone frequency), since laser trials made up 50% of the total and we were
concerned that this proportion of random rewards might disrupt overall performance.
Sustained Suppression
Sustained optogenetic suppression experiments were designed to mimic the
effects of electrolytic lesions. Mice were tested for a half-hour session to provide a same-
day baseline measure of performance, then received 4 hours of sustained optogenetic
!16

suppression in a holding cage within the sound-attenuating behavioral chamber, using
continuously pulsed 100 Hz laser illumination (5 ms on, 5 ms off, as in cycle
suppression). Then, with the continuously pulsed 100 Hz laser illumination still on, mice
ran for a second half-hour session. Mice remained connected to optic fibers during the
entire period of sustained suppression (i.e. they were not disconnected during transfer to
or from the holding cage).
Single Neuron Recording and Analysis
Tetrode data were acquired with 32-channel RHD2000 hardware (Intan
Technologies) and Open Ephys software (Siegle et al., 2017). A minimum threshold of 60
µV was set for collection of spiking activity. Activity of individual neurons was isolated
offline using MClust (Redish, 2008). Measures of peak and trough waveform voltage,
energy, and principal components analysis were used as waveform separation parameters
in 2-dimensional cluster space. Cells were accepted for analysis only if they had a cluster
boundary completely separate from adjacent cluster boundaries, and completely above
threshold, on at least one 2-D view. Cluster boundaries were then applied across sessions
to track single cell responses across different stimulus contingencies.
We recorded neuronal responses to pure tones (500 ms duration, 500 ms inter-trial
interval, 50 repetitions) with or without transient optogenetic suppression on interleaved
trials, as well as spontaneous activity in silence before, during and after sustained
optogenetic suppression (100 Hz, 100 second duration, 100 second inter-trial interval, 10
repetitions). Laser power was 6.3 mW, corresponding to an irradiance of 200 mW/mm2 as
!17

measured at the tip of the 200 µm diameter fiber. All data were collected as mice freely
explored a cylindrical plastic container (height 16 cm, diameter 16 cm) inside a double-
walled sound-attenuating chamber. Sounds were delivered from a free-field speaker
directly above the cylinder. The speaker was calibrated to within ±1 dB using a Brüel and
Kjær 4939 1/4-inch microphone positioned within the cylinder approximately at head
height. Following each recording session, the tetrode array was lowered ~80 µm and
allowed to settle for a minimum of 3 hours before initiating another session to ensure that
responses collected during each session reflected the activity of a unique population of
cells. Optimal pure tone frequencies were selected by first assessing frequency tuning of
individual neurons (4-64 kHz presented at 20, 40, 60, and 80 dB SPL). Significantly tone-
responsive cells were identified by comparing the firing rate during the first 75 ms
following tone onset to an equivalent period during silence (using the paired t-test). We
determined best stimulus (frequency and intensity) from the highest firing rate response
across all frequencies and intensities. Because multiple neurons were recorded
simultaneously (with 8 tetrodes), we selected best stimuli for several representative
neurons and then presented those stimuli with and without illumination to test the effects
of optogenetic suppression. After off-line spike sorting, for each cell we chose the single
best frequency of those presented and tested the effects of optogenetic suppression by
comparing laser-off tone responses to interleaved laser-on responses (paired t-test, entire
500 ms tone duration). Recordings from putative PV cells, as identified by significant
firing rate increases during laser pulses in silence compared with an equivalent period of
silence with laser off (paired t-test), were excluded from group analyses. To assess the
!18

effects of sustained optogenetic suppression, we compared the mean firing rate during the
100 second pulse train to that for the 10 seconds preceding and 10 seconds following the
pulse train (ANOVA). We also compared the first and last 10 seconds of the 100 second
pulse train to determine whether suppression was stable over time (paired t-test).
Electrolytic Lesions
To produce bilateral lesions of auditory cortex similar to those achieved with
surgical ablations in previous studies, we passed current through implanted electrodes.
For these experiments, mice were first implanted with electrodes as described above.
Then, after at least 7 days of recovery, mice were trained on the task with steps 1-5 as
described above (see Table 1). Mice continued running in Step 5 after performance
reached asymptotic maximum, in order to provide several days of pre-lesion baseline
data. On the day of the lesion, mice performed a half session (30 min) in the morning to
establish same-day baseline, and were lesioned immediately after this session ended.
Lesions used 45 s of radio frequency current (~5 W) passed through the bipolar
electrodes in each hemisphere. Mice then ran another half session in the afternoon after a
median 4 hours of recovery. This approach minimizes the time following the lesion
(compared to the days-to-weeks recovery required after surgical ablation), providing the
soonest possible testing of post-lesion performance. Mice were anesthetized with 1.5%
isoflurane for ~2 minutes during electrolytic lesioning. We noted that mice were
disoriented for 1-2 hours after lesioning, so we waited until they were alert and
responsive before post-lesion testing (median 4 hours). Following post-lesion behavioral
!19

data collection, we sectioned the lesioned brains and examined them to determine lesion
extent. Using coronal mouse atlas sections (Paxinos and Franklin, 2019), we identified
auditory cortex via landmarks such as the hippocampus and rhinal fissure and visually
inspected sections spanning auditory cortex. We quantified lesion extent as the damaged
fraction of total auditory cortex area across sections.
Statistical Analysis
We calculated performance separately for responses on laser and control trials.
For individual mice, we measured accuracy (in percent correct) using Fisher’s exact test
on the contingency tables created by the two stimuli and two possible responses. We
limited analysis to the first 10,000 total trials after the start of laser stimulation, to avoid
any long-term learning effects. To examine performance as a function of time, we
measured performance using a 100-trial sliding window. We tested for group effects
using a one-tailed Wilcoxon signed-rank test on the control and laser performance data.
We compared performance of electrolytic lesion mice before and after the lesion using
the one-tailed Wilcoxon signed-rank test, comparing the performance on the final 700
pre-lesion trials to the first 700 post-lesion trials (which could span sessions). For both of
these tests, the group data could be approximated as a normal distribution based on the
Lilliefors’ goodness-of-fit test, so we estimated effect size using Cohen’s d, ! , where z
is the z-score and n is the number of mice. To determine the rightward or leftward
response bias of each mouse, we calculated the difference between the proportion of
rightward responses and rightward stimuli, in sliding 100-trial windows. A difference of
d = zn
!20

zero indicates no bias, as the choices of the mouse are proportionate to the stimuli
presented. Positive values indicate that the mouse is biased to the right, and negative
values indicate a bias toward the left. For display, we added 50% to the bias values, such
that 50% indicates no bias, values <50% indicate leftward bias, and values >50% indicate
rightward bias.
For receiver-operating-characteristic (ROC) analysis, we evaluated performance
separately for each stimulus value and then compared between laser and control trials. To
reveal stimulus-related effects, we separated each mouse’s performance into “13 kHz hit
rate” (percent correct on 13 kHz trials) and “13 kHz false alarm rate” (100 - percent
correct on 4 kHz trials). This arbitrary assignment to hits and false alarms allows ROC
analysis of the effects of laser on both performance and bias. We plotted hits against false
alarms, separately for laser and control conditions for each mouse. The distance between
these points indicates the magnitude of the laser effect on performance, and the direction
between them indicates the degree of induced bias.
Results
Transient Full Stimulus Suppression Impairs Tone Discrimination
We first tested whether transient optogenetic suppression of auditory cortex
during tone presentation would impair tone discrimination. We implanted PV-ChR2 mice
with optical fibers bilaterally over auditory cortex, and trained them to discriminate
between two tones well-separated in frequency (4 kHz and 13 kHz, 500 ms, ~77 dB) to
set up for optogenetic suppression during tone presentation (Fig. 1a).To verify that our
!21
optogenetic method effectively suppressed cortical activity, we recorded from auditory
cortical neurons in separate mice (not used for behavior) using a tetrode array, attached to
an optical fiber implanted in the same location as in the mice used for behavior. We
recorded from 90 neurons, 46 of which responded significantly to 500 ms pure tones. We
excluded PV cells, which were unambiguously identified by robust responses to
illumination (Moore and Wehr, 2013). Figure 1b shows the effect of transient optogenetic
suppression (at 200 mW/mm2) on the response to best-frequency tones and on
spontaneous activity. Suppression was nearly complete. Across the population,
suppression reduced the mean firing rate during the tone from 10.4 ± 7.2 to 1.5 ± 3.9 Hz
(mean ± s.d., t = 9.7, p < 0.0001, n = 46 tone-responsive neurons), and reduced
spontaneous activity from 2.3 ± 2.4 to 0.3 ± 1.5 (t = 9.2, p < 0.0001, n = 90 neurons).
Tone responses were significantly suppressed by illumination in 44/46 (96%) of tone-
responsive neurons, and spontaneous activity was significantly suppressed in 52/90
(58%) of all recorded neurons. Note that off-responses (i.e., responses evoked by tone
offset) were unaffected by suppression, because illumination ended at tone offset.
Mice achieved a high level of performance (>85%) within 2,000-4,000 trials (Fig.
1c), after which we illuminated auditory cortex just during the 500 ms tone presentation
on 10% of trials (Fig. 1a, 9.5 mW or 300 mW/mm2). Illumination trials were randomly
rewarded to minimize the possibility that mice could learn new stimulus-response
associations. Optogenetic suppression significantly, but incompletely, impaired task
performance. Figure 1d shows an example of performance for an individual mouse over
the first 10,000 trials after the onset of suppression trials. For this mouse, performance on
!22

laser trials was impaired by 10-15% compared to control trials. This was true for all mice,
with performance of 90 ± 4.6% on controls trials compared to 75 ± 7.5% on laser trials
(Fig. 1e, p = 0.0019, one-tailed Wilcoxon signed-rank, effect size d = 0.63, n = 9 mice).
All mice showed significant effects (Fisher’s exact test, p < 0.05), with individual effects
on performance ranging from 10-25% (Fig. 1e). These results show that when auditory
cortex is intact and operational, mice rely at least in part on it to perform tone
discrimination.
The mouse shown in Figure 1d did not show a strong bias on laser trials, that is, it
showed roughly equal numbers of both leftward and rightward responses (grey line in
Fig. 1d). However, some mice did develop a bias on laser trials, which could reflect a
default strategy when a mouse is uncertain of the correct response. To examine the joint
effects of suppression on both accuracy and bias, we turned to ROC analysis. In Figure
1f, the performance of each mouse on control trials is represented by an open symbol,
and on laser trials by a cyan symbol. Performance on control trials is clustered at the
upper left corner, indicating high accuracy and low bias. On laser trials, performance for
all mice shifted towards the dashed line (chance performance). Bias is indicated by a
deviation in the direction parallel to the dashed line (i.e., towards the lower-left or upper-
right corners). A shift perpendicular to the dashed line (i.e., towards the lower-right
corner) indicates an effect on accuracy with an absence of bias. While all mice showed
significant effects on accuracy, most showed little bias, and two mice showed stronger
bias (one in each direction).
!23

We used two approaches to minimize the possibility that laser illumination could
act as a visual cue that could affect behavior. First, we used black paint to minimize stray
light from the optical fibers. Second, we used a color-matched continuous full-field
strobe to mask any possible visual stimulation from the lasers (for example, due to
intracranial retinal stimulation). To further control for the possibility that laser
illumination could act as a visual cue that could affect behavior, we repeated the
experiment with non-ChR2-expressing mice. We first used a “normal reward” condition,
in which laser trials were rewarded normally according to the appropriate response and
the only distinguishing feature of laser trials was illumination. Illumination had no effect
on task performance (Fig. 1g, p = 0.094, one-tailed Wilcoxon signed-rank, n = 5 mice),
with individual effects on performance ranging from a 3.1% decrease to a 0.9% increase.
We then used random rewards on laser trials, to exactly replicate the conditions used with
ChR2-expressing mice. Illumination again had no effect on performance (Fig. 1h, p =
0.063, one-tailed Wilcoxon signed-rank, n = 5 mice), with individual effects on
performance ranging from a 3.5% decrease to a 0.2% increase. From this we conclude
that laser illumination of the brain had no effect on task performance in mice not
expressing ChR2, and thus that the effects we observed in ChR2-expressing mice were
specifically due to optogenetic suppression of auditory cortex.
To address potential concerns that laser suppression could reach beyond auditory
cortex, we tested a separate cohort of 6 mice on the original 300 mW/mm2 laser power as
well as several additional sessions (1200-3200 trials) at 200 mW/mm2 (6.3 mW total
power), which has a reduced spatial extent (Weible et al., 2014). This laser power also
!24
produced a performance deficit (p = 0.018, one-tailed Wilcoxon signed-rank, n = 6 mice,
effect size d = 0.86). The deficits on suppression trials were not significantly different
between the two laser powers (p = 0.22, one-tailed Wilcoxon signed-rank, n = 6 mice),
suggesting that deficits can be attributed to effects on auditory cortex.
Figure 1 (next page). Transient optogenetic suppression of auditory cortex impaired pure tone discrimination. a. Transient laser suppression used a 500 ms constant laser pulse at 300 mW/mm2 (9.5 mW total power) that completely overlapped with the 500 ms pure tone stimulus. Laser was delivered on a random 10% subset of trials. b. Electrophysiological validation of optogenetic suppression in separate mice. Left: responses to best-frequency tones averaged across 46 tone-responsive neurons and 50 repetitions under control conditions (black) and during a 500 ms constant laser pulse at 200 mW/mm2 (cyan). Right: effect of illumination on spontaneous activity during silence, averaged across 90 neurons and 50 repetitions. Both tone responses and spontaneous activity were significantly suppressed. c. Progression through training steps is shown for 5 example mice, aligned to the start of training. Performance was computed in a 200 trial sliding window. d. The first 10,000 total trials in the suppression condition (step 6) for an example mouse (mouse rt.15) show a consistent effect of the laser, with minimal effects on bias. A 200 trial sliding window was used to separately compute accuracy over time on control trials (black) and laser trials (cyan). Since this would require ~2000 total trials before having a sufficient sample to measure laser performance, we used a smaller window of 50 trials to measure performance for the initial 100 laser trials, and a 200 trial window for subsequent laser trials. We also measured the bias on laser trials (gray), with 50% corresponding to equal left and right responses. e. Performance in overall percent correct for each mouse for 10,000 total trials is shown by connected dots for control and laser trials. Bars represent mean performance for each trial type across all 9 mice. f. To show stimulus-related effects, we used ROC analysis to separate each mouse’s performance into “hit rate” (percent correct on 13 kHz trials) and “false alarm rate” (100 - percent correct on 4 kHz trials). The dashed line represents chance performance (50% correct), ranging from 100% leftward (4 kHz) responses at the lower left corner to 100% rightward (13 kHz) responses at the upper right corner. Performance for each mouse on
!25
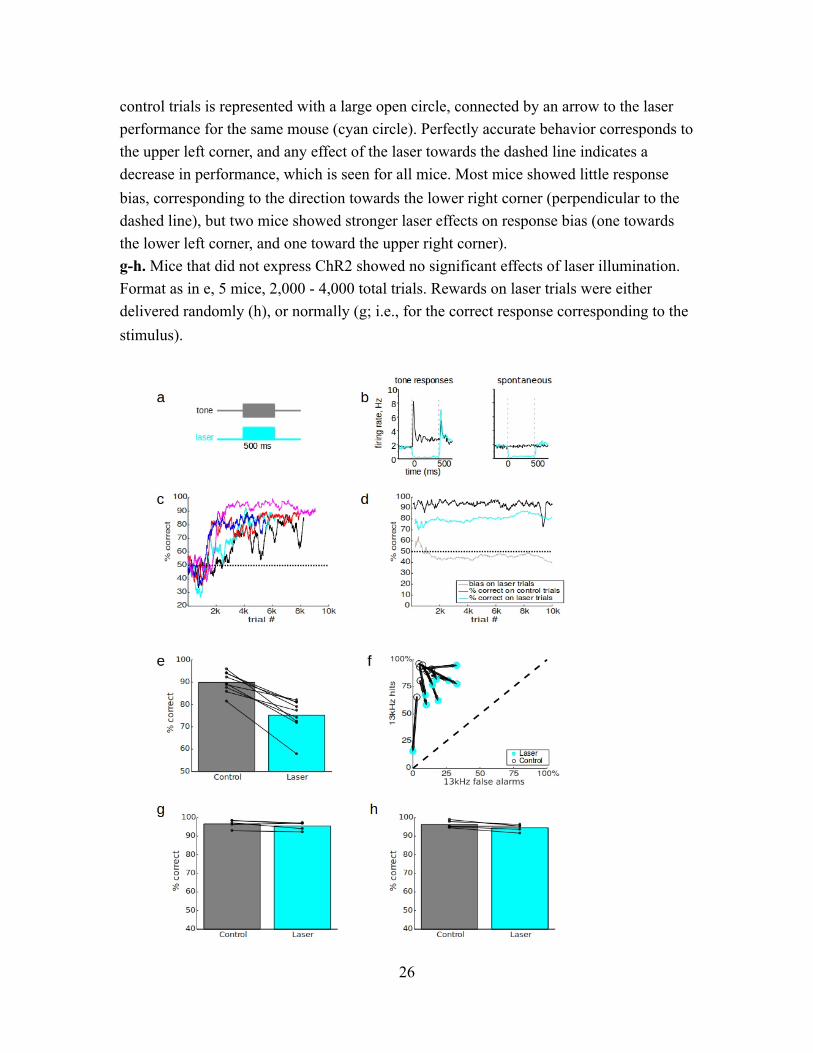
control trials is represented with a large open circle, connected by an arrow to the laser performance for the same mouse (cyan circle). Perfectly accurate behavior corresponds to the upper left corner, and any effect of the laser towards the dashed line indicates a decrease in performance, which is seen for all mice. Most mice showed little response bias, corresponding to the direction towards the lower right corner (perpendicular to the dashed line), but two mice showed stronger laser effects on response bias (one towards the lower left corner, and one toward the upper right corner). g-h. Mice that did not express ChR2 showed no significant effects of laser illumination. Format as in e, 5 mice, 2,000 - 4,000 total trials. Rewards on laser trials were either delivered randomly (h), or normally (g; i.e., for the correct response corresponding to the stimulus).
!26

Electrolytic Lesions Do Not Affect Tone Discrimination
The fact that transient optogenetic suppression of auditory cortex impaired tone
discrimination performance is surprising, because permanent lesions of auditory cortex
have no effect on pure tone discrimination (Butler et al., 1957; Goldberg and Neff, 1961;
Ohl et al., 1999). Typical lesion studies require a recovery period of days or longer after
surgery, and we wondered whether long-term plasticity or reorganization during this
recovery period could contribute to the marked difference between the effects of lesions
and transient optogenetic suppression. To address this, we implanted electrodes for
producing electrolytic lesions of auditory cortex, and trained mice on tone discrimination
after recovery. This allowed us to lesion auditory cortex bilaterally and then test the
effects on tone discrimination within a few hours. Lesions were extensive, averaging 56.8
± 9.3% of AC and 69.3 ± 10.0% of A1 (Fig. 2a). After mice reached stable asymptotic
pre-lesion performance, we ran them for a half hour session in the morning, delivered
electrolytic lesions, and ran them again the same day after recovery (median recovery
time 4 hours). Mice continued to run the task on subsequent days. Lesions had no effect
on tone discrimination performance, either in individual mice or at the group level (Fig.
2b-d). Mean pre-lesion performance was 96.3 ± 1.5% and post-lesion performance was
95.7 ± 1.5% (Fig 2d, p = 0.45, one-tailed Wilcoxon signed-rank, effect size d = 0.06, n =
5 mice). Since there was variation in lesion extent, we tested whether this was correlated
with behavioral effects (Fig. 2e) and found that it was not (Spearman’s correlation, r =
0.6, p = 0.35). ROC analysis showed no effect of lesions on accuracy or bias (Fig. 2f).
These results show that when auditory cortex has been extensively damaged, within 4
!27

hours mice are able to use alternative circuits to perform tone discrimination with no
measurable deficit.
In some tasks, overtraining has been shown to shift task dependence from cortex
to striatum as performance becomes habitual (Smith and Graybiel, 2013). We therefore
wondered whether different amounts of training time could have contributed to the
differences we observed between the effects of optogenetic suppression and lesions.
However, there was no difference between groups in the number of training trials prior to
the manipulation, either for all training (steps 1-5, p = 0.89, rank-sum) or for the final
stage of training (step 5, p = 0.61). Thus groups had no systematic differences in
overtraining that could explain the different effects of optogenetic suppression and
lesions.
Figure 2 (next page). Electrolytic lesions of auditory cortex did not impair pure tone discrimination. a. The section of maximal lesion extent for each mouse (n = 5) is shown in cyan/blue, overlaid onto the boundaries of auditory cortex (red). b. Performance before and after lesion for an example mouse (mouse 6685). Vertical black dashed line indicates graduation to the final training step (6). In the 700 pre-lesion trials, overall performance was 94.25% correct. The lesion is indicated by the red dashed line at trial zero. In the 700 trials following the lesion, the mouse performed at 95.1%, showing a lack of impairment. Performance is computed in a 100 trial sliding window. Chance performance is 50%. c. Performance for each of 5 mice is shown in different colors. Format as in b. Traces are aligned to the time of the lesion, indicated by the red dashed line. Note that a median of 4 hours elapsed at the time of lesion (red dashed line). Heavy black line shows mean across mice for 700 trials before and after lesion. d. Mean performance across all mice on the 700 trials pre-lesion and 700 trials post-lesion are represented as bars, with the performance of individual mice indicated by connected dots.
!28

e. Lesion extent for individual mice is plotted against their pre-lesion performance (black) and post-lesion performance (red). f. ROC analysis (same format as Figure 1f). Open circles indicate pre-lesion performance for each mouse, which are connected to red circles indicating post-lesion performance. Lesions had negligible effects on accuracy or response bias.
!
!29

Cycle Suppression Shows a Sustained Deficit
One interpretation of the lesion and transient suppression experiments described
above is that together they provide an upper and lower bound on the time scale required
for mice to recover the ability to discriminate tones when auditory cortex becomes
unavailable. That is, transient (500 ms) unavailability of auditory cortex produces a
deficit, but within about 4 hours some recovery process allows accurate performance
even without auditory cortex. The time course for this recovery process must then lie
between 500 ms and ~4 hours. To better understand this putative recovery process, we set
out to characterize its time course. Because any given trial response is either correct or
incorrect, estimating performance accuracy requires integration across trials. For
example, at least 100 trials are required to estimate performance (in percent correct) with
a precision of 1%. Because our mice perform about 5 trials/minute, 100 trials takes 20
minutes on average. This means that the temporal precision achieved by integrating
consecutive trials is insufficient to resolve the fine time scale of the recovery process. We
therefore designed a cyclical suppression paradigm so that we could average performance
over large numbers of trials with high temporal precision (Fig. 3a). To verify that cycle
suppression effectively suppressed cortical activity, we tested this method on a population
of 153 auditory cortical neurons recorded with tetrodes (including the cells shown in Fig.
1h, and excluding PV cells). Because tetrode-implanted mice did not perform the task,
instead of 20 trials of continuous suppression, we used a fixed duration of 100 seconds
(corresponding to the approximate duration of 20 trials, see Fig. 3e). Across the
population, suppression reduced spontaneous activity from 1.8 ± 1.9 to 0.9 ± 1.4 Hz
!30

(Figure 3b, t = 9.2, p < 0.0001, n = 153 neurons). Spontaneous activity was significantly
suppressed in 102/153 (67%) of neurons. Suppression was stable throughout the 100
second suppression period, with no mean difference between the first 10 seconds of
suppression and the final 10 seconds (p = 0.60).
After a new group of 10 fiber-implanted PV-ChR2 mice reached asymptotic
performance on step 5, we alternated 20-trial blocks of no illumination with 20-trial
blocks of 100 Hz illumination. Figure 3c shows the performance of individual mice as
well as the group mean averaged across a minimum of 119 blocks, representing at least
19 days of behavior. On trial 1 (the first illumination trial in the cycle), laser onset
coincided with tone onset, making it analogous to the laser trials in the 500 ms transient
suppression experiment, producing a 12% drop in performance (p = 0.00098, one-tailed
Wilcoxon signed-rank). Already by the second trial in the cycle, performance recovered
substantially. However, performance did not recover to pre-suppression levels by the end
of the cycle (comparison of last suppression trial with last pre-suppression trial: p =
0.002, one-tailed Wilcoxon signed-rank). Reaction time was unaffected by optogenetic
suppression (Fig. 3d) regardless of position within the trial cycle (comparison of first
suppression trial with last pre-suppression trial, p = 0.422, one-tailed Wilcoxon signed-
rank). Mice completed the 20-trial cycles in about 1-3 minutes, which did not differ
between laser-on and laser-off blocks (Fig. 3e, p = 0.461, one-tailed Wilcoxon signed-
rank). This indicates that prolonged suppression produces an immediate deficit followed
by a rapid but partial recovery, as well as a sustained deficit lasting at least 20 trials or
!31
about 1-3 minutes. Recovery was not well fit by either single or double exponentials,
either with respect to trials or to elapsed time, suggesting a complex time course.
After mice completed at least 19 days of testing with the 20-trial cycle protocol,
we tested them with transient 500 ms suppression to compare the strength of effects.
Mice showed individual differences in effect sizes, but across mice the effect of transient
500 ms suppression was highly correlated with the effect of cycle suppression (Fig. 3f, R2
= 0.7834, p = 0.0007, linear regression, n = 10 mice). The effect size for the initial trial of
cycle suppression was half of that for transient 500 ms suppression (regression slope m =
0.502, y-intercept = 2.5%). This could be due to the 50% duty cycle of the sustained 100
Hz pulse train (5 ms on, 5 ms off).
We wondered whether the incomplete recovery seen after 20 trials of suppression
(Fig. 3c) indicated the existence of a longer-lasting recovery process. We therefore
extended this cycle-based approach to use cycles of 200 trials with laser on, alternating
with 200 trials with laser off. The initial laser onset deficit remained, as seen from a
comparison of performance on the final 10 pre-suppression and first 10 post-suppression
trials (p = 0.031, one-tailed Wilcoxon signed-rank). Mice showed a sustained
performance deficit even after 200 trials (Figure 3g, n = 5 mice). The deficit in the last 10
trials was no different from that in the first 10 trials (p = 0.31, one-tailed Wilcoxon
signed rank), nor was it different from the last 10 trials using the 20-trial cycle protocol (p
= 0.5, one-tailed Wilcoxon signed rank). There was also no trend towards recovery over
the course of the 200 trials (linear regression slope m = -0.032, p = 0.686). Mice
completed the 200-trial cycles in a median (across mice) of 20.5 ± 5.3 minutes. This
!32

suggests that if there is a recovery process during optogenetic suppression of auditory
cortex, it lasts at least 20.5 minutes. Given the lack of any trend towards recovery (Fig.
3g), it seems likely that complete recovery would take appreciably longer than 20.5
minutes.
Given that we observed a complete recovery following electrolytic lesions of
auditory cortex, tested 4 hours after lesion, these results suggest that either (1) recovery
after cortical lesion/suppression has a time course that lies between 20.5 minutes and 4
hours, or else (2) electrolytic lesions and optogenetic suppression have fundamentally
different effects on tone discrimination performance. To distinguish between these
possibilities, we designed a sustained optogenetic protocol to mimic as closely as
possible the time course of our electrolytic lesion experiments.
Sustained Optogenetic Suppression Impairs Tone Discrimination
In our electrolytic lesion experiments, we tested well-trained mice for half an hour
in the morning to establish same-day baseline performance, then electrolytically lesioned
auditory cortex bilaterally (45 seconds of current), and re-tested mice as soon as they
were bright, alert, and responsive (median 4 hours post-lesion). To optogenetically mimic
this protocol, we replaced the electrolytic lesion step with an onset of sustained 100 Hz
laser illumination. We ran mice on tone discrimination for half an hour, then connected
fibers and started a sustained 100 Hz laser pulse train, and allowed mice to remain in a
holding cage in the testing chamber for 4 hours of sustained 100 Hz illumination.
!33
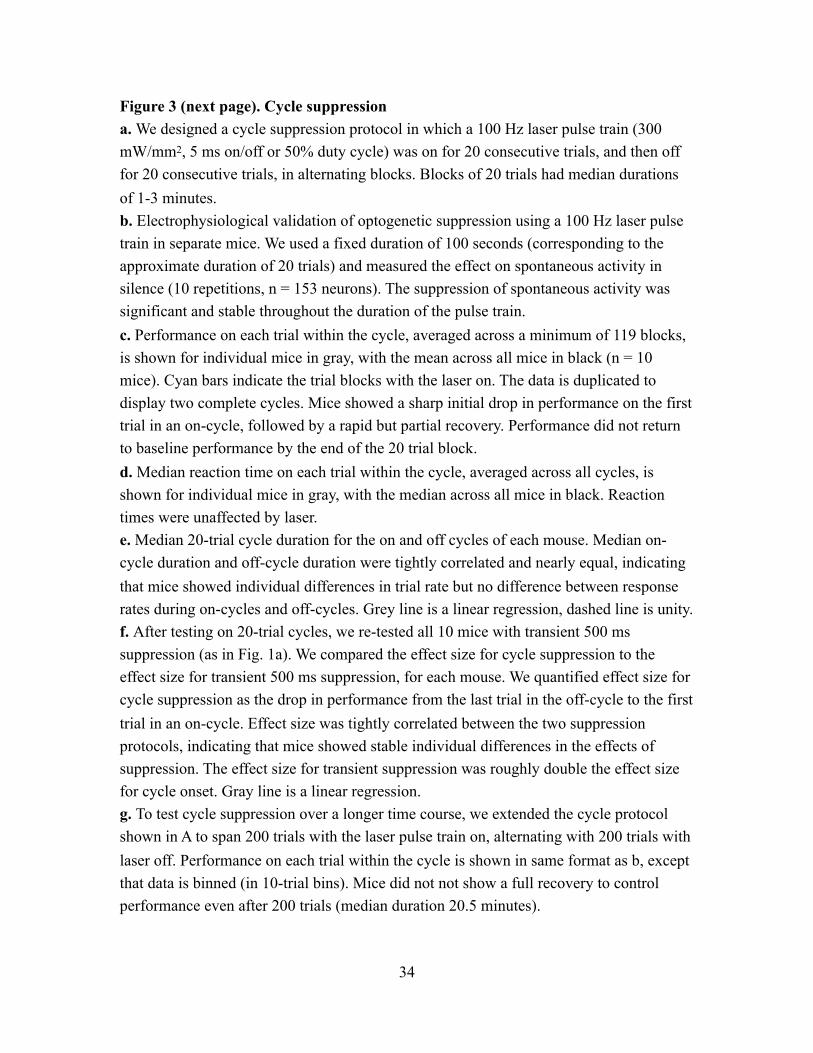
Figure 3 (next page). Cycle suppression a. We designed a cycle suppression protocol in which a 100 Hz laser pulse train (300 mW/mm2, 5 ms on/off or 50% duty cycle) was on for 20 consecutive trials, and then off for 20 consecutive trials, in alternating blocks. Blocks of 20 trials had median durations of 1-3 minutes. b. Electrophysiological validation of optogenetic suppression using a 100 Hz laser pulse train in separate mice. We used a fixed duration of 100 seconds (corresponding to the approximate duration of 20 trials) and measured the effect on spontaneous activity in silence (10 repetitions, n = 153 neurons). The suppression of spontaneous activity was significant and stable throughout the duration of the pulse train. c. Performance on each trial within the cycle, averaged across a minimum of 119 blocks, is shown for individual mice in gray, with the mean across all mice in black (n = 10 mice). Cyan bars indicate the trial blocks with the laser on. The data is duplicated to display two complete cycles. Mice showed a sharp initial drop in performance on the first trial in an on-cycle, followed by a rapid but partial recovery. Performance did not return to baseline performance by the end of the 20 trial block. d. Median reaction time on each trial within the cycle, averaged across all cycles, is shown for individual mice in gray, with the median across all mice in black. Reaction times were unaffected by laser. e. Median 20-trial cycle duration for the on and off cycles of each mouse. Median on-cycle duration and off-cycle duration were tightly correlated and nearly equal, indicating that mice showed individual differences in trial rate but no difference between response rates during on-cycles and off-cycles. Grey line is a linear regression, dashed line is unity. f. After testing on 20-trial cycles, we re-tested all 10 mice with transient 500 ms suppression (as in Fig. 1a). We compared the effect size for cycle suppression to the effect size for transient 500 ms suppression, for each mouse. We quantified effect size for cycle suppression as the drop in performance from the last trial in the off-cycle to the first trial in an on-cycle. Effect size was tightly correlated between the two suppression protocols, indicating that mice showed stable individual differences in the effects of suppression. The effect size for transient suppression was roughly double the effect size for cycle onset. Gray line is a linear regression. g. To test cycle suppression over a longer time course, we extended the cycle protocol shown in A to span 200 trials with the laser pulse train on, alternating with 200 trials with laser off. Performance on each trial within the cycle is shown in same format as b, except that data is binned (in 10-trial bins). Mice did not not show a full recovery to control performance even after 200 trials (median duration 20.5 minutes).
!34

!35

Then, with continued laser illumination, we re-tested tone discrimination for at
least 30 minutes. Mice showed a sustained performance deficit after 4 hours of sustained
illumination (Figure 4a). Mean pre-suppression performance was 93.4 ± 1.4%, and after 4
hours of suppression was 76.6 ± 3.4% (p = 0.0012, one-tailed Wilcoxon signed-rank,
effect size d = 0.785, n = 15 sessions in 5 mice). This effect size is slightly larger than the
observed effect of transient suppression during tone presentation (d = 0.62). This
indicates that the tone discrimination deficit produced by sustained optogenetic
suppression persists for at least 4 hours. From this we conclude that electrolytic lesions
and optogenetic suppression have fundamentally different effects on tone discrimination
performance: lesions of auditory cortex have no effect on performance as soon as it can
be measured, but suppression over the same time course produces a lasting deficit.
Discussion
Here we used both optogenetic suppression and lesions to ask whether auditory
cortex is required for frequency discrimination of pure tones in mice. We found that
lesions of auditory cortex had no effect on tone discrimination, even when tested only 4
hours after the lesion. However, optogenetic suppression of auditory cortex significantly
impaired tone discrimination, across a wide range of durations of suppression. Transient
suppression just during tone presentation produced the strongest deficit. Performance
during sustained suppression recovered rapidly after the first trial of suppression, but only
partially, quickly stabilizing within a few trials to a persistent deficit.
!36

Figure 4. Sustained optogenetic suppression impairs pure tone discrimination a. Performance for each of 5 mice before and after 4 hours of sustained optogenetic suppression (format as in Figure 2c; each mouse is shown in a different color). Note that 4 hours elapsed during sustained suppression (cyan dashed line), after which suppression was maintained throughout a second session of behavior. We repeated this experiment 1-4 times per mouse, resulting in 15 sessions for the 5 mice. Because mice ran a different number of trials in each session, we averaged across mice by including only trials contained in all 15 sessions (black line, which is limited to the duration of the shortest session). The grey line shows the average across the 14 sessions not including the shortest one. b. Mean performance before and after sustained suppression. Format as in Figure 2d. Connected dots show each mean performance for each of 15 sessions (using trials from the black segments in a).
!37

This deficit remained for as long as suppression was maintained, up to at least 4 hours.
These results suggest that lesions and optogenetic suppression of auditory cortex produce
fundamentally different effects on tone discrimination performance, which cannot be
explained simply by the time course of some recovery process. Rather, it seems likely
that multiple redundant systems must contribute to tone discrimination. This suggests that
the absence of auditory cortex induces switching between these systems, but that the
efficacy and time course of this switching process depends strongly on the method by
which auditory cortex is made unavailable. We conclude that auditory cortex does
contribute to frequency discrimination for pure tones. This is surprising given that we and
others have shown that lesions have no effect on tone discrimination.
Numerous lesion studies over the past 75 years have investigated the role of
auditory cortex in frequency discrimination (Meyer and Woolsey, 1952; Butler et al.,
1957; Thompson, 1960; Goldberg and Neff, 1961; Kelly, 1970; Sellick, 1983; Buser and
Imbert, 1992; Ohl et al., 1999; Talwar et al., 2001; Rybalko et al., 2006; Porter et al.,
2011; Gimenez et al., 2015). Although there are conflicting results, the consensus view is
that frequency discrimination is not affected by lesions of auditory cortex, even extensive
lesions of all known auditory cortical fields. Cortical lesions have been shown to produce
deficits if the stimuli are more complex (such as frequency-modulated tones, or complex
tones with a missing fundamental frequency), or if a temporal judgement is required, or
with greater task difficulty or more elaborate testing or training procedures. For pure
tones, however, it appears that some other brain region or system can support frequency
discrimination when auditory cortex is destroyed. In contrast, transient inactivation of rat
!38

auditory cortex with muscimol has been reported to completely eliminate tone detection
(as if animals were totally deaf), with coarse frequency discrimination recovering over
several hours as muscimol gradually wears off, followed by recovery of fine frequency
discrimination (Talwar et al., 2001). It has been difficult to reconcile these strikingly
different effects of lesions and muscimol. One possible explanation is that muscimol, a
small molecule, could diffuse to and inactivate other cortical or subcortical auditory
structures. Yet auditory cortical lesions have been shown to produce extensive
degradation of the MGN (Kelly, 1970), without impacting tone discrimination,
suggesting that muscimol must diffuse at least to inferior colliculus or brainstem
structures in order for diffusion to account for the difference from lesion results. Other
studies have reported that muscimol inactivation of auditory cortex had only a slight (but
significant) impact on frequency discrimination (effect size ~6%) (Gimenez et al., 2015).
An important difference between these studies is that Talwar et al. used a 20-fold higher
dosage of muscimol, which could support greater diffusion (but not a difference in the
degree of inactivation of auditory cortex, which was nearly complete in both studies).
Other differences such as task design and drug administration methods could also play a
role. A different possible explanation for the discrepancy between lesion and some
muscimol inactivation studies is that the recovery process, or switching of task
implementation from auditory cortex to some other brain structure (such as inferior
colliculus), is engaged by injury but not by inactivation. Our results support this
interpretation. Our findings that optogenetic suppression impaired tone discrimination,
but lesions did not, even when the time course was similar for both (4 hours), are
!39

consistent with the idea that injury induces a rapid recovery process that inactivation
alone does not. The fact that the time course, task design, behavioral apparatus, and
species were identical for both our lesion and optogenetic suppression experiments
greatly constrains the possible factors that could lead to recovery or the lack thereof.
Our results indicate a role for auditory cortex in tone discrimination, but it
remains unclear what the nature of this role is. For example, optogenetic suppression of
auditory cortex could produce a deficit in sensory processing, or could instead interfere
with the integration of the sensory stimulus and the appropriate motor response
(Kuchibhotla and Bathellier, 2018). For example, it is possible that both auditory cortex
and an alternative circuit normally operate to discriminate frequencies, but the alternative
circuit is ignored for the purposes of decision-making as long as there is some auditory
cortical activity on which to base a choice. At the sensory processing level, there are
conflicting reports about whether lesions of auditory cortex affect hearing thresholds
(Butler et al., 1957; Goldberg and Neff, 1961; Neff et al., 1975; Heffner and Heffner,
1986, 1990). We designed our stimuli to be easily discriminable, with a sound level of 77
dB and a wide >1.5 octave frequency separation. This suggests that a change in hearing
thresholds would need to be substantial in order to account for our results. The fact that
suppression had no effect on response times (Figure 3d-e) helps to rule out effects on
motivation or arousal, or effects due to distraction or motor disruption.
A role for auditory cortex in frequency discrimination has also been shown by
modulation of cortical activity, rather than complete suppression. Interestingly, moderate
photoactivation of PV interneurons in auditory cortex, using a PV-ChR2 strategy similar
!40
to ours, has been shown to improve frequency discrimination acuity (Aizenberg et al.,
2015). In that study, PV activation using a low laser power (0.2 mW/mm2) had a stronger
effect on spontaneous than on tone-evoked activity, leading to a net increase in tone-
evoked signal-to-noise ratio. This suggests that enhanced population coding in auditory
cortex underlies the improvement in frequency discrimination thresholds seen with low-
power photomodulation (Aizenberg et al., 2015; Briguglio et al., 2018). In contrast, we
used a thousand-fold greater laser power (300 mW/mm2), which abolished tone responses
altogether rather than enhancing signal-to-noise.
One mechanism that has been proposed to explain differing effects of lesions and
optogenetic suppression is the loss of a biasing input to downstream structures (Otchy et
al., 2015; Hong et al., 2018). In this scenario, loss of activity in auditory cortex would
cause a loss of synaptic drive to downstream neurons, acutely dropping their membrane
potentials below firing threshold and impairing the flow of information through circuits
supporting discrimination performance. Due to homeostatic mechanisms such as an
increase in membrane excitability, these downstream neurons respond to a sustained lack
of firing by lowering spike thresholds, allowing a previously sub-threshold alternative
synaptic pathway to drive spiking output. Homeostatic synaptic plasticity or shifts in the
balance of excitation to inhibition could achieve similar results (Scholl and Wehr, 2008).
Thus acute optogenetic suppression could impair circuit function, but on a longer
homeostatic time scale, alternative circuits could support recovery from a lesion. Key to
this model is the difference in time scale between acute optogenetic suppression and
longer-term recovery from a lesion. Our results appear to rule out this scenario, because
!41

in our sustained suppression experiment we maintained optogenetic suppression for as
long as animals took to successfully recover from a lesion and perform without deficit.
This indicates that any homeostatic mechanism arising from a loss of cortical activity
should have had enough time to permit recovery through an alternative pathway.
Similar to our findings, optogenetic suppression of somatosensory cortex partially
impairs a whisker-based object detection task (Hong et al., 2018). However,
somatosensory cortical lesions also produced a partial impairment on that task, in contrast
to our findings. Interestingly, object detection performance recovered abruptly to pre-
lesion levels by the next session, and task exposure appeared to be instrumental for this
recovery. We found that mice showed no deficit after lesions, even within the first few
trials (Fig. 2b,c), suggesting that task exposure is not necessary for recovery under our
experimental conditions. Dorsolateral striatum appeared to be necessary for recovery
after somatosensory cortical lesions (Hong et al., 2018), raising the possibility that the
striatum might also be involved in the rapid recovery of tone discrimination ability after
lesions to auditory cortex.
!42

Bridge to Chapter III
To expand on the knowledge gained in the experiments contained in Chapter II,
Chapter III extends the experimental paradigm to examine the necessity of auditory
cortex for discrimination of more complex sounds. Additionally, Chapter III involves the
examination of long-term effects of learning related to laser stimulation.
!43

CHAPTER III:
AUDITORY CORTEX CONTRIBUTES TO PHONEME DISCRIMINATION
JOURNAL STYLE INFORMATION: pending submission to Frontiers in Neuroscience AUTHOR CONTRIBUTION: Conor T. O’Sullivan, Aldis Weible, Mike Wehr
This chapter is a manuscript that will be submitted to Frontiers in Neuroscience.
In this paper, I was the primary person responsible for experimental design, data
collection/analysis, and the bulk of writing. I received assistance from Aldis Weible, who
carried out and analyzed electrophysiology experiments and surgical procedures. Mike
Wehr, the final author, is my lab’s PI and assisted throughout the experiment and writing
process.
Introduction
Speech activates broad spatiotemporal patterns of activity throughout the
mammalian auditory system (Johnson et al., 2005; Kilgard and Engineer, 2015;
Liebenthal et al., 2005). The distinct neural representations evoked by different speech
sounds is thought to underlie our ability to distinguish between them (Centanni et al.,
2013; Engineer et al., 2008; Kilgard and Engineer, 2015). However, it is still unclear
which details of these spatiotemporal activity patterns matter, and how neural processing
of them leads ultimately to perceptual discrimination. Early in the auditory pathway,
speech-evoked neural activity appears to encode the acoustic structure of speech sounds,
whereas in higher order auditory areas it appears to encode progressively more
!44

categorical aspects of speech (Chang et al., 2010; Flinker et al., 2011; Pasley et al., 2012;
Tsunada et al., 2011).
It is clear from lesion studies that auditory cortex is necessary for the
discrimination of complex sounds, including speech, but not for simpler auditory tasks
such as frequency discrimination (Cranford et al., 1976; Floody et al., 2010; Ohl et al.,
1999; Porter et al., 2011). Converging evidence from electrophysiology, behavior, and
lesion studies has implicated precise spike timing during the initial onset response in
auditory cortex as being especially important for the discrimination of speech sounds. In
rats trained to discriminate consonants, their discrimination performance is well-
correlated with the distinctness of spatiotemporal activity patterns in auditory cortex
(Centanni et al., 2013; Engineer et al., 2008). Precise spike timing is critical for this
relationship, because the removal of spike timing information by binning responses
disrupts both neural discriminability and its correlation with behavioral discrimination
(Centanni et al., 2013; Engineer et al., 2008)(Schnupp et al., 2006). The initial 40 ms of
the onset response in auditory cortex appears to be particularly informative. For neural
decoding of speech sounds, the initial 40 ms of the response contains the most
information required for neural discrimination of consonants (Centanni et al., 2014;
Engineer et al., 2008; Perez et al., 2013). In addition, auditory cortex lesions cause much
greater impairment of the discrimination of speech sounds that are truncated to the initial
40 ms than for full syllables (Floody et al., 2010; Porter et al., 2011).
The picture that emerges from these findings is that not all of the neuronal spiking
in a speech-evoked spatiotemporal pattern of activity is equipotent for discrimination of
!45

consonants. Rather, early activity appears to contain more discriminative information
than later activity. However, the hypothesis that early cortical activity matters more for
discrimination of speech sounds than late activity has not yet been rigorously tested.
Speech-evoked responses of cortical neurons show higher correlation with behavioral
discriminability during the initial 40 ms of activity (Engineer et al., 2008), but this
correlation does not demonstrate a causal relationship with behavioral discrimination.
The fact that cortical lesions cause greater impairment for discrimination of truncated
speech sounds demonstrates a causal role for auditory cortex (Porter et al., 2011), but
manipulating the stimulus is not the same thing as manipulating the neural representation
itself. Here we set out to test this hypothesis by taking advantage of the temporal
precision of optogenetics to manipulate cortical activity during the discrimination of
speech sounds. Mice discriminated the words “dad” and “sad,” pitch-shifted up into the
mouse hearing range. These sounds are most different in the early 0-140 ms time window
(initial consonant “d” or “s”) but are much more similar in the late 140-280 ms time
window (during the rhyming vowel sound). We predicted that suppressing early speech-
evoked activity in auditory cortex would cause a greater impairment than suppressing late
activity. We found that full suppression over the entire duration of the stimulus
significantly impaired discrimination, confirming previous results from lesion studies.
Surprisingly, we found that suppression during the early or late temporal windows were
equally disruptive, each causing as much impairment as full suppression. We conclude
that for mice trained to discriminate speech sounds, disruption of any temporal
component of the representation impairs discrimination. Our interpretation is that
!46

regardless of which spatiotemporal aspects of a representation may be most informative,
any type of disrupted representation differs from those learned in training, thereby
impairing performance.
Methods
All procedures were performed in accordance with the National Institutes of
Health guidelines, as approved by the University of Oregon Institutional Animal Care and
Use Committee.
Mice
In this study, we used a total of 9 mice for optogenetic suppression of auditory
cortex during performance of a phoneme discrimination task. The mice were offspring
from a cross of homozygous Pvalb-IRES-Cre (“PV”, JAX No. 008069; The Jackson
Laboratory) and homozygous CAG-ChR2-eYFP (“ChR2”, JAX No. 012569; The
Jackson Laboratory) lines, which are on a C57Bl6/J background. In these mice (“PV-
ChR2”), ChR2 was expressed in parvalbumin-expressing (PV+) interneurons (Moore
2013). We used an additional 2 PV-ChR2 mice (not used for behavior) for
electrophysiological validation of optogenetic suppression.
Surgical procedures
To deliver laser illumination to auditory cortex while mice performed the task, we
surgically implanted optical fibers bilaterally before the beginning of training. We
!47

administered dexamethasone (0.1 mg/kg) and atropine (0.03 mg/kg) pre-surgically to
reduce inflammation and respiratory irregularities. Surgical anesthesia was maintained
with isoflurane (1.25-2.0%). We implanted 200 µm optic fibers in each hemisphere at AP
~2.3 mm (relative to bregma), ML 4.4 mm, and depth 0.5 mm below the dura (just dorsal
to primary auditory cortex). The implants were painted with black acrylic paint to
minimize light leakage. For electrophysiological verification of optogenetic suppression,
we implanted 2 mice (not used in behavioral experiments) with a unilateral optrode array,
consisting of 8 tetrodes and a 200 µm fiber terminating 1 mm above the recording sites.
The 8 tetrodes passed through two 28-gauge stainless steel hypodermic tubes, with 4
tetrodes per tube. The optic fiber was fixed in position immediately adjacent to, and
between, these tubes. Tetrodes were made of 18 µm (25 µm coated) tungsten wire
(California Fine Wire). The entire array was mounted on a custom microdrive. The
optrode array was inserted vertically through a small craniotomy (2 mm x 1 mm) dorsal
to auditory cortex, and cemented into place. We administered ketoprofen (4.0 mg/kg)
post-operatively to minimize discomfort. Mice were housed individually following the
surgery and were allowed 7 days of post-operative recovery.
Histology
Brains of mice used for electrophysiological validation were sectioned (100 µm)
in the coronal plane to verify the position of single neuron recording sites. Only data
corresponding to tracks located within auditory cortex were included. Following behavior
!48

experiments, 6 out of the 9 mice were sectioned to confirm the location of implanted
fibers in auditory cortex.
Behavioral apparatus
Mice performed the task in sound-attenuating behavioral chambers. Within the
chamber, mice were placed in a plastic arena, one wall of which contained 3 combination
ports for lick-sensing and water delivery (Fig. 1a). Each port had an IR beam-break
sensor, at which mice responded by licking, and a tube to deliver water rewards for
correct responses. Sound stimuli were controlled by a computer running custom
behavioral software (modified from Meier et al., 2011), and delivered through 2 speakers
placed outside the arena facing the ports. Since laser illumination was delivered with blue
light that could potentially be visible to the mouse, we used a color-matched blue strobe
light (full-field illumination at approximately 10 Hz) to mask laser stimulation. Mice
were trained for an hour each day for 5-7 days a week, corresponding to 300-500 trials
and 1-2 g of water reward per day. Mice were water-restricted, typically receiving water
only through performance of the task, but were supplemented as necessary to remain
above 80% of pre-training body mass.
Stimuli
We recorded the words “sad” and “dad”, spoken by a female native speaker of US
English, using a Bruel & Kjaer 4939 microphone. We digitized the signal at 176 kHz and
then decimated down to 44.1 kHz. Because much of the frequency content of human
!49
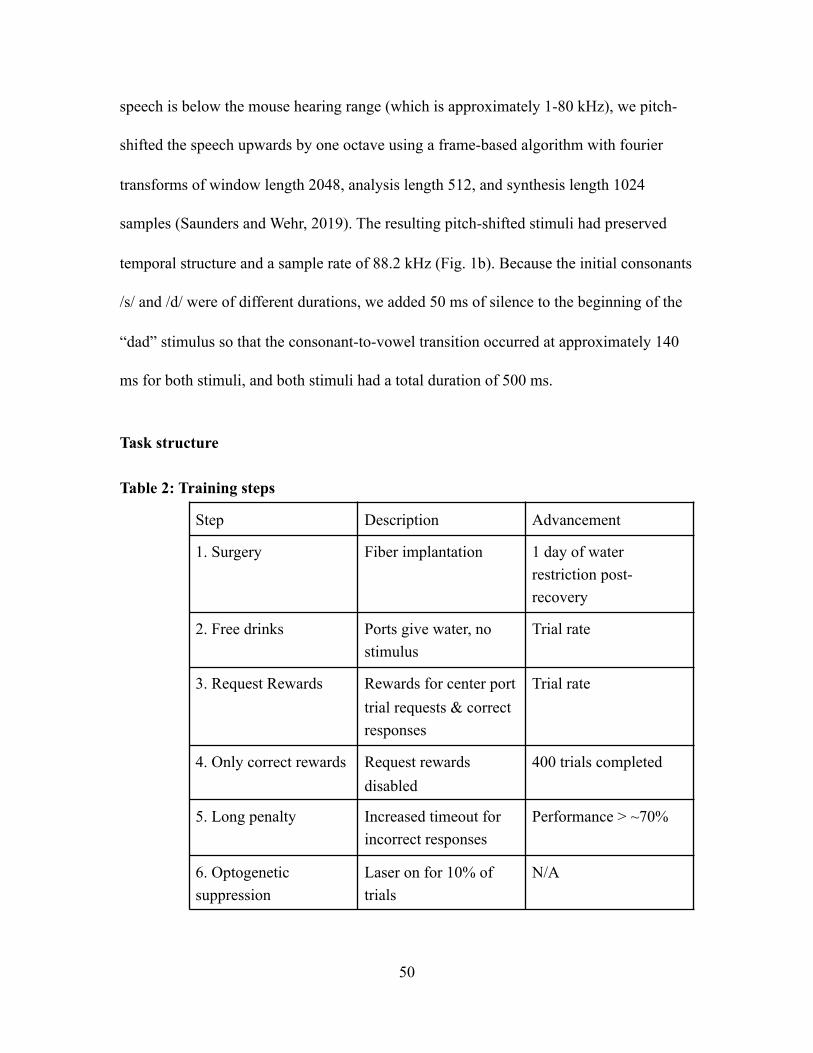
speech is below the mouse hearing range (which is approximately 1-80 kHz), we pitch-
shifted the speech upwards by one octave using a frame-based algorithm with fourier
transforms of window length 2048, analysis length 512, and synthesis length 1024
samples (Saunders and Wehr, 2019). The resulting pitch-shifted stimuli had preserved
temporal structure and a sample rate of 88.2 kHz (Fig. 1b). Because the initial consonants
/s/ and /d/ were of different durations, we added 50 ms of silence to the beginning of the
“dad” stimulus so that the consonant-to-vowel transition occurred at approximately 140
ms for both stimuli, and both stimuli had a total duration of 500 ms.
Task structure
Table 2: Training steps
Step Description Advancement
1. Surgery Fiber implantation 1 day of water restriction post-recovery
2. Free drinks Ports give water, no stimulus
Trial rate
3. Request Rewards Rewards for center port trial requests & correct responses
Trial rate
4. Only correct rewards Request rewards disabled
400 trials completed
5. Long penalty Increased timeout for incorrect responses
Performance > ~70%
6. Optogenetic suppression
Laser on for 10% of trials
N/A
!50

Prior to any behavioral training, the mice underwent surgical implantation of
optical fibers (Step 1, see Table 2). After recovery, the mice were familiarized with the
operation of the ports in the absence of sound stimuli using a simple lick-for-water task
(Step 2, “Free drinks”). Next, they advanced to the first stage of the main task (Step 3). In
the main task, mice requested trials by licking the center port, which triggered stimulus
delivery. Mice responded by licking at the left port (for “sad”) or the right port (for
“dad”). Correct responses triggered an 80 µl water reward followed by a 1 second delay
before the next trial could be requested, whereas incorrect responses gave no water and
provided an additional 1 second penalty timeout before the next trial. To increase the
number of trials performed, some mice had their water rewards reduced to 60 or 40 µl.
During an initial shaping stage of the main task (Step 3), mice received water rewards at
the center port for requesting trials (as well as for correct answers at the side ports) until
reaching a rate of 7 completed trials in 30 seconds. Once the mice achieved this rate of
trials, the rewards for center-poke trial requests were removed, forming the next stage
(Step 4) of the task structure. After 400 trials in this condition, the penalty timeout for
incorrect responses was increased to 3 s (Step 5). In Steps 3-5 we included “correction
trials” to reduce the development of response bias to one side or the other. After an
incorrect response, there was a 50% chance that a mouse would go into a correction trial
sequence, in which the same stimulus was repeated until the mouse responded correctly.
Correction trials provide contextual information that could conceivably allow a task
strategy that did not depend solely on stimulus discrimination, so we disabled correction
trials during the final optogenetic suppression stage (Step 6). When mice were
!51

performing at 70% or higher on Step 5 for approximately 5 days, they were run for at
least 2 days with fibers attached but without light delivery, to allow the mice to become
accustomed to the fibers. Then mice advanced to the final stage (Step 6) for optogenetic
suppression experiments.
Optogenetic Suppression
To suppress auditory cortex, we delivered 445 nm wavelength laser pulses to
auditory cortex through chronically implanted bilateral optical fibers. We used two laser
powers: a standard total power of 20 mW (corresponding to 630 mW/mm2 at the fiber
tip), and additional testing with a total power of 9.5 mW (300 mW/mm2). In a previous
study using identical fiber implantation and lasers, we electrophysiologically
characterized the spatial extent of cortical suppression, which was 1750 µm at a power of
9.5 mW (Weible et al., 2014). We have not characterized the spatial extent of suppression
at 20 mW, but based on our previous measurements at 9.5 mW and a model of light
transmission in mammalian brain tissue (DeisserothLab), we estimate that the spatial
extent of suppression at 20 mW is 2100 µm, an extent that includes all tonotopic fields of
auditory cortex, throughout the cortical depth, but does not include thalamic, collicular,
or other subcortical auditory structures. Laser illumination trials were randomly
interleaved on 10% of trials. We used three temporal profiles for illumination. For “Full”
suppression trials, illumination was delivered during the entire 500 ms from sound onset
to sound termination. For “Early” suppression trials, illumination was delivered from
0-140 ms following stimulus onset, whereas for “Late” trials, illumination was delivered
!52

from 140-280 ms following stimulus onset (Fig. 2a). Because the consonant-to-vowel
transition occurred at ~140 ms, Early suppression coincided with the initial consonants (/
d/ or /s/), and Late suppression coincided with the following vowel. We did not include a
condition that specifically targeted the trailing consonant /d/. Initially, all laser trials were
rewarded randomly in order to avoid the possibility that mice might be able to learn new
associations between laser+stimulus and rewards (if laser+stimulus combinations were
correctly rewarded according to the stimulus identity). In follow-up experiments, we
explicitly examined whether mice could learn new associations by correctly rewarding
laser trials.
As an additional control experiment, we tested the possibility that visible cues
produced by the laser could influence performance through learning. In this case, instead
of connecting the optical fibers to the implanted optical ferrules, we placed them on the
wall of the behavioral chamber, where the light was clearly visible to the mouse, but not
reaching the brain. We tested this condition with both randomly rewarded laser trials and
correctly rewarded laser trials to examine the ability of mice to learn visible laser-cue
associations under both reward conditions.
Statistical Analysis
We calculated performance separately for responses on laser and control trials.
Because not all performance data were normally distributed (Lilliefors test), we used
non-parametric statistics throughout. We compared accuracy (in percent correct) for
individual mice using Fisher’s exact test on the contingency tables created by the two
!53

stimuli and two possible responses, using the odds ratio as a measure of effect size. We
tested for group effects using the two-tailed Wilcoxon signed-rank test. Because we found
a range of long-term learning effects (as described below in Results, “Laser-related
learning” and in Fig. 3), we used only the first 10,000 total trials after the start of laser
stimulation (Step 6) unless otherwise noted. To examine changes over time, we calculated
performance using a 200-trial sliding window.
To determine the rightward or leftward response bias of each mouse, we
calculated the difference between the proportion of rightward responses and rightward
stimuli (i.e., stimuli for which the correct response is rightward) in a sliding 200-trial
window. A difference of zero indicates no bias, such that responses are proportionate to
the stimuli presented. For display, we added 50% to the bias values, such that 50%
indicates no bias, values <50% indicate leftward bias, and values >50% indicate
rightward bias.
For receiver-operator-characteristic (ROC) analysis (Green and Swets, 1966), we
evaluated performance separately for each stimulus and then compared between laser and
control trials. To show stimulus-related effects, each mouse’s performance was separated
into “hit rate” (percent correct on “dad” trials) and “false alarm rate” (100 - percent
correct on “sad” trials). This arbitrary assignment to hits and false alarms allows ROC
analysis of laser effects on both accuracy and response bias. For each mouse, we plotted
hits against false alarms separately for laser and control conditions. The distance between
these points indicates the magnitude of the laser effect on accuracy, and the direction
between them indicates the degree of induced bias.
!54

Single Neuron Recording and Analysis
Tetrode data were acquired with 32-channel RHD2000 hardware (Intan
Technologies) and Open Ephys software (Siegle et al., 2017). A minimum threshold of 60
µV was set for collection of spiking activity. Activity of individual neurons was isolated
offline using MClust (Redish, 2008). Measures of peak and trough waveform voltage,
energy, and principal components analysis were used as waveform separation parameters
in 2-dimensional cluster space. Cells were accepted for analysis only if they had a cluster
boundary completely separate from adjacent cluster boundaries, and completely above
threshold, on at least one 2-D view. Cluster boundaries were then applied across sessions
to track single cell responses across different stimulus contingencies.
We recorded neuronal responses to the pitch-shifted “sad” and “dad” stimuli used
for behavior (500 ms duration, 500 ms inter-trial interval, 50 repetitions) with or without
optogenetic suppression on interleaved trials. We used the same laser power as in the
behavior experiments ( 20 mW and 9.5 mW, corresponding to an irradiance of 630 and
300 mW/mm2 as measured at the tip of the 200 µm diameter fiber). All data were
collected as mice freely explored a cylindrical plastic container (height 16 cm, diameter
16 cm) inside a double-walled sound-attenuating chamber. Sounds were delivered from a
free-field speaker directly above the cylinder. The speaker was calibrated to within ±1 dB
using a Brüel and Kjær 4939 1/4-inch microphone positioned within the cylinder
approximately at head height. Following each recording session, the tetrode array was
lowered ~80 µm and allowed to settle for a minimum of 3 hours before initiating another
session to ensure that responses collected during each session reflected the activity of a
!55

unique population of cells. Recordings from putative PV cells, as identified by significant
firing rate increases during laser pulses in silence compared with an equivalent period of
silence with laser off (paired t-test), were excluded from group analyses.
Results
Training
Out of an initial 15 mice cohort implanted and trained on the task, 9 successfully
learned the task, reaching and maintaining 70-80% performance. From the start of
training, it typically took 25-30k trials before mice advanced to optogenetic suppression
experiments, corresponding to approximately 2-3 months.
Electrophysiology
To verify that our optogenetic method effectively suppressed cortical activity, we
recorded from auditory cortical neurons in 3 separate mice (not used for behavior) using a
tetrode array, attached to an optical fiber implanted in the same location as the mice used
for behavior. We recorded from 116 neurons. We excluded 9 PV cells, which were
unambiguously identified by robust responses to illumination (Moore and Wehr, 2013).
Figure 1c shows a typical example of responses to the “dad” and “sad” speech stimuli,
with complete optogenetic suppression by 300 mW/mm2 (9.5 mW) laser illumination.
Across the population, suppression was nearly complete for both 300 and 630 mW/mm2
laser illumination (Fig. 1c). Because neurons varied in the timing of their responses to the
speech stimuli, the brisk transient responses seen in individual cells (Fig. 1c, top) are not
!56

as evident in the population-averaged response (Fig. 1c, bottom). However, the
population average shows the effectiveness of optogenetic suppression. Across the
population of 107 non-PV cells, suppression reduced the mean firing rate during
phoneme presentation from 5.8 ± 5.5 to 0.6 ± 1.6 Hz (mean ± s.d., t = 18.8, p < 0.0001,
paired t-test) at an intensity of 300 mW/mm2, and from 5.1 ± 5.4 to 0.4 ± 1.1 Hz (mean ±
s.d., t = 17.4, p < 0.0001) at an intensity of 630 mW/mm2. Responses were significantly
suppressed by illumination in 100/107 (93%) non-PV neurons.
Full Stimulus Suppression
We first tested two mice, with an example training course shown in Fig. 1d, with
“Full” stimulus laser suppression, in which 20 mW illumination was delivered during the
entire 500 ms from sound onset to sound termination. Laser trials were randomly
interleaved on 10% of trials. Performance was significantly impaired on laser trials
compared to control trials (Fig. 1e, 74.8 ± 2% on control trials, 60 ± 7% on laser trials.
Both mice showed significant individual effects using the Fisher’s exact test (mouse
5623: p<0.0001, mouse 5625 p =0.0002). Since there was a significant deficit when
auditory cortex was suppressed, these results show the necessity of auditory cortex
activity for phoneme discrimination.
Multiple Suppression Windows
We used two speech stimuli that rhyme (“dad” and “sad”). That is, the initial
consonant differs (/d/ vs. /s/), but the vowel and final consonant are the same (“ad”). We
!57

therefore wondered whether neural activity evoked by the initial consonant might be
more informative for discrimination than neural activity evoked by the vowel and final
consonant. Even though the acoustic fine structure of the “ad” is slightly different in the
two tokens, we reasoned that they are much more similar than the initial consonants, and
therefore that the neural activity they evoke might provide less discriminative
information.
Figure 1 (next page): Transient optogenetic suppression of auditory cortex during the full stimulus duration impaired phoneme discrimination. a: The port mapping for this task involved a central request, with the waveforms for the “sad” and “dad” stimuli shown above their associated response port. b: Spectrograms of the original human voice recordings of “dad” and “sad” are shown alongside the pitch-shifted (up one octave) phonemes used for behavioral testing. In all plots, grayscale represents the power spectrum density (dB/Hz), with black representing -110 and white representing -30. c: Tetrode recordings were used to observe normal phoneme responses and their suppression with 9.5 and 20mW laser power. The 500ms stimulus and laser suppression begin at the 0ms point. The upper panel contains example data from a cell, with data averaged across both mice and all cells in the lower two panels. d: Performance of a typical mouse from initial training stages through laser suppression. Vertical dashed line indicates the onset of laser trials. Performance is represented as percent correct averaged across both stimuli in a 200-trial sliding window. Black: performance on control trials, cyan: performance on laser trials, grey: bias on laser trials. e: Performance in overall percent correct for each mouse is represented by connected dots representing control trials and suppression trials. Bars represent mean performance for each trial type across all mice. f: To show stimulus-related effects, each mouse’s performance was separated into “hit rate” (Percent correct on “dad” trials) and “false alarm rate” (100 - Percent correct on “sad” trials). The dashed line represents chance performance (50% correct), ranging from 100% left/sad responses at (0,0) to 100% right/dad at (100,100).
!58

!
!59

To test this possibility, we took advantage of the temporal precision of optogenetics to
suppress auditory cortical activity just during the initial 0-140 ms of the stimulus
(containing /d/ or /s/, which we refer to as “Early” suppression), or instead during the
trailing 140-280 ms of the stimulus (containing “ad”, which we refer to as “Late”
suppression). Randomly interleaved Early and Late suppression trials each made up 10%
of the total, with Control trials (no illumination) as the remaining 80%. We predicted that
Early suppression would have a stronger effect on behavioral performance than Late
suppression. We tested a group of 9 mice, including the 2 used in full suppression
experiments, and instead found that both Early and Late suppression produced similar
deficits in performance (Fig. 2b; Early: 60.2% ± 7.9%, Late: 59.6% ± 6.9%, Control:
72.3% ± 4.6%, n = 9 mice). Both Early and Late suppression were significantly different
from Control (Early vs. Control: p=0.0117, Late vs. Control: p=0.0117, Wilcoxon signed-
rank, corrected for multiple comparisons), whereas Early and Late suppression were not
different from each other (p=0.82). We conclude that either epoch of suppression was
sufficient to disrupt performance.
To examine these effects in more detail, we quantified the effects of both Early
and Late suppression using ROC analysis (Fig. 2c), which allowed us to partition the
effects on performance into effects on accuracy and bias. Out of the 9 mice, 7 showed
significant effects of the laser in both conditions, one mouse had a significant effect only
for Late suppression, and one did not show significant effects in either condition (Fisher’s
exact test, p<0.05). Most mice exhibited a side bias on laser trials, indicated by shifts in
performance towards the upper-right or lower-left corners in Figure 2c. Other mice
!60

showed almost no bias, with performance shifted towards the lower-right corner,
corresponding to similar deficits for both stimuli. Comparison of the effects of Early and
Late suppression for each mouse showed that the directions and magnitudes were largely
similar for both suppression windows. We conclude that the effects of the two
suppression windows on performance were nearly equivalent in terms of both accuracy
and bias.
Laser-related Learning
Disconnected Fibers
Because laser illumination of the brain is potentially visible to the mice during
Figure 2 (next page): Suppression during either early or late timing windows had equivalent effects a: The spectrograms for both stimuli (“sad” is the upper 2 panels, “dad” is the lower 2) are shown with the “early” and “late” laser suppression windows overlaid in cyan. Approximate borders for the different components of each stimulus are indicated in the top panel. b: Performance in overall percent correct for each mouse for 10,000 total trials is represented by connected dots representing each of the 3 types of trials. Bars represent mean performance for each trial type across all 9 mice. The two laser suppression conditions, indicated by cyan bars, were timed to match either the “consonant” (early) or “vowel” (late) segment of the phoneme. Mice show similar effects of the laser regardless of its timing, shown by the general symmetry between early and late. c: Similar to Figure 1F, performance for each mouse was broken into “hit rate” (percent correct on “dad” trials) and “false alarm rate” (100 - percent correct on “sad” trials). Each mouse is represented with a large open circle corresponding to control trials, connected to early (black) and late (red) suppression conditions. If the effect of the laser is exactly the same between the two suppression windows, the two small circles would overlap.
!61
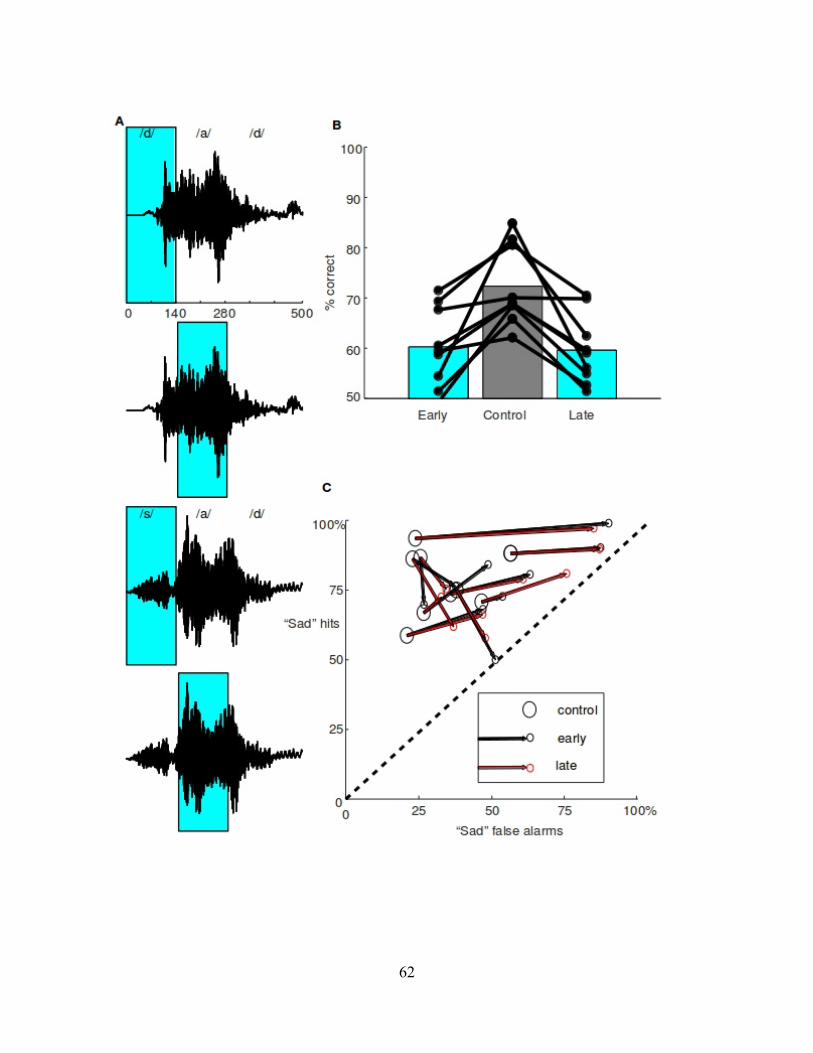
!62

task performance, we performed several control experiments on previously tested mice to
distinguish between potential effects of illumination as a visual cue and direct
optogenetic effects on the brain, though we did not have large enough sample sizes to
characterize or quantify these effects in detail. Because we randomly rewarded laser
trials, mice could potentially learn that the laser provides a visual cue that their response
is irrelevant. To address this possibility, we tested mice with the laser fiber disconnected
from the implanted ferrules and instead directed at the walls of the box, with illumination
randomly interleaved on 20% of trials. The resulting patterns of behavior support the idea
that the initial effects of brain illumination were due to optogenetic suppression of
auditory cortex, but also that mice can gradually learn to associate the visual laser cue
with task contingencies. For example, mouse 5982 (Fig. 3a) showed almost no difference
in performance between laser and control trials for approximately the first 3000 trials
during this “fiber disconnected” control condition, in which there is no direct optogenetic
effect of illumination. Over time, this mouse developed a strong side bias specifically on
laser trials while maintaining performance on control trials (red arrows in Fig. 3a). This is
consistent with the idea that after about 3000 trials, the mouse learned that the laser cue
indicated a random reward. A comparison of performance on laser trials between the first
3000 trials (75.0% correct) and the following 9000 trials (68.7%) shows a significant
difference using a two-tailed Fisher’s exact test (p=0.0027, effect size = 1.37). Mouse
5980, which had already developing a bias during the initial laser condition, was also
tested in the disconnected condition (data not shown). This mouse showed a transient
reversal in side bias when the laser was disconnected, but the bias then strengthened and
!63

stabilized over time, again suggesting that the mouse learned the association of visual cue
and randomly rewarded trials.
Normal Reward
We randomly rewarded laser trials to avoid the possibility that mice could learn a
new association between “laser + sound” stimuli and reward. To directly address whether
mice could learn new associations during suppression, and confirm the necessity of
randomly rewarding laser trials, we tested the impact of switching to normal rewards on
laser trials, which made up 20% of the total. Fibers remained connected to the implanted
ferrules for this experiment. When mice were switched from random to normal rewards,
their performance on laser trials gradually improved and eventually approached or
matched control trials. Importantly, this process took at least 10,000 trials. For example,
mouse 5916 gradually improved performance on both control and laser trials following
the reward switch, asymptotically converging at 80% correct on both types after ~15,000
trials. 3 other mice showed less conclusive effects, but trended toward better performance
or less bias following the switch to normally rewarded laser trials.
This gradual improvement in performance following a switch to normal rewards
occurred whether or not the fiber was connected to the implanted ferrule. Indeed,
switching to normal rewards could reverse the bias that had been learned during the
disconnected but randomly rewarded condition. For example, mouse 5982 (mentioned
above, Fig. 3a) developed a strong bias on randomly-rewarded laser trials with the fiber
disconnected. When this mouse was switched to normal rewards (with fibers still
!64

disconnected), this bias remained strong (~90%) for 12,000 trials but then gradually
diminished as the mouse learned to respond normally on laser trials. Comparison of the
proportion of rightward responses between the first 10,000 (88.6%) and remaining 32,000
(64.4%) trials showed a significant difference using a two-tailed Fisher’s exact test test
(p<0.0001, effect size = 4.31). We conclude that providing normal rewards on
optogenetic suppression trials can provide reinforcement that allows some mice to learn
how to correctly respond, perhaps by forming a new “laser + sound” stimulus-reward
association. This can occur with visual laser cues independently of optogenetic
suppression of the brain. These results suggest that in experiments testing the effects of
optogenetic manipulations on operant behavioral tasks, it is important to consider the
reward contingency on illumination trials. Nevertheless, because the learning of these
new contingencies took at least 10,000 trials, the effects of optogenetic manipulations can
be measured before new associations are learned, provided one is cautious about the
potential for such learning.
Discussion
Full Stimulus Suppression
The consistent effect of reduced performance during full stimulus suppression shows the
necessity of auditory cortex for phoneme discrimination. Without proper activity in AC
during the stimulus, the mouse is unable to determine which phoneme it is hearing, which
leads to several types of responses. Guessing randomly between the two sides and
!65

!
Figure 3: Mice show sensitivity to task parameters and can exhibit laser-related learning a: Mouse 5982 went through three different forms of the task: first with standard laser suppression, then with the fiber disconnected, then finally with fiber disconnected and normally rewarded laser trials. Performance is represented as overall percent correct averaged over (100) trials, using a sliding window to cover the entire course of behavior. Performance on control trials (black) remains consistent over time, but performance (blue) and bias (gray) on laser trials are sensitive to the specific task conditions. In standard suppression, there is a ~15% drop in performance on laser trials, but when the fiber is disconnected from the brain, there is an initial period of no effect of the laser. In this condition, the visual stimulus of the laser indicates random rewards and is a salient cue, leading to a bias strategy on laser trials that minimizes effort. This developed after several thousand trials, indicated by the red arrow. In the final segment, laser trials were rewarded normally, encouraging correct performance. Over time, laser performance became indistinguishable from control as the bias diminished, with green arrows indicating the approximate time of the major shift in performance. b: After initial testing showed a moderate effect of the standard laser suppression, mouse 5916 was tested with normally rewarded laser trials while the AC was still being suppressed. While the difference in performance during suppression was still present at the beginning of the new task structure, it was reduced over time, eventually leading to indistinguishable performance after 15k trials, showing that the mouse has learned to do the task even with AC suppression.
!66

developing a strong bias on laser trials both provide an equal expectation of reward, since
laser trials are rewarded randomly. One potential problem is the visual cue to the mouse
provided by the laser, which was reduced, but not necessarily eliminated by the use of a
masking strobe light. If the mouse associated the visual stimulus with a random reward, it
could show reduced performance on laser trials from an effect having nothing to do with
auditory cortex. We gained evidence through the unattached and normally rewarded
control experiments that the initial effect was in fact related to optogenetic effects in the
brain.
Multiple Suppression Windows
When activity was suppressed separately for the early (consonant) and late
(vowel) segments of the phoneme, the effect of the laser remained and was equal for both
epochs, suggesting that the two manipulations have a similar effect on the brain. Initially,
we hypothesized that since the consonants were different (d, s) while the vowels were the
same (ad) for the two phonemes, suppression during the early segment would have a
stronger effect. Additionally, prior work suggested the initial 40ms provided sufficient
information for discrmiination (Engineer et al., 2008). There are several reasons why
there was no difference, starting with the fact that since recorded human speech is the
stimulus, the exact structure of the vowel segments is not identical. In the current
experiment, both segments of the phoneme could provide information used for
discrimination. Future work could use synthetic stimuli, using the exact same vowel
segments for both stimuli, following separately recorded consonants. However, this
!67

would move farther from the natural structure of speech, since there is typically an effect
on the structure of a vowel based on its preceding consonant.
Another interpretation is that even if the mouse was using the consonant segment,
the information about the sound used to make a decision could still be in auditory cortex
during the vowel segment. If this was the case, suppressing activity during both periods
would impair performance, since the sound information would never reach downstream
areas, such as the striatum or motor cortex, that could initiate responses.
Laser-related Learning
There are tradeoffs between the possibilities of randomly or normally rewarding
laser trials, which we attempted to address. With randomly rewarded laser trials, a mouse
could learn to associate the cue of the laser with its response being irrelevant, leading to
spurious drops in performance. The alternative presents a different learning concern,
where reinforcement on laser trials could allow the mouse to form new stimulus-reward
associations. Even if the “sad” stimulus combined with suppression is perceived by the
mouse as different from the normal “sad” stimulus, it could use feedback from rewards to
learn essentially a new stimulus identity. Since this new stimulus would be associated
with the same response as the normal “sad”, it could conceal real effects of the laser. We
decided to use random rewards for the main suppression experiments to avoid this
possibility, which we observed to some degree in mice during additional testing. While
not all mice were able to bring laser trial performance up to control levels, this could be a
result of individual variation in learning strategies or the exact amount of suppression in
!68

AC. Mouse 5916 was able to reach indistinguishable performance between the two
conditions, showing that this is a real concern. Although it took 15k trials before
complete convergence of performance, the trend was developing within several thousand.
Additionally, the improvement over time on both control and laser trials in this condition
seen in mouse 5916 suggests that the reward type on laser trials may affect overall
behavior.
Random rewarding also presents potential problems if there is any way for the
mouse to perceive the laser, since it will provide a cue that the response is irrelevant. If
the mouse learns this association, it could be disincentivized to perform well on laser
trials independent of any impairment of AC activity. This could provide illusory
suppression effects that have nothing to do with optogenetic suppression. When the fiber
was disconnected but obviously visible to the mouse, we observed this effect occurring
within 5k trials in mouse 5982, even though there was no initial effect of the laser in this
condition.
Conclusions
Our results support prior work that has identified correlates of speech information
maintenance in AC (Engineer 2012, Pasley 2012), providing causal evidence that activity
in AC is necessary for phoneme discrimination. The complex spectrotemporal structure
of speech involves more advanced processing than relatively simple sounds, requiring the
cortical circuitry of AC for accurate perception.
!69

CHAPTER IV: CONCLUSION
Tone Discrimination Summary
In Chapter 2, I examined the relative effects on tone discrimination ability of
optogenetic suppression and electrolytic lesions. Optogenetic suppression time-locked to
the sound stimulus significantly reduced performance on laser trials, with an average
deficit of approximately 15% relative to control trials, while electrolytic lesions had no
effect on performance. Although there was variation in the exact extent of lesions in
auditory cortex, this was not correlated with the change in performance. Initial
experiments (Figures 1 and 2) using optogenetics and lesions had major differences in
their temporal structure, with optogenetic suppression trials interleaved within control
trials, while lesion analysis was restricted to comparing control trials before the lesion
and subsequent post-lesion data. To bridge the gap between these paradigms, I modified
the optogenetic experiment structure (Figure 3) by extending suppression to 20 and then
200 trial cycles. In both cycle durations, mice showed a major performance deficit at the
beginning of each cycle, with partial subsequent recovery that still remained below
control cycle performance. Since there was no way to modify the electrolytic lesion
protocol to make it more similar to optogenetics, my final experiment for this chapter
(Figure 4) further extended the optogenetic suppression window to 4 hours to match the
post-lesion recovery time and provide the most equivalent comparison possible.
Comparing performance before and after the extended suppression showed a significant
deficit, leading to the conclusion that optogenetic suppression and conventional lesions
have fundamentally different effects on the brain.
!70
Phoneme Discrimination Summary
In Chapter 3, I examined the effects of optogenetic suppression on phoneme
discrimination and characterized long-term effects of laser-related learning. I observed
that behavioral performance decreased when auditory cortex was shut down. This effect
was present in 3 different suppression time windows: full stimulus, “consonant”, and
“vowel” (Figures 1 and 2) and in many cases came in the form of bias toward one side/
response. In addition to the short-term effects of suppression, mice also showed laser-
related learning on longer timescales, depending on how trials were rewarded. I tested
whether mice could associate the laser with randomly rewarded trials by disconnecting
the fiber from their brain and instead leaving it attached to the box where it was clearly
visible. In this condition, I observed that mice could learn that their responses on laser
trials were irrelevant and stopped attempting to correctly answer on those trials, instead
developing a severe bias and showing the importance of minimizing the visibility of the
laser during normal experiments. I also tested whether normally rewarding laser trials
could allow mice to learn to discriminate between the stimuli even when activity was
suppressed. Essentially, I tested whether mice could learn two additional stimuli: “sad”
plus laser and “dad” plus laser, and observed that it was possible for some mice, though it
took 15,000 or more trials, corresponding to over a month of training. This showed that
analysis of optogenetic suppression data should be restricted to early phases of data
collection to minimize the chance of confounding effects from laser-related learning.
Remaining Questions for Future Research
!71

While the results presented in this dissertation provide valuable information about
the role of auditory cortex in sound perception and discrimination, there are many
remaining questions. What compensatory mechanisms are recruited following lesions that
remain inactive during optogenetic suppression, and how are they activated? Could
alternative stimuli or different timing windows lead to a difference in phoneme
discrimination ability that was not present with the 140ms early/late split used in my
study? For constant, simple stimuli such as the pure tones used here, what is the
relationship between the timing of optogenetic suppression relative to the stimulus and
induced deficits in performance? What are the specific task parameters influencing laser-
related learning observed in Chapter 3?
Lesions versus Optogenetic Suppression
The combined results of tone discrimination suggest a fundamental difference in
the adaptation process following permanent damage or optogenetic suppression. This fits
with recent work in several fields, where optogenetic suppression has revealed a role for
activity that was obscured by conflicting lesion results (Goshen et al., 2011; Kumar et al.,
2013; Otchy et al., 2015; Hong et al., 2018). Electrolytic damage led to rapid and full
recovery of behavioral performance, but it is unclear why that was the case. To learn
more about what is different in the case of optogenetic suppression, the first step would
be to identify the compensatory circuits recruited following lesion damage.
Phoneme Suppression Timing
!72

The relation of suppression timing to sound contents is still poorly understood, as
the experiments targeting either the “consonant” or “vowel” component of “sad” and
“dad” aren’t fully conclusive. Although prior studies have found sufficient information in
cortical responses to the earliest parts of phoneme stimuli (Engineer 2008, Centanni
2013), my results showed no difference based on suppression timing. This could be a
result of both segments providing relevant information, as due to coarticulation (Ohala
1993), the “ad” components of the two stimuli were not identical and could potentially be
sufficient for successful discrimination. Although it would result in stimuli farther from
natural speech, one possible experiment to clarify this would involve creating modified
chimeric stimuli by copying the “vowel” segment from one recorded stimulus and
combining it with the “consonant” segment from another. In this case, the stimuli would
only differ in the initial segment, so results showing a greater deficit from targeting the
initial segment would suggest that information content is related to the necessity of
activity. If instead the results still show equivalent effects of suppression during both
segments, interpretation could be difficult. Sustained activity in auditory cortex following
the differing “consonant” segments could be required for successful discrimination by
facilitating information transfer to downstream areas in the decision making process. If
this was the case, suppression during either segment would reduce the information
available to areas such as frontal cortex or the striatum.
Pure Tone Suppression Timing
!73

This relationship between suppression timing and behavioral deficits could also
be tested using other sound stimuli, such as pure tones. In chapter 2, we only tested
suppression over the entire stimulus, but it is possible that the timing could be relevant. If
the effects of suppression are only dependent on the information contained within the
stimulus, specific timing of suppression during a pure tone should not make a difference,
since the sound is constant throughout its duration. Alternatively, if sustained activity is
required for transfer of information to downstream areas, it would be possible to identify
the precise timing by suppressing activity during the end of the stimulus. Increasing the
length of suppression until a deficit is present would indicate the duration of sustained
normal activity required for successful discrimination, although this could vary
depending on the exact stimulus.
Laser-related Learning
In chapter 3, I examined some potential problems with optogenetic experiments
by manipulating laser placement and rewards on laser trials. I observed that mice could
learn to associate the light of the laser with random rewards or adapt to suppression by
learning via normal rewards on laser trials. This data was anecdotal, however, and came
from mice that had prior exposure to suppression in the paradigms of Figures 1 and 2. A
focused study on laser-related learning could improve characterization of these two
processes. I used either a 10% or 20% proportion of laser trials, but it is likely that this
factor influences the development of learning effects. There is a tradeoff between
collection of sufficient laser trial data and potential learning that the laser is associated
!74

with random rewards, but it would be valuable to investigate this in detail. I would
hypothesize that at some low proportion of laser trials, this type of learning is extremely
unlikely, while a proportion that is too high would lead to many mice adjusting their
behavior to “give up” on laser trials. Increasing knowledge about this tradeoff would
allow researchers to be more informed as they design experiments to balance speed of
data collection and potential confounds. Similarly, a higher proportion of laser trials
could increase the speed of adaptation to the laser under normal reward conditions.
Visibility of the laser is also likely to be a key factor in the case of associating the
laser and random rewards. I attempted to minimize visibility during normal suppression
experiments and then dramatically increased it when the fiber was disconnected, but
intermediate testing could be valuable. Using a laser of different wavelength that has
minimal ability to activate the optogenetic protein would more closely replicate
conditions during standard suppression experiments. Equivalently, mice without
optogenetic protein expression could be tested with the same implants and laser
parameters as transgenic subjects. In chapter 2, I briefly tested wildtype mice in this
condition, but did not attempt to characterize long-term effects. From my experiments, it
is not totally clear whether normal or random rewards on laser trials is the superior
strategy, as normal rewards could obscure real effects of suppression and random rewards
could generate illusory effects. I limited analysis to the first 10,000 trials to minimize
these confounds based on my observations, but detailed study of these learning processes
would improve the design of future experiments.
!75
What Have We Learned?
This dissertation has several key conclusions. First, activity in auditory cortex
contributes to maximal pure tone discrimination ability, as revealed by optogenetic
suppression experiments. Based on these experiments, optogenetic suppression and
electrolytic lesions have fundamentally different effects on the brain, even with the most
analogous task parameters. Additionally, optogenetic suppression revealed a similar
contribution of auditory cortex activity to phoneme discrimination for the full stimulus as
well as during only the early and late segments. Finally, mice can learn laser-based
associations when tested for extended periods of time.
!76

REFERENCES CITED
CHAPTER I
Centanni TM, Engineer CT, Kilgard MP. (2013) Cortical speech-evoked response patterns in multiple auditory fields are correlated with behavioral discrimination ability. Journal of Neurophysiology, 110, 177-189. PMCID:PMC3727033
Engineer CT, Perez CA, Chen YH, Carraway RS, Reed AC, Shetake JA, Jakkamsetti V, Chang KQ, Kilgard MP. (2008) Cortical activity patterns predict speech discrimination ability. Nature Neuroscience, 11, 603-608. PMCID:PMC2951886
Gimenez TL, Lorenc M, Jaramillo S (2015) Adaptive categorization of sound frequency does not require the auditory cortex in rats. J Neurophysiol 114:1137–1145.
Helfer, K. S., & Freyman, R. L. (2008). Aging and speech-on-speech masking. Ear and hearing, 29(1), 87–98. doi:10.1097/AUD.0b013e31815d638b
Moore A, Wehr M. (2014) A guide to in vivo single-unit recording from optogenetically identified cortical inhibitory interneurons. J. Vis. Exp. 93, e51757
Ohl F.W., Wetzel W., Wagner T., Rech A., Scheich, H. (1999). Bilateral ablation of auditory cortex in Mongolian gerbil affects discrimination of frequency modulated tones but not of pure tones. Learning & Memory (Cold Spring Harbor, N.Y.). 6: 347-62.
Porter BA, Rosenthal TR, Ranasinghe KG, Kilgard MP (2011). Discrimination of brief speech sounds is impaired in rats with auditory cortex lesions, Behavioural Brain Research, 219:68-74.
Sakata, S., & Harris, K. D. (2009). Laminar structure of spontaneous and sensory-evoked population activity in auditory cortex. Neuron, 64(3), 404–418. doi:10.1016/j.neu- ron.2009.09.020 Saunders J. and Wehr M. (2019) Mice can learn phonetic categories. J Acoust Soc Am March 145 (3). doi.org/10.1121/1.5091776
Stosiek C., Garaschuk O., Holthoff K., Konnerth A. (2003) In vivo two-photon calcium imaging of neuronal networks. Proceedings of the National Academy of Sciences. 100 (12) 7319-7324; DOI:10.1073/pnas.1232232100
Talwar SK, Musial PG, Gerstein GL (2001) Role of mammalian auditory cortex in the perception of elementary sound properties. J Neurophysiol 85:2350–2358.
!77

Weible A, Moore A, Liu C, deBlander L, Wu H, Kentros C, Wehr M. (2014) Perceptual Gap Detection is Mediated by Gap Termination Responses in Auditory Cortex. Curr. Bio.24(13):1447-55
CHAPTER II
Aizenberg M, Mwilambwe-Tshilobo L, Briguglio JJ, Natan RG, Geffen MN (2015) Bidirectional Regulation of Innate and Learned Behaviors That Rely on Frequency Discrimination by Cortical Inhibitory Neurons. PLoS Biol 13:e1002308.
Briguglio JJ, Aizenberg M, Balasubramanian V, Geffen MN (2018) Cortical Neural Activity Predicts Sensory Acuity Under Optogenetic Manipulation. J Neurosci 38:2094–2105.
Buser PA, Imbert M (1992) Audition. MIT Press. Butler RA, Diamond IT, Neff WD (1957) Role of auditory cortex in discrimination of changes in frequency. J Neurophysiol 20:108–120.
Cardin JA, Carlén M, Meletis K, Knoblich U, Zhang F, Deisseroth K, Tsai L-H, Moore CI (2009) Driving fast-spiking cells induces gamma rhythm and controls sensory responses. Nature 459:663–667.
Gimenez TL, Lorenc M, Jaramillo S (2015) Adaptive categorization of sound frequency does not require the auditory cortex in rats. J Neurophysiol 114:1137–1145.
Goldberg JM, Neff WD (1961) Frequency discrimination after bilateral ablation of cortical auditory areas. J Neurophysiol 24:119–128.
Goshen I, Brodsky M, Prakash R, Wallace J, Gradinaru V, Ramakrishnan C, Deisseroth K (2011) Dynamics of retrieval strategies for remote memories. Cell 147:678–689.
Heffner HE, Heffner RS (1986) Hearing loss in Japanese macaques following bilateral auditory cortex lesions. J Neurophysiol 55:256–271.
Heffner HE, Heffner RS (1990) Effect of bilateral auditory cortex lesions on absolute thresholds in Japanese macaques. J Neurophysiol 64:191–205.
Hong YK, Lacefield CO, Rodgers CC, Bruno RM (2018) Sensation, movement and learning in the absence of barrel cortex. Nature 561:542–546.
!78

Kelly JB (1970) The effects of lateral lemniscal and neocortical lesions on auditory absolute thresholds and frequency difference thresholds of the rat. Diss Abstr Int 31:1566–1567.
Kuchibhotla K, Bathellier B (2018) Neural encoding of sensory and behavioral complexity in the auditory cortex. Curr Opin Neurobiol 52:65–71.
Kumar A, Vlachos I, Aertsen A, Boucsein C (2013) Challenges of understanding brain function by selective modulation of neuronal subpopulations. Trends Neurosci 36:579–586.
Meier P, Flister E, Reinagel P (2011) Collinear features impair visual detection by rats. J Vis 11 74 Available at: http://dx.doi.org/10.1167/11.3.22.
Meyer DR, Woolsey CN (1952) Effects of localized cortical destruction on auditory discriminative conditioning in cat. J Neurophysiol 15:149–162.
Moore AK, Wehr M (2013) Parvalbumin-expressing inhibitory interneurons in auditory cortex are well-tuned for frequency. J Neurosci 33:13713–13723.
Neff WD, Diamond IT, Casseday JH (1975) Behavioral Studies of Auditory Discrimination: Central Nervous System. In: Auditory System: Physiology (CNS)· Behavioral Studies Psychoacoustics (Abeles M, Bredberg G, Butler RA, Casseday JH, Desmedt JE, Diamond IT, Erulkar SD, Evans EF, Goldberg JM, Goldstein MH, Green DM, Hunter-Duvar IM, Jeffress LA, Neff WD, Yost WA, Zwicker E, Keidel WD, Neff WD, eds), pp 307–400. Berlin, Heidelberg: Springer Berlin Heidelberg.
Ohl FW, Wetzel W, Wagner T, Rech A, Scheich H (1999) Bilateral ablation of auditory cortex in Mongolian gerbil affects discrimination of frequency modulated tones but not of pure tones. Learn Mem 6:347–362.
Otchy TM, Wolff SBE, Rhee JY, Pehlevan C, Kawai R, Kempf A, Gobes SMH, Ölveczky BP (2015) Acute off-target effects of neural circuit manipulations. Nature 528:358–363.
Paxinos G, Franklin KBJ (2019) Paxinos and Franklin’s the Mouse Brain in Stereotaxic Coordinates. Academic Press.
Porter BA, Rosenthal TR, Ranasinghe KG, Kilgard MP (2011) Discrimination of brief speech sounds is impaired in rats with auditory cortex lesions. Behav Brain Res 219:68–74.
!79
Redish DA (2008) MClust Spike Sorting Toolbox.
Rybalko N, Suta D, Nwabueze-Ogbo F, Syka J (2006) Effect of auditory cortex lesions on the discrimination of frequency-modulated tones in rats. Eur J Neurosci 23:1614– 1622.
Scholl B, Wehr M (2008) Disruption of balanced cortical excitation and inhibition by acoustic trauma. J Neurophysiol 100:646–656.
Sellick PM (1983) An Introduction to the Physiology of Hearing. By J. O.Pickles.Pp. 341. (Academic Press, London, 1982.) £16.00, 33.00 Hardback. £6.95, 14.50 Paperback. Q J Exp Physiol 68:750–750.
Siegle JH, López AC, Patel YA, Abramov K, Ohayon S, Voigts J (2017) Open Ephys: an open-source, plugin-based platform for multichannel electrophysiology. J Neural Eng 14:045003.
Smith KS, Graybiel AM (2013) A dual operator view of habitual behavior reflecting cortical and striatal dynamics. Neuron 79:361–374.
Talwar SK, Musial PG, Gerstein GL (2001) Role of mammalian auditory cortex in the perception of elementary sound properties. J Neurophysiol 85:2350–2358.
Thompson RF (1960) Function of auditory cortex of cat in frequency discrimination. J Neurophysiol 23:321–334.
Weible AP, Liu C, Niell CM, Wehr M (2014) Auditory cortex is required for fear potentiation of gap detection. J Neurosci 34:15437–15445.
CHAPTER III
Centanni, T. M., Engineer, C. T., and Kilgard, M. P. (2013). Cortical speech-evoked response patterns in multiple auditory fields are correlated with behavioral discrimination ability. Journal of Neurophysiology 110, 177–189. doi:10.1152/jn. 00092.2013.
Centanni, T. M., Sloan, A. M., Reed, A. C., Engineer, C. T., Rennaker, R. L., 2nd, and Kilgard, M. P. (2014). Detection and identification of speech sounds using cortical activity patterns. Neuroscience 258, 292–306.
!80

Chang, E. F., Rieger, J. W., Johnson, K., Berger, M. S., Barbaro, N. M., and Knight, R. T. (2010). Categorical speech representation in human superior temporal gyrus. Nat. Neurosci. 13, 1428–1432.
Cranford, J. L., Igarashi, M., and Stramler, J. H. (1976). Effect of auditory neocortex ablation on pitch perception in the cat. J. Neurophysiol. 39, 143–152.
DeisserothLab Predicted irradiance values: model based on direct measurements in mammalian brain tissue. Brain tissue light transmission calculator. Available at: https://web.stanford.edu/group/dlab/cgi-bin/graph/chart.php [Accessed September 1, 2019].
Engineer, C. T., Centanni, T. M., and Kilgard, M. P. (2016). Rodent Models of Speech Sound Processing. Neurobiology of Language, 829–838. doi:10.1016/b978-0-12- 407794-2.00066-3.
Engineer, C. T., Perez, C. A., Chen, Y. H., Carraway, R. S., Reed, A. C., Shetake, J. A., et al. (2008). Cortical activity patterns predict speech discrimination ability. Nat. Neurosci. 11, 603–608.
Flinker, A., Chang, E. F., Barbaro, N. M., Berger, M. S., and Knight, R. T. (2011). Sub-centimeter language organization in the human temporal lobe. Brain Lang. 117, 103–109.
Floody, O. R., Ouda, L., Porter, B. A., and Kilgard, M. P. (2010). Effects of damage to auditory cortex on the discrimination of speech sounds by rats. Physiology & Behavior 101, 260–268. doi:10.1016/j.physbeh.2010.05.009.
Green, D. M., and Swets, J. A. (1966). Signal detection theory and psychophysics. Wiley New York.
Johnson, K. L., Nicol, T. G., and Kraus, N. (2005). Brain stem response to speech: a biological marker of auditory processing. Ear Hear. 26, 424–434.
Kilgard, M. P., and Engineer, C. T. (2015). Neural Coding of Speech Sounds. Encyclopedia of Computational Neuroscience, 1–4. doi:10.1007/978-1-4614-7320-6_433-2.
Liebenthal, E., Binder, J. R., Spitzer, S. M., Possing, E. T., and Medler, D. A. (2005). Neural Substrates of Phonemic Perception. Cerebral Cortex 15, 1621–1631. doi:10.1093/cercor/bhi040.
!81

Meier, P., Flister, E., and Reinagel, P. (2011). Collinear features impair visual detection by rats. J. Vis. 11. doi:10.1167/11.3.22.
Moore, A. K., and Wehr, M. (2013). Parvalbumin-expressing inhibitory interneurons in auditory cortex are well-tuned for frequency. J. Neurosci. 33, 13713–13723.
Ohl, F. W., Wetzel, W., Wagner, T., Rech, A., and Scheich, H. (1999). Bilateral ablation of auditory cortex in Mongolian gerbil affects discrimination of frequency modulated tones but not of pure tones. Learn. Mem. 6, 347–362.
Pasley, B. N., David, S. V., Mesgarani, N., Flinker, A., Shamma, S. A., Crone, N. E., et al. (2012). Reconstructing speech from human auditory cortex. PLoS Biol. 10, e1001251.
Perez, C. A., Engineer, C. T., Jakkamsetti, V., Carraway, R. S., Perry, M. S., and Kilgard, M. P. (2013). Different timescales for the neural coding of consonant and vowel sounds. Cereb. Cortex 23, 670–683.
Porter, B. A., Rosenthal, T. R., Ranasinghe, K. G., and Kilgard, M. P. (2011). Discrimination of brief speech sounds is impaired in rats with auditory cortex lesions. Behav. Brain Res. 219, 68–74.
Redish, D. A. (2008). MClust Spike Sorting Toolbox.
Saunders, J. L., and Wehr, M. (2019). Mice can learn phonetic categories. J. Acoust. Soc. Am. 145, 1168.
Schnupp, J. W. H., Hall, T. M., Kokelaar, R. F., and Ahmed, B. (2006). Plasticity of temporal pattern codes for vocalization stimuli in primary auditory cortex. J. Neurosci. 26, 4785–4795.
Shetake, J. A., Wolf, J. T., Cheung, R. J., Engineer, C. T., Ram, S. K., and Kilgard, M. P. (2011). Cortical activity patterns predict robust speech discrimination ability in noise. Eur. J. Neurosci. 34, 1823–1838.
Siegle, J. H., López, A. C., Patel, Y. A., Abramov, K., Ohayon, S., and Voigts, J. (2017). Open Ephys: an open-source, plugin-based platform for multichannel electrophysiology. J. Neural Eng. 14, 045003.
Tsunada, J., Lee, J. H., and Cohen, Y. E. (2011). Representation of speech categories in the primate auditory cortex. J. Neurophysiol. 105, 2634–2646.
!82

Weible, A. P., Liu, C., Niell, C. M., and Wehr, M. (2014). Auditory cortex is required for fear potentiation of gap detection. J. Neurosci. 34, 15437–15445.
CHAPTER IV
Centanni TM, Engineer CT, Kilgard MP. (2013) Cortical speech-evoked response patterns in multiple auditory fields are correlated with behavioral discrimination ability. Journal of Neurophysiology, 110, 177-189. PMCID:PMC3727033
Engineer CT, Perez CA, Chen YH, Carraway RS, Reed AC, Shetake JA, Jakkamsetti V, Chang KQ, Kilgard MP. (2008) Cortical activity patterns predict speech discrimination ability. Nature Neuroscience, 11, 603-608. PMCID:PMC2951886
Goshen I, Brodsky M, Prakash R, Wallace J, Gradinaru V, Ramakrishnan C, Deisseroth K (2011) Dynamics of retrieval strategies for remote memories. Cell 147:678–689.
Hong YK, Lacefield CO, Rodgers CC, Bruno RM (2018) Sensation, movement and learning in the absence of barrel cortex. Nature 561:542–546.
Kumar A, Vlachos I, Aertsen A, Boucsein C (2013) Challenges of understanding brain function by selective modulation of neuronal subpopulations. Trends Neurosci 36:579–586.
Ohala, John J. (1993). Coarticulation and phonology. Language and Speech, vol. 36, 2-3: pp. 155-170.
Otchy TM, Wolff SBE, Rhee JY, Pehlevan C, Kawai R, Kempf A, Gobes SMH, Ölveczky BP (2015) Acute off-target effects of neural circuit manipulations. Nature 528:358–363.
!83