a discussion on the biology of an equatorial lake: lake george, uganda || ecological stability in a...
TRANSCRIPT

Ecological Stability in a Shallow Equatorial Lake (Lake George, Uganda)Author(s): G. G. Ganf and A. B. VinerSource: Proceedings of the Royal Society of London. Series B, Biological Sciences, Vol. 184, No.1076, A Discussion on the Biology of an Equatorial Lake: Lake George, Uganda (Dec. 8, 1973),pp. 321-346Published by: The Royal SocietyStable URL: http://www.jstor.org/stable/76178 .
Accessed: 08/05/2014 07:21
Your use of the JSTOR archive indicates your acceptance of the Terms & Conditions of Use, available at .http://www.jstor.org/page/info/about/policies/terms.jsp
.JSTOR is a not-for-profit service that helps scholars, researchers, and students discover, use, and build upon a wide range ofcontent in a trusted digital archive. We use information technology and tools to increase productivity and facilitate new formsof scholarship. For more information about JSTOR, please contact [email protected].
.
The Royal Society is collaborating with JSTOR to digitize, preserve and extend access to Proceedings of theRoyal Society of London. Series B, Biological Sciences.
http://www.jstor.org
This content downloaded from 169.229.32.137 on Thu, 8 May 2014 07:21:28 AMAll use subject to JSTOR Terms and Conditions
Proc. R. Soc. Lond. B. 184, 321-346 (1973)
Printed in Great Britain
Ecological stability in a shallow equatorial lake (Lake George, Uganda)
BY G. G. GANFt AND A. B. VINER:
t Limnologische Lehrkanzel der Universitit Wien, 18/19 Berygasse, A10901, Wien IX, Austria
I School of Biological Sciences, University of Malaya, Kuala Lumpur, Malaysia
The ecological stability of Lake George is illustrated by the relatively small biomass fluctua- tions that occur in the fauna and flora of the lake. For the phytoplankton it is shown that the gradient of these oscillations is within the range depicted by a specific rate of population in- crease of + 0.05 to - 0.05 day-'. The relative stability of the phytoplankton community is discussed in the terms of a mathematical model (Talling 1957, 1971) which interrelates the variables, photosynthesis, respiration, biomass and the underwater light climate. Examples of the interrelationship, and the extreme susceptibility of either a positive or a negative in- crease rate to diurnal environmental changes, are drawn from both long and short term measurements in Lake George. The optical characteristics of the water column are shown to be very dependent upon the mixing regime sustained over the previous 24 h. The occurrence of negative or positive increase rates is dependent not only upon the incident radiation but also upon the wind induced turbulence. It is shown that, given measurements of the rates of photosynthesis and respiration and the other variables included in Talling's model, the biomass at which the Lake George phytoplankton will stabilize is predictable.
Although light is likely to limit photosynthesis under all circumstances in Lake George, it is demonstrated that a more favourable photosynthetic response to the light climate may be induced by nutrient enrichment of the nutrient-poor phytoplankton. Because nutri- ent enrichment can induce increased photosynthetic capacity values, the rates of nutrient supply are thought to be major factors in controlling the ecological stability of the phyto- plankton. The mixing regime of the lake is of paramount importance in the decomposition of the sediments and the rate of nutrient release from them. The importance of the nutrient recycling via zooplankton excretion is compared with the total input of nitrogen and phosphorus to the lake. That the ecological stability of the lake is a delicately balanced equilibrium between climate and biota is illustrated by calculations on the oxygen budget of the water column, and by the occurrence of fish-kills. The general characteristics of the lake are discussed in the context of the problems associated with eutrophication.
INTRODUCTION
The impression gained of Lake George from the preceding papers in this volume (Viner & Smith; Burgis et al.) is that the climate shows little seasonal change and the population densities remain fairly constant from one day to the next. The relative stability of the population densities is illustrated graphically by figures 1 to 3. The first figure illustrates the seasonal change of the total crustacean zoo- plankton biomass expressed as mg dry weight m-2. Also plotted are the biomass values for the dominant zooplankter, Thermocyclops hyalinus (Burgis 1971). At no time does the biomass show fluctuations greater than twofold (Burgis I97I). This is in sharp contrast to the annual fluctuations found in temperate water bodies (e.g. Loch Leven: Burgis & Walker 1972; Queen Mary Reservoir: Steel, Duncan & Andrew 1972) where over-wintering population densities are very low but where the summer maxima may reach 10 g (d.w.) m-2. Figure 2 illustrates a similar degree
[ 321 ]
This content downloaded from 169.229.32.137 on Thu, 8 May 2014 07:21:28 AMAll use subject to JSTOR Terms and Conditions

322 G. G. Ganf and A. B. Viner (Discussion Meeting)
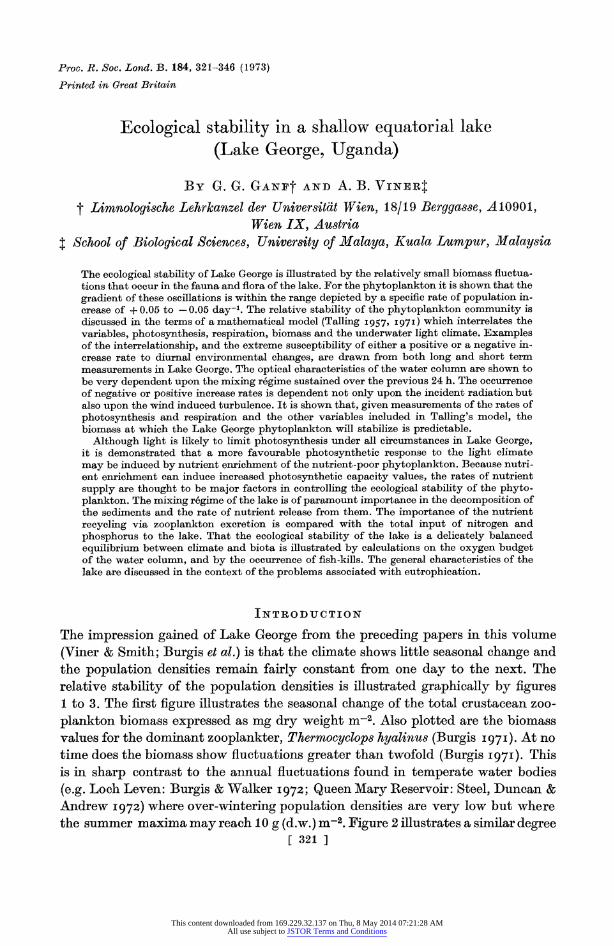
of seasonal stability for the zoobenthos (J. P. E. C. Darlington, in preparation), there is no evidence for either very high or very low population densities. Figure 3 shows the seasonal biomass of phytoplankton as indicated by either chlorophyll a or carbon. The points represent the mean value of the phytoplankton concentration from twenty sites representative of the lake and weighted for depth and area. Again
0
1 :000 _
500
500
bQ
100Q I . IJ A M J J A S 0 N D J F
month
FIGuRE 1. Seasonal variation of the total Crustacea (o--o) and Therrnocyclops hyalinus (, ) biomass, from Burgis (I97I).
2_
0.5_
o 0.2_
0.1
Feb. Mar. Apl May June nmonth
FIGURE 2. Seasonal variation (wet to dry) of the total zoobenthos biomass. Each point is the calculated average of six samples from each of four sites (J. P. E. C. Darlington, unpublished).
the conclusion drawn is that the phytoplankton biomass does not show any marked seasonal change. These data, from both the fauna and the flora of Lake George, illustrate what is meanit by ecological stability. Such a seasonal pattern is easy to reconcile with the climatic stability of Lake George as discussed previously by Viner & Smith (this volume).
The purpose of this paper is to examine and interrelate those factors that deter- mine the apparent ecological stability of Lake George. To explain, for instance, why the phytoplankton "biomass should stabilize at ca. 30 g C m-2 and not at
This content downloaded from 169.229.32.137 on Thu, 8 May 2014 07:21:28 AMAll use subject to JSTOR Terms and Conditions
Ecolowical stabtility 323
10 or 60 g in-2. Furthermore, given the aninual stability of the Lake George climate, to explain why there are small oscillations of the biomass about the annual mean. For the phytoplankton we hope to show that it is a critical combination of factors, biological, physical and chemical, that ultimately determines the stability of the community.
Since the phytoplankton form ca. 9500 of the total Lake George biomass (Burgis et al., this volume), we have tended to concentrate upon those stability miiechanisms operating upon the phytoplankton.
1000
cqUO 09. l , ,
0 ~~~~~~~~~~~~~48 1'
500 0 0 -~~~~' b0 40
500 / v, 0\0' \ _ 0 X-.% 0i' 320
'O~~~~~~~~~~~~~~~~~~~~~~~~~~~ 0.32a
0 0~~~~~~~ ~ ~ ~ ~0.149 - 2 16
100 100 0.064
I~~~ 50A J +
-.~~~~~~~~~~~~~~~~~~~~~~.3
010~~~~~~~~~~~~~~~~~~~
0
0
I I I I ~~~~~~~~~~~~~~~~~~~~~~0.032
A M J J A s 0 N D J F M month
FIG-uE 3. Seasonial variationi of the phytoplankton biomass (o---o); samnpling frequency 10 days April to February, reduced to 2 days February-March. Each point represents the mean of twenty sites weighted for both depth and area. Biomass given as either chlorophyll a or carbon. The specific community inerease rate per day was calculated from the changes of biomass from one sampling time to the next and is plotted on the lower scale ( *).
LONG-TERM OSCILLATION S OF BIOMASS
A prerequisite of any stable community is that the gains to that system balance the losses. Uhlmnann (1971) expressed the gains, losses and resultant rate of change of biomass (x) by the expression
gains losses dx/dt ,atx + Ix - (Gx + Sx + Ex)
growth iniport grazing sedimnentationi export
21 Vol. I84. B.
This content downloaded from 169.229.32.137 on Thu, 8 May 2014 07:21:28 AMAll use subject to JSTOR Terms and Conditions

324 G. G. (Ganf and A. 13. Viner (Discussion Meeting)
where It, 1i, G, and E are specific rate coefficients of growth, imnport, grazing, sedimentation and export, respectivelv.
In Lake George the imnport of living organic material may be neglected. Hence the biomass of Lake George will increase when
A-(G+S+E) > o
and will decrease when Ia-(GC+S+E) < 0.
The observed changes of phytoplanikton lbioinass will reflect the overall value for the combined influence that grazing, sedimentation and export have upon growth. Since we are unable to give specific values to each of these terms the symbol ,u' will be used to represent ,u as modified by grazing, export and sedimentation. As such It' is a measure of the specific rate of community increase per day.
From empirical observation of the fluctuations of phytoplankton biomzass illustrated in figure 3, a rough estimate for the range of ji' maay be given. The values of this quantity (figure 3) fluctuate around zero, which indicates no net gain to the community. At a sampling interval of 1O days (April to February) the value for ,a' ranges between + 0.05 to - 0.03 day-1.
During the period February to March the samplilng interval was reduced to 2 days over a period of 3 weeks. The specific rate of community increase per day during this period showed the same range of oscillation around the zero value as occurred during April to February. Hence the empirical value for /a' lies between. the value + 0.05 and -0.03 day-1. Figure 3 illustrates that the mean phytoplankton biomass approximates to 30 g C m-2. Given this value and a range of values for t,' we may predict the changes in biomass that would occur if various values of A' withini the range observed were sustained over an extended period. The phyto- plankton biomass at time 1, xt, is obtained from the equation
xt = xo exp (,t't)
where xo represents the biomass at zero time and is equivalent to 30 g C m2. Figure 4 presents a series of curves for different values of ,u' within the limits + 0.05 and - 0.05 day-1. For a value of zero there is no niet change of biomass. If a value of + 0.05 day-1 were to be sustailled for a period of 14 days the biomass would double. Conversely, with a value of - 0.02 day-1 the biomass would be half its original value within 35 days. It is evident from figure 3, however, that the maximum and minimum values for the phytoplankton biomass are betweeni 20 and 40 g C m-2. Thus, unless the maximum biomass value recorded is to be superseded, a value of a' equal to + 0.05 day-1 may be sustained for no longer than 7 days. Also a It' value of - 0.02 day-l may be sustained for a period not longer than 21 days if the minimum biomass observed is not to be reduced to a lower value.
This type of data manipulation allows us to predict the maximum time periods within which an oscillation must reverse for given values of ,a' so that the ecological stability of Lake George may be sustained. Since the fluctuations of the empirical
This content downloaded from 169.229.32.137 on Thu, 8 May 2014 07:21:28 AMAll use subject to JSTOR Terms and Conditions

Ecological stability 325
values of Iu' are similar for a sampling interval of both 10 and 2 days, and the time intervals for the oscillations of ,a' are less than the time intervals bet-ween seasonal changes from wet to dry seasons (Viner & Smith, this volume), we may conclude that short time variations are more influential upon the ecological stability of Lake George than is any seasonal trend.
+0.05 +0.02
72_
_ / / /+~~~~~~~~~~~~~0.01
48 - ~ ~ ~ ~ ~ 8-400 24 - X<
O 24 48 72
t/days FTOURE 4. Theoretical growth and decline curves for an initial biomass of 30 g C m-2 and a
range of It' from + 0.05 to -0.05. Calculated from the equation x x0 exp (It' t) where x is the final biomass, xo the initial biomass and It' the growth rate as modified by grazing, export, and sedimentation, t is time in days.
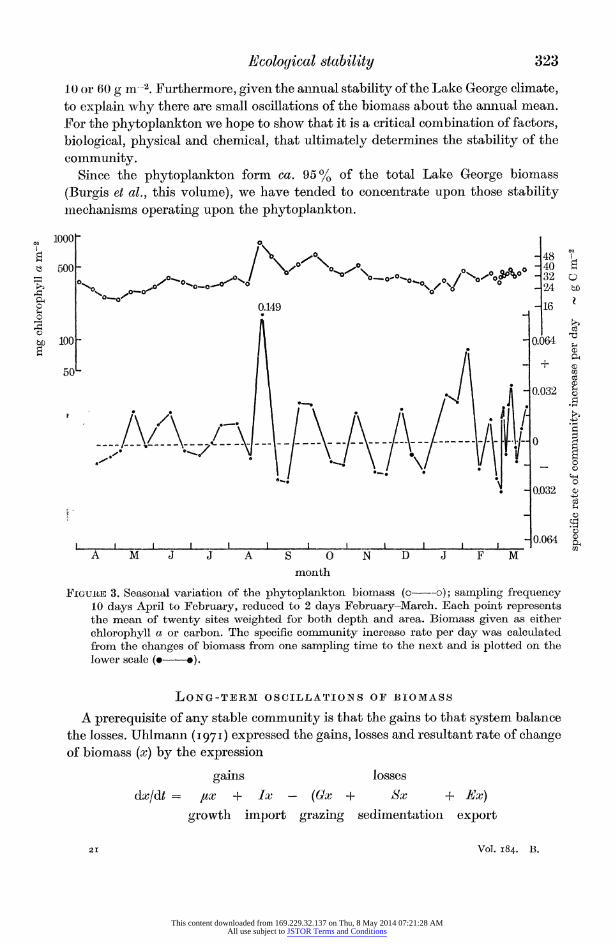
DIURNAL OSCILLATIONS OF BIOMASS
The daily net change of biomass within the water column may be examined by reducing the sampling interval to eight 3 h periods within the 24 h. Thus, by measuring the gains and losses of carbon at different depths within the water column at a single mid-lake station over 24 h, we can estimate the specific increase rate of the phytoplankton community over the day. On two occasions the net change of carbon was measured directly, using the method of Ganf & Milburn (1971). On fifteen other occasions the diurnal balance was estimated by extra- polation from gas exchange measurements.
In figure 5 the specific rate of the community increase during each of the eight experimental periods is plotted against time. On the first occasion the initial bio- mass was 37.3 g C m-2 and the total solar radiation input to the lake was 2029 J
This content downloaded from 169.229.32.137 on Thu, 8 May 2014 07:21:28 AMAll use subject to JSTOR Terms and Conditions
326 G. G. Ganf and A. B. Viner (Discussion Meeting)
cM-2 day-]. At 07.00 h (dawn) the increase rate was assumed to be zero since photosynthesis was zero. As the incident solar radiation input increased the rate of photosynthesis increased, resulting in a net gain of carbon in the water column and a positive specific increase rate. The specific increase rate reached a maximum just before sunset (19.00 h) and thereafter there was a steady decline in the accumu- lated carbon due to respiration losses occuirring throughout the column, throughout
P- 1 02 - t
; o|4;1tl2 + , 1 26 ~~~~~~time of dayl
0.01
FIGURE S. Diurnal variationl of the specific increase rate of the phytoplankton conumunity during 24 h. The two curves represent a bright day (o~o) and a dull day (o---o) when a positive aiid negative increase rate was recorded.
the night. At the end of 24 h a positive increase rate of + 0.012 dayi was recorded. On the second occasion the radiation input to the lake was rather less (1589 J cm-2 day-1) and the initial biomass 40 g C m-2. During the first experinmental period there was a net loss of carbon from the water column. By mid-day, how- ever, there was a net gain of carbon. Thereafter there was a steady decline in the rate of community increase as the respiratory demands exceeded the photosynthetic gains of carbon within the euphotic zone. Thus on this dull day at the end of 24 h a negative specific increase rate of - 0.0 14 day-1 was recorded.
From examination of both the long-term and the diurnal oscillations of biomass, it is evident that the positive or negative value attached to the increase rate depends largely upon the climatic events of the previous 24 h. For this reason we have tended to concentrate our work upon the 24 h cycle that occulrs in Lake George.
This content downloaded from 169.229.32.137 on Thu, 8 May 2014 07:21:28 AMAll use subject to JSTOR Terms and Conditions
Ecological stability 327
PHOTOSYNTHESIS AND RESPIRATION
Theoretical In the discussion so far we have considered each gain and loss factor as a single
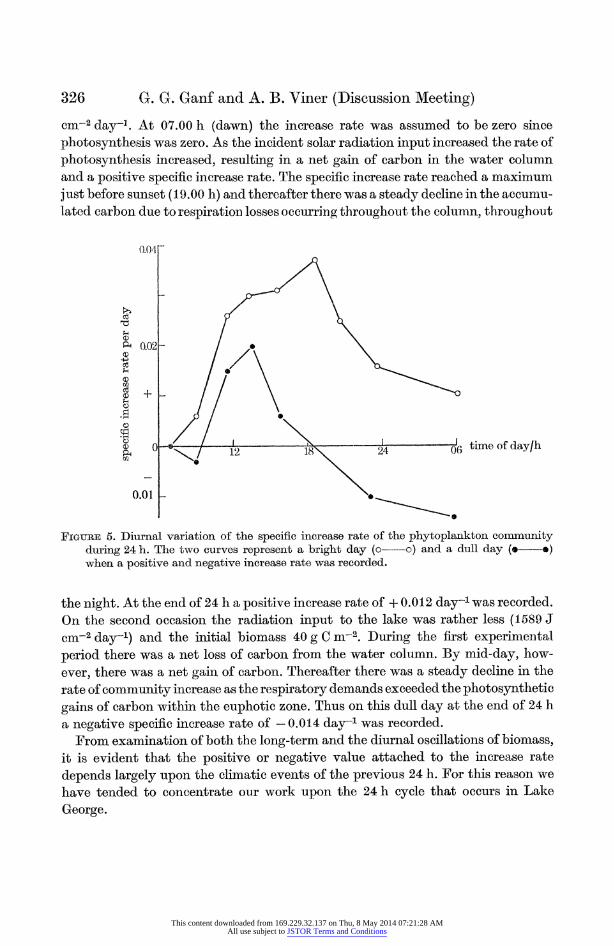
function. It is evident, however, that each of the terms used in Uhlmann's equation is a complex combination of many factors. For reasons of methodology it is usually impossible to distinguish between algal and bacterial respiration; however, if it is assumed that phytoplankton form the major substrate for bacterial respira- tion, the rate of change of community density will be a function of the metabolic rate of the phytoplankton-bacteria complex, which is here termed the 'primary material'. When considering phytoplankton increase it is reasonable to consider that
net production of primary material = gross photosynthesis - respiration of algae + bacteria.
light O dark
euphotic zone
75
225 07 19 07
time of day/h
FIGuIRE 6. Diagrammatic representation of the proportions of the Lake George water column that are either illuminated (white) where photosynthesis exceeds respiration, or in darkness (black) where respiration exceeds photosynthesis.
This expression assumes that the values determined for gross photosynthesis are not unduly affected by photorespiration (see Lex, Silvester & Stewart I972) and that the phytoplankton-bacteria complex be regarded as the primary organic material. Given these assumptions we may say that net primary production is proportional to the ratio of respiration to photosynthesis in this 'primary' material.
The equatorial position of Lake George means that there are 12 h of sunlight followed by 12 h of darkness. During the day and within the euphotic zone the photosynthetic gain of carbon exceeds the respiratory loss. The respiration of the phytoplankton (including bacteria) below the euphotic zone (figure 6) and the
2 1 -2
This content downloaded from 169.229.32.137 on Thu, 8 May 2014 07:21:28 AMAll use subject to JSTOR Terms and Conditions

328 G. G. Ganf and A. B. Viner (Discussion Meeting)
entire community throughout the night results in a loss of carbon. It is evident that in the type of situation illustrated in figure 6 there does exist a critical value when the photosynthetic gains of carbon exactly balance the respiratory losses and there is no net production.
Talling (I 957 a, I 97I), extending the work of Riley (I 942), tried to express quan- titatively the balance between photosynthesis and respiration of phytoplankton. He suggested that there was a critical value which defined the column compensation point when the ratio between respiration and photosynthesis was unity and there was therefore no net production, i.e.
total colunin respiration total column resphotoynte- - 1 at column compensation point (Talling I957a). total coluimn photosynthesis
Talling (I95 7 a, I97I) then derived an expression for this critical value
[l= m l.h.]y 2 = 32r (Talling i97I, p. 233),
where q, is the critical value of the ratio when the column compensation point is reached. Light division hours [l.d.h.]daY, the logarithmic function of daily incident radiation, is an expression which defines the total daily incident radiation available for photosynthesis within the water column. 6min is the minimum vertical extinc- tion coefficient of photosynthetically active sunlight (wavelength 400 to 700 nm), Zm is the mixed depth and the expression 6min zm/ln 2, the optical depth of the mixed layer, defines the optical characteristics of the water column. The ratio between the measure of light available for photosynthesis and the value character- izing the optical properties of the water column is equal to 32 times the relative rate of respiration (r) when the column is at compensation point. The relative rate of respiration is defined as the ratio between the specific rate of respiration, R, expressed here as mg 02 (mg chlorophyll a)-' h-l and the maximum rate of gross photosynthesis, Amax (= Talling's Pmax), in mg 02 (mg chlorophyll a)-1 h-'. If the column compensation point has not been reached, then the ratio
[l..h.]day 3r emlnzm/ln 2
and the phytoplankton will be capable of autotrophic growth. If the column compensation point is exceeded, the ratio of
[l.d.hjlday Cminzm/In 2 < 32r,
and the phytoplankton will not be capable of net production. The relation between these three variables may be depicted by a two-dimensional
diagram. Thus if a value of 0.1 is given to r by experimental observation, the column will be at compensation point when the ratio q, is equal to 3.2. In the construction of the diagram the values which indicate the amount of radiation available for photosynthesis in the water column are arranged along the x axis
This content downloaded from 169.229.32.137 on Thu, 8 May 2014 07:21:28 AMAll use subject to JSTOR Terms and Conditions

Ecological stability 329
(figure 7). The values which characterize the optical properties of the water column (emin zm/ln 2) are arranged along the y axis. Then for any value of [l.d.h.]day there is a corresponding value for Cmin zm/ln 2 when the ratio between the two is equal to 3.2. For example, for an [l.d.h.]daY value of 30 the corresponding emin zm/ln 2 value will be 9.4 when the ratio between the two is 3.2. A line may be drawn
12 -
6 X--w -- /
/ ~ ~~I I
/ ~ ~ ~~~I I I ! i I ..... l..... I IL
0 10 20 30 40 [l.d.h.]day
FIGURE 7. Theoretical construction of the critical line for the ratio between the logarithmic function of daily incident radiation [l.d.h.]dly and the optical depth of the mixed layer (eijnizm/ln 2), which gives a critical ratio of 3.2 when no net production is possible, assum- ing that the relative respiration rate is 0.1. The three points (x, o, A), illustrate that for an ordinate value of 6.3 the critical ratio, q, will be equivalent to an [l.d.h.]daY value of 20. If the light increases (A) or decreases (x) so the q, will either be exceeded or not reached and net production will or will not be possible.
through a series of points of intersection of critical [l.d.h.]day and 6min zmlln 2 values (figure 7). This diagram may then be used to predict whether or not under given conditions the phytoplankton would be capable of autotrophic growth. For instance, the column compensation point will be reached when the [l.d.h.]daY value is 20 and the 6min zm/ln 2 value is 6.3. If the optical properties of the water column remain constant but the amount of solar radiation increases, as when [l.d.h.]daY moves from 20 to 25, then the phytoplankton are capable of autotrophic growth since the intersection of 6.3 and 25 falls below the critical line. A decrease of solar radiation would result in the intersection point falling above the critical line and no net production could occur.
Photosynthesis and respiration in Lake George The consumption of oxygen in the dark was measured on 340 occasions at
different depths and times of day (figure 8). The results are variable but a general pattern may be distinguished. Oxygen consumption rates (R) below 1 mg 02 (mg chl. a)-' h- are obtained at all depths below ca. 2.0 m and for most of the
21-3
This content downloaded from 169.229.32.137 on Thu, 8 May 2014 07:21:28 AMAll use subject to JSTOR Terms and Conditions

330 G. G. Ganf and A. B. Viner (Discussion Meeting)
column during the night. There is a general increase in the consumption rate during the day, which is particularly marked within the euphotic zone where the rate frequently exceeds 3 mg 02 (mg chl. a)-1 h-'. To calculate an oxygen consumption rate applicable for use in the expressions discussed above the geometric mean of the rate within each depth stratum was calculated (see Elliott I97', p. 90). These mean values were then weighted for the relative volumes through which they operated. For each of the seven depths there were at least five determinations.
?L V l, ,/ I
01 07 13 19 01 time of day/h
FIGURE 8. Depth distribution of the oxygen consumption rate (mg 02 (mg chi a)-' h-1) of particulate material over a 24 h period.
Geometric means were used as they give a more realistic value for the respiration rate than does the arithmetic mean of the determinations since the distribution of values is skewed towards the higher values. The geometric mean for the weighted oxygen consumption rate was 1.1 mg 02 (mg chl. a)-' h-' (the arithmetic mean was 1.8).
The mean maximum rate of gross photosynthesis per unit population per unit time was 20 + 4 mg 02 (mg chl. a)-' h-' (n = 81). Thus the r value applicable to Lake George is 0.05 and assuming that R remains constant at 1.1 mg 02 (mg chl. a)-'L h-' the 95 % confidence limits will give a range of r values between 0.04 and 0.06. Therefore, in Lake George the phytoplankton community will be capable of net production when the ratio of
[*d.h]dY > 32 x 0.05 = 1.6, eminzm/ln 2
whereas if the ratio is less than 1.6 there will be no net production. The range of photosynthetically active radiation values recorded from Lake
George was 418 to 1046 J cm-2 day-l (wavelengths 400 to 700 nm). Other measurements indicate that the mean Ikvalue (Talling I957b) approximates to a
This content downloaded from 169.229.32.137 on Thu, 8 May 2014 07:21:28 AMAll use subject to JSTOR Terms and Conditions

Ecological stability 331
value of 15 J cM-2 h-l. Day-length at Lake George is 12 h. Hence from the expression (Talling I965) the quantity light division hours may be calculated
[l.d.h.]daY At x 0.9 (lg it - lg 0.5 Ik) (lg 2)-',
where At is the day-length; lo the mean hourly subsurface light intensity (400 to 700 nm) over the day and k the value that designates light saturated photo- synthesis. The [l.d.h.]daY values equivalent to radiation inputs of 1046, 837, 627 and 418 J cm-2 day-' are given in table 1. These values may be located along the x axis of figure 9. For the second term of the ratio q,, 6min zm/ln 2, the mixed depth is taken as 2.5 m. This is justified on the grounds that the water column is iso- thermal for the majority of the day. The value of 6min varies according to the concentration of chlorophyll a within the water column (figure 10). The normal
TABLE 1. VARIATION OF THFE RATIO (q) BETWEEN [l.d.h.]day AND ?min Zm/fn 2 FOR
VARIOUS VALUES OF [1.d.h.]daY AND THE MINIMUM VERTICAL EXTINCTION
COEFF-ICIENT (6min) [l.d.h.]daY
e,,,uz/ln2
mi ql 2 q3 q4
M-1 cEj11Zm/112 (1.d.h. = 38.1) (1.d.h. = 34.7) (l.d.h. = 30.2) (l.d.h. = 23.9)
4 14.4 2.6 2.4 2.1 1.6 5 18.0 2.1 1.9 1.7 1.3 6 21.6 1.8 1.6 1.4 1.1 7 25.2 1.5 1.4 1.2 0.9 8 28.9 1.3 1.2 1.0 0.8 9 32.5 1.2 1.1 0.9 0.7
10 36.1 1.1 1.0 0.8 0.6 18 64.9 0.6 0.5 0.4 0.3
dull/
20- right
d 10/
0 10 20 -l30 40 [l.d.h.]day
FIGURE 9. The underwater light climate of Lake George expressed as the logarithmic function of the daily incident radiation [l.d.h.]daY and the optical depth of the mixed layer (e,n Zm/ ln 2). The solid line represents the calculated critical ratio of these two factors for a rela- tive respiration rate of 0.05. On the bright day the critical value is not reached and net production was possible whereas on the dull day the critical value was exceeded and no net production was possible.
This content downloaded from 169.229.32.137 on Thu, 8 May 2014 07:21:28 AMAll use subject to JSTOR Terms and Conditions

332 G. G. Ganf and A. B. Viner (Discussion Meeting)
range of 6mi values recorded is between 4 and 10 m-1 and the most frequent range between 5 and 7 m-l. Only on very exceptional occasions (fish kills) were values as high as 18 m- recorded. These data permit the calculation of a range of values for optical depth (table 1). Individual values may be located on the y axis of figure 9.
1) -
V
500 1000
mg chli a m-3
FiGu-RE 10. The relation between the concentration of chlorophyll a within t-he euphotic zone and the minimum vertical extinction coefficient, e,''.
Because zm is taken as a constant and the variation of emlin is primarily a function of the chlorophyll a concentration, the expression for optical depth is directly related to the concentration of chlorophyll a and thus to the phytoplankton biomass. Changes of emi within the intermediate range of those values given in table 2 frequently occur as a result of strong winds and the concomitant stirring of the superficial sediments into the water column (Burgis et al., this volume).
For each of the [l.d.h.ldaY values and the eight e.mm values (table 1) the ratio between [l.d.h.]day and emmrnnzmll/n 2 was calculated to illustrate the range of the ratio most likely to occur in Lake George (table I). The q, value for Lake George is 1.6. Therefore on dull days (e.g. [l..h.]day 23.9) the column will be at compensa- tion point when the vertical extincetion coefficient lies between 4 and 5 m-1. On bright days, however, ([l.d.h.]day= 38.2) the columni compensation point will only be reached when the 6mi value lies between 6 and 7 m1-.
.1 ~ ~ ~ g3 mi
This content downloaded from 169.229.32.137 on Thu, 8 May 2014 07:21:28 AMAll use subject to JSTOR Terms and Conditions

Ecological stability 333 In the two earlier examples of diurnal production the [l.d.h.]daY values are 36.1
and 32.2, corresponding to the bright and dull days respectively. The emin values were 5.9 and 6.2 m-1 and thus the values for optical depth (Cmin zm!ln 2) are 21 and 22. The intersection of the two values for the bright day (figure 9) falls below the critical line. This indicates that net production is theoretically possible and indeed a positive growth rate was determined experimentally. The intersection of the [l.d.h.]day and 6min zm!ln 2 values for the duller day (32.2 and 22) falls above the
TABLE 2. DAILY VARIATION OF THE INCIDENT RADIATION AND THE CHLOROPHYLL a CONCENTRATION DURING A TWO MONTH PERIOD
The logarithmic function of daily incident radiation [l.d.h.]daY was calculated assuming an Ik value of 15 J cm-2 h-1. The ratio between [l.d.h.] and the optical depth of the mixed depth is indicated for each day. The critical value for Lake George is 1.6 assuming a relative respira- tion rate of 0.05.
daily radiation chlorophyll a [l.d.h.]daY date J cm-2 day-' [l.d.h.]daY mg m-3 ,, z/lln 2 1 Aug. 1736 32.6 135 2.0 2 2246 36.6 143 2.2 3 2481 38.2 206 2.4 4 1066 25.0 195 1.3 8 1924 34.2 156 1.9
10 2167 36.1 182 1.8 13 2456 38.0 193 1.9 17 1719 32.5 213 1.5 19 1656 31.9 259 1.3 21 2652 39.2 292 1.5 22 2150 36.0 173 1.9 24 2627 39.1 254 1.6 25 1100 25.5 263 1.0 28 1853 33.6 178 1.8 30 2225 35.5 213 1.7 1 Sept. 1460 29.9 247 1.3 3 2104 35.6 283 1.4 5 2334 37.3 219 1.7 8 2376 37.5 243 1.6
10 1535 30.7 201 1.5 11 2263 36.7 153 2.1 12 2104 35.6 184 1.8 29 2673 39.2 192 2.0 30 2456 38.0 227 1.7
critical line (figure 9) which suggests that net production was not possible. The experimental results confirm this prediction. From the evidence before us we may say that Talling's model appears to be applicable to Lake George and that the occurrence of either a positive or negative net production is dependent upon the daily radiation and the optical depth.
The two diurnal experiments in particular illustrate that very slight adverse changes in environmental features can result in negative production rates. The long-term implications of this are best illustrated by the data presented in table 2.
This content downloaded from 169.229.32.137 on Thu, 8 May 2014 07:21:28 AMAll use subject to JSTOR Terms and Conditions

334 G. G. Ganf and A. B. Viner (Discussion Meeting)
These data all refer to a mid-lake station where the mixed depth was 2.5 m. The incident solar radiation was measured by a Kipp solarimeter located on the roof of the I.B.P. laboratories. The minimum vertical extinction coefficient was estimated from the regression of chlorophyll a and emi. (figure 10) from measured values of the chlorophyll a concentration. Subsequently the values for the ex- pression emin zm/ln 2 were determined. For the calculation of the [l.d.h.] values anlk value of 15 J cMn-2 h-1 was used throughout. The values for the ratio between the [l.d.h.]daY and emin zm/ln 2 for 25 days during a 2-month period are given in table 2. On 16 of the 25 days the ratio would suggest that a positive net production was theoretically possible if the q, for those days was 1.6. If, however, the q, value appropriate to an Amax value of 24 mg 02 (mg chl. a)- h-1 is used then on 21 of the 25 occasions a net production is possible. The q, value for an Amax of 16 mg 02 (mg chl. a)-1 h-' would suggest that only on 3 days would there be a positive net production. These comparisons illustrate the extreme susceptibility of the ratio
qc to changes in r and therefore of net production to changes in the respiration rate and the maximum rate of photosynthesis. Viner & Smith and Burgis et al. (this volume) have demonstrated the effect of wind induced turbulence upon the concentration of chlorophyll a in the water column and thus upon min. Thus the magnitude of net production is not simply a function of the daily fluctuation of solar radiation but is also closely related to the mixing regime of the water column.
During the study period (1968,1970) the mean solar radiation input to Lake George was 2008 J cM2 day-1, which is equivalent to a mean [l.d.h.]daY value of 34.9, assuming Ik is constant at 15 J cm-2 h-. Since there was little seasonal variation of solar radiation and 10-day means did not vary from the annual mean by more than + 4 % we may attempt to predict the chlorophyll a concentration at which the phytoplankton biomass of Lake George will stabilize. The long-term mean lake depth is 2.4 m (Viner & Smith, this volume) then
6m3 2.4/lu 2 - 32 x 0.055,
whence emin = 5.73 mr, equivalent (figure 10) to a concentration of 205 mg chlorophyll a m-3 (493 mg chlorophyll a m-2).
This predicted chlorophyll concentration is only slightly above the mean annual concenitration found during routine sampling (figure 3).
SIGNIFICANCE OF N-UTRIENTS
The values assignied to Amax and B are major determinants of the changes in the quantity of chlorophyll a that signifies ecological stability in Lake George. The underwater light climate of the lake will, under all circumstances, limit the photosynthetic rate of phytoplankton below the depth where the energy input is less than Ik. This can be seen by reference to figure 11, where lk approximates to 10 % of incident radiation (400 to 700 nm) and the photosynthetic rate is light-
This content downloaded from 169.229.32.137 on Thu, 8 May 2014 07:21:28 AMAll use subject to JSTOR Terms and Conditions

Ecological stability 335
limited at depths below 20 to 45 cm depending upon the cm,. value. If, however, the physiological state of the phytoplankton allowed a more favourable response of the cells to the given light regime an increase of Amax might result. The range of variation of both Amax and R measured in Lake George suggests that these rates do alter even under the rather uniform climatic environment of the lake.
The highest Amax value measured in Lake George was ca. 25 mg 02 (mg chl. a)-' h-1 and the lowest R value ca. 0.5 mg 02 (mg chl. a)- h-l1. If these values persisted over the water column, qc would be 0.64 and the phytoplankton biomass would tend
100
10
A
0.11 \ I I I 0 60 120
depth/cm
FIGURE 1 1. The semilogarithmic plot of the % reduction of the photosynthetically active energy (400 to 700 nm) with depth. The three lines represent three values for the mini- mum vertical extinction coefficient, 9.09 (A), 6.82 (.), 4.54 (o). The 'k value approximates to 10 ?% of 1O.
to stabilize at a chlorophyll a concentration equivalent to an cmln value of ca. 16 mi-1. This is not very far removed from the values recorded during fish-kills.
One of the factors most likely to alter the physiological state of an algal cell is its nutrient status. It has been shown, in a wide variety of laboratory studies with algae, that when supplies of inorganic phosphate and nitrogen are altered there are repercussions in the metabolic activity of the cells (see, for example, Pirson, Tichy & Wilhemi I952; Syrett I953; Bongers I956; Stewart & Alexander I97I; Soeder, Muller, Payer & Schulle I97I).
For Lake George there is considerable indirect evidence that both nitrogel and phosphorus are in short supply relative to the potential demands of the
This content downloaded from 169.229.32.137 on Thu, 8 May 2014 07:21:28 AMAll use subject to JSTOR Terms and Conditions

336 G. G. Ganf and A. B. Viner (Discussion Meeting)
phytoplankton. At no time during the day do the concentrations of either dissolved inorganic phosphate-phosphorus rise above 2 Vg 1-h or ammoniacal-nitrogen (NH3 + NHl+) above 10 ,ug 1-1. Nitrite- and nitrate-nitrogen are usually undetect- able. It seems, therefore, that whatever is supplied of these nutrients is utilized iinmediately by the primary producers. The hypothesis that nitrogen is in short supply is supported by the experimental data on nitrogen fixation of Horne & Viner (197I). The rate would appear improbably high if other forms of inorganic
40-
l12
20- o8 -
_AZ 3.' A.A * IE 1D, o
O I 3L i0 60 010 30 50 70 time/min time/min
FIGURE 12 FIGURE 13
FiGU:RE 12. The dark uptake rate of phosphate-phosphorus by phytoplankton sampled at the same time but at different depths during the period of intense thermal stratification. 80 Ftg P04 - P 1-1 were added to each sample and the rate of disappearance from the medium was measured, the control (lake water filtered through GFC papers) showed no uptake. (a) surface, (A) 1.0 m, (o) 2.0 m, (x) bottom. Temperature = 27.3 'C.
FIGURE 13. The dark uptake of ammonia by phytoplankton from three depths (e) surface, (o) 1.5 m and (A) bottom. For further experimental details see figure 12. 80 ,tg NH3-N 1-N were added to each sarnple.
nitrogen were freely available, as nitrogen fixation is progressively inihibited in the presence of increasing nitrate or ammonia (Stewart i968).
Experiments with freshly collected samples from the Lake showed that both ammonia and phosphate were rapidly taken up in the dark. Fitzgerald (1968) considers that rapid dark uptake is strongly indicative of niutrient starvation. Further experiments with samples collected from depths above and below the euphotic zone, before and during tlhermal stratification, showed that dark uptake rates (per unit population) were uniform throughout the column during isothermal
This content downloaded from 169.229.32.137 on Thu, 8 May 2014 07:21:28 AMAll use subject to JSTOR Terms and Conditions
Ecological stability 337
conditions but were markedly dissimilar at different depths during stratification (figures 12, 13). Such differences were also noted for the respiration rates (figure 8). Other experiments showed that Amax tended to fall during the latter part of the day. These observations would imply that very different physiological states can exist within the community at any one time and that such differences can be induced within the course of a few hours.
As well as the physiological variation discussed above, Viner (I973) demonstrated markedly different responses of different algal size groups to nitrogen enrichment. The larger colonies of Microcystis did not show the extremely rapid uptake rates of nitrogen characteristic of the smaller algae.
The proportions of nitrogen and phosphorus in the Lake George algae (N = 50/
P = 0.3 % of dry weight), though not very low when compared to other published values for natural populations (Strickland I960; Syrett I962), are very much lower than values obtained from culture populations grown in excess nitrogen and phosphorus. The proportions found are near the values for which other workers have found the beginning of effects upon metabolism and growth, particularly affecting light utilization and oxygen output (Gerloff & Skoog 1957; Bongers 1956).
It was also possible to show (Viner I973) that in the lake more photosynthate could be formed than could be incorporated into protein, and that this was pro- bably due to a nitrogen supply too small for the rate of photosynthesis taking place. Further, it was demonstrated in the laboratory that increased supplies of ammonia-nitrogen could increase the gross photosynthesis by 30 % (recalculated from Viner 1973). The addition of phosphate increased this enhancement.
This evidence suggests that a variety of physiological conditions dependent upon nutrient status exist simultaneously within the community. Secondly, changes in physiology may be induced, in one fraction of the community or another, by nutrient enrichment. Such changes would lead to a more favourable growth response of the phytoplankton to the light r6gime of the lake. Because both nitrogen and phosphorus are utilized as soon as they are supplied, the factors controlling the rates of supply of these nutrients (and probably other unidentified nutrients) are important as stabilizing forces within the Lake.
Nitrogen-fixation Horne & Viner (I97I) have suggested that nitrogen-fixation might account for
30%0 of the particulate nitrogen annually flushed out from the lake. This figure was derived from a series of experiments spanning a dry and a wet season. Because there is no evidence for major seasonal changes of the phytoplankton species composition, annual figures were calculated from these experiments. Perhaps more significant than the lack of change in species composition is that the concentrations of dissolved ammonia-, n-itrite- and nitrate-nitrogen are very low and do not fluctuate seasonally. It is therefore unlikely that nitrogen-fixation would be reduced by an adaptive response to other forms of inorganic nitrogen. Since the rate of fixation is more likely to alter inversely in relation to alternative supplies of
This content downloaded from 169.229.32.137 on Thu, 8 May 2014 07:21:28 AMAll use subject to JSTOR Terms and Conditions

338 G. G. Ganf and A. B. Viner (Discussion Meeting)
inorganic nitrogen, the process in Lake George may be considered as a compen- satory mechanism against a growth limitation imposed by low ammonia and nitrate supplies.
Sediment contribution The superficial sediments are frequently disturbed by hydrodynamic forces
(Viner & Smith, this volume). This disturbance is reflected by the chemical con- centrations and the oxygen uptake profiles of the sediments. Typical depth profiles of soluble ammonium and phosphate (figure 14) show extremely low concentrations in the upper 5 cm. Between 5 and 15 cm there is a rapid increase of ammonium and phosphate concentrations. Below 15 cm the rate of change falls off. The upper 5 cm are frequently disturbed, which suggests that ammonium and phosphate originating
0 a 20 - N114-N/tLg ml-'
Q?I2 4 6 P04 PlVug ml-1
0
lo -0 *I,
20 _
FIGuPRE 14. Depth distribution of soluble, i.e. H20 washable, P04-P and NH4-N from sediment columns taken from the centre of Lake George. The sharp increase of con- centration below ca. 5 cm indicates the depth to which turbulence frequently pene- trates. (o ---o) N4g- N, (, *) P04-P-
in or entering this zone are transported to the overlying water. Since dissolved in- organic phosphate and ammonia do not enter the sediments from the overlying water it is reasonable to assume that the accumulations of these products within the sediments result from the decomposition of organic material in situ.
The mud zone influenced by oxygen appears to be deeper than the hydrodyna- mically mixed zone. It is possible to show that aerobic activity extends to about 30 cm. When samples of mud from various depths were supplied with oxygen under experimental conditions in the laboratory, the initial oxygen uptake was much faster for samples from about 15 cm (for mid-lake muds) than for samples above or below this depth (figure 15). Within 10 h, however, the oxygen uptake by all
This content downloaded from 169.229.32.137 on Thu, 8 May 2014 07:21:28 AMAll use subject to JSTOR Terms and Conditions

Ecological stability 339
samples from all depths had decreased to almost nil. Thus the total amount of oxygen consumed by a unit quantity of mud increased with depth, reaching maxima at 10-15 cm. The initial oxygen uptake rates also increase with depth to maxima at ca. 15 cm.
8-
35-40 30-35 40-45
25-30
4~~~~
0 5 28 36 44 hours
FIGU':RF 15. The consumption of oxygen by mud taken from various depths (cm) in the sediment. Oxygen was added by aeration and the mud was diluted I in 100 parts of lake water.
The initial rapid consumption rates and the total amount of oxygen used could be restored by adding sterilized mud as additional substrate (additions of oxygen alone had no effect). This evidence suggests that in the lake there are increasing quantities of intermediate decomposition products (i.e. substrate) at increasing depths. As the degree of complete decomposition depends upon a supply of oxygen for aerobic activity, this substrate profile must be due to the decreasing extent to wh'ich oxygen penetrates downwards. The extension of the oxygen- influenced zone below the sulperficial hydrodynamically mixed zone may be a reflexion of the burrowing nature of the benthic fauna, but the hydrodynamic mixing may often extend further downwards than is suggested here (cf. Vi'ner &; Smith, this volume).
The peak of initial oxygen consumption coi'ncides with the depths where ammo- niulm and phosphate concentrations are increasing most rapidly. The dramatic and extremelv sudden increase of ammonium and phosphate below 5 cm, and the simi- larity in this profile between cores takenl from the same locality, show how constant is the pattern of mixing. If there was a sudden increase of turbulence downwards
This content downloaded from 169.229.32.137 on Thu, 8 May 2014 07:21:28 AMAll use subject to JSTOR Terms and Conditions

340 G. G. Gaanf and A. B. Viner (Discussion Meeting)
very substantial quantities of nutrients would be released into the water column. Although this would provide additional nutrients for the primary producers, it could well have a lethal effect upon the fish due to the toxic nature of ammonia.
Quantitative estimates of the evolution of nutrients from the mud are invali- dated by the uncertainty of the real rates of decomposition and transfer; the former is dependent upon oxygen supply, both are dependent upon turbulence, and neither is easily predictable. However, the contribution from the sediments to the nutrient demand of the water column is probably small relative to the input of organic material to the sediments. The mean percentages of carbon, nitrogen and phosphorus in the dry weight of the upper 5 cm of mud are 32, 4.5 and 0.3 ?,h respectively, which is very similar to the proportions of these elements in the algae (35, 5 and 0.3 %). This implies that there is little decomposition in the sediments relative to the amount of organic material present there.
Open-water recycling of nutrients
Three mechanisms have been identified which recycle carbon, nitrogen and phosphorus within the water column. The first is via the metabolic activity of the phytoplankton, the second is attributed to bacterial activity and the third to the excretion and respiration of the fauna. Carbon is recycled via algal respiration, of which quantitative aspects have already been discussed. Although carbohydrate is the usual respiratory substrate (Gibbs I962), if protein were utilized ammonia might well be released. Viner (I 970) showed that phytoplaakton artificially enriched with nitrate or nitrite, kept in the dark, could release ammonia equivalent to the amounts of oxidized nitrogen taken up. HTe interpreted this as an expression of the quantity of photosynthetically formed carbon skeletons which are available for utilizing the nitrogen for protein metabolism, because if there is insufficient photosynthate some or all of the nitrogen taken up will be redundant. The amount of ammonia released in this way in the lake below the euphotic zone must there- fore depend upon how much the algae have photosynthesized immediately before being below the euphotic zone and with how much nitrogen they were supplied.
There are large quantities of both dissolved organic carbon (10-15 mg 1-1) and nitrogen (0.5-0.8 mg 1-1) in the lake. These organic compounds probably originate from the phytoplankton, either via extracellular excretion (Ganf & Horne, in preparation) or by the mechanical loss of mucilage from the envelopes surrounding the colonial blue-green algae (Ganf, in preparation). Since there is not a steady accumulation of these products it is likely that they are broken down by bacterial action. Golterman (I97I) and Ganf (in preparation) have shown that sometimes 20 to 30 0 of the total oxygen uptake in the dark is due to the oxidation of dissolved organic material. Besides this, their results also suggest that a similar percentage of the total oxygen uptake may be due to the non-algal oxidation of particulate organic material. They were, however, unabl 3 to identify the end products of these oxidative reactions.
A revealing aspect of the nutrient recycling within the water column comes from
This content downloaded from 169.229.32.137 on Thu, 8 May 2014 07:21:28 AMAll use subject to JSTOR Terms and Conditions

Ec,ological stability 341
TABLE 3. THE ANNUAL INPUT OF NITROGEN AND PHOSPHORUS TO LAKE GEORGE
NH4-NO3-N P04-P
nutrient source tonnes per year tonnes per year influent streams 1153 182 rainfall onto lake 277 119 nitrogen-fixation 1280 - other 90 15-26 total 2800 320
laboratory measurements of the amounts of ammonia and phosphate that are excreted by the zooplankton (Blazka & Ganf, in preparation). The mean hourly rates over the day (24 h) were estimated to be ca. 20 ,tg NH3-N (mg zooplankton N)-1 h-' and ca. 4 ,ug P04-P mg N-1 h-'. The mean annual zooplankton biomass approximates to 75 mg N m-2 and hence the excretion rate of ammonia would be 36 mg M-2 day-' and for phosphate 7 mg M-2 day-'. When these figures are multiplied up to give mean annual figures for the lake they are directly comparable with the quantities of nitrogen and phosphorus entering the lake from external sources. The annual figures for ammonia and phosphate are 3300 and 640 tonnes per year for nitrogen and phosphorus respectively. The comparative figures are given in table 3. Thus slightly more nitrogen is recycled within the lake by the zooplankton than enters the lake; 2 to 3 times as much phosphorus is recycled as enters it.
Other animals have rather less influence upon the recycling. Experiments with the herbivorous fish, Tilapia nilotica and Haplochromts spp., showed that the excretion of ammonia was inversely related to the mass of the fish. For the smallest, 3.8 g, it was 0.2 ,ug N g-' (f.w.) day-' and for a 130 g fish was 0.008 Vug. The annual figure for the lake would approximate to 220 tonnes.
There is no evidence for the continuous erosion of the lake sediments as a supply of nutrients. Therefore over an extended period the net loss of material from the lake must be replaced from external sources. The day-to-day demands of the phytoplankton for nutrients are, however, met almost exclusively by the recycling processes discussed in this section. If these recycling processes were stopped the ecological stability of the lake would be upset, and the probability is that the phytoplankton community would stabilize at a density more closely governed by the inflow of nutrients.
ECOLOGICAL INSTABILITY
The limnological features examined so far have been especially concerned with the phytoplankton which forms the major proportion of the total biomass. It has been shown, either in this paper or elsewhere in these proceedings, by what means these features are related to the external environment of wind, light, temperature and nutrient supply. The sensitivity of the biomass to changes in these features has also been illustrated. It is possible to demonstrate the delicate poise of the
This content downloaded from 169.229.32.137 on Thu, 8 May 2014 07:21:28 AMAll use subject to JSTOR Terms and Conditions

342 G. G. Ganf and A. B. Viner (Discussion Meeting)
equilibrium conditions in the lake by simple calculations of the oxygen budget of the water column in association with the sediments.
The mean oxygen content of the water column during the night would approxi- mate to 13 g M-2. The mean oxygen consumption of the superficial 5 cm of mud under a square metre of surface, experimentally determined, is ca. 5 g during the initial hour of contact with oxygen. Consequently, if there were to be sufficient wave action at the sediment water interface to allow this layer of mud to remain in the water column for an hlour, a significant proportion of the available oxygen would be consumed. Sediment disturbance to 5 cm is not uncommon, as both the theoretical calculations of Viner & Smith (this volume) and the chemical profiles illustrate. Severe shortage of oxygen does not normally occur and one must pre- sume that sufficient compensation is provided by the atmospheric influx of oxygen at the water surface. However, if the sediments were disturbed to 10 cm for the same time period the amount of oxygen consumed would be ca. 17 g. Clearly the oxygen budget of the water column is delicately balanced.
It is not surprising that this delicately balanced ecological stability is sometimes disrupted with catastrophic results upon the fauna. These occasions are known locally as fish-kills and manifest themselves by a mass mortality of fish and an increase in the algal crop. Unfortunately it was impossible, without recording apparatus, to follow the sequence of events that led up to fish-kills. Fish death was probably due to asphyxia which implies deoxygenation of the water column (although ammonia poisoning must not be ruled out, it is noteworthy that the air- breathing fish, Clarias and Protopterus, did not die). Deoxygenation of the water column may occur as a result of deep mixing of the anoxic sediments. There was not, however, a strict correlation between fish-kills and violent storms, and indeed mud cores taken during one fish-kill did not show any distortion of the normal profile. The other difficulty of relating fish-kills directly to high winds is that they would increase the atmospheric influx of oxygen. A persistent but not particularly powerful wind could increase the chlorophyll a content of the water column to ca. 1500 mg M-2 (Burgis et al., this volume) without destroying the mud profiles beneath 5 to 6 cm. During a subsequent calm night this quantity of chlorophyll a respiring at a rate of 1.1 mg 02 (mg chl. a)-' h-1 would completely deoxygenate the water column overnight. Baxter et al. (I966) found that complete deoxygena- tion of the water column during the latter half of the night in Lake Aranguadi, an Ethiopian lake with very dense phytoplankton, was not an unusual occurrence. A third possible sequence of events that would lead to the deoxygenation of the water column could be the development and persistence of a thermocline for several days. This could only occur under exceptionally calm conditions, but would lead to the complete deoxygenation of the hypolimnion. If the eventual breakdown of the thermocline by slight winds occurred at dusk, the reduced total oxygen content of the water column would probably be insufficient to sustain the nocturnal oxygen consumption and complete deoxygenation would be achieved by dawn. The in- crease of algal crop might be associated with a reduction of the mixed depth, a
This content downloaded from 169.229.32.137 on Thu, 8 May 2014 07:21:28 AMAll use subject to JSTOR Terms and Conditions

Ecological stability 343
continuous rain of phytoplankton produced in the epilimnion through the thermo- cline into the hypolimnion, a reduced respiration rate of algae in the deoxygenated zone and a concomitant increase of net production. The occurrence of these fish-kills (which is a misnomer since fish death is only one of the final manifestations of a sequence of events) illustrates how very susceptible the ecological stability of Lake George is to slight changes in the external environment. Fish-kills are infrequent, which is a reflection of the constancy imposed by the external environment.
Although the conditions leading to a fish-kill appear to favour algal growth, the effect upon the fauna is extreme. Besides certain fish, the zooplankton and the zoobenthos communities were largely destroyed. A series of samples taken period- ically after a fish-kill showed that the ostracod population rapidly recovered to the original level and finally reached a biomass 3-4 times the original biomass (J. P. E. C. Darlington, in preparation). Within 2 months, however, the biomass fell to the pre-mortality level. Meanwhile the benthic fauna steadily increased in numbers until the original densities were attained. Immediately after the fish-kill the phytoplankton biomass fell and then oscillated around the annual mean value. Within two weeks these oscillations had reduced to the normal amplitude associa- ted with the lake. Fishing indicated that the area was quickly repopulated from the unaffected areas. The degree of lateral import and export to and from the affected area, of both the benthic and planktonic flora and fauna, was not mea- sured.
GENERAL DISCUSSION
One might usefully consider the lake's overall characteristics using the general- ization associated with eutrophication problems. The loading of a lake with nutrients will initially increase the phytoplankton biomass (see, for example, Schindler, Armstrong, Holmgren & Brunskill I97I), and this will frequently lead to an increase in the faunal biomass. With no organic input the growth of the herbivores will initially be limited by the supply of food from the primary producers. If the rate of primary production is faster than the rate of primary matter decom- position (mineralization, grazing, etc.) there will be an accumulation of primary organic material. With the progressive accumulation of primary organic material the limiting influence of the food supply upon the consumers' growth rate will be progressively lessened. As the food supply increases beyond the level that limits faunal growth, other factors, environmental or intrinsic, become progressively more important as factors controlling the consumer biomass. This effect will tend to occur first with the herbivores and work up through the trophic level sequence. In principle, the continued loading of the lake with nutrients will increase the phytoplankton biomass until a balance between respiration and photosynthesis is attained and no more biomass accumulation will occur. Inievitably, in such a process the dynamics controlling the phytoplankton and those controlling the consumers will become progressively more separated from each other.
In Lake George it is clear that the majority of the photosynthetically fixed
This content downloaded from 169.229.32.137 on Thu, 8 May 2014 07:21:28 AMAll use subject to JSTOR Terms and Conditions

344 G. G. Ganf and A. B. Viner (Discussion Meeting)
energy flow is through the primary producers and that proportionally little is transferred to the higher trophic levels. Moriarty et al. (this volume) have shown that the fauna are unlikely to be food limited. From this point of view the system as a whole is inefficient in the transfer of solar energy from the primary to other trophic levels.
The dominance of the phytoplankton, the simplification of the biota and the disjointing of the primary production from the secondary production makes Lake George very similar to the extreme eutrophic waters of higher latitudes. The concentration of the inorganic nitrogen and phosphorus in the water is however uncharacteristically low, and the lake is not usually subject to the periodic dying off and incomplete decomposition of organic material. This is mainly because of the regular mixing of the Lake George water column. The condition is, however, easily upset by slightly adverse environmental changes resulting in fish-kills, and in this respect shows similarity to rich, shallow fish ponds in Israel (Abelovitch I967). Such catastrophic changes that do occur would suggest that the system's ability to resist change is fairly small and should therefore be classified as unstable in the sense of MacArthur (I955) alnd Stumm & Stumm-Zollinger (I97I) who, among others, suggest that an increasing number of components and phases - i.e. species and chemical diversity - makes a system theoretically more resistant towards a larger number of external influences imposed on the system and hence less subject to disturbances resulting from external stresses. Under the influence of a changing climate (e.g. in a temperate region where annuLally the number of external influences is greater than occurs in the tropics) the Lake George situation would be unstable. However, due to the equatorial position the stresses exerted upon the system are fewer and hence the system can usually maintain a stable appearance with a reduced species diversity although being intrinsically unstable.
In the Lake George ecosystem the herbivorous and primary components are interlocked via the nutrient recycling and grazing feedback loops. The importance of the nutrient recycling has already been discussed. An open water grazing rate of ca. 600 mg C m-2 day-' (Moriarty et al., this volume) suggests that the miniimum turnover of the phytoplankton standing crop required by the herbivores is between 6 to 7 times per year. These feedback loops between the phytoplankton and the zooplankton are of mutual advantage. A supply of nutrients is continually main- tained to the phytoplankton and the grazing restricts the build up of massive algal crops which would be likely to deoxygenate the water column overnight. Thus, although the system may be regarded as inefficient in the transfer to other trophic levels of energy fixed by gross photosynthesis, it may be thought efficient when the transfer and redistribution of the energy fixed in net production is considered.
In attempting to illustrate how Lake George might be fitted into a general lake comparison, it is also possible to consider it as being at the end of a continuum of lake types characterized by progressively reduced ranges of environmental influences (Viner & Smith, this volume). Alternatively, the relative long-term stability of the equatorial climate may have allowed the biota to establish a
This content downloaded from 169.229.32.137 on Thu, 8 May 2014 07:21:28 AMAll use subject to JSTOR Terms and Conditions
EYcological stability 345
delicate equilibriumn with the environmen)t so that eveni smiiall enivironmtrental changes can cause violent oscillations in the biota. From this point of view, the lake may be thought of as at the end of a sequence of increasing susceptibility to the external environmlteent.
We should like to thank Dr J. F. Talling, Dr A. Dunicani and Mr J. A. P. Steel for their help in the preparation of this paper. Technical assistance and laboratory space were kindly provided by the Freshwater Biological Association, U.K. and Royal Holloway College, London. The work was undertaken as a contribution from the United Kingdom and Uganda to the International Biological Programme. We are also grateful to our colleagues for permission to use unpublished work.
REFERENCES (Ganf & Vinei) Abeliovitch, A. I967 Oxygeni regime in Beit-Shean fish ponds related to summlnler mi1ass fish
mortalities. Preliminary observations. Bamidgeh 19, 3-15. Baxter, R. M., Prosser, M. V., Talling, J. F. & Wood, R. B. I965 Stratification in tropical
African lakes at moderate altitudes (1500 to 2000 m). Limnol. Oceanogr. 10, 510-520. Bongers, L. H. N. 1956 Aspects of nitrogen assimilation by cultures of green algae. Meden.
Landbhoogesch., Wageningen 56, 1-52. Burgis, M. J. I97I The ecology and productioni of copepods, particularly Thermnocyclops
hyalinus, in the tropical Lake George, Uganda. Freshwat. Biol. 1, 169-192. Burgis, M. J. & Walker, A. F. 1972 A preliminary comparison of the zooplankton in a tropical
and a temperate lake (Lake George, Uganda and Loch Leven, Scotland. Verh. Internat. Verein. theor. angew. Limnol. 18, 647-655.
Elliott, J. M. I97I Some methods for the statistical analysis of sainples of benithic iniverte- brates. Scient. lubls Freshwat. biol. Ass. 25.
Fitzgerald, G. P. I968 Detection of limniting or surplus niitrogein in algae aind aquatic weeds. J. Phycol. 4, 121-126.
Garnf, G. G. & Milburn, T. I'. 197i A conductimetric method for the deterininatioil of total inorganic and particulate organic carbon fractions in freshwater. Arch. Hydrobiol. 69, 1-13.
Gerloff, G. C. & Skoog, F. 1957 Nitrogen as a limiting factor for the growth of Microcystis aeruginosa in southern Wisconsin lakes. Ecology 28, 556-561.
Gibbs, M. i962 Respiration Physiology and biochenistry of algae, pp. 61-90. New York: Academic Press.
Golterman, H. L. 197I The determnination of nmineralization losses in correlationl with the estimation of net primary production with the oxygen method and chemical inhibitors. Freshwat. Biol. 1, 249-256.
Homne, A. J. & Viner, A. B. .197 Nitrogei fixation atnd its significance ill tropical Lake George, Uganda. Nature, Lond. 232, 417-418.
Lex, M., Silvester, W. B. & Stewart, W. D. P. 1972 Photorespiration and nitrogenase activity in the blue-green algae, Anabaena cylindrica. Proc. R. Soc. Lond. B 190, 87-102.
MacArthur, R. H. I955 Fluctuations of animal populations, and a measure of conmmunity stability. Ecology 36, 533-536.
Pirson, A., Tichy, C. & Wilhemi, G. 1952 Stoffwechsel and MineralsalzernThrung einzelliger Grunalgen. I. Vergleichende Untersuchungen an Mangelkulturen von Ankistrodesmus. Plan'ta 40, 199-253.
Riley, G. A. 1942 The relationship of vertical turbulence and spring diatom flowerings. J. mar. Res. 5, 67-87.
This content downloaded from 169.229.32.137 on Thu, 8 May 2014 07:21:28 AMAll use subject to JSTOR Terms and Conditions

346 G. G. Ganif anid A. B. Vinier (Discussion Meeting) Schlindler, D. W., Armnstrong, F. A. J., Holmgren, S. K. & Brunskill, G. J. I97i Eutrophica-
tion of Lake 227, Experimental Lakes Area, Northwestern Ontario, by addition of phos- phate and nitrate. J. Fish. Res. Bd. Can. 28, 1763-1782.
Soeder, C. J., Miller, H., Payer, H. D. & Schulle, H. I971 Mineral niutrition of planktonic algae: some considerations, some experiments. Mitt. int. Verein. theor. angew. Limnol. 19, 39-58.
Steel, J. A. P., Duncan, A. & Andrew, T. E. 1972 The daily carborn gains and losses in the seston of Queen Mary reservoir, England, during early and mid 1968. In Productivity problems of freshwaters (eds. Z. Kajak and A. Hillbricht-Ilkowska), pp. 518-528. War- szawa-Krakow: Polish Scient. Publ.
Stewart, W. D. P. I968 Nitrogen input into aquatic ecosystems. In Algae, man, and environ- ment (ed. D. F. Jackson), pp. 53-72. Syracuse, N.Y.
Stewart, W. D. P. & Alexander, G. i97i Phosphorus availability and nitrogenase activity in aquatic blue-green algae. Freshwat. Biol. 1, 389-404.
Strickland, J. D. H. I960 Measuring the production of marine phytoplanktoni. Bull. Fish. Res. Bd. Can. 122, 172 pp.
Stuinmn, W. & Stunmm-Zollinger, E. 197 I Chemnostasis anid hoineostasis in aquatic ecosystemxs; principles of water pollution conitrol. Adv. Chem. Ser. 106, 1-29.
Syrett, P. J. 1953 The assimnilation of ammonia by nitrogen starved cells of Chlorella vul- garis. I. The correlation of assimilation with respirationi. An. Botany (London) 17, 20-36.
Syrett, P. J. 1962 Nitrogen assimilation. In Physiology and biochemistry of algae (ed. R. A. Lewin), pp. 171-188. London, New York: Academic Press.
Talling, J. F. 1957 a The phytoplankton population as a compounid photosynthetic systemn. New. Phytol. 56, 133-149.
ralling, J. F. I957 b Photosynthetic characteristics of some freshwater planlkton diatoms in relation to underwater radiation. New Phytol. 56, 29-50.
Talling, J. F. I965 The photosynthetic activity of phytoplanktoni in East African lakes Int. Revue ges. Hydrobiol. Hydrogr. 50, 1-32.
Tallinig, J. F. 1969 The incidence of vertical mixing, and some biological and chemnical conse- quenices, in tropical African lakes. Verh. int. Verein. theor. angew. Limnol. 17, 998-1012.
Tlalling, J. F. 197I The underwater light climnate as a controlling factor in the production ecology of freshwater phytoplankton. Mitt. mnt. Verein. Limnol. 19, 214-243.
Uhlmann, D. 1971 Influence of dilution, sinkinig and grazing rate onl phytoplankton popula- tions of hyperfertilized ponds and mlicro-ecosysteins. Mitt. mnt. Verein. theor. angew. Limnol. 19, 100-124.
Viner, A. B. I970 Ecological cheonistry of a tropical Africani Lake. Ph.D. thesis, University of London.
Viner, A. B. I973 Responses of a iLixed phytoplankton population to nutrient enrichmrents of ammonia and phosphate, and some ecological implications. Proc. R. Soc. Lond. B 183, 351-370.
This content downloaded from 169.229.32.137 on Thu, 8 May 2014 07:21:28 AMAll use subject to JSTOR Terms and Conditions