a d-a246 822 usacerl technical n-92/07 1111111 li ... · a d-a246 822 usacerl technical report...
TRANSCRIPT
A D-A246 822 USACERL Technical Report N-92/07
1111111 li i 1111111111111111111 1111J n 1
Construction EngineeringResearch Laboratory
Operational Noise Data forOH-58D Army Helicopters
byL.J. BensonMichael J. WhiteKevin J. Murphy
The Army needs helicopter noise source emis-sion data for use in the Installation CompatibleUse Zone (ICUZ) program and for environmentalassessments. DTICThis research gathered noise source emission iTdata for the OH-58D helicopter. The data were N --normalized to 250 ft for use in noise maps. The AR 3 1, 199Zdata were also used to develop sound exposure IIlevel (SEL) versus distance curves for compari-son with other helicopter data.
The data show that the A-weighted maximum
noise level increases with airspeed for level flight,but the A-weighted SEL increases only slightly.The highest A-weighted maximum level wasproduced by the out-of-ground effect hover.Landings produced the largest A-weighted SEL.
Approved for public release; distribution is unlimited.
92-05246.... J 11 I N 11111 M~li IHIH| l I
The contents of this report are not to be used for advertising, publication,or promotional purposes. Citation of trade names does not constitute anofficial endorsement or approval of the use of such commercial products.The findings of this report are not to be construed as an officialDepartment of the Army position, unless so designated by other authorizeddocuments.
DESTROY TillS REPORT WHEN IT IS NO LONGER NEEDED
DO NOT RETURN IT TO THE ORIGINATOR

REPORT DOCUMENTATION PAGE Form ApprovedI OMB No. 0704-0188
Publi rc p ing burden for this collection of information is etinied to awerage 1 hour per response. including the time for reviewing instructions, searching existing data sources.gathiedng and maintaining the data needed, and conleing and reviewing the oallction of information. Send commnsnts regarding this burden estimate or any other aspect of thiscoleion of Informatiot% iding suggestions for redudng this burden, to Washington Headqualters Soerce. Directorate for Information Operations and Reports, 1216 Jefferson
Davis Highvway, Suite 1204. Arlington. VA 22202-4302. and to the Office of Management and Budget. Paperwork Reduction Project (0704-0188). Washington, DC 2050.
1. AGENCY USE ONLY (Leave Blank) 2. REPORT DATE 3. REPORT TYPE AND DATES COVERED
January 1992 Final4. TITLE AND SUBTITLE 5. FUNDING NUMBERS
Operational Noise Data for OH-58D Army Helicopters ReimbDODA 73-9-P6005
6. AUTHOR(S) dated June 1989and
L.J. Benson, M.J. Wiute, and K.J. Murphy 73-8-P6008dated October 1990
7. PERFORMING ORGANIZATION NAME(S) AND ADDRESS(ES) 8. PERFORMING ORGANIZATIONREPORT NUMBER
USACERLPO Box 9005Champaign, IL 61826-9005
9. SPONSORING/MONITORING AGENCY NAME(S) AND ADORESS(ES) 10. SPONSORING/MONITORINGAGENCY REPORT NUMBER
Army Materiel CommandArmy Helicopter Improvement Program4300 Goodfellow BlvdATTN: SFAE-AV-ASHSt. Louis, MO 63120-1798
11. SUPPLEMENTARY NOTES
Copies are available from the National Technical Information Service, 5285 Port Royal Road,Springfield, VA 22161.
12a. DISTRIBUTION/AVAILABILITY STATEMENT 12b. DISTRIBUTION CODE
Approved for public release; distribution is unlimited.
13. ABSTRACT (Maximum 200 words)
The Army needs helicopter noise source emission data for use in the Installation Compatible Use Zone(ICUZ) program and for environmental assessments.
This research gathered noise source emission data for the OH-58D helicopter. The data were normalized to250 ft for use in noise maps. The data were also used to develop sound exposure level (SEL) versusdistance curves for comparison with other helicopter data.
The data show that the A-weighted maximum noise level increases with airspeed for level flight, but the A-weighted SEL increases only slightly. The highest A-weighted maximum level was produced by the out-of-ground effect hover. Landings produced the largest A-weighted SEL.
14. SUBJECT TERMS 15. NUMBER OF PAGES
58OI1-58D helicopter 16. PRICE CODE
noise17. SECURITY CLASSIFICATION 18. SECURITY CLASSIFICATION 19. SECURITY CLASSIFICATION 20. LIMITATION OF ABSTRACT
OF REPORT OF THIS PAGE OF ABSTRACT
Unclassified Unclassified Unclassified SAR
NSN 7540-01-2805500 SWXmw Form298 (Pl. 2-W9)Peclbsd bm ANSI Bid 230-18
2011 102
FOREWORD
This research was conducted for the Army Materiel Command (AMC), Army HelicopterImprovement Program (AHIP) at St. Louis, MO, under Reimbursable Orders DODA 73-9-P6005 datedJune 1989 and 73-8-P6008 dated October 1990. The technical monitor was Ken Schaedler (PM AHIP).
The work was conducted by the Acoustics Team of the Environmental Division (EN) of the U.S.Army Construction Engineering Research Laboratory (USACERL). Dr. Paul D. Schomer is AcousticsTeam Leader. Dr. Edward W. Novak is Acting Chief of USACERL-EN. The USACERL technical editorwas Gloria J. Wienke, Information Management Office.
LTC E.J. Grabert, Jr. is Acting Commander of USACERL, and Dr. L.R. Shaffer is Director.
2
CONTENTSPage
SF298 1FOREWORD 2LIST OF TABLES AND FIGURES 4
1 INTRODUCTION .................................................... 5BackgroundObjectivesApproachMode of Technology Transfer
2 DATA COLLECTION ................................................. 7Helicopter OperationsMicrophone PlacementMeasurement InstrumentationGround Tracking SystemCalibration
3 DATA REDUCTION AND ANALYSIS ..................................... 11Camera DataAcoustical Signal AnalysisElectronic CalibrationOperation of the RTAHover Signal AnalysisFlyover Signal AnalysisSpectral Normalization
4 RESULTS .......................................................... 16One-third Octave SpectraA-weighted Sound Levels Versus DistanceSound Exposure Level Versus Speed
5 SUM MARY ......................................................... 29
METRIC CONVERSION TABLE 29
APPENDIX A: Pilot's Log for OH-58D 31APPENDIX B: One-third Octave Band Data Normalized to 250 ft 47APPENDIX C: Sideline Decay Predictions 51
DISTRIBUTION" , Acoession ?or
NTIS GP 0])TIC T iiUIa,:n ruanced -Ju tiflcatlo
ByDi st r ibut 1on/
3Aviailability Codes
Avail and/or
Dist Spe c 18

TABLES
Number Page
1 Operations for Data Sets 1 Through 4 8
2 Operations for Data Sets 5 Through 8 9
FIGURES
1 Test Site Layout 10
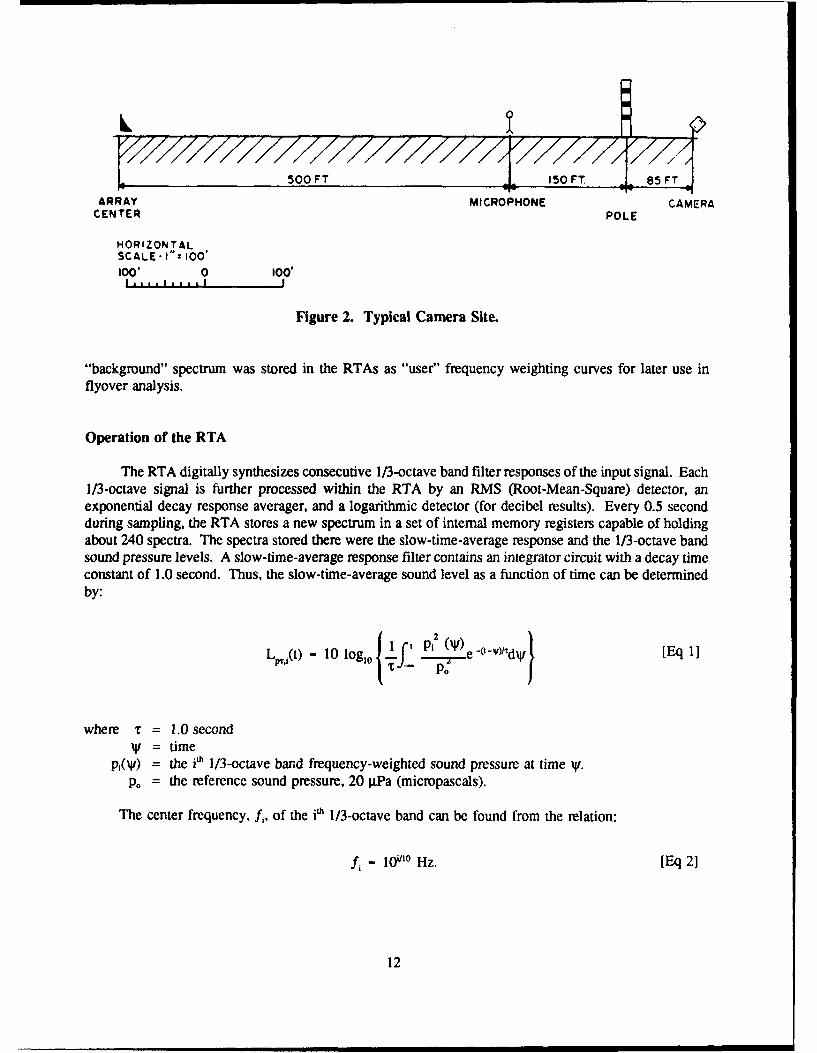
2 Typical Camera Site 12
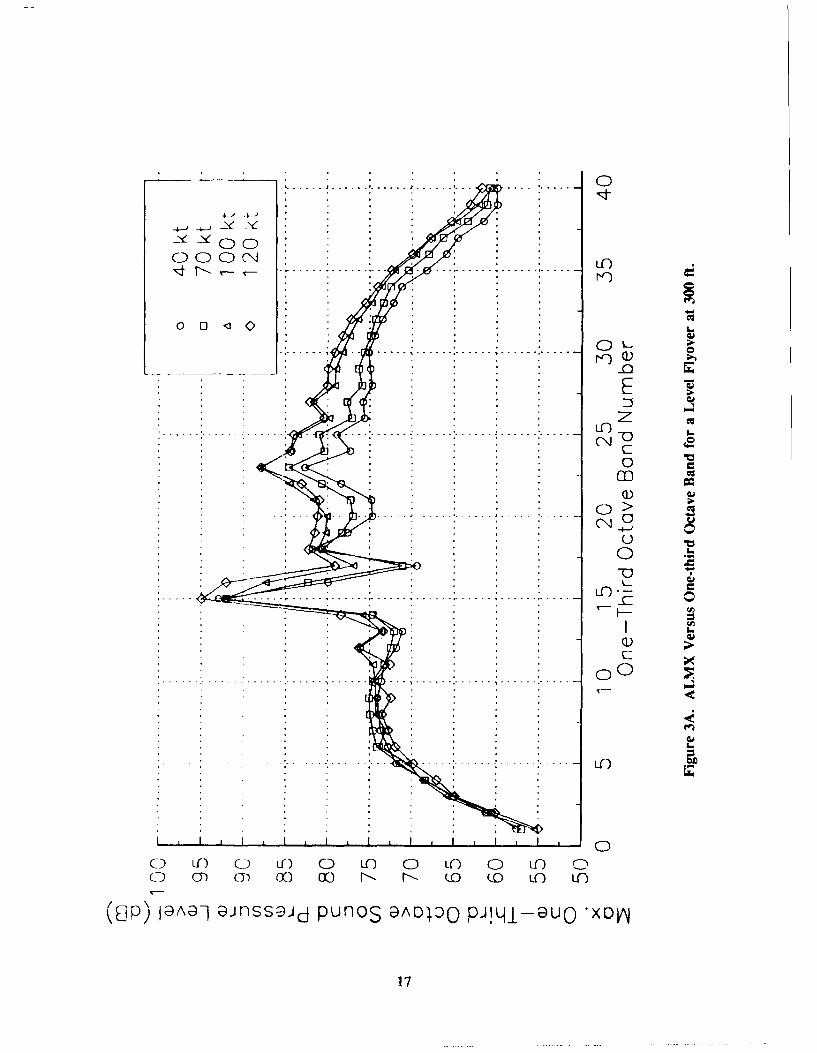
3A ALMX Versus One-third Octave Band for a Level Flyover at 300 ft 17
3B ALMX Versus One-third Octave Band for a Level Flyover at 1000 ft 18
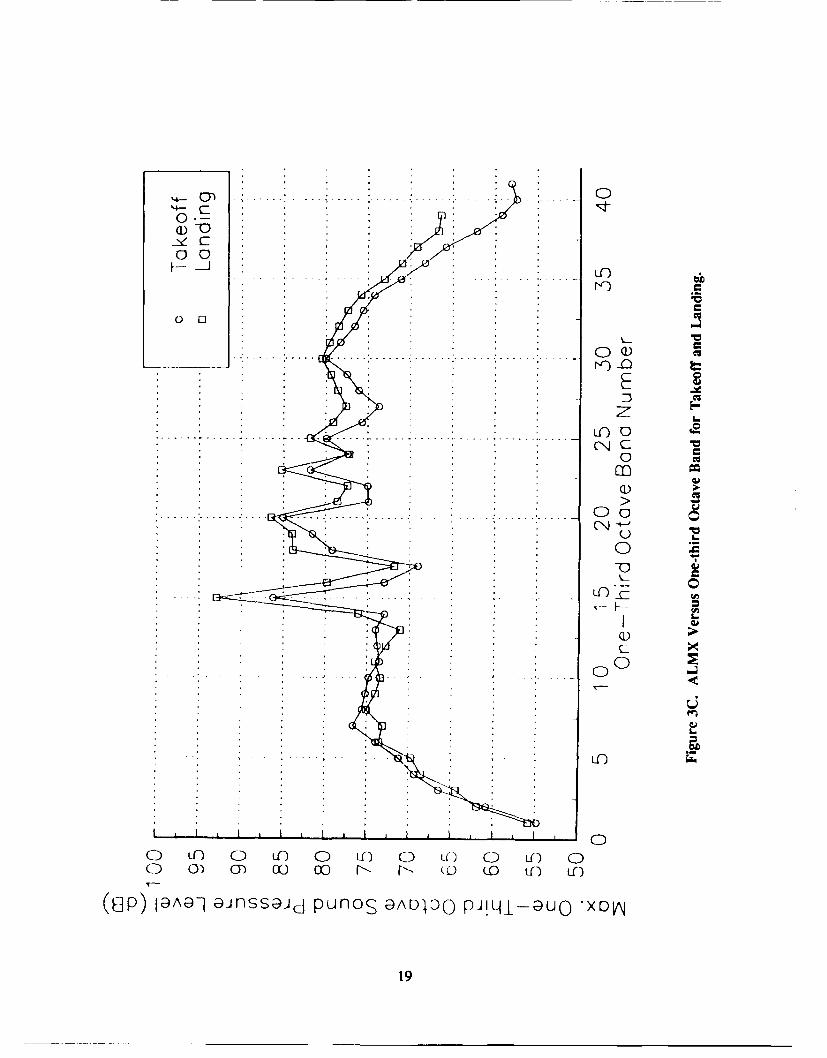
3C ALMX Versus One-third Octave Band for Takeoff and Landing 19
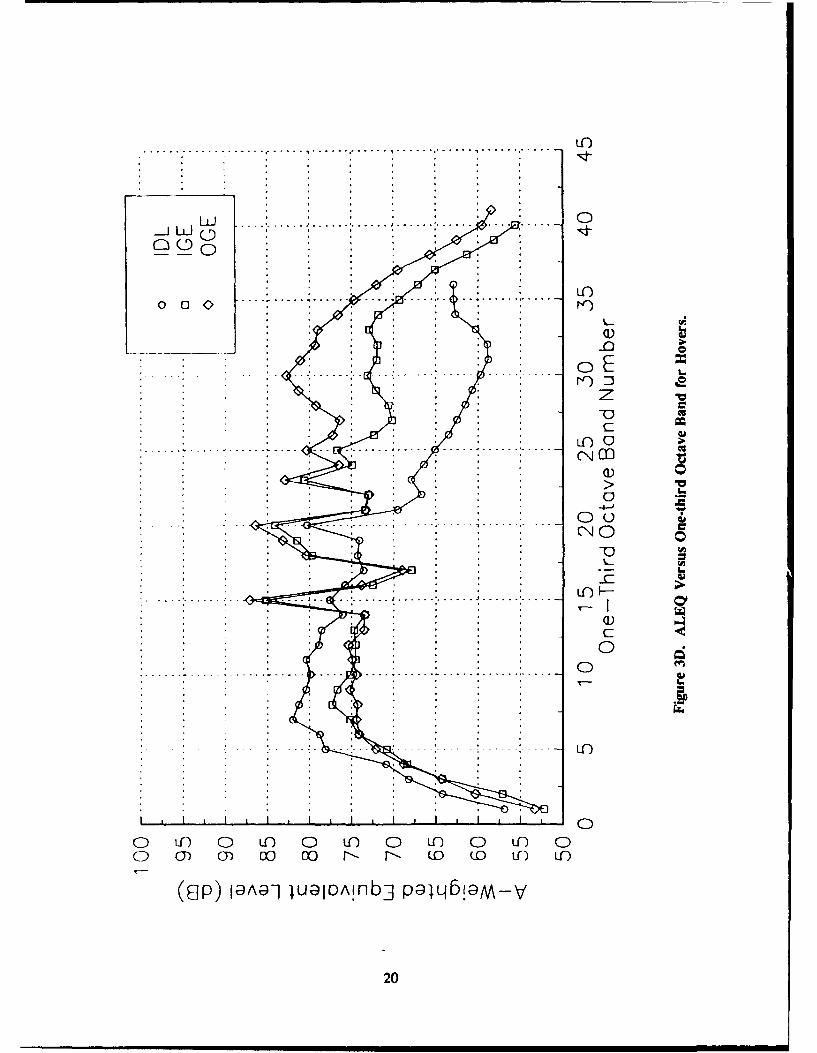
3D ALEQ Versus One-third Octave Band for Hovers 20
4A ALMX Versus Slant Distance for a Level Flyover at 300 ft 21
4B ALMX Versus Slant Distance for a Level Flyover at 1000 ft 22
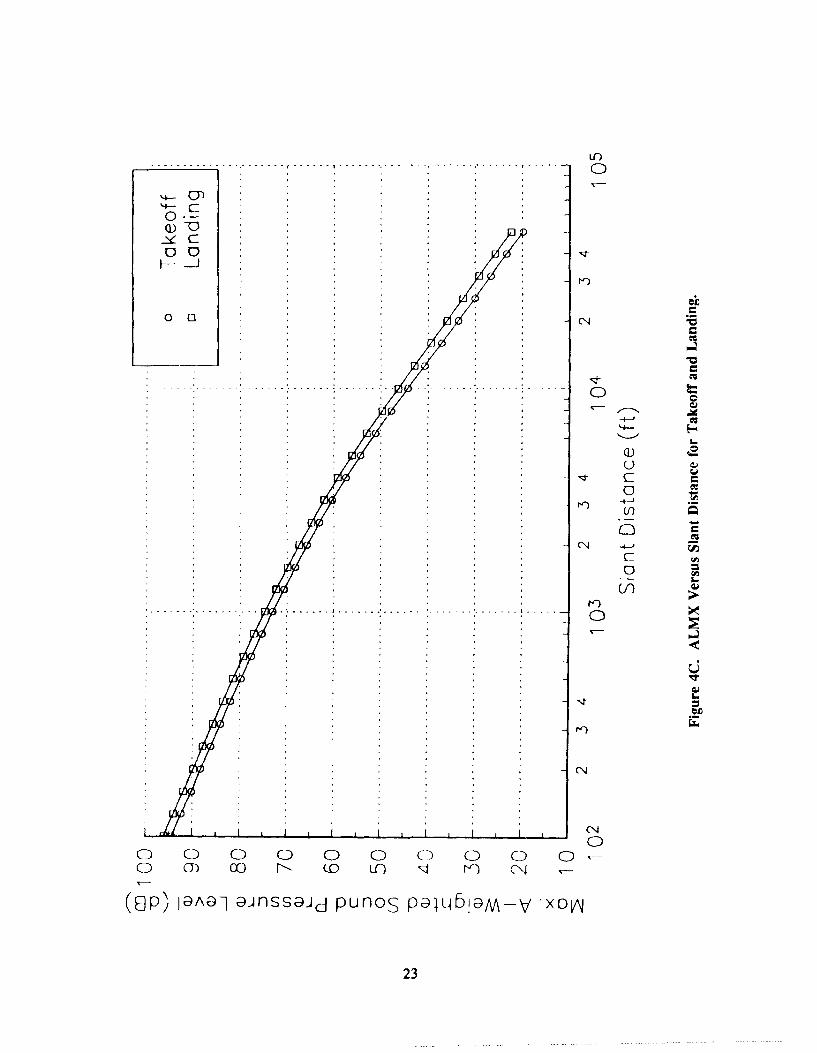
4C ALMX Versus Slant Distance for Takcoff and Landing 23
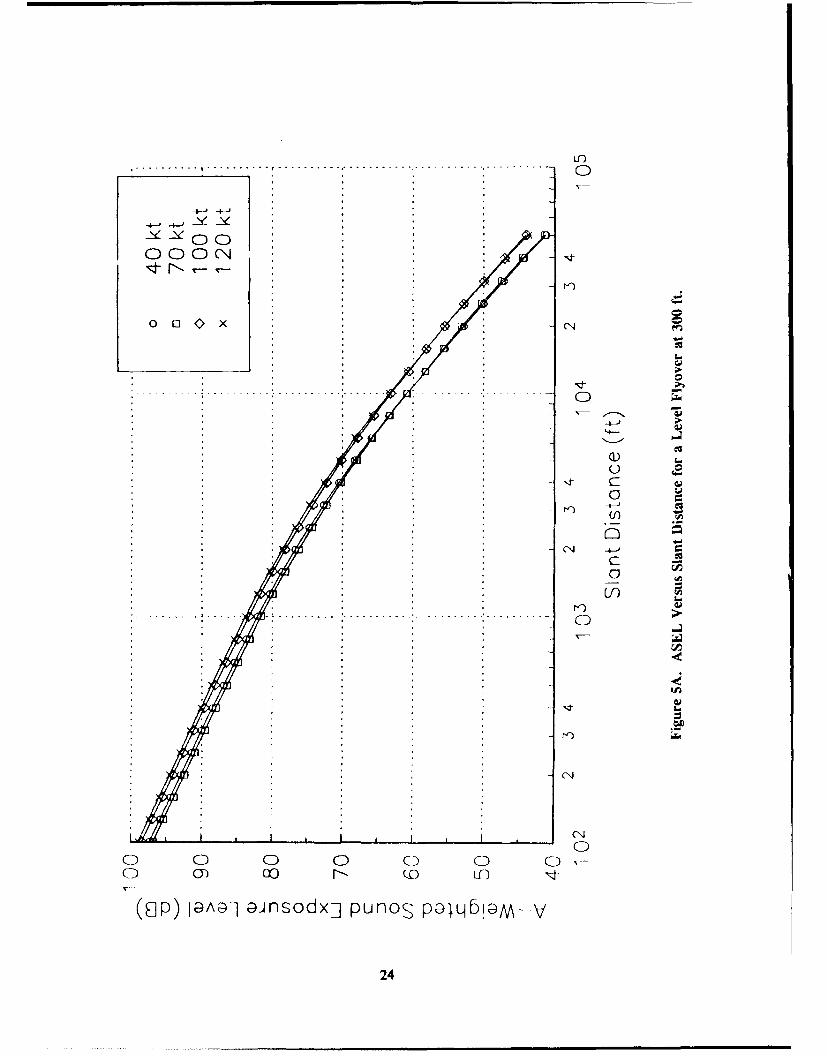
5A ASEL Versus Slant Distance for a Level Flyover at 300 ft 24
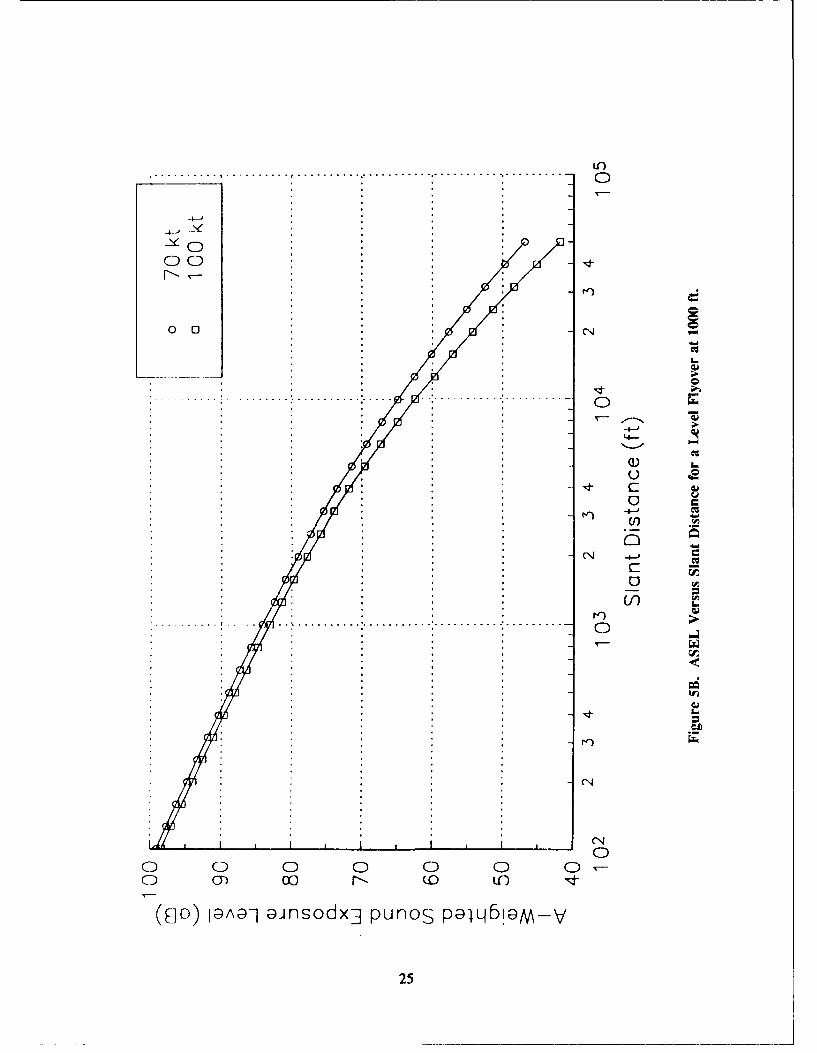
5B ASEL Versus Slant Distance for a Level Flyover at 1000 ft 25
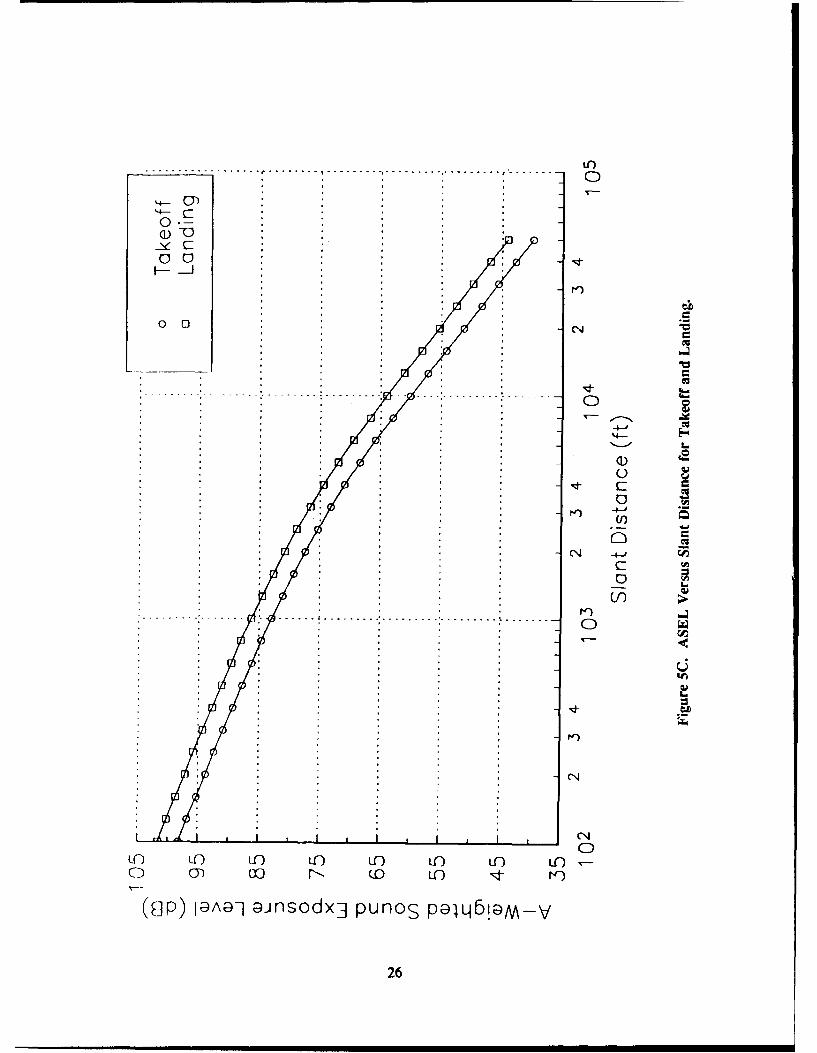
5C ASEL Versus Slant Distance for Takeoff and Landing 26
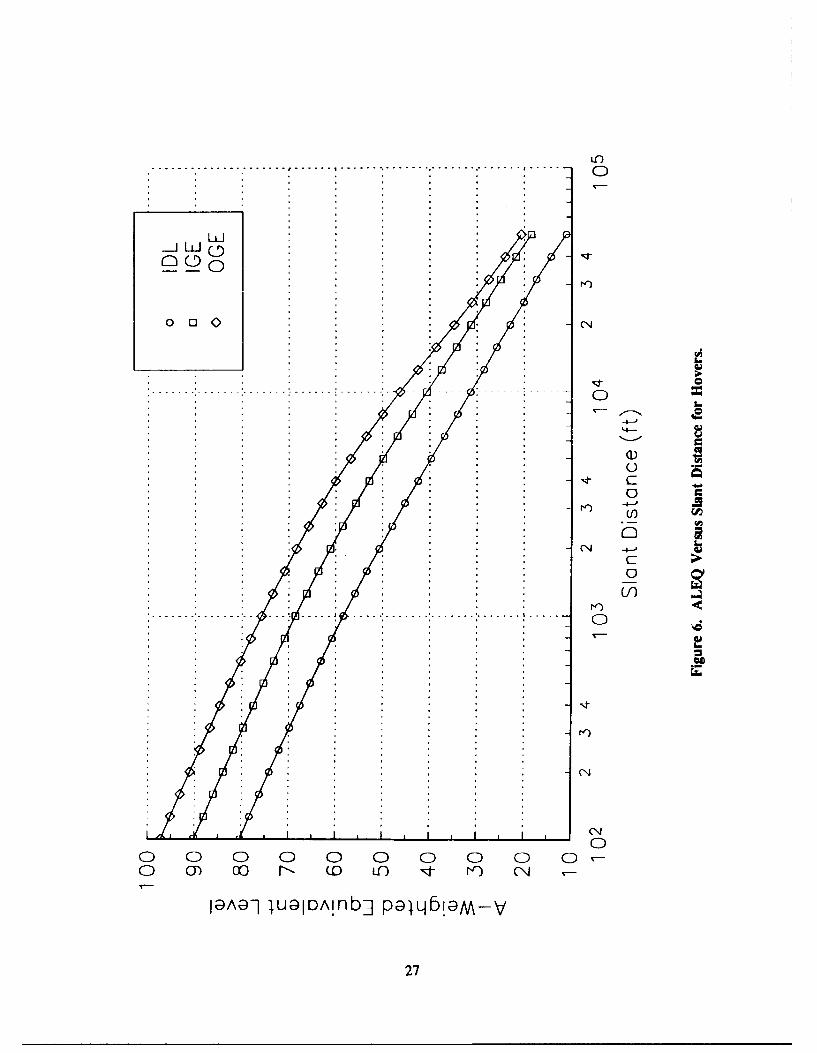
6 ALEQ Versus Slant Distance for Hovers 27
7 Sound Level Versus Airspeed for ALMX and ASEL 28
4

OPERATIONAL NOISE DATA FOR OH-58D ARMY HELICOPTERS
1 INTRODUCTION
Background
Research at the U.S. Army Construction Engineering Research Laboratory (USACERL) on Armynoise problems has centered on predicting and assessing the effect of noise on and adjacent to Armyfacilities. Blasts, vehicles, fixed sources, and rotary-winged aircraft have been identified as the majornoise problems. With the increased pressure of residential development, the Army has instituted theInstallation Compatible Use Zone (ICUZ) program.1 Like the Department of Defense's (DOD)Construction Criteria manual and Air Installations Compatible Use Zone (AICUZ) program, the ICUZprogram defines land uses compatible with various noise levels and establishes a policy for achieving suchuses.2 These documents describe three noise zones that restrict land use in varying degrees to ensurecompatibility with military operations. The ICUZ program stresses the Army unique noise sources suchas blasts and rotary-winged aircraft.
The ICUZIAICUZ programs use source emission data with sound propagation and human/community response data to generate noise zone maps. The OH-58D helicopters were added to theArmy's inventory after the previous investigations3; their noise emission data are required by the Armyfor ICUZ and environmental assessment.
Objectives
The objectives of this study were to gather "close-in" (within 500 ft) noise source emission dataon the OH-58D helicopter, to normalize this source spectra to 250 ft for use in noise maps, and to developsound equivalent level (SEL) versus distance curves for comparison with other helicopter data.
Approach
Previous research studied the repeatability of rotary winged aircraft source emissions and presentedrecommendations for statistical validity and a revised microphone layout for data gathering. That revised
Army Regulation (AR) 200-1. Environmental Protection and Enhancement, Chapter 7 (U.S. Army Corps of Engineers[USACE], 15 June 1982).
2 DOD 4270.1-M, Construction Criteria (Department of Defense [DOD], 1972); DOD Instruction 4165-57. Air Installations
Compatible Use Zones (DOD, 1973).P.D. Schomer, Aaron J. Averbuch, and Richard Raspet, Operational Noise Data for the UH60A and CH47C Army Helicopters,Technical Report N-131/ADA118796 (U.S. Army Construction Engineering Research Laboratory [USACERL], June 1982);PD. Schomer, et. al., Operational Noise Data for CH-47D and AH.64 Army Helicopters, Technical Report N-88/04/ADA191059 (USACERL, June 1982).A metric conversion table is provided on page 29.Ri. Homans, L. Little, and P. Schomer. Rotary Wing Aircraft Operational Noise Data, Technical Report N-38/ADA051999(USACERL.1978); PD. Schomer, Rotary-Winged Aircraft Noise Measurements: Analysis of Variations and ProposedMeasurement Standards, Technical Report N-184/ADA146207 (USACERL, September 1984).
5
layout and recommended methodology were used to measure noise emissions of OH-58D helicopters atHigh Bluff Field, Fort Rucker, AL.
Mode of Technology Transfer
The data developed for the OH-58D helicopter will be entered in the Integrated Noise ContourSystem data base and will be immediately available for use by the Army Materiel Command, U.S. ArmyEnvironmental Hygiene Agency, and other DOD organizations.
6
2 DATA COLLECTION
Helicopter Operations
The OH-58D noise measurements, recorded at Fort Rucker, AL, were based on tie dynamicoperations listed in Tables I and 2. In all, 8 sets of up to 31 operations were measured and recorded over4 days of testing (26 and 27 October and 14 and 15 November 1989). Cameras with graduated poles asreferences were used to determine the position of the helicopter (accurate to ± I ft) as it flew over thecenter of the microphone array. Figure 1 shows the layout at Fort Rucker, AL.
The helicopter performed level flyovers (LFOs) at 40 knots, 70 knots, 100 knots, and maximumspeed at 300 ft above ground level (AGL) and at 70 knots and 100 knots at 1000 ft AGL. The groundat the center point of the circular microphone array was designated as 0 ft AGL. In-ground-effect (IGE)hovers and out-of-ground-effect (OGE) hovers and zero-pitch engine idle operations were also executedabove the center point of the microphones.
The pilots were instructed to maintain straight, level, steady flight for at least 1.5 nautical miles(nmi) away from the measurement microphones. All teardrop turns, other ancillary maneuvers, andpreparations for actual dynamic operation were performed beyond 1.5 nmi. Maneuvering at this distanceallowed the pilot to stabilize the aircraft and provided enough time and distance for 10-decibel (dB) down-points to be measured and recorded on magnetic tape when the operation was level flyovers. The first10-dB down-point is the first time the A-weighted signal increases to within 10 dB of the maximum A-weighted sound level of the entire flyover. The last 10-dB down-point is the last time the A-weightedsignal decreases minus 10 dB below the maximum A-weighted sound level. Landings began at 300 ftAGL with the aircraft facing into the wind and terminated at the center of the microphone array.
Static operations consisted of zero-pitch engine idle, IGE and OGE hovers. These measurementswere performed over a grassy area at the center of the microphone array. IGEs were performed with theaircraft at a stabilized position between 1 and 5 ft above the ground. OGEs were performed at 1.5 rotordiameters AGL.
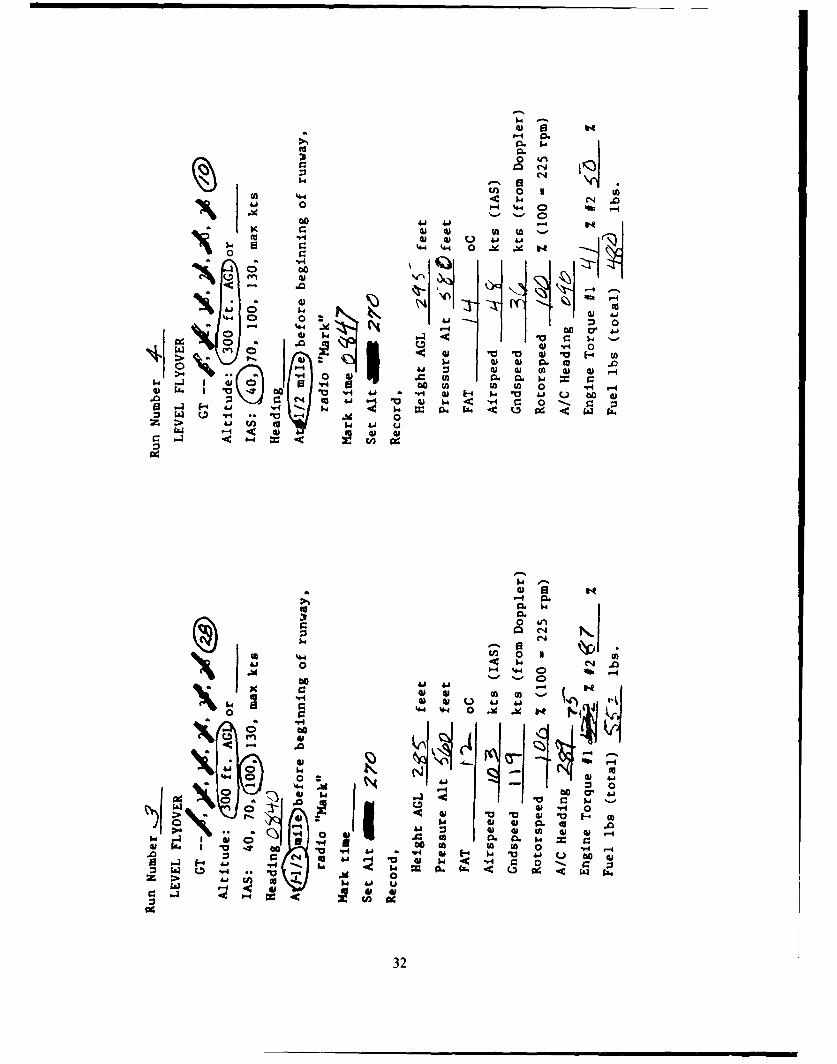
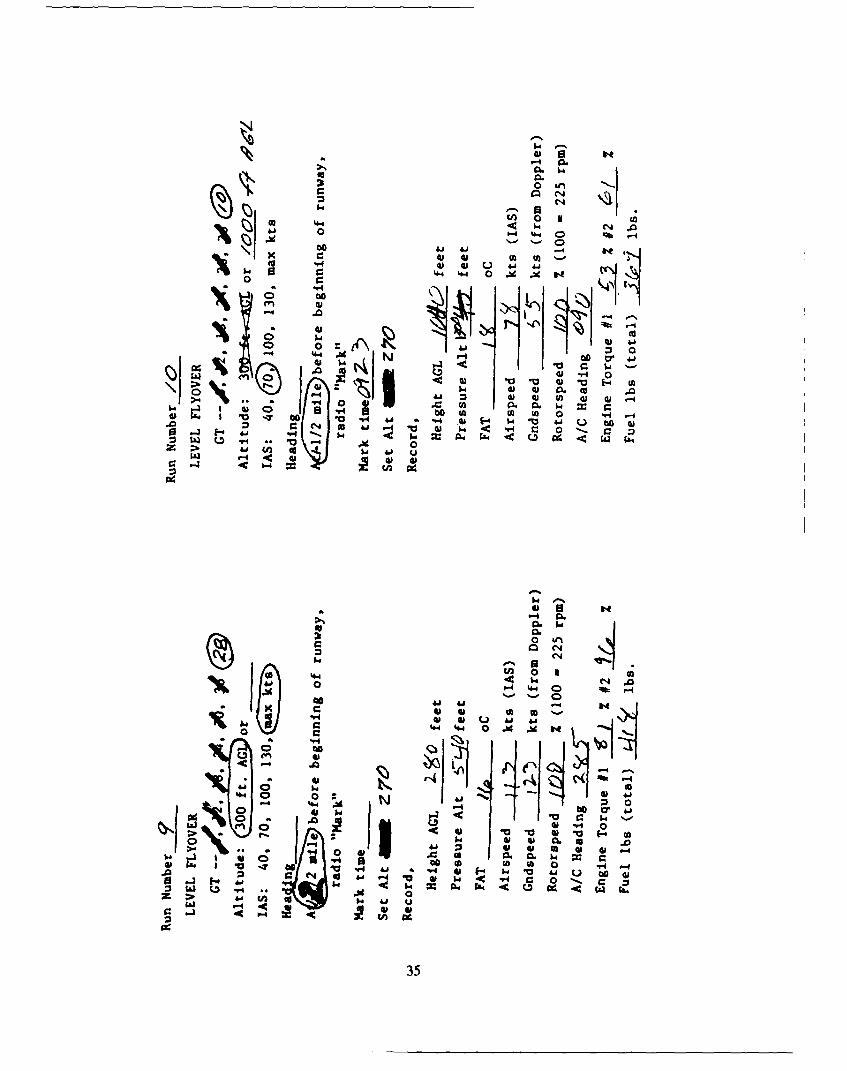
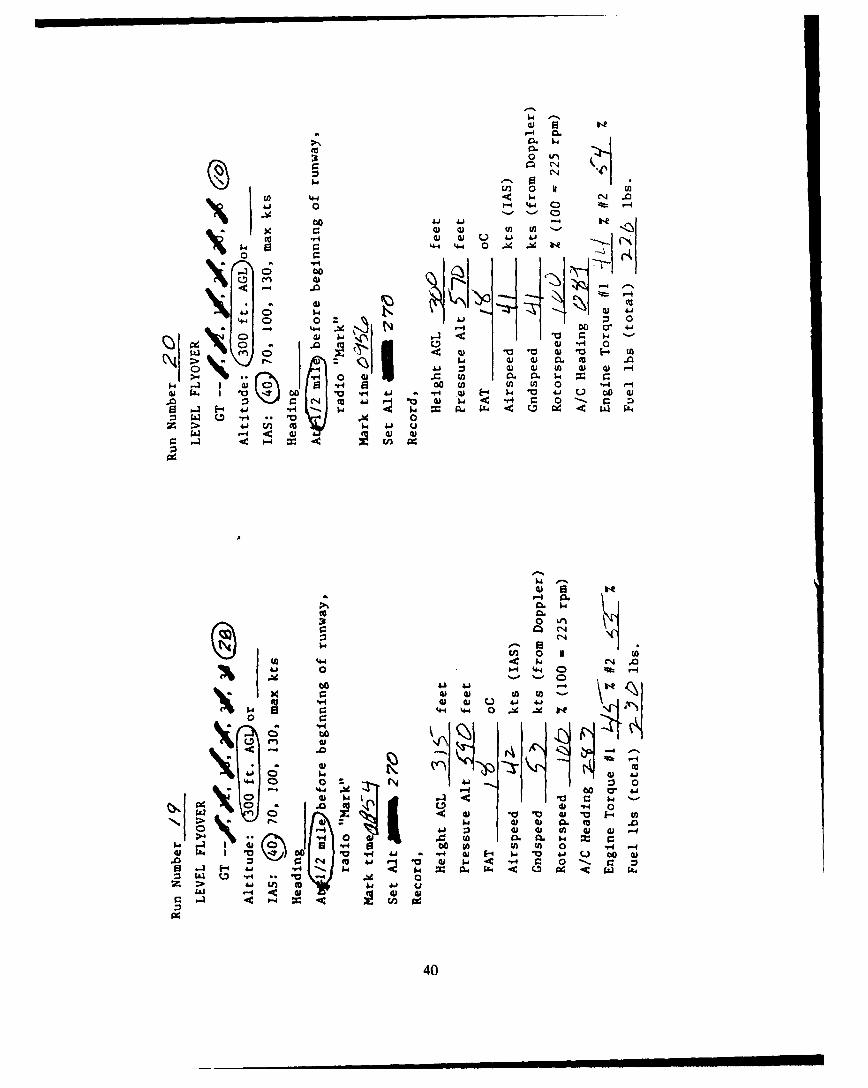
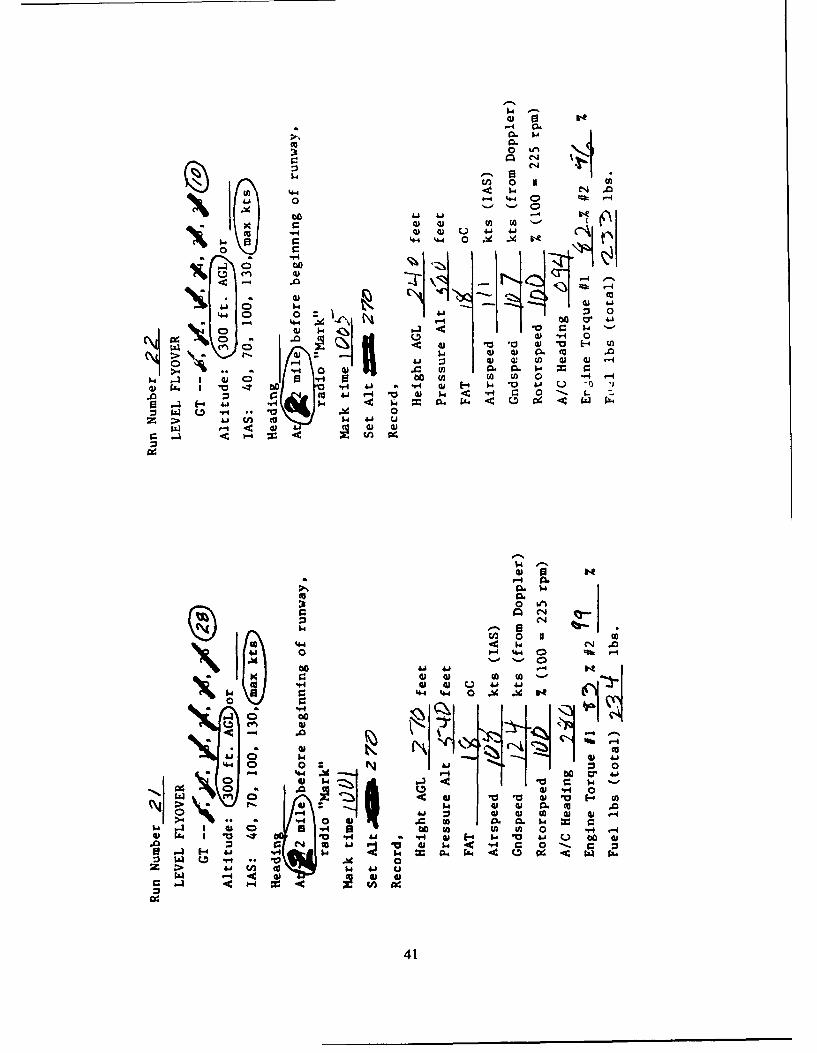
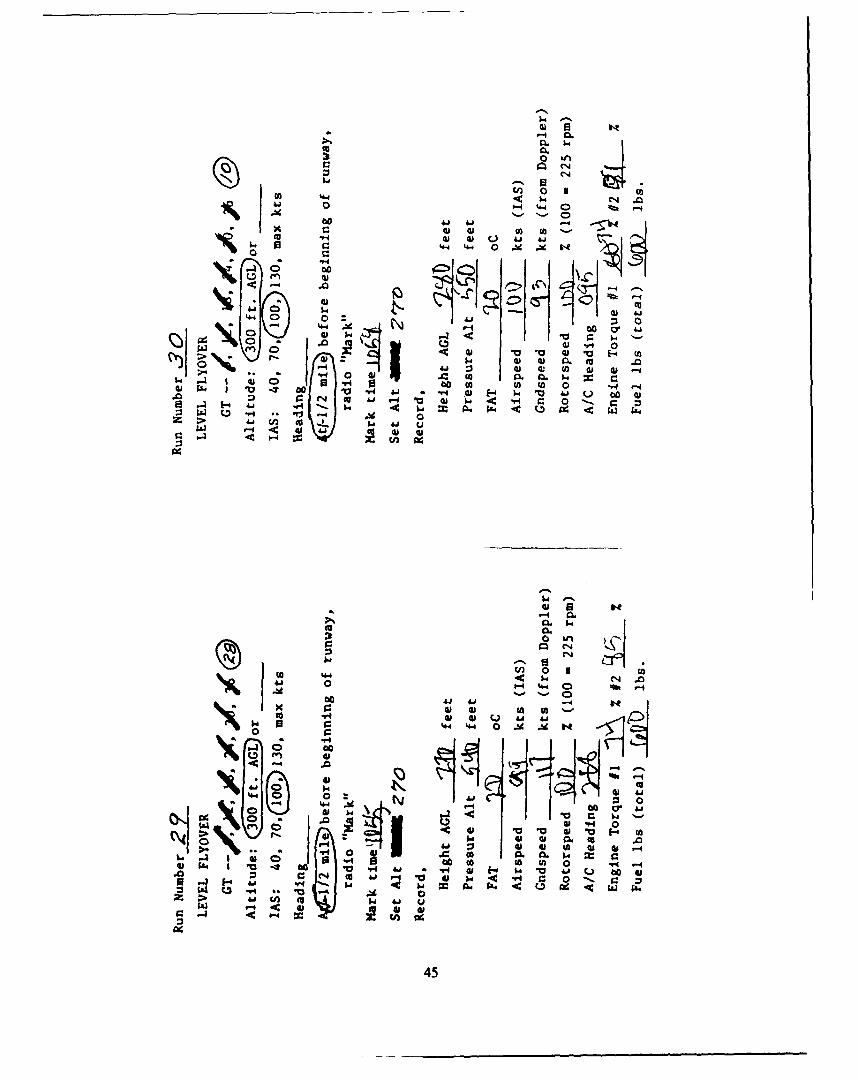
The pilot of each flight logged all helicopter operations information. Typical log entries are shownin Appendix A.
Microphone Placement
The layout for the six microphones is shown in Figure 1. This arrangement allows adjustment ofthe helicopter flight path depending on the wind direction. The microphone elements were 4 ft high and500 ft from the center of the circle at 60-degree intervals so that two microphones were directly under-neath the flight path and the other four were at equal distances (500 ft'sin 60 degrees = 433 ft) to eitherside of the flight path. The slant (closest approach) distance from the helicopter operating at 300 ft AGL,to the microphone is 527 ft. To better compare with previous measurements, it would have been desirableto arrange the sideline microphones at a slant distance 500 ft away from the flight path; however, therequisite 462 ft diameter array would have placed some microphones above hard surfaces at the FortRucker site, hence the choice of the 500 ft diameter array.
7

Table 1
Operations for Data Sets 1 Through 4
Run Number Operation Altitude (ft) Speed(knots)
1 Takeoff (TKF) 300 402 & 3 Level flyover (LFO) 300 1004 & 5 LFO 300 406 & 7 LFO 300 708 & 9 LFO 300 Max
10& 11 LFO 1000 7012 & 13 LFO 300 100
14 Landing (LND) 300 4015 Idle 0 016 IGE 2 017 OGE 50 018 TKF 300 40
19 & 20 LFO 300 4021 & 22 LFO 300 Max23 & 24 LFO 1000 7025 & 26 LFO 300 10027 & 28 LFO 300 7029 & 30 LFO 300 100
31 LND 300 40
Measurement Instrumentation
The acoustical instrumentation consisted of six B&K 4149 quartz-coated, 1/2-in. microphones on B&K4921 outdoor microphone systems with windscreens. The sound pressure from each operation wasrecorded through the microphones onto Digital Audio Tape (DAT) using Panasonic SV-250 recorders.The six microphones were connected above ground, using electronically balanced and shielded twisted paircabling, to a truck modified to be a mobile field acoustics laboratory.
Ground Tracking System
Cameras were used to mark the position of the aircraft when it flew over the middle of themicrophone array. These cameras focused on uniformly graduated poles mounted in the line of sight tothe center of the array and elevated to frame the aircraft over the array center at 300 ft AGL. Positioninformation was determined by examining the photographs, which showed the aircraft from the twocamera positions simultaneously. Three camera locations were chosen such that two of three camerasalways framed a clear picture of the helicopter without interference from the sun. Use o.l ,ne radar
8
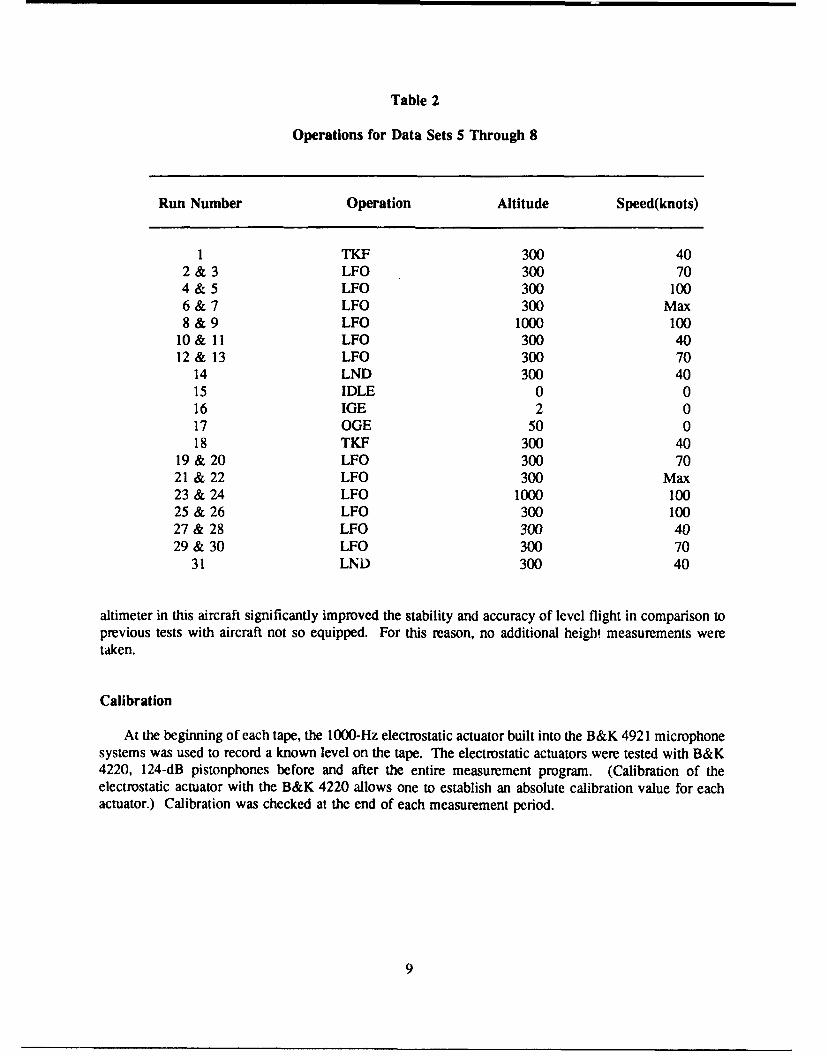
Table 2
Operations for Data Sets 5 Through 8
Run Number Operation Altitude Speed(knots)
I TKF 300 402 & 3 LFO 300 704 & 5 LFO 300 1006 & 7 LFO 300 Max8 & 9 LFO 1000 100
10& 11 LFO 300 4012 & 13 LFO 300 70
14 LND 300 4015 IDLE 0 016 IGE 2 017 OGE 50 018 TKF 300 40
19 & 20 LFO 300 7021 & 22 LFO 300 Max23 & 24 LFO 1000 10025 & 26 LFO 300 10027 & 28 LFO 300 4029 & 30 LFO 300 70
31 LND 300 40
altimeter in this aircraft significantly improved the stability and accuracy of level flight in comparison toprevious tests with aircraft not so equipped. For this reason, no additional height measurements weretaken.
Calibration
At the beginning of each tape, the 1000-Hz electrostatic actuator built into the B&K 4921 microphonesystems was used to record a known level on the tape. The electrostatic actuators were tested with B&K4220, 124-dB pistonphones before and after the entire measurement program. (Calibration of theelectrostatic actuator with the B&K 4220 allows one to establish an absolute calibration value for eachactuator.) Calibration was checked at the end of each measurement period.
9

ZVI
'flow-
-I0
3 DATA REDUCTION AND ANALYSIS
Camera Data
The graduated pole in the foreground of each photograph allowed calculation of altitude and lateralvariation over the center of the flight track because the camera angle, distance to the pole, and distancebetween graduations on the pole were known (Figure 2).
Negatives of each helicopter were projected on the screen of a microfiche reader, measurementswere taken in relation to the pole, and data were encoded into a microcomputer for further calculation andanalysis. Given the information supplied by the pictures, algorithms were written that located thehelicopter in three dimensions at the time the cameras were activated. The slant distance to each of thesix microphones in the array was calculated based on the position of the helicopter in space and itsforward direction.
Acoustical Signal Analysis
Much of the acoustical analysis performed on the signals was accomplished under automated controlof four (two dual-channel and two single-channel) Larson Davis model 3100 Real Time Analyzers (RTAs).Each RTA was programmed to sample the microphone signals throughout a given helicopter operationor maneuver (e.g., flyover, hover) and internally store 1/3-octave band sound pressure levels for every 0.5second of the operation. At the end of each operation, each RTA scanned its stored spectra and performedfurther processing according to the specific type of flight operation being performed. For all motionlessoperations (i.e., hovers and engine idlings), the RTA reported average spectral levels; for all other flights(i.e., take-offs, flyovers, and landings), the RTA reported maximum and average spectra to the controllingcomputer. The spectra were then "adjusted" to compensate for measurement (or flight) conditions thatdiffered from an ideal standard and were averaged by operation type. The average reference spectra wereused to predict the A-weighted sound level as a function of distance from the operation.
Electronic Calibration
The band-to-band response of the RTAs was equalized before the measurements by running eachof the RTAs through autocalibration for approximately 10 minutes. In autocalibration, the RTA uses aninternal pink noise source for its input and adjusts the 1/3-octave band levels so they report an equalenergy response per unit frequency between bands.
The entire electronic system was then calibrated at I kHz by adjusting the value displayed by theRTA for the calibration tone to match the known microphone calibrator level (90 dB for all newmicrophone units and approximately 90 dB for recalibrated microphones). The RTAs automatically scaledall other 1/3-octave bands by the same factor. This procedure assumes that all other equipment in themeasurement and recording system had a flat response over the frequency range 10 Hz to 10 kHz.
Indeed, manufacturer's specifications indicate a flat equipment response within a 2 dB tolerance,but researchers did not perform rigorous tests to prove this. The electronic system noise and ambientacoustic noise was sampled and analyzed by the same procedures used for static flight operations, i.e., forhovers and idle, with the aircraft far away from the test site. Before each set of tests the average
II
50 T150 FT0 85 IF T
ARRAY MICROPHONE CAMERACENTER POLE
HORIZONTALSCALE-I": I00'
I00o 0 100'I,,. .1.. * I I
Figure 2. Typical Camera Site.
"background" spectrum was stored in the RTAs as "user" frequency weighting curves for later use inflyover analysis.
Operation of the RTA
The RTA digitally synthesizes consecutive 1/3-octave band filter responses of the input signal. Each1/3-octave signal is further processed within the RTA by an RMS (Root-Mean-Square) detector, anexponential decay response averager, and a logarithmic detector (for decibel results). Every 0.5 secondduring sampling, the RTA stores a new spectrum in a set of internal memory registers capable of holdingabout 240 spectra. The spectra stored there were the slow-time-average response and the 1/3-octave bandsound pressure levels. A slow-time-average response filter contains an integrator circuit with a decay timeconstant of 1.0 second. Thus, the slow-time-average sound level as a function of time can be determinedby:
L.(t) - 10 logo If, "-2- () td0lI [Eq 1]
where T = 1.0 secondxV = time
Pi(V) = the ih 1/3-octave band frequency-weighted sound pressure at time W.p. = the reference sound pressure, 20 IiPa (micropascals).
The center frequency, fi, of the it 1/3-octave band can be found from the relation:
A - 10i'l° Hz. [Eq 2]
12

Hover Signal Analysis
For static operations, the RTAs were programmed to store slow-time-averaged 1/3-octave bandsound pressure levels in the internal registers and perform "energy averages" Log-Mean-Antilog (LMA)averages of the bands over the entire measurement interval (usually 60 seconds). The LMA average maybe written:
LAV -10 logo - L/1 [Eq 3]
where N = the number of levels L, to be averagedj = a particular 1/2 second of the measurement interval.
Note that an LMA average of sound pressure levels is equivalent to an average RMS pressure andtherefore represents the same measure of energy as an RMS pressure average. The average spectra werereported to and stored on the controlling computer.
Flyover Signal Analysis
During the flyover measurements, the RTAs were triggered to begin and end sampling data atspecified times and positions along the flight. Under control of the "Pass-by" program (contained inread-only-memory chips in the RTAs), the maximum slow-time-average 1/3-octave band spectrum andthe average level per band between the minus 10 dB times was determined. The Pass-by program appliedboth "user" and A-weighting frequency response curves to each 1/2 second spectrum and summed thespectral components to obtain an estimate of the true slow-time-average signal level every 1/2 second.The program searched these values of the slow A-weighted signal to find the 1/2 second time for whichthe signal reached its maximum value and the time before and after maximum at which the signal fell tomore than 10 dB below maximum. The unweighted spectrum for this maximum 1/2 second was reportedto the controlling computer. The Pass-by program further performed an LMA average over the spectralying between the minus 10 dB times. This LMA spectrum was also reported to the controllingcomputer, along with the time interval between the minus 10 dB times.
Spectral Normalization
Many things affect helicopter sound emissions and the transmission of those sounds to listeners onthe ground. Environmental conditions (e.g., temperature, wind, etc.) typically vary from test to test andfrom run to run in any given set of measurements. The precise flight speed, altitude, and flight path alsovary between flights within the same operational category. However, the spectra obtained from thesemeasurements should be relatively free from the effects of nonstandard environmental conditions or non-ideal flight along the target track; it should represent a true measure of the noise emissions of a particularhelicopter operating within some standard set of conditions, environment, and distance. The FederalAviation Association (FAA) regulations5 for noise certification of fixed-wing aircraft provide guidelines
Federal Aviation Regulaions, Part 36 Noise Standards, "Aircraft Type and Airworthiness Certification" (U.S. Department ofTransportation. June 1974).
13
for adjusting a spectrum from measurement conditions to "standard" conditions. Many of the proceduresoutlined in that document have been followed in developing helicopter source spectra for this research.Where possible, the FAR Part 36 requirements have been met or exceeded; however, some extensions tothe standard were necessary to obtain reliable results. For example, the guidelines specify that the analysisequipment for noise levels have an operating frequency range of 50 Hz to 10 kHz, but the main bladepassage frequency of the OH-58D, thus most of its acoustic energy, lies below 50 Hz.
Compensation for nonideal measurement and flight conditions was made with a simple soundpropagation model. In this model, the sound pressure at a particular frequency is assumed to decreasewith distance from a point source of sound, according to:
pecexp(-ctr)/r [Eq 4]
where a = the molecular sound absorption coefficient at frequency fr = the distance between source and field points.
The molecular absorption coefficient for air depends on the frequency of the sound waves and on thetemperature, relative humidity, and pressure of the air.
As implemented, this model was applied to the maximum spectrum received by the microphone.It was assumed that the received spectrum was emitted by the helicopter at the instant it passed throughthe point of closest approach to the microphone. The positioning information obtained from cameraphotographs was used to locate a flight path parallel to the target flight path, but offset vertically andhorizontally. The closest point of approach for each microphone was determined from the offset path, andthe distance to that path was used as the slant range (r) in the above relation.
To standardize any measured spectrum, the effects of propagation under measurement conditionsmust be "removed" and the effects of propagation under standard conditions must be "applied" to thespectrum. Using this procedure, the sound pressure per band in the i? 1/3-octave band is given by:
P- " Pi rexQ r-a'ir') [Eq 51
where r = the slant distance%. = the molecular absorption coefficient for the ith 1/3-octave band.
In the above, all of the primed variables refer to quantities at standard conditions, and the unprimedquantities refer to measurement conditions.
Note that this sound propagation model does not provide for any reflections or sound absorption bythe ground. Also missing from the above model are any effects on sound propagation due to atmosphericrefraction or atmospheric turbulence. At the short distances used in these source measurements, it is notlikely that atmospheric refraction or turbulence has a great effect on sound propagation. The reflectionproperties of the ground are fairly significant for individual frequency components of sound waves, butare less significant for 1/3-octave, or other broadband measures of acoustic energy. At longer distances,
14
such as those used in predicting noise in communities around airports, the ground reflection, atmosphericrefraction, and turbulence become extremely important.
The only corrections to the measured spectra for nonideal conditions involve the propagation ofsound from the helicopter to the microphone. No attempt was made in this research to assess the changesin acoustic power output by the helicopter due to the differences between the test environment and thestandard environment. Such differences might include changes in heading or attitude due to flying in thepresence of wind or changes in blade pitch to provide the same thrust at higher temperatures.Furthermore, throughout each test, the helicopters became lighter as they burned fuel. The fuel remainingin the tanks was logged for each flight, but no compensation was made in the analysis for the weightdifferences between flights. All of these factors have been considered for future inclusion in the analysisprocedure, but have been ignored in this analysis.
A large sample size may justify ignoring environmental effects on source emissions in some cases.For instance, a given factor may either enhance or reduce the sound power, depending on the environment,but when a large number of tests are performed, the average contribution may be small due to the varietyof conditions in the sample. A potentially useful method for assessing the importance of environmentaleffects of the gathered data is to examine the scatter in the data. One measure of the scatter is the energyvariance of the sound levels, given by:
No2 E I 10L__0 _ 10L10go}2 [Eq 6]
The size of the scatter may be compared with the energy average level of the data by expressing theenergy variance in decibels, via:
Lv'W - 10 loglo a [Eq 7]
If, for instance, the value of LVAR is significantly below LAV (i.e., 10 dB or more) the scatter in the datado not significantly affect the estimate of LAv. Of course, it is still possible that the environmental factorswere left unaccounted for by the propagation model.
15

4 RESULTS
One-third Octave Spectra
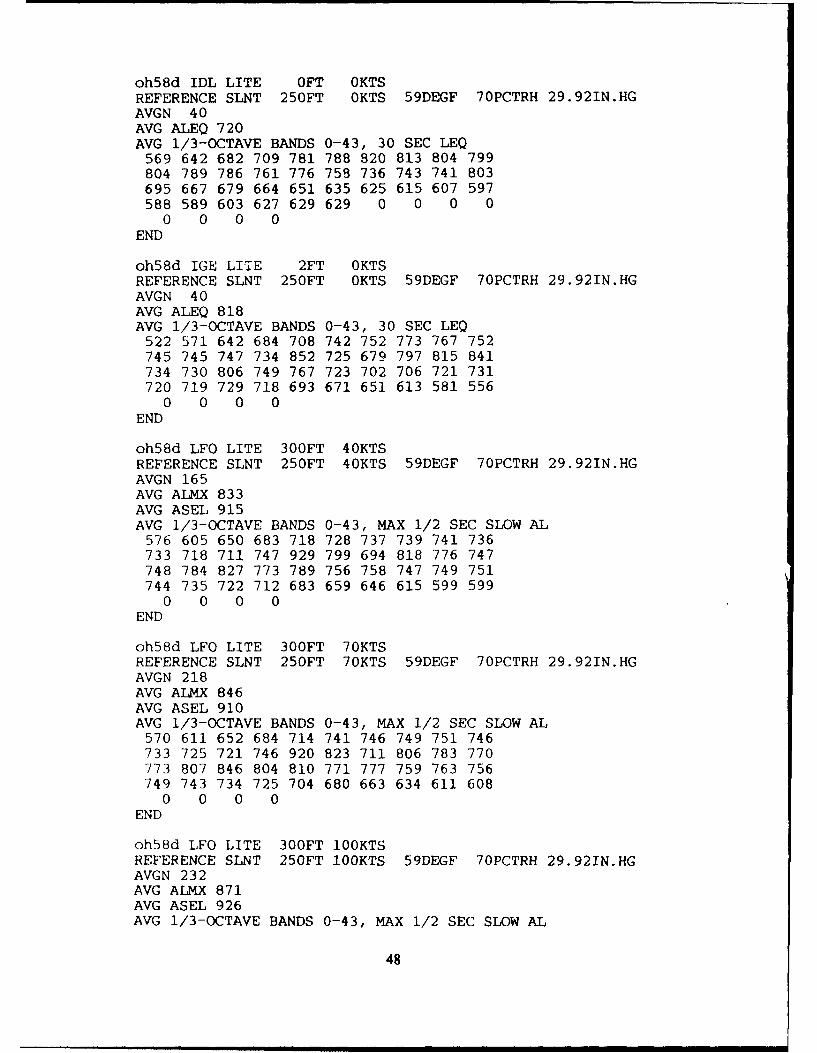
The normalized, flat-weighted 1/3-octave band spectra for each helicopter operation are shown inFigures 3A through 3D. The spectra were taken from the 1/2-second during the peak A-weighted levelfor dynamic operations and from a time-averaged equivalent sound level for the static operations (Figure3C). Note the strong peaks in level at band 15 (32 Hz) and band 23 (200 Hz) in Figures 3A and 3B.These are mainly due to the noise generated by the main and tail rotors. Also note that these peaks arepresent in the IGE and OGE hovers (Figure 3D3) but the main blade rotation does not produce a peak atband 15 for the zero-pitch idle. All static operations (Figure 3D) produced additional significant energyat band 20 (100 Hz). The data for Figures 3A through 3D are tabulated in Appendix B.
A-weighted Sound Levels Versus Distance
The maximum A-weighted sound pressure level versus distance curves are given in Figures 4Athrough 4C. In each figure, the maximum A-weighted sound level is predicted at a range of distancesbetween 100 ft slant range and 50000 ft slant range. These curves were calculated from measured 1/3-octave data, using the procedure outlined in an earlier USACERL Technical Report.6
The calculation procedure is the same as that described in Chapter 3 of this report.
The A-weighted sound exposure level is plotted versus distance in Figures 5A through 5C. The A-weighted equivalent level is plotted versus distance in Figure 6 for zero-pitch idle, IGE and OGE hovers.Tabulated values for the graphs in Figures 4A through 4C, 5A through 5C and 6 are given in Appendix C.
Sound Exposure Level Versus Speed
Figure 7 shows the variation of the ASEL and ALMX with increasing helicopter speed. The ASELis actually very constant with respect to speed, with only a 2.1 dB difference (when normalized to 250ft) between the quietest and the noisiest events. ALMX increases monotonically with helicopter speed,since it is independent of the duration of the flyover.
R. Raspet. M. Kief. and R. Daniels, Prediction and Modeling of Helicopter Noise. Technical Report N-186/ADA145764(USACERL. August 1984).
16
0
o CD o '
~0.. .. . . . . .. . . .. .. .. .
* * * -
0 >
c~ L) (9L() 10 10 10
CD ~ 0 ~X aD~-h~ 0 (0 1 0
(~jp ~GG] ~flS9JcJ~UfO~ ~DID p~~j-~ X0
.... ... ...---- -I.....17

LO
.. ..... .. .. . ... .. .
0
* 8 * *
. . . . . . . . . . . . . . . . . . . . . . . . . . . . . . . . .
Z
0
LC)
0D LO 0 Ln 0 LF) 0 LO 000 ccj r- r- o Q0 f
(OP) 19AG] @jflssgj PUfoSG GA D JC) pJlyi-GUO 'XD)V
18
4-0~ 00.-
LC)
CNu
00
o *n o *n o Lo p LC Cu-
CD *- *- co 00 r- *- (D (-
T- *** I(op *a~ ~ ns~ c pu o @AI* *~q -,U * * *
* * * * *19
LLJ .. .....
QD 0
o
CN
O0
20

Lf).......... ....... ... ... t...... ...... ....... ,....... ° ...... . ......
CD 0
0 00 CN
o ox* . * N
. . . .. . . I . . . . . . . ... . . . . . .. . .
0
O14o
. . . . . . . . . . .. .. - - - - - - - - - - - - - - -
0 0 0 0 0 o 0 C 0 00 0) o -- QD *f) -,I .,4 ,-
(E]P) lGA,-- ainssaj dj punos p@Iqbl@M-V 'XDVI
21

Lfl
O00.. . .. . .. . .. . . . .. . .
4 -00
0 0 * C- -qL
0 6
. . . . . 0 ;
c -*
.... . .. .. ....... ... .... 0
1
00 0 0 0 0 0 0 0 00 0 r- D -
(oP) l@AG ajnss@J d punos P@Iqbl@AA-V "XDIAI
22
.. ..... ... . . . . .. * * I I0
Cr).. . . . . . . . . .... ... . . . . . ... . . . . . . .. . . . . . .
0 °0
. . . . . .. . . . . . . . . . . . . . . . . . . . . . . .
Q)U)
/ 4-0
*,..0
. -- - ----- - ---
L
,4-
0 0 0 0 0 0 C0) 0 0 0
CD m 00 r-- CD un 14 r" - ,) -
(o]P' IOA O] a-jnssa-jc punoS po jq)ioM-v "xolA
23
........... I ..... . .. ...... ................. ........... 0
O00Nl t "
0 CD
o c x C14
* ..
* . 0
4
.
cC Cu
oi,
0
0 0 0 0 0 0 CD
(S]P) laAG] aJnsodxj puno S pGlq 5 iGM-V
24
.. . . . . . . . . .. . . . . ..I . . . . . . . - - - -- - - - .. . .. . . . . . 0
-If0
00
0 0
. . . . . . .. . . . . . . . . . .. . . . . . . . . . . . . . . . . . -
(L.
.. . .. . . ... . . ... . . ... . . . . . . . . .. 00
* 0
0 *D 0. . 0 0t
o 0Y 0 0l (0 0 0't-
(o P) I@AG] ojnsodx3] punos palqbiaM-V
25
...... .... . ..... . . .-- - - - .. . .. .0
C
0 0
C) "C-
F--C
0 N
* 0 3
* * 4-r,
040
*b O . * b' *0 ./ . r -
(o]P) laAa- jnsodx-3 puno S pajqf6iaM- V
26
* M m ll H Il lllll ll * II*N .l 0l
JW 0 O
o. o. c. .. . .. . ... .. .. . .. . . . .. . . .. . .
0
Q CD
.. . ... . . .. . . .. . . .. . . .. .. .... ...
14-
C-)
. . . .. . . . . . .. ... . .. . . . . .
00
0 0 0 0 00 0 0
0 m m *- D L .I NI . r
j@A,9] JU,9IDAilb:] pa~qf!gM-V
27

ED >
0_(/) < <
<I: <I: ,, -- -
00000000
or1") '4 .- -
0 -0
00
... . . . . ....... . ... . . .. . . . '0
4-.-
o Q... .. ... ... .. . ... ..... ...........
..... ........... '............ . .. ................. L . . . . . . . 0
Q)
10
0 uO 00 CY) 0Y 00 0
(8P) IGAG] punos
28
5 SUMMARY
Noise emission data were gathered in 8 sets of up to 31 helicopter operations. These data were thenreduced, analyzed, and normalized to 250 ft for use in noise maps. The ASEL versus distance curves forthe OH-58D were then developed.
METRIC CONVERSION TABLE
lin. = 25.4mmI ft = 0.305m
Imi = 1.61km1 knot = 0.514 m/slmni = 1.853km
29

APPENDIX A: Pilot's Log for OH-58D)
S
39 0 W1 H
3 0 1~
44 . . H0
a~ 44 %6 W 4 t
0a
-A -
1~ V~ 0 owQjI
-t- -.. =
00
0. 4.4 0 @5 @
000 ( 0 ..
44 zIa 4 v ~
w 00 31
-4 04
Eu 0.1U0.&
1
Ix .0 0
to4 4- 0
V444
4-.
0 - 0
1 0 0. u .
01 -W ~ 0
~ . -c . .. to 0
0.0
~~to
> *
o-wV 0000
2 C~14 0
> 041 u
32

r6 W
(0 wl
_ 3 0 1
U) 44 44 wi C4 .0
0 0 ft-
to~t W.. 1D G J ' ,iU
- 14 41 ~.4-4 44 0 bd
4D 4 000-4 to t -4 U
:3 0 .0 0
to F w 0 ',-4 ,-4
10 -24w V "04 . 0i
(fi 0 I U
-. 'U 'U 41! " 4-
0io0
0. 00
GDJ GD W GD -4
9A3 o0[.9 00z >
33

41 a- a.
(n 0. 0 rAj 0 4.4
w 0 . 0 (N.-
0.
p 0
-'o 41 - 4 IIQO41 > 4u1 Q 41 C6 cc .0
0 41 41 Wn 41 41 r-4;- ".7 0 41 =-A t " w = r
-3 1~ 410 a 4 a 00 U)n In I 0 ". '74 -q
4 1 4 1 4 0 0 -0 4 . - r 4 w. 4 0 0 41
.01 .74 0 ~~>& co 1 41 (1
0 L0
4.1 90 (A41 '4. 0U
44 4
luw w
en4 C.) 01.4.4 V4 0 V~ "~
41 A~
w 41
V4 41 (a w ID G
.0~a 0I()04
Z1 0
34
N
- o0 H
-40 .44 0.4 .00~ ~ 1- i A4 C
sw4. 4- 4
0
MW 00 Cr
>4 X ~0 MJ 0 wW ."~~4 01 a C . w = c
0 4 c 4 - 4 0 . 001
0
0 4n
0. 1
1.410f toAj41 l .
'0 4 .1 -
0 I. "'Ji
40 g
cc Va .4 u t
35

0 "v
44 w C'4
S . cu 0) ra (A
14-4 11 4 0
CO<
000
0' 4-4
P-4. 00 2
4.1 :3 a) w) (A W -
44 O) ) U) 0 .- ..
41 w) V- V' 44 41 V4 w V
va a) C.) l H r
NC
00 (r
00
0 c. L
4:1. m ca .0
V4 0 40 ( C4C s
lo -.4-F - d ' 4J
z- a' **
1-4)
.36

14
C- 0.
00 r4
440
60 41 41LIV0
Q6 -
o4 0
C-T (A 4.J rA 0G 0 0-.
- .9 0
-4.
3 0 4
04 Q 4- w
14 440 cA G . i~
00C~~t 4-)0 . .
V -44
vt6 A MV GA -H j.4
be 0.0s. WCA C14 I- 0.0 A. i 0
0.-
37

00IC14
U) 0 1t
4-4 C-0~0
'I 00 41 . S.
C., w C 44 4-' 0 I . d
-7.
-0 ,-3 0060 a
100
4- 00 0) 0.06
CL w
('4 ~ ~ ~ f 0 N. 3' . 0Gto 4- I' 04 4: w C: L4
0~ 1-4 4.4
618
4 4 0 %
QA. 14
30 00
(f0 0
00 "a1 V (m
414:- . a -0 -A ( U
4:4 6161 '.44 c ~ (0
I. 1 61 0 0 .v . Ua, G~ 00 61 '..
ac.01-ad - 1 0 . 0 0 1 1
38

W 0 U1
00~
0 41 41 n)U) '
000
0 0 Ad 0
> 41 4
*.-4 0 41CA U) 0 . 11. -I 4 0 *- 00- %j.4 U ) 0 . -4
41 wi. 4 0 ~ . -4 i.1 49~q~ i.. 3. .. C
'T . 0 Cko( ) 1.. -1~~~ en~U*-. * u - .
w S;4 v
410 1Ha V 4 0.w 1
0U 0
4. 4. 0p Mdt. 0 " -
-~-4 0 11 U
c4 (o 41 .410
0n 0
.4 -~ 039
(n 0 u0
0l
0 I
CO 4- 4: 14 N -,
4-4-4 J4v
00 0
0 1 C
-40 0)(
W 00
r.4 Ia.
41 0 -" 4 ICd % C)
00i 45 4
r. 4- 4.4 in o
EU41 41 0 4~'X1 0. Cl w44-4
0 * k00.0 4 w k
040
405
4 4 < 0. N .
0
w 3 44-4 0. 0
0~-
4-4 !d- 00 V~.45
CD to (1) 4 4 -4
z~.0 w sw< -H - 4 V ) 24 00 U 1 -cc W ow
2 ~ ~ c ,-4 u44IHCa ~ ~ C
z > InH 4Ind
0.
4 w.
x 0 4). (aw % u " ~
4 -4 4 4 0 b
445 05 10 0
u' -H 0
I n 4 0 v r4
00 IA U) 0-
z > -IU
41

4 ~U3 0 u1
<. w_'4 .4J 0 1-4 L6.
o~0 4) 0 44 0 4
4) CD u. " 4.4ZN S1.4 ~ -a--a4 -4 01..4
.0 C14 W 4C
0
0 44 0
44 W 4OW 0i -_*
.0 ~sJC Ci 1-a 4: 4 .0c
-4444
> w4 0.
0U 0 . m = r
a >i
Ch adU C
0 042

41
C14
00 N
In 4441 w. C14 .
% 4 0 - 44 0 qt:
40 -1
41C 4) 0 '4 (A444-40 "d -
414 In I
4) 0
wU 4.4 w
'a 0
1wU C1 ' -4 'm
.4 4
to W L) H
0..
43 0 41 0(4) 1 Val 0 U
r-4 41 4- 0 41 0 41 In In '-
0 (1 1 o .. ) to 0'4 -.2 0A 44.0 E-4 w -0 A IN1 000
-k -21~4 conco
43 '

0 -4 0
U 41 "
44~ 0 41C
03~ ~ 03 c CCu -4 03d 030 t r 41
o) 1:6 o .
A- 0 C,4 AiII 4w
-0
4-h 04
03 CaCL03-
003
w.0 0
0- 4 44
038
00
00 ---
-4 - 4--4 .0 -) m U
jt a W U) 0
W. V00)') - 14 w 10 & h0I A, 0
44
.9 U
Ci
Cj4 0* 4i'-'-
0n 'a 0) ." 0 QjN a 0 GD 41 (A al'-
14 '.4 w m C04 1'4-4'4-40 U ( 0 -H
00 I -V4 -dV4 00 oj
D wD r4 r. 0
GD -H 0 0 n..0.5>a co -I- wo G D -..- I <D 0 - 0 o C o .GD~~~~~~~~~~~~n W U?0 U W.' i- D~1i'U' . 0
M 0.0 W%~
0n 0 1'
4414 w 1 .00 -4 '4-4 0 ft -4
GD GD (a wo '-
0 '4-4 '44 C
Ho c
0 I
NDD
441 0U * D 'U 4 C
a ti (40 GD wc 0 0.4 -GD a. I ' - 00 'U -P4 4.4 M 4j1i 1i ' ' . 0 GGD) GD GDc
04 GD D G
45

0 0-4 0.
00.
P-4 P-. 0 C6
00 4-4 -r ' E4 k j U cC14 r
:3 0 "4 "34d
.0
~4 J 0 Ga'
'4-. 46

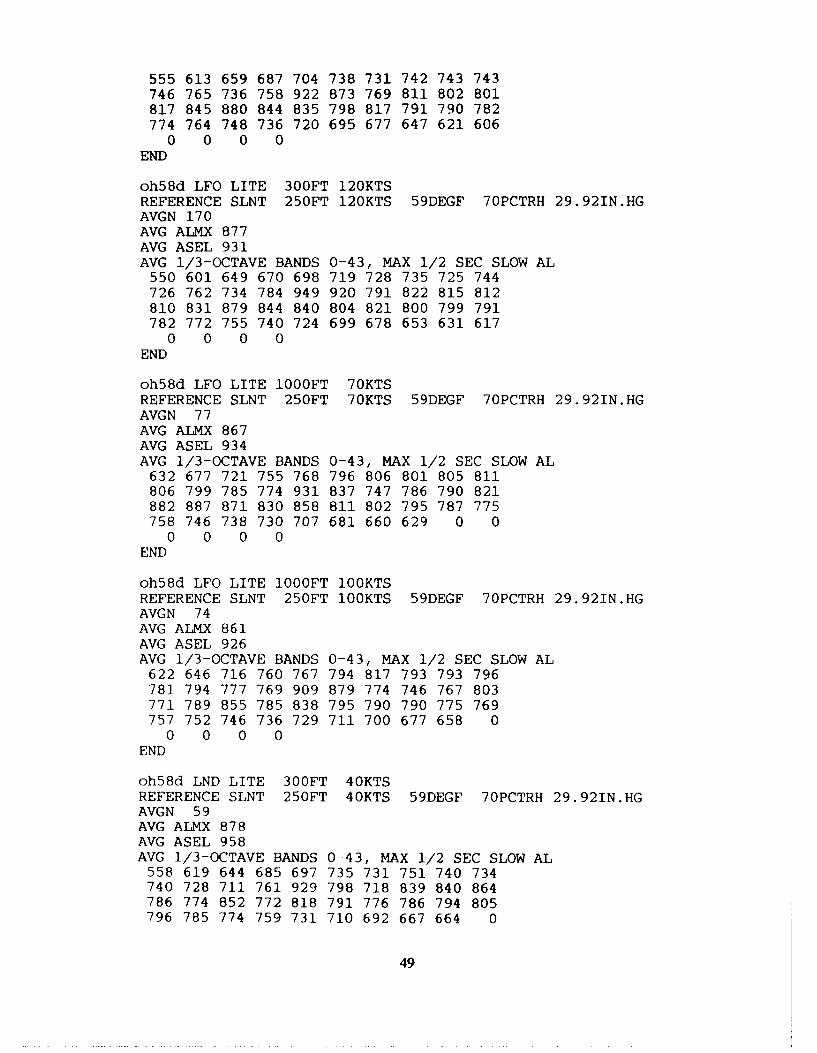
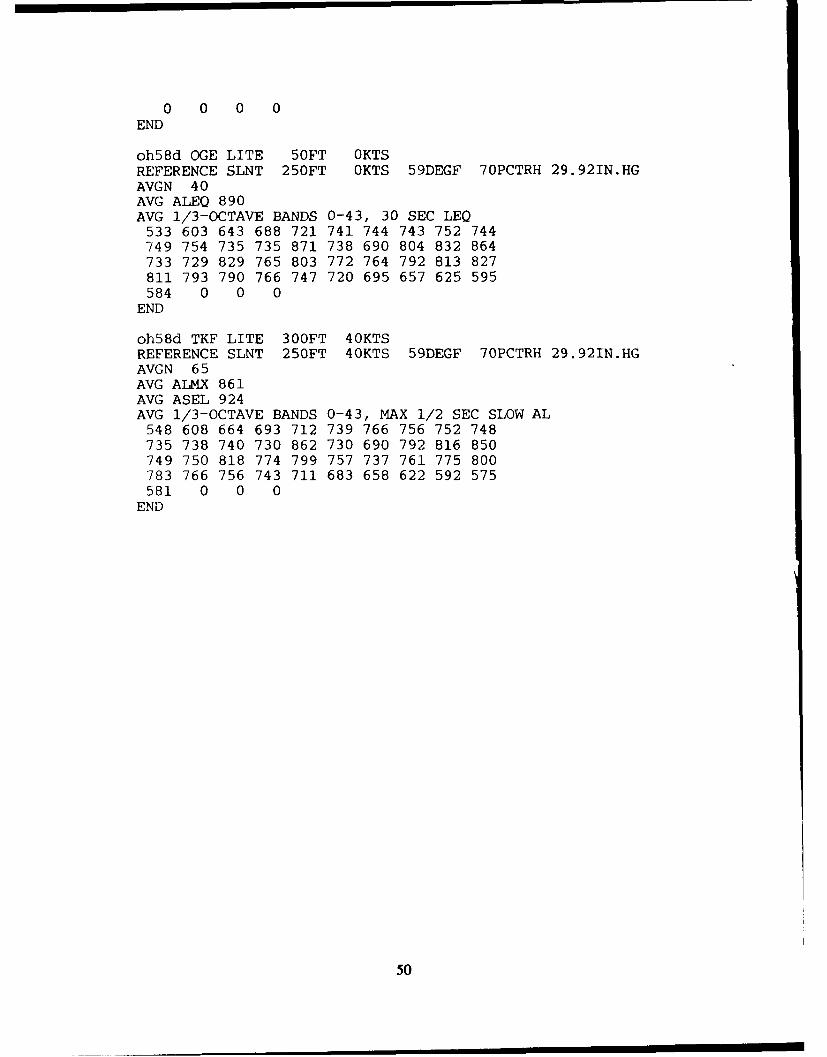
APPENDIX B:
One-third Octave Band Data Normalized to 250 ft
47
oh58d IDL LITE OFT OKTSREFERENCE SLNT 250FT OKTS 59DEGF 70PCTRH 29.92IN.HGAVGN 40AVG ALEQ 720AVG 1/3-OCTAVE BANDS 0-43, 30 SEC LEQ569 642 682 709 781 788 820 813 804 799804 789 786 761 776 759 736 743 741 803695 667 679 664 651 635 625 615 607 597588 589 603 627 629 629 0 0 0 0
0 0 0 0END
oh58d IGE LITE 2FT OKTSREFERENCE SLNT 250FT OKTS 59DEGF 70PCTRH 29.92IN.HGAVGN 40AVG ALEQ 818AVG 1/3-OCTAVE BANDS 0-43, 30 SEC LEQ522 571 642 684 708 742 752 773 767 752745 745 747 734 852 725 679 797 815 841734 730 806 749 767 723 702 706 721 731720 719 729 718 693 671 651 613 581 556
0 0 0 0END
oh58d LFO LITE 300FT 40KTSREFERENCE SLNT 250FT 40KTS 59DEGF 70PCTRH 29.92IN.HGAVGN 165AVG ALMX 833AVG ASEL 915AVG 1/3-OCTAVE BANDS 0-43, MAX 1/2 SEC SLOW AL576 605 650 683 718 728 737 739 741 736733 718 711 747 929 799 694 818 776 747748 784 827 773 789 756 758 747 749 751744 735 722 712 683 659 646 615 599 599
0 0 0 0END
oh58d LFO LITE 300FT 70KTSREFERENCE SLNT 250FT 70KTS 59DEGF 70PCTRH 29.92IN.HGAVGN 218AVG ALMX 846AVG ASEL 910AVG 1/3-OCTAVE BANDS 0-43, MAX 1/2 SEC SLOW AL570 611 652 684 714 741 746 749 751 746733 725 721 746 920 823 711 806 783 770773 807 846 804 810 771 777 759 763 756749 743 734 725 704 680 663 634 611 608
0 0 0 0END
oh58d LFO LITE 300FT 100KTSREFERENCE SLNT 250FT 100KTS 59DEGF 70PCTRH 29.92IN.HGAVGN 232AVG ALMIX 871AVG ASEL 926AVG 1/3-OCTAVE BANDS 0-43, MAX 1/2 SEC SLOW AL
48
555 613 659 687 704 738 731 742 743 743746 765 736 758 922 873 769 811 802 801817 845 880 844 835 798 817 791 790 782774 764 748 736 720 695 677 647 621 6060 0 0 0
END
oh58d LFO LITE 300FT 120KTSREFERENCE SLNT 250FT 120KTS 59DEGF 70PCTRH 29.92IN.HGAVGN 170AVG ALMX 877AVG ASEL 931AVG 1/3-OCTAVE BANDS 0-43, MAX 1/2 SEC SLOW AL550 601 649 670 698 719 728 735 725 744726 762 734 784 949 920 791 822 815 812810 831 879 844 840 804 821 800 799 791782 772 755 740 724 699 678 653 631 6170 0 0 0
END
oh58d LFO LITE 100OFT 70KTSREFERENCE SLNT 250FT 70KTS 59DEGF 70PCTRH 29.92IN.HGAVGN 77AVG ALMX 867AVG ASEL 934AVG 1/3-OCTAVE BANDS 0-43, MAX 1/2 SEC SLOW AL632 677 721 755 768 796 806 801 805 811806 799 785 774 931 837 747 786 790 821882 887 871 830 858 811 802 795 787 775758 746 738 730 707 681 660 629 0 00 0 0 0
END
oh58d LFO LITE 100OFT 100KTSREFERENCE SLNT 250FT 100KTS 59DEGF 70PCTRH 29.92IN.HGAVGN 74AVG ALMX 861AVG ASEL 926AVG 1/3-OCTAVE BANDS 0-43, MAX 1/2 SEC SLOW AL622 646 716 760 767 794 817 793 793 796781 794 777 769 909 879 774 746 767 803771 789 855 785 838 795 790 790 775 769757 752 746 736 729 711 700 677 658 0
0 0 0 0END
oh58d LND LITE 300FT 40KTSREFERENCE SLNT 250FT 40KTS 59DEGF 70PCTRH 29.92IN.HGAVGN 59AVG ALMX 878AVG ASEL 958AVG 1/3-OCTAVE BANDS 0-43, MAX 1/2 SEC SLOW AL558 619 644 685 697 735 731 751 740 734740 728 711 761 929 798 718 839 840 864786 774 852 772 818 791 776 786 794 805796 785 774 759 731 710 692 667 664 0
49
0 0 0 0END
oh58d OGE LITE 50FT OKTSREFERENCE SLNT 250FT OKTS 59DEGF 70PCTRH 29.92IN.HGAVGN 40AVG ALEQ 890AVG 1/3-OCTAVE BANDS 0-43, 30 SEC LEQ533 603 643 688 721 741 744 743 752 744749 754 735 735 871 738 690 804 832 864733 729 829 765 803 772 764 792 813 827811 793 790 766 747 720 695 657 625 595584 0 0 0
END
oh58d TKF LITE 300FT 40KTSREFERENCE SLNT 250FT 40KTS 59DEGF 70PCTRH 29.92IN.HGAVGN 65AVG ALMX 861AVG ASEL 924AVG 1/3-OCTAVE BANDS 0-43, MAX 1/2 SEC SLOW AL548 608 664 693 712 739 766 756 752 748735 738 740 730 862 730 690 792 816 850749 750 818 774 799 757 737 761 775 800783 766 756 743 711 683 658 622 592 575581 0 0 0
END
50

APPENDIX C:
Sideline Decay Predictions
51
oh58d IDL LITE OFT OKTSREFERENCE SLNT 25OFT OKTS 59DEGF 70PCTRH 29.92IN.HCAVGN 40ALEQ SIDELINE DECAY 100FT-5000OFT803 783 762 741 720 698 676 654 631 608584 559 534 507 480 4534425 397 369 341313 285 258 230 201 174 143 111
END
oh58d IGE LITE 2FT OKTSREFERENCE SLNT 250FT OKTS 59DEGF 70PCTRH 29.92IN.HGAVGN 40ALEQ SIDELINE DECAY 100FT-50000FT901 880 860 839 818 797 775 754 732 709686 662 637 611 585 557 529 499 469 437406 375 343 312 281 250 217 185
END
oh58d LFO LITE 300FT 40KTSREFERENCE SLNT 250FT 40KTS 59DEGF 70PCTRH 29.92IN.HGAVGN 165ALMX SIDELINE DECAY 10OFT-5000OFT915 894 874 853 832 811 790 769 -47 725702 679 655 631 605 579 551 522 493 462430 398 365 332 298 264 228 192
ASEL SIDELINE DECAY 10OFT-5000OFT973 958 944 929 915 900 885 869 853 837821 803 786 767 747 727 705 683 659 634609 582 555 528 500 472 443 412
END
oh58d LFO LITE 300FT 70KTSREFERENCE SLNT 250FT 70KTS 59DEGF 70PCTRH 29.92IN.HGAVGN 218ALMX SIDELINE DECAY 10OFT-5000OFT927 907 887 866 845 824 803 782 760 738715 692 668 644 619 593 565 537 509 479448 417 385 352 319 265 249 212
ASEL SIDELINE DECAY 10OFT-5000OFT968 953 939 924 910 895 880 864 848 832816 799 781 762 743 723 702 680 657 633608 583 557 531 503 475 445 414
END
oh58d LFO LITE 300FT 100KTSREFERENCE SLNT 250FT 100KTS 59DEGF 70PCTRH 29.92IN.HGAVGN 232ALMX SIDELINE DECAY 10OFT-5000OFT952 932 912 891 871 850 829 807 786 764742 719 696 672 647 621 595 568 539 510480 449 418 386 353 319 284 247
ASEL SIDELINE DECAY 10OFT-5000OFT984 969 955 940 926 911 896 881 865 849833 816 799 781 762 742 722 701 678 655631 606 581 555 528 500 471 440
END
52
oh58d LFO LITE 300FT 120KTSREFERENCE SLNT 250FT 120KTS 59DEGF 70PCTRH 29.92IN.HGAVGN 170ALMX SIDELINE DECAY 100F1 OOOOFT959 938 918 897 877 856 i,5 813 792 770748 725 701 677 652 627 600 572 544 514483 452 419 386 353 318 283 245
ASEL SIDELINE DECAY 100FT-5000OFT989 974 960 945 931 916 901 886 870 854838 821 803 785 767 747 726 704 682 658633 608 581 555 527 498 469 437
END
oh58d LFO LITE 100OFT 70KTSREFERENCE SLNT 250FT 70KTS 59DEGF 70PCTRH 29.92IN.HGAVGN 77ALMX SIDELINE DECAY 10OFT-5000OFT949 928 908 887 867 846 825 804 783 761739 717 694 670 646 621 596 570 542 515486 457 426 396 364 332 299 264
ASEL SIDELINE DECAY 100FT-OOOOFT991 977 963 948 934 919 904 889 874 858842 825 809 791 773 754 735 714 693 671649 625 601 577 551 525 497 469
END
oh58d LFO LITE 1000FT 100KTSREFERENCE SLNT 250FT 100KTS 59DEGF 70PCTRH 29.92IN.HGAVGN 74ALMX SIDELINE DECAY 10OFT-5000OFT942 922 902 881 860 839 818 797 775 753730 707 683 658 633 607 580 552 523 493462 430 397 363 328 292 255 216
ASEL SIDELINE DECAY 100FT-50000FT994 970 955 940 926 911 896 880 864 848831 814 797 778 759 739 718 696 673 649624 597 571 543 514 484 452 419
END
u.h58d LND LITE 300FT 40KTSREFERENCE SLNT 250FT 40KTS 59DEGF 70PCTRH 29.92IN.HGAVGN 59ALMX SIDELINE DECAY 10OFT-5000OFT960 940 919 898 878 857 835 814 792 770747 -23 699 674 647 620 591 561 530 497463 429 394 360 326 292 257 223
ASEL SIDELINE DECAY 100FT-5000OFT10161002 987 972 958 943 927 912 896 880863 845 827 808 788 766 744 720 694 667640 611 582 554 526 498 469 441
END
oh58d OGE LITE 50FT OKTSREFERENCE STJNT 250FT OKTS 59DEGF 70PCTRH 29.92IN.HGAVGN 40
53
ALEQ SIDELINE DECAY 10OFT-5000OFT971 951 931 910 889 868 847 825 803 781758 734 709 684 657 629 600 568 535 500463 425 386 348 311 275 240 206
END
oh58d TKF LITE 300FT 40KTSREFERENCE SLNT 250FT 40KTS 59DEGF 70PCTRH 29.92IN.HGAVGN 65ALMX SIDELINE DECAY 100FT-50000FT943 923 902 882 861 840 819 797 775 753730 706 682 657 630 603 574 543 511 478443 407 371 336 301 267 233 198
ASEL SIDELINE DECAY IOOFT-5000OFT982 968 953 938 924 909 893 878 862 846829 811 793 774 753 732 709 684 658 630601 572 542 513 484 456 427 399
END
54

ENA Team Distribution
Chief of Engineers Naval Surface Weapons Center 22448ATTN: CEMP-CE ATTN: N-43ATTN: CEMP-EAATTN: CEMP-EI (2) Ft. McPherson, GA 30330ATTN: CEMP-ZA ATTN: AFEN-FEBATTN: CEMP-ZM (2)
US Army Aeromedical Res Lab 36362HQ USAF/LEEEU 20332 ATrN: SGRD-UAS-AS
US Army Europe USAWES 39180ODCS/Engineer 09014 A'ITN: WESSEN-B
ATTN: AEAEN-FE ATTN: Soils & Pavements LabATTN: AEAEN-ODCS ATTN: C/Structures
AMC 22333 Wright-Patterson AFB, OH 45433ATTN: AMCEN-A ATN: AAMRL/BB
ATTN: AAMRL/BBEFort Belvoir, VA 22060
ATTN: Water Resource Center Ft. Monmouth 07703ATfN: CECC-R ATTN: AMSEL-EW-MDATTN: NACEC-FB
WASH DC 20410Picatinny Arsenal 07801 ATTN: Housing & Urban Dev (2)
ATTN: LibraryNat'l Institute of Standards & Tech 20899
US Military Academy 10996 A'ITN: Force & Acoustics GroupATTN: Facilities EngineerATTN: Dept of Geography & Department of Transportation
Environmental Engrng AITN: Library 20590ATTN: MAEN-A
Naval Undersea Center, Code 401 92132Naval Air Systems Command 20360
ATTN: Library Bureau of National Affairs 20037
Little Rock AFB 72099 Building Research Board 20418ATrN: 314/DEEE
Transportation Research Board 20418Aberdeen PG, MD 21010
ATTN: Safety Office Range Safety Div Federal Aviation Administration 20591ATTN: US Army Ballistic Res Lab (2)A'ITN: ARNG Operating Activity Ctr AVSCOM 63120-1798ATTN: Human Engineer Lab ATTN: SFAE-AV-ASH
Edgewood Arsenal, MD 21010ATTN: HSHB-MO-B
38Ft. Belvoir, VA 22060 +47
ATTN: NACEC-FB 12/90
NAVFAC 22332ATTN: Code 2003
This publication was reproduced an recycled paper.