a critical discussion of the low income countries debt
TRANSCRIPT

Dissertation Title:
A Critical Discussion of the Low Income Countries Debt Sustainability Framework – The Case of Mozambique
This Dissertation is submitted in partial fulfilment of the requirements for the degree of Msc. Development Economics of the School of Oriental and African Studies (University
of London).
Name: Rogerio Ossemane Student number: 216996 Programme: Msc Development EconomicsSupervisor: Machiko Nissanke
Date of Submission: 15/09/2008
1

DECLARATION:
I undertake that all the material presented for examination is my own work and has
not been written for me, in whole or in part, by any other person(s). I also undertake
that any quotation or paraphrase from the published or unpublished work of another
person has been duly acknowledged in the work which I present for examination.
Signature:_________________________________
I consent that copies of my dissertation may be held by the School, at the School’s
discretion, following final examination, for reference by other students or staff of
SOAS as an example of good work or original research. I understand that such copies
will be anonymised before they are made available to students.
Signature:_________________________________
Word Count: 10.352
2
Acknowledgements
The Author wishes to thank Mr. Jose A. Sulemane for all the support provided
throughout the academic year, and to the British Council for sponsoring the
Master’s programme.
3

List of Acronyms
CIRR - Commercial Interest Reference Rate
CPIA – Country Policy and Institutional Assessment
EPA – Economic Partnership Agreement
EU – European Union
HIPC – Highly Indebted Poor Countries
IDA – International Development Agency from the World Bank
IMF – International Monetary Fund
LIC – Low Income Countries
LIC DSF – Low Income Countries Debt Sustainability Framework
LIC DSA – Low Income Countries Debt Sustainability Assessment (refers to the DSF
applied to specific countries).
MDG – Millennium Development Goals
MDRI – Multilateral Debt Relief Initiative
NPV – Net Present value
PPG – Public and Publicly Guarantee (debt)
SADC – Southern Africa Development Community
SADC-EPA – Refers to the list of countries under the SADC configuration negotiating
the EPA.
SAP – Structural Adjustment Programs
UN – United Nations
WB – World Bank
4
Abstract
This dissertation critically analyzes the Low Income Countries Debt Sustainability Framework (LIC DSF) and use of the Debt Sustainability Assessment carried out for Mozambique in 2007 as an empirical case study. Focusing on the methodological procedures to define sustainability and on the relationship between the DSF and the aid architecture the dissertation finds that besides being despoiled of developmental content the DSF is also a weak instrument to assess financial sustainability. Moreover, its role in the aid architecture can potentially generate or exacerbate debt sustainability problems. In this sense, the dissertation highlights some of the key aspects to consider towards a more developmental approach and better suited for LICs to address debt sustainability dynamics. Building on these findings and putting the assumptions of the Mozambique debt sustainability assessment 2007 to a closer scrutiny, results that the findings indicating that the country faces a low debt distress risk are highly questionable.
5

Table of Contents
Declaration
Acknowledgements
List of Acronyms
Abstract
1. Introduction……………………………………………………………………………..1
2. Theoretical Approaches to Debt Sustainability…………………………………...……4
2.1 The Debt Capacity Perspective (or Financial Sustainability)………………...….6
2.2 The Development Perspective (Economic Sustainability)………………………11
3. The Low Income Countries Debt Sustainability Framework (LIC DSF)……………..17
3.1 Description of the LIC DSF……………………………………………………...17
A. Definition of Debt Sustainability and Theoretical Underpinnings…………...17
B. The Choice of Ratios and the Methodology to Calculate the Thresholds…….18
C. Debt Distress Risk Classification……………………………………………..21
3.2. Critical Analysis of the LIC DSF………………………………………………..23
A. Critique to the Choice of Ratios……………………………………………...23
B. Critique to the Methodology Used to Find the Threshold Values…………...28
C. Critique to the CPIA and the Role of DSF in the Aid Architecture…………..31
4. Mozambique Debt Sustainability Assessment 2007………………………………….35
4.1 The Results………………………………………………………………………35
4.2 Critical Analysis of the Assumptions……………………………………………36
4.3 Key Issues for the Application of a Different Debt Sustainability Criteria and Main Implications for Mozambique…………………………...………………….…40
5. Conclusions and Recommendations…………………………………………………..43
References………………………………………………………………………………..45
6

Annexes
Annex I: LIC DSF Criteria for Country Debt Distress Risk Classification
Annex II: Tables and Graphs for the Mozambique DSA 2007 Results
Annex III: Mozambique DSA 2007 Main Assumptions
Figures
Figure 1: The Intertemporal Borrowing/Lending Model………………………………….4
Figure 2: The Growth-Cum-Debt Model………………………………………………….7
Figure 3: The Debt Laffer Curve………………………………………………………...13
Table: Debt Burden Thresholds under the DSF (Applying to external public debt)……20
7

1. Introduction
Financing national development requires resources often not available in sufficient
amounts and in favorable conditions in developing countries, making the need to borrow
externally indispensable. Borrowing implies that, at a certain point, these resources have
to be repaid and, therefore, the country needs to generate the necessary surplus resources
to service its debt. The evidence from many developing countries is that, in general, they
face severe constraints to sustainably fulfill their debt obligations. This fact became
impossible to neglect after 1982 Mexico’s public declaration of its inability to comply
with external debt responsibilities reflecting a widespread debt crisis that were affecting
many Latin American middle income countries from late 70’s followed by a low income
African countries debt crisis from late 80’s.
In presence of the evident difficulties that many developing countries were facing to
manage their external debt, many strategies have been conceived and implemented along
the years to deal with these situations. Those included different forms of debt relief as
well as external aid and specific policy packages. However, before these measures are
conceived and applied, the first step is to define what debt sustainability is. The adopted
definition will impact the list of countries in problems, what strategies are suitable to face
them and the dimension of the support to provide.
The definition of debt sustainability is therefore a critical but also very controversial
issue. The mainstream approach is the one taken by the IMF/WB which guides the main
debt relief initiatives, namely the HIPC and the MDRI. While for many years their
understanding of debt sustainability were limited to a financial dimension, simply
8

requiring that countries were able to fulfill their debt obligations, later on it became clear
that even if countries were able to do so but debt levels were so high that they could
adversely impact growth then the debt position should not be considered sustainable. In
this sense, a further requirement that growth should not be adversely affected by debt
obligations was added to the sustainability definition. The definition was completed by
defining the levels of debt that posed financial and/or growth constraints to debtor
countries – the thresholds of sustainability. Both the definition and the thresholds of
sustainability are central in the Low Income Countries Debt Sustainability framework
(LIC DSF) which is used by the IMF/WB to assess the LIC debt distress risk and to guide
future borrowing (and lending) strategies to avoid debt problems.
The purpose of this dissertation is to critically analyze the LIC DSF focusing on its
theoretical underpinnings, on the choice of the ratios of sustainability, on the
methodology used to define the threshold ratios and to assess the debt distress risk and on
how the DSF is linked to the IDA financing package. The paper will apply this discussion
to critically analyze the last annual debt sustainability assessment that the IMF/WB
carried out for Mozambique in 2007.
The main argument of the dissertation is that, in spite of apparent concern with the
developmental dimension of debt sustainability reflected in the adopted definition, the
way the LIC DSF is conceptualized and implemented not only empty much of the
developmental content of the definition as it is also a weak approach to measure financial
sustainability. This is so because the ratios of sustainability are bad proxies of financial
repayment capacity; the methodology to define the thresholds of sustainability is
analytically weakly supported and no link between debt and growth and development is
9

established; the role of the DSF in the aid architecture and the limitations of the CPIA
bring in or exacerbate liquidity and solvency problems and create problems of local
ownership of the development strategies and partnership between recipients and donors
which, by creating some reluctance in policy implementation, potentially creates a
vicious cycle: low CPIA score – low IDA financing – low growth – higher debt distress.
Using the insights from this critical analysis to submit the Mozambique’s DSA to a closer
scrutiny, it turns out that the results obtained in the 2007 assessment, showing that
Mozambique faces a low debt distress risk, are highly questionable.
The dissertation is organized in five main chapters. After this introduction the next
chapter presents a theoretical discussion of debt sustainability models. The third chapter
starts presenting the LIC DSF followed by a critical discussion centering on the choice of
the ratios of sustainability and the methodology to empirically assess them and on the
role of the DSF in the aid architecture and how the CPIA influences both. The fourth
chapter critically analyses the 2007 Mozambique’s DSA focusing on the reliability of the
assumptions and results obtained. Using some of the insights from the theoretical
discussion and some of the DSA assumptions, the chapter analyses the main implications
of using a more appropriate sustainability criteria to Mozambique’s debt distress risk
assessment. The last chapter concludes.
10

2. Theoretical Approaches to Debt Sustainability
The benefits of external borrowing can be illustrated by taking the framework of the
intertemporal investment-consumption model adapted to an intertemporal
borrowing/lending model. The latter shows that borrowing allows the possibility of
increasing a country’s present and future investment and consumption fostering future
growth. Additionally, external borrowing can help the country shielding from
consumption adverse effects caused by income fluctuations.
Figure 1: The Intertemporal Borrowing/Lending Model
Source: Nissanke and Ferrarini (2001)
The intertemporal borrowing/lending is explained by Nissanke and Ferrarini (2001:2-3)
using the diagram presented in figure 1. The model is represented in a two period budget
constraint with the given levels of income, y0 and y1, and a two-period utility function U
(C0, C1). An intertemporal production possibility frontier represents a trade-off between
11

outputs in the two periods. The point A represents autarky position, where a country has
no access to international capital markets and faces the domestic interest rate r, which
exceeds the world interest rate, r*. The slope of the budget line at point A is -(1+ r),
whereas that of the budget line at points B and C is -(1 + r*). With opening up to
international borrowing, two effects emerge: i) the country can divert resources to more
future production at B, as it responds to the lower interest rate, r*; and ii) the country
enjoys higher current consumption at C, as the higher utility indifference curve through
point C than the one through point A indicates. Thus, external borrowing allows a country
to undertake the extra investment (shown by the horizontal distance between points A an
B) as well as to enjoy the extra first-period of consumption (shown by the horizontal
distance between points A and C). The sum of the two horizontal distances (the distance
between B and C) is the first-period current account deficit that reflects its resource gap.
At the same time, whilst a move from A to C reflects trade gains due to a smoothing of
the time path of consumption, further trade gains are realized by the change in the
economy’s production point from A to B.
However, in order to be able to respond to the commitments arising from the acquired
debt, borrowing countries have to fulfill some requirements. These conditions may vary
according to the debt sustainability approach that one takes. The first distinction can be
whether we take the borrowers’ or the lenders’ approach. The borrower’s approach
focuses on the borrower country behavior and on its willingness1 and ability to service its
debt obligations. The lender approach focus on the lenders’ liquidity and investment
alternatives available in international markets. In spite of the fact that, as recognized by
1 In fact, for the sake of simplicity, most of the analyses take willingness as given and focus on the ability to repay.
12

Bellloc and Vertova (2005) and Arnone et. Al (2005), a comprehensive approach to debt
sustainability should consider both the borrowers’ and the lenders’ approaches, this
dissertation will only focus on the former. The reason for this is the fact that the lender’s
approach addresses commercial borrowing and, as such, it has not much relevance for the
case of low income countries which, according to IMF (2004:7), external debt is mainly
contracted from official lenders such as governments and multilateral agencies.
The borrower approach literature presents two main perspectives: the debt capacity
perspective and the development perspective.
2.1 The debt capacity perspective (or financial sustainability)
The debt capacity perspective (also called financial sustainability) has its roots in the
“Gap literature”2 and can be divided into two groups: The approach of the optimizing
frameworks and the non-optimizing models (Hjertholm, 2001).
According to Hjertholm (2001:4) the optimizing framework asks how much money a
country should borrow, given the terms and conditions attached to the money available,
i.e. what is the optimal level of debt? It leads to the suggestion that the optimal level of
debt is that at which the marginal benefit and the marginal cost of foreign borrowing are
equalized.
The non-optimizing models examine the sustainability of particular debt situations and
policies in light of the expected future growth path of the economy. The non optimizing
2 Gap literature refers to the works analyzing the impact of foreign resources flows into the economy to fill the savings and foreign exchange gap pioneered by the work of Chenery and Strout (1966) and also the fiscal gap introduced by the work of Bacha (1990).
13

models can be divided into two groups: the growth-cum models and the debt dynamics
models (idem).
The growth-cum-debt model and its derivative, the debt cycle model, can be seen as an
extension of the intertemporal borrowing/lending model to a multiple period (Nissanke
and Ferrarini, 2001:6). In this model, by filling the income-savings gap in the first period
(the difference between absorption and income), debt speeds up income growth so that
the country income may exceed the absorption in the second period allowing the country
to use the surplus resources to service its debt which will eventually decline.
Figure 2: The Growth-Cum-Debt Model
Source: Nissanke and Ferrarini (2001).
The growth-cum model has been mainly focused on foreign borrowing for investment
purposes as it is evident from the conditions of sustainability obtained, which can be
found in Nissanke and Ferrarini (2001:7):
(1) Additions to external debt are used for growth-enhancing productive investment;
14
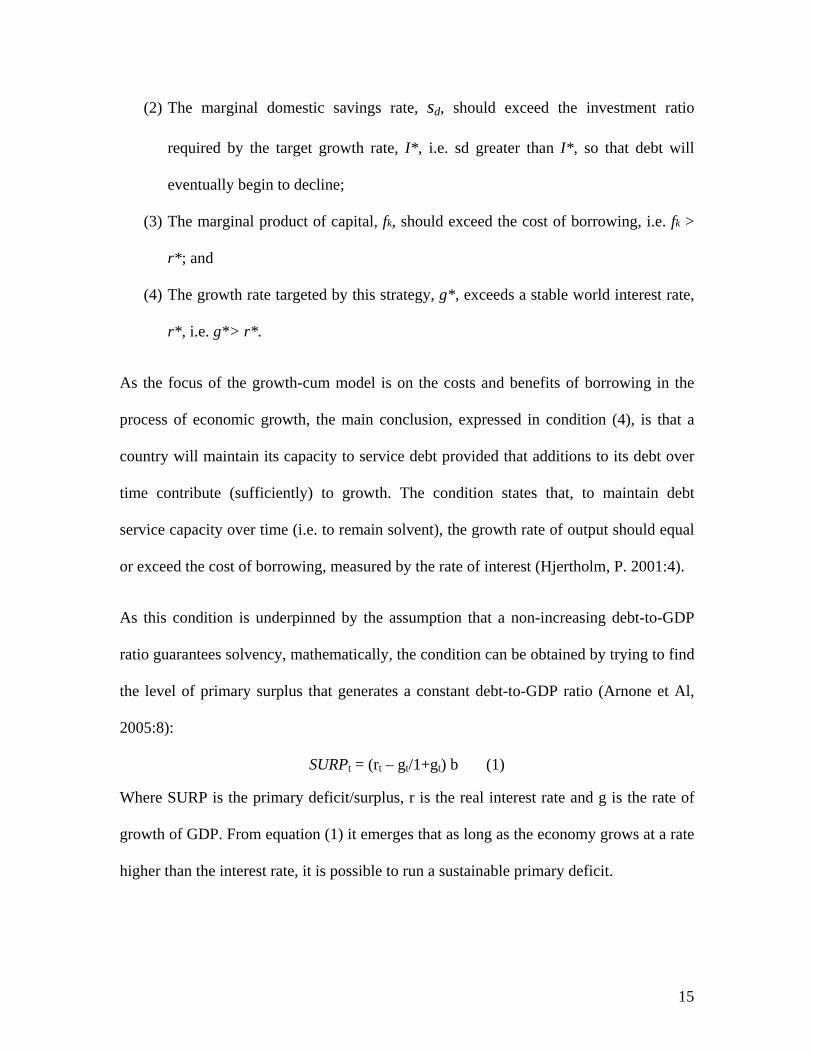
(2) The marginal domestic savings rate, sd, should exceed the investment ratio
required by the target growth rate, I*, i.e. sd greater than I*, so that debt will
eventually begin to decline;
(3) The marginal product of capital, fk, should exceed the cost of borrowing, i.e. fk >
r*; and
(4) The growth rate targeted by this strategy, g*, exceeds a stable world interest rate,
r*, i.e. g*> r*.
As the focus of the growth-cum model is on the costs and benefits of borrowing in the
process of economic growth, the main conclusion, expressed in condition (4), is that a
country will maintain its capacity to service debt provided that additions to its debt over
time contribute (sufficiently) to growth. The condition states that, to maintain debt
service capacity over time (i.e. to remain solvent), the growth rate of output should equal
or exceed the cost of borrowing, measured by the rate of interest (Hjertholm, P. 2001:4).
As this condition is underpinned by the assumption that a non-increasing debt-to-GDP
ratio guarantees solvency, mathematically, the condition can be obtained by trying to find
the level of primary surplus that generates a constant debt-to-GDP ratio (Arnone et Al,
2005:8):
SURPt = (rt – gt/1+gt) b (1)
Where SURP is the primary deficit/surplus, r is the real interest rate and g is the rate of
growth of GDP. From equation (1) it emerges that as long as the economy grows at a rate
higher than the interest rate, it is possible to run a sustainable primary deficit.
15

One of the main limitations of the growth-cum model is that it focuses solely on the
savings-investment gap neglecting the foreign exchange gap which is particularly
relevant for external debt repayment (Nissanke and Ferrarini, 2001:8; Hjertholm, 2001:5)
By contrast, the debt dynamics approach directly addresses the issue of a borrowing
country’s external solvency taking into account the country’s external performance but
neglecting the domestic savings-investment gap (Nissanke and Ferrarini, 2001:8).
According to this view, since debts have to be serviced with foreign exchange, the value
of exports gives a more accurate impression of income than for example GDP, as it
relates more directly to debt servicing ability. The condition for sustainability that
emerges from this is that the rate of growth of exports must exceed the cost of borrowing,
i.e., the interest rate (r) (Hjertholm, 2001:5).
Nissanke and Ferrarini (2001:9) show that the above condition can be obtained by
expressing the ratio of exports as:
i x z g
Where z =D/X (debt/export ratio), g = Resource Gap/Export ratio and x = Growth rate of
exports. Then, if z is to be kept unchanged, i.e. 0, we have an equation for a
sustainable resource gap as:
g = (x-i) z
Which is positive for x > i. A positive value of g means that a country remains in a net
borrowing position.
16

Another way to define solvency in the debt capacity models uses the concept of present
value. According to Eaton (1993), Agenor and Montiel (1996) and Gunning and Mash
(1998) the solvency condition requires that debt in any period cannot exceed the present
discounted value of the borrowings country’s stock of wealth or future income stream. In
other words, even if the country does not keep the debt level constant or decreasing at all
times, debt is still considered sustainable if in a certain time horizon the government is
expected to generate enough resources to repay the present value of debt. This condition
of sustainability is assessed by discounting the expected future government revenues to
the present and comparing to its current debt stock. A greater (or equal) present value of
future revenues than the current debt stock implies that the country is in a sustainable
position.
Besides the fact of considering the domestic savings and foreign exchange gap
separately, the debt capacity approach suffers from a number of other conceptual
shortcomings. First, as noted by Goldstein (1993:14) it does not tell which level of debt is
“safe” as, clearly, stabilizing the government debt ratio at 30 percent of GDP does not
produce the same level of vulnerability as stabilizing it at 90 percent of GDP. Second,
Hjertholm (2001:6) alerts that the practical use of this approach becomes difficult as it
depends on determining the expected “path of the economy” and contrary to the implicit
premises of the growth-cum-debt and debt dynamics frameworks, the time paths of the
main factors involved (i.e. the growth rate of output, exports and imports as well the rate
of interest) are inherently difficult to predict relying on assumptions that make the
assessment highly subjective. Also, LICs exports and interest rate growth path are
certainly not time-invariant as assumed by this approach. Moreover, as shown by Gunter
17

(2003:8) the debt-to-exports ratio is an inappropriate proxy to measure debt sustainability
in many import dependent low income countries.3 As pointed out by Hjertholm (2001)
this fact has been recognized before by Kamel (1988) and Hjertholm (1991) which argue
that not explicitly considering developments in the level of imports undermines the
applicability of the debt dynamics model when examining debt sustainability. Last but
not least, the debt capacity approach focus only on solvency where revenues are assumed
to prioritize debt servicing and neglecting both liquidity constraints and the impact of
large external levels of debt on developmental goals.
2.2 The Development Perspective (Economic sustainability)
The development perspective is based on the analysis of the impact of debt burden on
growth through 2 main channels: i) Cash flow effects analyzed by the so called fiscal
space models) and ii) disincentive effects analyzed by the debt overhang theory.
The cash flow effect refers to cuts in public investments and imports necessary for
growth-enhancing public investments due to the large amounts of resources diverted to
debt servicing. Also, as public investments are complementary to private investment its
reduction will crowd out private investment (Arnone et Al, 2005)
Perhaps more important is the debt overhang hypothesis developed by Krugman (1988)
and Sachs (1989). They argue that there is an enormous deadweight loss resulting from
the way that the current debt overhang discourages investment and economic reforms in
3 As the debt-to-exports ratio is central in the LIC DSF this point will be further discussed in the next chapter.
18

the debtor countries even beyond its direct budgetary burden. This happens because of
five main reasons:
Restrictive economic reforms become difficult to implement as the citizens as
believe that this will only serve to improve the capability of servicing the debt and
not making them better off.
Private investment disincentive through the Cash Flow effects.
It becomes increasingly difficult for the debtor countries to access new funds for
investment as creditors perceive the higher risk of lending to those countries.
Investments disincentives due to economy instability as, because of the lost of
international creditworthiness, the government will put more pressure and
rationing on domestic resources pushing up domestic interest rates, inflation and
increasing credit rationing. Uncertainty regarding debt payments and aid flows
may also negatively impact investment and growth.
It encourages capital flight, in order to avoid taxation, as the private sector
understands that the public sector is starved for funds.
Krugman (1988) summarizes the channels through which debt relief is good for debtors
and creditors postulating the existence of a “debt Laffer curve”. In the debtors’
perspective the Laffer curve shows that once debt reaches its overhang point (point A in
the figure) more debt will act like a distortionary tax reducing the debtors’ economic
growth and consequently its capacity of repayment making it go more and more into
arrears. It is clear from this analysis that point A in the graph represents the switching
19

point were to the left countries are in a sustainable debt position and to the right debt
becomes unsustainable.4
Figure 3: The Debt Laffer Curve
GDP Growth/Value of debt
Debt Accumulation/Face value of debt
In spite of the acceptance of the principles of debt overhang theory, Birdsall and Deese
(2002) and Cordella et Al (2005) argue that that low income countries (more specifically
HIPCs) do not suffer from a debt overhang problem, basing their assertion on the
evidence of creditors and donors behavior. First, net official transfers to HIPCs have
grown together with the debt stock from the 1970s, so they never experienced the
crowding out of resources as argued by the debt overhang hypothesis. Second, knowing
that this pattern is very likely to prevail imply that debt relief will not have significant
4 In the creditors perspective one should consider the face value of debt (the value of debt contracted) in the horizontal axis and the value of debt (the expected amount that will be actually repaid) in the vertical axis. The Laffer curve shows that after a critical threshold (point A) as the face value of debt increase the value of debt declines, because external debt acts like a tax on the domestic economy. Beyond the optimal tax rate, however, the debt tax becomes distortionary and reduces expected revenue.
20

effects on incentives and policies as debt is not expected to be paid in first instance.
Third, more than due to high levels of debt, HIPCs’ limited access to international capital
markets is more related to poor institutions or lack of infrastructures that significantly
reduce this countries’ capacity to attract commercial lending.
However, the first two arguments do not rule out the possibility that high levels of debt
may be keeping HIPCs’ dependent on the official lending/forgiving trap with limited
access the private capital market. That dependence on official lending may have several
negative impacts on growth as illustrated by IMF (2004:9). Those include the fact that
over reliance on external aid flows may undermine a government’s incentive to maintain
sound macroeconomic policies and increase its own repayment capacity (moral hazard
problem); or, otherwise, the weakened power in forcing its own development strategies in
the negotiation with donors; the cost of debt restructuring; and the increased adverse
effects related to the uncertainty accruing from aid volatility may negatively impact
growth. Indeed, while the third argument can be valid, the need to link debt to growth in
HIPCs can still be relevant because, as argued by Cordella et. Al (2005), even if high
levels of debt do not matter for HIPCs growth it does not imply that intermediate levels
of debt also do not matter. Indeed, they find a robust evidence of a highly non-linear
relation between these two variables: positive at low levels of debt, negative at
intermediate levels, and nil at high levels because of the high inflows of money from the
donor community on this situation.
Therefore, by showing that debt problems can arise because growth is adversely affected
by debt, the developmental approach calls for the consideration of the impact of debt on
growth going beyond the analysis of the capacity to generate resources to service debt.
21

In sum, comparing the debt capacity and the developmental approach, it can be said that
while the debt capacity approach asks what is the level of growth and other economic
indicators (e.g. level of exports, interest rate, exchange rate, etc.) that would guarantee
solvency, the developmental approach asks an additional question which is how debt
accumulation impacts growth and other economic indicators in first place, and from there
what is the impact to the repayment capacity. The definition of repayment capacity used
by the development approach also improves in relation to the to the debt capacity
approach. While the latter does not tell which levels of debt are “safe” the former puts
great emphasis on this as, following the debt overhang theory, there are threshold levels
(point A in the Laffer curve) above which debt levels are so high that adversely impact
growth.5
Therefore, the next step is to define those threshold levels. In order to do so, the
developmental approach would require a detailed understanding of the relationship
between debt and growth and other key economic variables and their path, in specific
contexts. However, when it comes to the definition of levels of debt sustainability
(thresholds) the methods used are essentially based on the debt indicator approach
(Hjertholm, 2001:6-7).
5 In reality, there seems to be no rigor when using empirical methods to apply the theoretical approaches. For instance, and perhaps in recognition of the limitation that was the lack of a determination of a safe level of debt, while the IMF/WB definition of sustainability previous to the LIC DSF was only focused on capacity to service debt with no reference to the impact of debt on economic performance – suggesting that finding levels of sustainability should be empirically focused on searching for primary or external surpluses that would guarantee non-decreasing debt-to-GDP and debt-to-exports ratios, respectively – empirically it was also based on the definition of thresholds of solvency.
22

Besides the fact that linking debt to growth does not necessarily mean that developmental
aspects are considered,6 the other major critique to the economic sustainability is related
to the use of the debt indicator approach to assess the threshold levels. Rather than
shedding more light into the debate, the application of the debt indicator approach, more
specifically the way it has been applied, adds limitations to the understanding of the
relationship between debt and economic performance. Hence, the critique to the debt
indicator approach is crucial in the debt sustainability debate. As the debt indicator
approach is central in the sustainability conception of the LIC DSF, its limitations will be
discussed in the next chapter devoted to the critical analysis of the LIC DSF.
From this chapter theoretical discussion, it can be extracted that a complete DSF should
include both the debt capacity perspective and the developmental perspective: in order to
be considered in a sustainable debt position, debt should be low enough so that it can be
fully serviced without representing a resource constraint and an investment and reforms
disincentive that adversely impact economic performance and that at the same time
privileges a growth path consistent with poverty and human development targets. While
the LIC DSF clearly acknowledges much of this in its definition of debt sustainability –
except for the concern with poverty and human development goals – its overall
conception still suffers from a few major weaknesses that will be discussed in the next
chapter.
6 For a call for a stronger link from debt to human development targets, mostly made by NGOs, see Northover et. Al., 1998; Sachs, 2000; Caliari, 2006; and Eurodad, 2006.
23

3. The Low Income Countries Debt Sustainability Framework (LIC DSF)
The Low Income Countries Debt Sustainability framework is used by the IMF to
annually assess long term debt distress risk for low income countries and to guide
recommendations on countries’ future borrowing (and lending) strategy to limit the risk
of debt distress.7 The first part of this chapter briefly describes the main features of the
LIC DSF according to its theoretical underpinnings, the definition of a sustainable debt,
the rationale for the choice of the ratios and how the threshold values were obtained and
the debt distress risk classification criteria. Finally, the first part illustrates how the DSF
is used to define the IDA financing composition of grants and loans and how domestic
debt is treated in the framework. The second part of this chapter discusses the main
shortcomings of the framework.
3.1 Description of the LIC DSF
A. Definition of Debt Sustainability and Theoretical Underpinnings
The LIC DSF is based on the borrower’s approach and defines a sustainable level of debt
if a country can meet its current and future external debt service obligations in full,
without recourse to debt rescheduling or the accumulation of arrears and without
compromising growth (IDA-IMF, 2001:4). It makes use of the debt indicator approach to
derive the thresholds – point A in the Laffer curve – which guarantee that the country is
not defaulting and debt is not constraining growth.8
7 It is worthwhile noting a major difference between this purpose of the LIC DSF and the purpose of the HIPC framework as the latter was linked to the debt relief initiative providing guidance on which countries would benefit from the initiative and the extent of the support to grant. 8 Where the variable on the horizontal axis could be any of the sustainability ratios used by the LIC DSF.
24
From the definition we extract two key points. First, in order for its debt level to be
considered sustainable the country must never default, implying that both liquidity and
solvency are guarantee. Second, the explicit concern that debt servicing should not
compromise growth added to the previous IMF/WB definition, represented a clear
improvement towards a more developmental approach. Here, solvency is perceived as
requesting not only resources generation to serve the debt but also to finance economic
growth.
It is important to note that in the LIC DSF economic performance takes precedence over
debt servicing. This is so because by linking the thresholds of sustainability to debt
service problems (as will be shown next in this chapter) rather than to economic problems
implies that at that threshold non-distress effects of debt on economic performance are
guarantee. Otherwise, values lower than the threshold would not represent a sustainable
position. Implicit on this is that economic problems caused by debt occur before (or at the
same time as) debt servicing problems.
B. The Choice of Ratios and the Methodology to Calculate the Thresholds
In order to properly explain the procedure adopted to define the thresholds of
sustainability it is useful to introduce now an explanation of the Country Policy and
Institutional Assessment (CPIA) concept. Following the work of Kraay and Nehru (2004)
which identified the quality of policies and institutions as one of the main determinants of
debt distress in developing countries, the IMF-IDA (2004) adopted essentially the same
methodology to apply the analysis specifically to LICs. In order to measure countries’
quality of policies and institutions the World Bank developed the CPIA composed of 16
25

indicators of policy and institutional quality. The CPIA score ranges from 1 to 6 and
divides countries into three performance categories: strong, medium, and poor.9 The
main idea is that policy-dependent external debt-burden indicators are relevant because
the debt levels that LICs can sustain are influenced by the quality of their policies and
institutions (IDA-IMF, 2004; IMF, 2007).
In brief, and according to IMF (2004), the methodology used to find the thresholds of
sustainability consisted in the following. Starting by selecting a group of LICs showing
debt distress problems10, calculate the unweighted average of the ratio debt-to-GDP for
the year before debt distress problems started. Obtained an average ratio of 43% for all
countries, this value was interpreted as the global threshold ratio (regardless of countries’
CPIA classification), i.e., the switching point from which an “average” country moves
from a sustainable debt position to a distressed one. In order to differentiate countries
according to the quality of their policies and institutions, the relationship between the
burden of debt and the CPIA score was included by running probit regressions for a given
level of debt distress probability. In this case the probability chosen was 20% in order to
keep the global threshold of 43% (rounded to 45%) as the threshold for countries with
medium CPIA score. From the same probit regression were found the threshold ratios for
the weak and strong CPIA countries. The same procedure was taken to find other
threshold ratios resulting in the first list of threshold ratios differentiating countries
according to their CPIA score, later updated (to include new available data) to the
following list:
9 A rating at or above 3.75 corresponds to strong performance; a rating between 3.25 and 3.75 reflects medium performance; and a rating at or below 3.25 corresponds to poor policy performance. 10 defined as significant arrears accumulation (in excess of five percent of total debt) on obligations to official creditors.
26

Table: Debt Burden Thresholds under the DSF (Applying to external public debt)
Source: IMF (2007:8).
The ratios chosen relate debt to measures of repayment capacity. The ratio to exports
relate the debt burden to the availability of foreign exchange earnings of the economy,
the ratio to fiscal revenues relate debt burden to the availability of domestics resources,
while the ratio to GDP relates the debt burden to the broadest measure of the income-
generating ability of the economy (Hjertholm, P. 2001; IMF, 2004). The choice of these
indicators shows the concern with both the domestic savings gap and the foreign
exchange gap as they both contribute to the countries repayment capacity.
IMF-IDA (2004) and IMF (2007) further explains the rationale for the choice of the
ratios. Debt stock indicators provide a useful measure of the total future debt-service
burden of existing debt. This burden is best measured using the net present value (NPV)
of debt to capture the concessionality of outstanding debt.11 The debt service ratios are
taken as the most obvious measure of the Cash Flow effect, i.e., the immediate burden
11 In fact, as the framework uses a discount rate higher than the interest rate for concessional lending, the NPV of debt for countries benefiting from highly concessional lending is significantly less than the nominal value. The discount rate used is often of 5%, but adjustable whenever the six-month average U.S. dollar commercial interest reference rate (CIRR) deviates from the rate in the template by more than 100 basis points for a period of six months or more (IMF, 2007).
27
that debt imposes on a country by crowding out other important uses of scarce resources
by the borrower. NPV debt ratios are summary indicators of the burden represented by
the future obligations of a country and thus reflect long-term risks to solvency, while the
time path of debt-service ratios provides an indication of the likelihood and possible
timing of liquidity problems.
Having the thresholds defined the next step of the LIC DSF is to use a forward looking
analysis of debt and debt services dynamics and its relation to relevant economic
indicators benchmarked against the thresholds to produce the debt distress risk
classification.
C. Debt Distress Risk Classification
In order to assess long term debt distress risk, the framework needs to project the
evolution of debt and other key economic indicators. The projections are essentially
based on assumptions regarding the future behavior of the country’s economy. Historical
data as well as the projections for a range of macroeconomic variables are then inserted
in two mandatory pre-set templates,12 designed for a twenty-year projection period, and
automatically produce output tables that display the dynamics of debt and debt-service
ratios in the baseline scenario, alternative scenarios and stress tests (IMF, 2007).
The following step is to use the results obtained in the different scenarios and stress tests
and compare them with the respective threshold ratios to classify countries according to
the debt distress risk. This comparison can result in a country’s classification under four
12 One for public, publicly-guaranteed (PPG), and private external debt and one for total public sector debt including domestic debt (where possible including state-owned enterprises).
28

possible categories: low, medium or high risk or in current debt distress position (for
more details see annex 1).
The LIC DSAs results form the basis for determining the grant/loan mix in future IDA
allocations and those of some other multilaterals, including the African Development
Fund. IDA only countries judged to be at high risk of debt distress risk receive 100
percent grant financing from IDA, while countries at moderate risk receive a 50/50 blend
of grants and traditional credits, and countries at low risk continue to receive 100 percent
credit financing on standard IDA terms. To reduce undesirable uncertainty regarding the
country’s financing terms from IDA from annual fluctuations in the CPIA the LIC DSF
uses a three-year moving average CPIA score (IMF, 2007).
According to IMF (2007:13) the LIC DSA also takes into account the burden of domestic
debt. However, this assessment does not affect a country’s classification of the risk of
(external) debt distress and therefore IDA’s grant allocation. Whenever domestic debt
levels are perceived high or increasing fast and where its consideration would lead to a
different sustainability assessment than that under the external DSA, the DSA write-up
should provide an expanded commentary, reviewing debt-servicing risks and medium-
term fiscal implications.
29
3.2. Critical Analysis of the LIC DSF
This part presents a critical analysis of the LIC DSF focusing on the choice of the ratios
and the methodology to define the thresholds of sustainability; on the use of the CPIA
concept and the link between the DSF and the IDA financing framework. The discussion
shows that the way the framework is conceived and applied lacks a proper link between
debt and development issues being reduced to a mere financial approach and even as such
showing some crucial limitations. Hence, taking into account relevant developmental
aspects would imply a reform of LIC DSF and of its criteria of sustainability.
C. Critique to the Choice of Ratios
The ratio of debt (or debt service) to exports is taken as a proxy for the availability of
foreign exchange to service the debt. Behind the choice of the thresholds of sustainability
is the assumption that there exists a set of switching values (or at least a narrow range of
values) from a sustainable to a debt distressed position, each of them applicable to all
debtor countries in the same CPIA category at all times. Also implicit in the choice of
this indicator is the assumption that the country is able to use a fixed fraction of its
exports revenues for debt servicing (Belloc and Vertova 2005:9).
However, not only there is no reason to believe that the threshold would be the same for
every low income country (in the same CPIA ranking category)13 as there is also no
reason to accept that the same ratio represents the same burden for the same country in
every stage of development or in every year. The reason for this is that the ratio of debt to
exports says very little about the government capacity to service its debt. The burden will
13 The critique to the CPIA conception and its role in the DSF will be developed next in this chapter.
30
depend on the share that the government can obtain from exports revenues and from other
domestic sources of foreign exchange and, from that money, the share that can go for
debt servicing without constraining growth. Both these aspects can vary not only from
country to country but also from year to year within the same country.
In reality, as noted by Gunter (2003:8), while these ratios may have a lot more
explanation power for middle-income countries whose large part of debt is private and
exports growth is closely matched by increases in trade surplus, for import and aid-
dependent economies like HIPCs these ratios tend to hide the real constraints of foreign
exchange for debt servicing that the economy faces.
First, not all exports revenues belong or can be accessed by the government. In fact,
HIPCs governments usually get only a small proportion of their exports. This can happen
because in many HIPCs large part of the exports are from multinationals who use most of
the foreign exchange earnings for imports of equipment, salaries of expatriate workers,
and transfers of profits as part of the fiscal benefits granted by the local government.
Second, HIPCs’ exports reflect a large degree of re-exports meaning that no foreign
exchange is earned by the country. Finally, the point made by Gunter (2003) regarding
the disincentive effect that may impact an export-led strategy resulting from the use of
the debt-to-export ratio in the HIPC framework, is valid for the LIC DSF. This may
happen because a higher debt-to-export ratio increases the risk of debt distress resulting
in a higher share of grants in its IDA financing.14 When these factors are associated to the
fact that many LICs are highly dependent on imports for investment and basic
14 However, this should not be generalized as it is wrong to assume that all LIC governments are willing to sacrifice valid development strategies to obtain larger benefits from external financing. Curiously, by putting 20% upfront discount to the share of grants allocated to each LIC justified under the need to control for moral hazard problems indicates that this is the perception of the IMF/WB.
31

consumption, the possibility of import reduction (so that exports growth can be
accompanied by a trade account improvement) without constraining growth becomes
further limited. An additional problem highlighted by Martin (2004) is related to the high
volatility of exports which does not provide a fair picture of the long term burden of debt
in relation to the countries export.
While the previous points made by Gunter (2003) about the need to consider trade
surplus, instead of simply exports, when assessing repayment capacity is a valid
improvement, it remains quite limited in its ability to measure government debt servicing
capacity. The trade account represents only one of the possible sources of the country’s
foreign exchange. A more comprehensive approach should consider not only the trade
balance but also the balance from all the other BoP accounts excluding grants (to keep
the focus on the domestic capacity to generate resources). In addition, even after
including all the relevant account balances, the sum of their balances would not be
automatically translated into foreign exchange available to the government to service
debt. This is so because of two aspects. First, in order to be able to access this foreign
exchange the money would have to be generated by the government itself (public
enterprise exports, selling of public assets, or taxes charged in foreign currency) or, being
private exports, they would have to enter into the central bank circuit and this depends on
the prevailing agreements between the government and the respective private entities. In
addition, to this as argued by Martin (2004:16) governments may be unable (or unwilling
given inflationary risks) to buy foreign exchange in the markets to transform private
export earnings into government foreign exchange to pay external debt service. Second,
by requesting in its definition of debt sustainability that debt servicing should not
32

constrain growth, the LIC DSF suggests that only after the amount of foreign exchange
necessary for developmental activities are subtracted from the foreign exchange that the
government can access, it would be feasible to use the remaining to service the debt.
A similar analysis can be done for the case of the ratio of debt (or debt service) to
government revenues. Not all government revenues are available for debt servicing if we
consider that the government need to make developmental expenses. As government
revenues growth is likely to be accompanied by expenses growth, considering only the
debt-to-revenues ratio is a weak proxy of the evolution of repayment capacity. The
dynamics of the primary balance would provide a more accurate assessment. In addition,
is the now widely acknowledged fact that debt needs to be serviced in foreign currency
and that government revenues in local currency cannot be automatically transferred to
foreign exchange – not neglecting its relevance to the debt repayment capacity, though.15
In reality, the previous points raise another limitation of the DSF which is the fact that
fiscal and external sustainability are assessed independently when clearly their dynamics
impact on each other. As government revenues can also be in foreign exchange the same
resources will be included when assessing both external and fiscal sustainability
independently. Naturally, this means that the share of foreign currency in government
revenues has a direct impact on both fiscal and external sustainability. Also, the fact that
government may access private foreign exchange earnings if they enter into the central
bank circuit will depend on the government capacity to generate revenues in local
15 The dissertation accepts the observation that increase in government revenues from printing new money may generate perverse effects to the economy (linked to inflation) and therefore will keep it restrained to revenue collection. Running down reserves is not considered as an option because of the threat that it represents to the foreign exchange stability, capital flight and BoP crisis. For obvious reasons, contraction of new debt (domestic or external) is also not considered as a source of revenue to increase debt capacity servicing.
33

currency to buy that foreign currency. In sum, the capacity of the government to access
external resources to service the debt and finance development depend simultaneously on
the country’s (public and private) capacity to generate foreign currency and on
government capacity to generate revenues in local currency. Therefore, a more
appropriate measure of debt sustainability should consider how the fiscal and external
positions jointly contribute for the debt sustainability.
This point can be reinforced by the fact that, besides external debt representing by large
the largest share of total public debt, there is also a domestic debt component which tends
to increase in many LICs and which can be directly serviced using government revenues
in domestic currency. However, an additional shortcoming is that the DSF does not
include the domestic debt in its assessment of debt distress risk, simply acknowledging its
relative importance in the country’s DSA write-ups. Also overlooked in the DSA is the
role of private non-publicly guaranteed debt. If this debt is growing out of the privates
repayment capacity the all country creditworthiness and stability will be affected with
negative repercussions on growth.
Regarding the use of debt ratios to GDP, Wyplosz (2007:4) and Martin (2004:16) argue
that there is little relationship between GDP and the amount of adequate revenues that
can be collected.16
Concerning the use of the NPV of debt, as noted by Gunning and Mash (1999:3), at a
general level, credit constraints limit the applicability of sustainability analyses based on
16 While Martin considers that the same is valid for the debt-to-GNI ratio it could be the case that, as compared to the GDP the GNI replaces the trade balance for the current account balance, even if the current account balance is more correlated to repayment capacity if it represents a small fraction in relation to the non correlated part of the GDP – as it does in most of the LICs and usually being negative – then the non-correlated trend will dominate.
34
present values. Besides considering that NPV of debt are being calculated by discounting
debt much more heavily than it should,17 much more important is the more general point
made by Martin (2002; 2004) that debt overhang problems arising from private market
actors are related to their perception of the burden of debt considering nominal values
rather than present values of debt.
In other words, the use of NPV in commercial terms is done to answer the question: if the
debtor wishes to repay today its future debt obligations how much would he have to pay?
Or, as put by IMF (2004:15) the amount that the debtor would have to put aside in
reserves today, to cover its future debt-service obligations. Of course, this question is not
relevant for low income countries as it is very unlikely that they can do so using their
own resources. While it can be found some evidence of growing reserves this seems to be
more linked to prevention measures against disruptive fluctuations of the exchange rate
than to serve debt obligations. In fact, adopting or accepting the strategy of building
reserves today to serve future debt obligations imply that borrowers and creditors,
respectively, do not believe that investing in the economy is the best way to generate
resources to repay the debt. Therefore, it is very improbable that NPV values are the ones
considered by the country that may trigger (or not) debt overhang problems.
B. Critique to the Methodology Used to Find the Threshold Values
Besides the fact that the ratios chosen are very weak measures of the burden of debt to
the repayment capacity and to development, the methodology adopted to find the
17 Martin’s (2004:14) comments on this are related to the HIPC II but are also valid for the LIC DSF. Rather than using CIRR rates, he argues for a discount rate freezed at those applying on investments by developing countries (around 2.5-3%).
35

thresholds are not well supported in analytical terms adding problems into the
framework.
First, as wisely asserted by Hjertholm (2001:13) despite the fact that the objective of
finding the thresholds was to define debt levels that posed a problem for economic
growth the procedure taken was based on singling out countries facing problems for debt
servicing. While debt servicing problems may be related to economic growth problems it
is a different matter.18 Moreover, as highlighted by Caliari (2006), the DSF establishes no
link between debt and poverty and human development targets. Most likely, this is a
reflection of the overly simplistic and misguiding World Bank’s perception that growth is
good for the poor.19 However, as deeply discussed by Nissanke and Thorbeck (2007) the
channels from which growth impacts poverty are complex and the relationship is not
necessarily linear and positive.
Therefore, the methodology adopted was essentially based on the financial approach as
debt burden was not linked even to economic growth (they do not assess which levels of
debt are so large that they adversely affect growth, regardless of whether debt is being
serviced in full or not) but to debt servicing. Depending on whether in each of the LICs
considered debt servicing problems started before of after economic growth problems the
threshold value may have been pushed down or up, respectively, than the real value.
18 While this critique from Hjertholm (2001) refers to the procedure adopted to analyze debt indicators from the World Development Tables 1989-90 and 1992-93 and which guided the definition of the HIPC thresholds, for whatever aspects that have not been replaced with the introduction of the LIC DSF the dissertation will present them as valid comments on the LIC DSF. 19 Linking debt sustainability to the MDGs, IMF-IDA (2007:5) states : As they (debtors’) strive to reach the MDGs, these countries will need to preserve debt sustainability by keeping new borrowing in step with the capacity to repay, adopting better policies and institutions that help accelerate growth, managing debt prudently, and increasing resilience to exogenous shocks. This is clearly reflects a poor understanding of the mechanisms through which debt interacts with development.
36

Second, the methodology adopted to obtain the global threshold ratios (without
considering the CPIA discrimination and which defined the threshold ratio for countries
with medium CPIA score) was to take unweighted averages of the ratios presented by
each of the countries facing debt servicing problems. This methodology establishes no
link between the size of debt and the severity of debt problems. The list of countries
considered contained some extreme observations showing a non normal distribution
skewed to the right which tends to raise the average value used as the threshold.20
Third, Nissanke and Ferrarini (2007:10) references Ferrarini (2007) who argues that the
empirical basis underlying the DSF is remarkably thin, relying exclusively on the
empirical results reported in a preliminary World Bank working paper by Kraay and
Nehru (2004), and the IMF replication of similar analysis (IMF-IDA, 2004). The
approach adopted in these studies fail to take account of early signs of illiquidity which
are a precursor to the occurrence of distress; of aid volatility which could have explained
a high portion of illiquidity and repayment problems; all of which resulted on the
adoption of a weakly supported idea that debt distress problems depend on the quality of
policies and institutions as measured by the CPIA; Finally, the proxies used for shocks
are grossly inadequate as they are unsuitable for distinguishing between exogenous
shocks and endogenous factors.
Finally, as noted by Belloc and Vertova (2005), the procedure is an arbitrary use of
history: the actual contract fulfillment by debtors is analyzed on the basis of the past
20 The graphical distribution for the debt-to-GDP ratio can be found in IDA-IMF (2004). While this work does not present the other ratios distributions, it should be noted that the in the distribution of debt-to-exports ratio for the countries facing debt distress problems and that were used to find the HIPC thresholds, the skewness to the right was even more accentuated (see Hjertholm, 2001).
37

fulfillment. However the past contract fulfillment depends on the past characteristics of
the relationship (that is on past power relations and past strategic interactions).
In sum, the technical and theoretical shortcomings of the methodology chosen to find the
thresholds of sustainability casts doubts on the validity of the results found adding even
more weaknesses to the fact that the ratios don’t seem appropriate to assess the impact of
the debt burden on both financial as well as economic and development targets.
C. Critique to the CPIA and the Role of DSF in the Aid Architecture:
The use of the CPIA in the debt sustainability framework presents several
shortcomings.21 First, Nissanke and Ferrarini (2007) point out that the motivation for the
introduction of the CPIA in the aid architecture and in the DSF comes from a technically
weakly supported idea that aid effectiveness depends on the quality of policies and
institutions as measured by the CPIA. Indeed, (Ferrarini, 2008) argues that changes in the
definition of debt distress events and the use of the UN’s economic vulnerability index
(EVI), or alternative shock measures undermines CPIA’s significance as a predictor of
debt distress. Furthermore, the concept of good policies and institutions is based on a
narrow conception of the developmental process where the CPIA scoring and its
relevance on the decision of IDA financing reflects the imposition of single model of
development. This model is essentially the same as that imposed under the
conditionalities of SAPs (which produced the widely recognized poor results), with a
21 Other shortcomings of the CPIA and more related to its role in the aid architecture can be found in Nissanke and Ferrarini (2007). In brief, those include the fact that the formula gives precedence to aid productivity over countries need; the fact that it neglects that the quality of institutions and policy implementation capacity are a reflection of countries’ stages of development and therefore it is unfair to treat equally countries with same CPIA score but at different levels of development; and its inappropriateness to build the sense of ownership and partnership in the relation between recipients and donors.
38

replacement of the ex-ante for ex-post conditionalities, and reflect the same negligence
from the IMF/WB to the recipients’ perceptions of the development strategies.22
Second, the imposition of donors’ policies over recipients’ options raises problems of
ownership that may lead to reluctance in implementation which, in its turn, may result in
a lower CPIA score and consequently lower IDA financing. By ultimately affecting
growth this could end up creating a vicious cycle where low CPIA score and low growth
feedback each other with debt position entering into the cycle exacerbating the perverse
effects.
Third, Nissanke and Ferrarini (2007) argue that, even as a measure of that single minded
development model, the CPIA still suffers from other major shortcomings. Those are
related to the fact that the CPIA is not an objective measure of the quality of policies and
institutions, but a set of subjective scores by bank staff, based on questionnaires
organized with country teams at the WB. In addition, the WB assertion that the
assessment of quality of policies and institutions is done by considering only aspects
under the country’s control (inputs) is deceiving. In reality, many indicators can be seen
as reflecting outcomes influenced by exogenous events.23 This performance-based aid
22 This limitation of the CPIA and how repayment objectives may contradict developmental goals is interestingly put by Caliari (2006:13). According to him, being a one-size-fits-all measurement of what a “good policy” is, the CPIA in itself contradicts the intention of the DSF to bring about country-by-country analyses. Good policies are not universal and depend on what are the priorities that the country is seeking to achieve under what prevailing circumstances. For instance concerning rural institutional settlements, one would expect the specialization on export products to be highly graded if one seeks better debt repayment capacity, but anticipate agrarian reform and the protection of poor farmers if poverty reduction is at stake.
23 Nissanke and Ferrarini (2007) mention as examples of aspects affected by exogenous factors outside the governments control and endogenous to growth, the ability of governments to pursue aggregate demand or fiscal policy, consistent with price stability and achieving external and internal balances and the aptitude in providing public goods depends also on their revenue-raising capacity.
39

disbursement has the additional disadvantage that it can very easily result in highly
volatile aid flows with severe consequences to liquidity and debt position.
Fourth, the way both the DSF and the IDA financing allocation framework are conceived
aggravates these liquidity problems as well as solvency problems. This is so because first,
as the share of grants increases as the higher the debt distress risk classification and as
grants are subject to an upfront 20% discount, then the percentage of total IDA financing
that is discounted upfront increases for countries with higher debt distress risk.
Obviously, this can create or intensify debt sustainability problems if those reflect
liquidity constraints (Nissanke and Ferrarini, 2007). Second, as put by Oddone (2007)
both liquidity and solvency are undermined because countries facing shortages in
resources are not allowed borrowing from other non-concessional sources at the risk of
suffering a penalization from the IMF/WB. This penalization consists in reducing IDA
allocations by 20 to 40 percent or hardening the terms of its loans, by increasing the
interest rate and/or shortening the loan repayment period. Third, solvency problems are
further heightened by the fact that the DSF is highly dependent on assumptions about the
future path of key economic variables which, as noted by Gunter (2003) and Martin
(2004), the IMF/WB tend to define them very overoptimistically. Unrealistic optimistic
scenarios result in lower share of grants which might undermine countries solvency.
Fifth, Despite the evidence that vulnerability to exogenous shocks were one of the most
important determinants of the debt crisis and recognized even by the WB/IMF, they are
only given significance as crisis predictors in the LIC DSF alternative scenarios
prediction, being left out of the process of defining indicative thresholds and of the core
IDA allocation process (Nissanke and Ferrarini, 2007:11-12). Even as a crisis predictor
40

the role of shocks is underestimated because first, as Arnone (2005:13) argues, shocks are
only considered in a partial equilibrium and no secondary effects are considered and,
second, as noted by Nissanke and Ferrarini (2007:10), the DSF fails to account for large
shocks occurring with probability lower than 25 per cent.
In this sense, Nissanke and Ferrarini (2001; 2004; and 2007) argue for a state contingent
debt contract as ex-ante debt relief mechanism to deal with debt crises facing commodity
dependent, low income countries. By making the distinction between the consequences of
debtors own efforts and events beyond its control this scheme could align the incentives
of and improve the overall relationship between borrowers and lenders as well as reduce
the debtors’ liquidity constraints.
In sum, the highlighted shortcomings of the LIC DSF evidence that the framework has no
developmental content as it completely neglects the relationship from debt to poverty and
human development, it poorly addresses economic sustainability as it does not link debt
to economic problems, and it inadequately addresses financial sustainability as it depends
on weak proxies of repayment capacity and on improperly defined thresholds and
because in association with the IDA allocation process it can potentially create or
exacerbate both illiquidity and insolvency problems.
41

4. Mozambique Debt Sustainability Assessment 2007
This chapter presents a critical analysis of the Mozambique’s DSA 2007. The chapter
starts by presenting the assessment main findings followed by a critical discussion of the
assumptions used. The last part of the chapter discusses how the Mozambique DSA could
take into account some of the recommendations made in the previous chapters.
4.1 The Results
The results of the Mozambique DSA 2007 placed the country in the low external debt
distress risk category. Indeed, the assessment produced results for the ratios of
sustainability significantly below the sustainability thresholds for the group of medium
CPIA performers (corresponding to the country rating). The DSA results indicate that:24
The NPV of PPG external debt-to-GDP ratio is projected to rise from 11.6 percent in
2007 to 16.1 percent by 2013, after which it slowly declines over the remainder of the
projection period to 9.9 percent by 2027. It thus remains well below the country-specific
threshold of 40 percent. The NPV of PPG debt-to-exports ratio increases from 30.3
percent in 2007 to 63.3 percent by 2016—also far below the threshold of 150 percent—
before falling back to about 44 percent again by 2027. The NPV of PPG debt-to-revenue
ratio increases to a peak of 94.5 percent in 2010, significantly below the threshold of 250
percent. It then declines rapidly to 35.9 percent by 2027, driven in part by the assumed
increase in revenue collection.
The debt service indicators also remain below their thresholds under the baseline. As a
result of the assumed full delivery of remaining HIPC debt relief in 2007, PPG debt
24 See annex II for more detailed results in tables and graphs.
42

service falls in 2007. The PPG debt service-to-exports ratio, which has a threshold at 20
percent, falls from 2.5 percent in 2006 to 1.1 percent in 2007, peaking at 4.6 percent in
2021 and then gradually decreasing to 3.8 percent in 2027, always well below the
threshold. The ratio of PPG debt service to fiscal revenues falls from 6.6 percent in 2006,
to 2.9 percent in 2007, increasing slowly to 5.1 percent in 2011 and declining to 3.1 by
2027, well below the 30-percent threshold.
4.2 Critical Analysis of the Assumptions25
Of course, the DSA results depend substantially on the assumptions adopted. Some of
these assumptions are questionable on several grounds. First, the projected GDP growth
rate seems to be overoptimistic. In the last ten years Mozambique has achieved an
average annual growth rate of 8 percent. The LIC DSA projects an average of 7 percent
growth until 2010 and 6.5 until 2027. This means that in 30 years Mozambique is going
to achieve an average annual growth rate of 7 percent. The experience from other
developing countries and dynamics of the Mozambican economy shows that this average
will be difficult to sustain during such a long period. The last years’ strong economic
growth has been driven primarily by foreign-financed “mega-projects” and large aid
inflows (AfDB-OECD, 2008:461) as well as peace dividends from 1992. The small
linkages that the megaprojects have with the rest of the economy including small
contributions in taxes revenues, employment, net foreign exchange associated with a
extremely weak increase in agricultural productivity – a sector that employs around 70%
25 Annex III presents a more exhaustive list of assumptions as presented in the DSA report.
43

of the work force – reveals a development path difficult to sustain this rate of growth in
the long run.26
The assumption that the level of grants will be maintained at the high levels of 9% of
GDP in the medium term is being challenged by the recent reluctance from the donor
community to increase or to maintain previous levels (in absolute terms) of direct support
to public budget in a response to what they perceive as a fail from the government to
improve governance and fight corruption. According to Mozambican Information
Agency (AIM), only four countries promised an increase in their support namely Austria,
Germany, Ireland and Spain. Sweden and Switzerland announced a reduction in the 2009
while the other donors will only keep their 2008 levels. Frank Sheridan’s the chairperson
for the group of 19 donors (known as the Programme Aid Partners) made it clear that the
concerns over corruption are not some eccentric Swedish position, but are common to the
entire group of 19 (AIM, August, 19). The government response was that they would
cover the gap using own resources.
Clearly, this poses a bigger strain in the government revenues to both finance
development and service the debt which main drive the country to search for additional
non concessional loans which may speed up debt accumulation. In addition, if we
consider that donors could use also the debt relief promises to pressure the government
then the DSA assumption that full HIPC debt relief would be delivered in 2007 is at odds.
In fact, from the four countries that have promised full HIPC debt relief delivery by 2007,
namely Portugal, France, Russia and Japan only Portugal has done so this year.
26 Some recent articles in Mozambican newspapers and also by the Joseph Hanlon from the Milton Keynes Open University argue that part of the economy growth is due to drugs contraband with Mozambique being a preferable storage and transit place. Some of the main people involved – with respective names cited in some of the articles – are investing in the economy to laundry the illegal money.
44

The assumption that government revenues (excluding grants) will grow from the actual
14 percent to reach about 22 percent by 2017 is certainly difficult to justify based both on
other low income countries experience as well as considering the large size of the
informal sector and the extremely limited absorption capacity from the formal. These
could be some of the factors behind the AfDB-OECD (2008:466) skepticism about the
positive impact of the fiscal reforms underway.
The assumption that the inflation rate would decrease to converge to the South African
inflation rate of 5%, and because oil prices will stabilize is also questionable. First, this is
not supported by historical data for the last 10 years which shows a two digit average
inflation rate. Second, while inflation in South Africa is easily transferred to the
Mozambican economy that is not the only source of domestic price increases. Inflation in
Mozambique is highly sensitive to the exchange rate Mozambican Meticais/South
African Rand, to political elections which happen two in every five years, and to oil and
food prices. The assumption that oil prices will and stabilize should be taken with
caution. The oil prices are inherently difficult to predict as it depends not only on
economic but also on political factors. In fact, the IMF projections largely failed to
predict the major recent oil price surges. Last years’ international food prices show an
increasing trend and as Mozambique is a net food importer this can contribute to higher
domestic inflation.
The DSA assumes that export growth will accelerate from 5.5 percent in the medium
term to 6.1 percent in the long term and imports will decelerate slowly from 6.6 percent
in the medium term to 6.3 percent in the long-term. The noninterest current account
deficit after grants is projected to expand from 3.2 percent of GDP during 2007–12 to 3.7
45

percent in 2013–2026, due to slightly higher import growth than export growth.
Traditional exports are expected to grow at the Mozambique’s main trading partner’s
economic growth rate. However, it is not explicit to what extent the DSA take into
consideration two major events that will impact the country’s trade performance. Those
are the SADC trade protocol and the Economic Partnership Agreement (EPA) between
SADC/EPA group and the European Union (EU). On the export side, it is not clear how
the EPAs will add benefits to the Cotonou and EBA agreements which already grant
almost total duty and quota free access to the EU market. According to Cirera (2004) and
Castel-Branco et. Al (2005) in spite of this free access to the EU market, Mozambique
has not been able to substantially increase or diversify its exports. This can be explained
both by the non-tariff barriers as well as by the country’s low supply capacity. So far, it is
not evident that the EPAs will address those concerns which could be done by providing
more flexible rules of origin to Mozambican exports and by providing additional
resources to development that would allow the increase of supply capacity and the
response capacity to the growing technical and Sanitary and Phytosanitary (SPS)
requirements of the EU market. According to Alfieri, A. et Al (2006:13) technical and
SPS requirements are also increasingly hindering exports to South Africa, by far the
largest market in SADC. However, the biggest threat that so far the format of the EPA
poses is on the domestic production capacity and imports. This is so because of the
reciprocity demand from the EU under the EPA which may result in a surge in imports
from more efficient EU producers undermining local industries. The DSA is also not
explicit on how the recent trend of rising food prices will impact the trade balance
46

considering that Mozambique is a net food importer. Finally the dynamic of oil prices
will be also a major determinant of Mozambique’s imports.
Another crucial shortcoming of the DSA assumptions is that it assumes that the variables
follow a smooth time path. In reality, as noted by Nissanke and Ferrarini (2001), in
HIPCs variables determining the resource gaps and debt dynamics follow a much more
complicated and highly volatile time paths that engender their debt dynamics. This
volatility can explain much of the debt crisis problems that many HIPCs faced. Persistent
resource gaps associated with primary commodities dependence and high export
concentration – exports of aluminum and natural gas represent more than 70% of national
exports – makes Mozambique highly vulnerable to any price or volume shocks affecting
its exports.
4.3 Key Issues for the Application of a Different Debt Sustainability Criteria
and Main Implications for Mozambique.
The DSA projections confirm that the Mozambican case is not different from the general
LICs in the sense that exports growth is usually not accompanied by an improvement in
the trade balance, moreover in the repayment capacity, predicting that this tendency will
persist at least for the next 20 years. It also predicts a continuing dependency on aid to
finance the fiscal gap (although decreasing in proportion to GDP in the long-term).
As the country’s import and public expenditures are largely related to basic investment
and consumption,27 a first step towards an improved assessment of the long term debt
sustainability could be done by simply replacing the ratios used by the DSA to take into
27 See PARPA II – Mozambique PRSP (2006-2009) – for a detailed list of government priorities reflecting its focus on social sectors, public infra-structures and rural development.
47

account the fact that the country’s development is highly dependent on imports and
government expenditures. For instance, considering the import dependence, the ratio of
debt service/exports would have to be replaced by the ratio of (debt service +
imports)/exports meaning that exports must pay for debt servicing as well as for imports.
This first improvement has the advantage of being easily applicable if the country’s DSA
templates are available, which is not the case. Happily, the availability of import and
export projections in the Mozambique DSA 2007, allows for a partial application of the
proposed methodology, which shows that:
1. As imports start from a higher level in 2006 and grow faster than exports, the ratio
(debt service + imports)/exports will grow faster than the debt service/exports ratio.
2. This implies that using the alternative criteria that take into consideration the need to
pay for the essential imports to keep growth prospects, will result in debt distress risk
growing faster than in the DSA. Whether this faster growth reaches worrying levels
would require benchmark points which still do not exist.
This same principle can be generalized when additional data is available allowing the
adoption of more comprehensive ratios. Following part of the previous chapters
theoretical discussion the ratios of NPV debt (or debt service)/exports and NPV debt (or
debt service)/government revenues would have to be replaced by (nominal debt (or debt
service) + expenses in foreign exchange)/exports and by (nominal debt (or debt service) +
government expenses)/ government revenues, respectively.28 These new ratios are
28 All ratios to government revenues exclude grants.
48

essentially an acknowledgment that foreign exchange and government revenues have to
pay for both debt service and for developmental activities.
In the absence of defined thresholds for the proposed ratios, their evolution could be
benchmarked against the evolution of the DSA ratios. In order to focus the comparison
on the different ratios impact on debt position it would be recommended that, in a first
stage, the assumption about the key variables are kept the same. This comparison could
inform whether the ratios are improving (reflected by its reduction) or deteriorating
(reflected by its increase). If both are decreasing or increasing the analysis could focus on
the relative increase or decrease, respectively, of one in relation to the other. Taking the
new ratios values for the year when Mozambique debt problems started could provide a
threshold ratio (bearing in mind all the shortcomings that this methodology has, as
previously discussed).
It is obvious that the methodology used in this chapter does not address all the
shortcomings of the DSF. As noted before this would be a first step towards a more
comprehensive and developmental approach to debt sustainability. However, these little
improvements applied to the analysis of sustainability based on the external sector
performance, already show a different trend from the DSA casting additional doubts
about the validity of the results showing that the country faces a low long term debt
distress risk.
49
5. Conclusions and Recommendations
Applying a framework to monitor low income countries debt dynamics is fundamental in
order to take preventive measures seeking to avoid the perverse effects that debt can have
on countries’ development dynamics. In this sense the introduction of the LIC DSF
should be welcomed.
However, the potential benefits from its adoption could be overwhelmed by the dangers
accruing from its conceptual and technical fragilities. Those fragilities not only lead to
dubious results from the country’s DSA as they also may produce a negative direct
impact on the countries’ debt position.
While improper assessment of countries’ debt distress risk arise mainly because of the
misperception of the LICs structural characteristics resulting in the use of weak proxies
of repayment capacity benchmarked against improperly defined thresholds of
sustainability with no link to economic and development concerns, the negative impact
on the country’s debt position may arise because of the impact on liquidity and solvency
that the DSF and its role in the international aid architecture produce, as a result of a
negligence of specific countries’ needs and structural characteristics in favor of imposing
a one-size-fits-all development model and its analytically weakly supported ideas.
Therefore, acknowledging both the positive and negative aspects of the DSF, some
improvements would be welcomed. These would have to include i) a replacement of the
indicators of debt burden to take into account not only the countries’ capacity to service
the debt but also their needs to take developmental expenses; ii) a proper definition of the
thresholds taking due consideration of external shocks vulnerability and linking debt to
50
development problems with an improved understanding of their relationship; iii) an
added joint framework to assess fiscal and external sustainability with adequate
consideration of the impact of domestic and of private non-publicly guaranteed debt on
the overall debt distress risk; and a reform of the DSF reccomendations and the aid
architecture to replace the ex-post debt relief measures for a state contingent debt contract
as ex-ante debt relief mechanism. These improvements imply that the DSAs would
require a more country specific in-depth analysis of the country’s structural
characteristics and its debt and development dynamics.
51

References
1. AfDB-OECD (2008). African Economic Outlook. 2. Agénor, P. and P. Montiel (1996) Development Macroeconomics, Princeton: Princeton
University Press. 3. AIM (2007). Tax Revenue to Fill Gap caused by Swedish Aid Reduction. Nr. 134, 19
August. 4. Alfieri, Andrea et Al. (2006). Estimating the Impact on Mozambique of Different Trade
Regimes: SADC, SACU or MFN? Discussion Paper nr. 29E, August 2006. Ministry of Planning and Development. Republic of Mozambique.
5. Arnone, Marco et. Al (2005). External Debt Sustainability: Theory and Empirical Evidence.
6. Bacha, E. (1990), ‘A Three-gap Model of Foreign Transfers and the GDP Growth Rate in developing Countries’, Journal of Development Economics, 32, 279-296.
7. Belloc, Marianna and Vertova, Pietro (2005). On foreign debt sustainability of developing countries: towards a long run approach for development. Department of Economics University of Siena, Siena, Italy.
8. Birdsall, Nancy and Deese, Brian (2004). Beyond HIPC: Secure Sustainable Debt Relief for Poor Countries. Center for Global Development. Working Paper No. 46.
9. Caliari, Aldo (2006). The New World Bank/IMF Debt Sustainability Framework. A Human Development Assessment. Background Paper prepared for the CIDSE/CI Working Group on Resources for Development.
10. Castel-Branco, Carlos Nuno et. Al, 2004. National Assessment Study of an Economic Partneship Agreement (EPA) Between Mozambique and the European Union (EU).
11. Chenery, H.B. and Strout, A.M. (1966), ‘Foreign Assistance and Economic Development’, American Economic Review, 56.
12. Cirera, Xavier (2004). Analysis of the Potential Impact of the Economic Partnership Agreements.
13. Cordella, Tito, Luca Antonio Ricci and Marta Ruiz-Arranz. 2005. Deconstructing HIPCs’ Debt Overhang, mimeo, Washington D. C., International Monetary Fund.
14. Eaton, Jonathan (1993). ‘Sovereign Debt: A Premier’. The World Bank Economic Review, 7 (2): 137-72.
15. Oddone, Francesco (2007). Debt sustainability or defensive deterrence? The rise of new lenders and the response of the old. Eurodad.
16. Ferrarini, Benno (2008). Proposal for a Contingency Debt Sustainability Framework. World Trade Institute, Bern, Switzerland.
17. Goldstein, Morris (2003). Debt Sustainability, Brazil, and the IMF. Institute for International Economics. Working Paper nr. 03-1. February 2003.
18. Gunning, Jan Willem and Mash, Richard (1999). Debt Relief and Debt Sustainability For Low Income Countries. Centre for the Study of African Economies. University of oxford.
19. Gunter, Bernhard G (2003). Achieving Long-Term Debt Sustainability in All Heavily Indebted Poor Countries (HIPCs). Discussion Paper prepared for the Intergovernmental Group of 24 (G-24) XVI Technical Group Meeting in Trinidad and Tobago. February 13-14, 2003.
20. Gunter, Bernhard G., (2002) What’s Wrong With the HIPC Initiative and What’s Next?, Policy Development Review, Vol. 20, No. 1, pp. 5-24.
21. Hjertholm, Peter (2001). Debt Relief and the Rule of Thumb: Analytical History of HIPC Debt Sustainability Targets. UNU-WIDER Discussion Paper nr. 2001/68.
22. IDA-IMF (2007). Staff Guidance Note on the Application of the Joint Fund-Bank Sustainability Framework for Low Income Countries. Washington, DC.
23. IMF (2007a). Republic of Mozambique Debt Sustainability Analysis. Washington , DC.
52

24. IMF-IDA (2004). Debt Sustainability in Low Income Countries – Proposal for an Operational Framework and Policy Implications. Washington, DC.
25. Kraay, Aart and Nehru, Vikram (2004). When is External Debt Sustainable? World Bank Policy Research Working Paper, nr. 3200, Washington, DC.
26. Krugman, Paul (1988). Financing Vs Forgiving a Debt Overhang. Journal of Development Economics, 29, pp. 253-268. North Holland.
27. Mathew, Martin (2002). Debt Relief and Poverty Reduction: Do We Need an HIPC III? Debt Relief International. Paper Presented to the North-South Institute.
28. Matthew, Martin (2004). Assessing the HIPC Initiative: The Key Policy Debates. Chapter II in Debt Relief Myths and Realities, Ed. By Teussen, Jan and Age Akkerman. FONDAD.
29. Nissanke, M., and B. Ferrarini (2001). ‘Debt Dynamics and Contingency Financing Theoretical Reappraisal of the HIPC Initiative’. WIDER Discussion Paper 2001/139. Helsinki: UNU-WIDER. (Also in [2004] T. Addison. H. Hansen and F. Tarp (eds), Debt Relief for Poor Countries. Basingstoke: Palgrave Macmillian for UNU-WIDER.)
30. Nissanke, Machiko and Thorbeck, E. (2007) A Quest for Pro-Poor Globalization. Chapter 14 of the book, Advancing Development edited by George Mavrotas and Anthony Shorrocks, Palgrave/Macmillan, ISBN 0 230-01904-8
31. Nissanke, Machiko and Ferrarini, Benno (2007). Assessing the Aid Allocation and Debt Sustainability Framework: Working towards Incentive Compatible Aid Contracts. UNU-WIDER. Research Paper nr. 2007/33.
32. Northover, Henry et Al. (1998). A Human Development Approach to Debt Relief for the Worlds Poor. CAFOD. UK.
33. Plano de Acção para a Redução da Pobreza Absoluta, 2006-2009 – PARPA II (2005). Governo de Mocambique. Republica de Mocambique.
34. Sachs, Jeffrey D. (1989). The Debt Overhang of Developing Countries. In Debt Stabilization and Development, by Calvo, Guillermo et. Al. Oxford: Basil Blackwell.
35. Wyplosz, Charles (2007). Debt Sustainability Assessment. The IMF approach and Alternatives. Graduate Institute of International studies. HEI Working Paper nr. 03/2007.
53
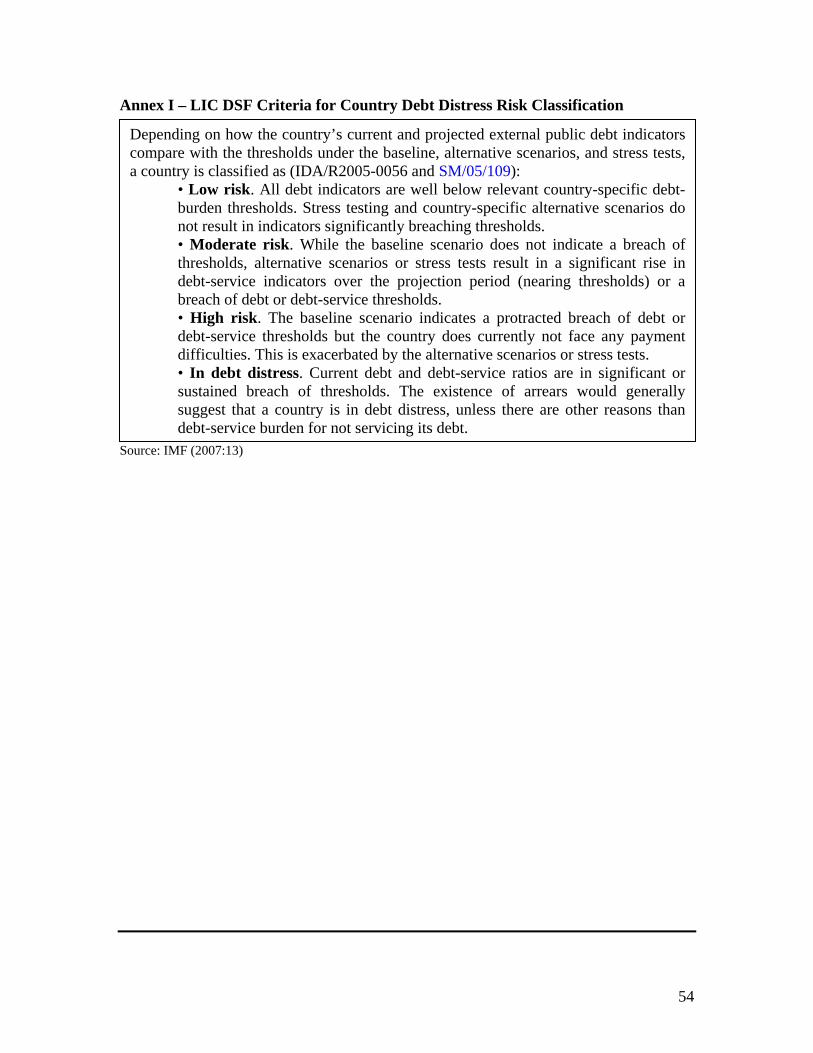
Annex I – LIC DSF Criteria for Country Debt Distress Risk Classification
Source: IMF (2007:13)
Depending on how the country’s current and projected external public debt indicators compare with the thresholds under the baseline, alternative scenarios, and stress tests, a country is classified as (IDA/R2005-0056 and SM/05/109):
• Low risk. All debt indicators are well below relevant country-specific debt-burden thresholds. Stress testing and country-specific alternative scenarios do not result in indicators significantly breaching thresholds. • Moderate risk. While the baseline scenario does not indicate a breach of thresholds, alternative scenarios or stress tests result in a significant rise in debt-service indicators over the projection period (nearing thresholds) or a breach of debt or debt-service thresholds. • High risk. The baseline scenario indicates a protracted breach of debt or debt-service thresholds but the country does currently not face any payment difficulties. This is exacerbated by the alternative scenarios or stress tests. • In debt distress. Current debt and debt-service ratios are in significant or sustained breach of thresholds. The existence of arrears would generally suggest that a country is in debt distress, unless there are other reasons than debt-service burden for not servicing its debt.
54

Annex III - Mozambique Debt Sustainability Assessment 2007 Main Assumptions
Source: IMF (2007a)
55

56