a critical analysis of foreign direct investment (fdi) in
TRANSCRIPT
IOSR Journal of Economics and Finance (IOSR-JEF)
e-ISSN: 2321-5933, p-ISSN: 2321-5925. Volume 12, Issue 2 Ser. III (Mar. –Apr. 2021), PP 35-52 www.iosrjournals.org
DOI: 10.9790/5933-1202033552 www.iosrjournals.org 35 | Page
A Critical Analysis of Foreign Direct Investment (FDI) in
Bangladesh: An Econometric Study
Dr. Md. Raihan Islam
Abstract Inward FDI to the developing countries has the evidence as a major stimulus to the economic growth;
conventionally at export-oriented manufacturing sector. In point of the fact, basic macro fundamentals like
growth rate of GDP, gross capital formation, foreign reserve, exchange rate, stock of labour, wage rate, country’s trade openness, infrastructure etc. accelerate the FDI inflows of a country. The objective of this paper
is thus to assess the influences of the different components of FDI on it; to examine their causalities as well as
the volatilities of FDI in Bangladesh. In this context, a complete time series econometric procedures that
includes the pre and post model diagnostic techniques, the unit root tests, Johansen cointegration method, the
OLS method for estimating multiple regression FDI function, the VECM, the VAR, IRA etc. have been carried
out on the basis of Solow, Romer endogenous and APF growth models. The data range of this study covers 46
annual periods (1972-2017) of Bangladesh. Results show that there are 2 (two) long run cointegrating stable
and converging relationships between the pair-wise FDI and its various components. The estimated coefficients
of the FDI function show that GDP growth rate and the wage rate have positive and significant impact on FDI
inflow while GDP, stock of labour, trade openness and gross capital formation have negative impact on it but
the impact of gross capital formation is significant. The VECM results confirm that the long run relationships exist among GDP growth rate, trade openness, stock of labour and FDI whereas the short run relationships
exist among GDP, GDP growth rate, gross capital formation and FDI in Bangladesh. The VAR result shows
that GDP and gross capital formation are positively elastic in the long run while the labour and the wage rate
are negatively elastic to FDI in the short run. Results of Granger Causality test show that only GDP growth rate
and FDI cause each other to grow. Otherwise, unidirectional causality exists. The response of dependent
variable to all of the independent variables is either positive or negative in the short run but in the long run they
all are responded towards the FDI in Bangladesh. The variance decomposition outputs confirms that the
volatility of FDI is very much high and it accounts majorly 80% and above. It is thus, very much essential to
take proper initiatives to maintain the factors of FDI so that they could positively made an avenue to attract
more FDI inflows in Bangladesh.
Key Words: Investment, Employment, Capital Formulation, Cointegration, Causality. ---------------------------------------------------------------------------------------------------------------------------------------
Date of Submission: 18-03-2021 Date of Acceptance: 01-04-2020
--------------------------------------------------------------------------------------------------------------------------------------
I. Introduction Investment (Local plus Foreign) has acquired considerable emotive force in an economy. It is viewed
as beneficial to employment creator-as it brings about economic growth and economic development in the long run. It can be termed as capital flowing from a firm or individual within the country or in one country to a
business or businesses in another country involving a share of at least 10%. Investment is generally classified
into four major components: the private domestic investment, the public domestic investment, the foreign direct
investment and the portfolio investment. Foreign private capital flows come in two forms: equity and debt. The
largest of all capital flow (long term investment with management control) to developing countries is called
FDI. Portfolio equity includes direct purchases of shares by foreign investors as well as share purchases through
country funds and depository receipts. The distinction between equity and debt flows is that with equity, capital
is repatriated only when an investment is profitable (Perkins et al., 2001, pp. 522-523).
The issue of economic prosperity is often linked to massive inflows of foreign direct investment (FDI)
into a nation and the impact of FDI through its various components on economic growth of a country. Most of
Assistant Professor of Economics, Ministry of Education, Bangladesh & PhD in Economics, Institute of
Bangladesh Studies, University of Rajshahi, Bangladesh. Email: [email protected]
A Critical Analysis of Foreign Direct Investment (FDI) in Bangladesh: An Econometric Study
DOI: 10.9790/5933-1202033552 www.iosrjournals.org 36 | Page
the development economists agree that there exists a positive causal relationship between FDI and economic
performance, either in the short run or in the long run, or both. Diversified relationship also exists among FDI,
its various components and economic growth. FDI again helps to overcome capital shortage in the host countries
and complements domestic investment when FDI flows to high risk areas or new industries where domestic
investment is limited (Noorzoy, 1979). Moreover, FDI is believed to be a pulsating implement for the growth of
the income and employment, technological advancement, socio-economic development parallel to improve
income distribution or poverty reduction especially for the developing countries of the world like Bangladesh. The FDI inflow in Bangladesh is not satisfactory compare to the neighboring countries like India, Pakistan and
Srilanka. Various factors are responsible for this poor FDI inflow. Some factors affect positively and others
affect negatively. This paper however, tries to assess the influences of different factors on FDI and to examine
the short and long run causal relationships between them in Bangladesh. In this context, the sample of this study
is spanned with 42 annual observations (1972 -2013). For empirical analysis of this study, improved
econometric data analysis techniques have been used appropriately.
1.2 Statement of the Problem
Economies of the world are going to be integrated and opened (among themselves) to free trade due to
globalization day by day. Hence, they are implementing liberal economic policies which are encouraging huge
capital inflows from the first world countries to LDCs specially. Over the last decades, the remarkable increase in FDI inflows to developing countries’ demand and analysis of the impact of FDI on economic growth as well
as the basic components of FDI at the disaggregated level have become the burning issue. The impact of the
different components of FDI their interrelationships among themselves are not always in the same direction in
Bangladesh. They may be positive or negative; significant or insignificant to FDI and growth. Again, the nature
and trend of those components may have different and negative so that they could hardly affect economic
growth of the country. Direct foreign private investment does not only affect domestic capital formation and
economic growth but is also affected by them. Economies that enjoy relatively higher rates of growth succeed in
attracting foreign investment. On the other hand, foreign investment contributes to the acceleration of economic
growth for a number of reasons: i) the inflow of foreign capital results in an expansion of the productive
capacity of the economy; ii) capital inflows at substantial rates reduce the need for borrowing; iii) FDI is usually
accompanied by know-how, up-to-date technology and managerial skills that are essential for economic growth;
and iv) it usually assists in the expansion and creation of new markets. Zhang (2001) has concluded that a key advantage created by FDI to recipient countries is technology transfer and spillover efficiency which depends on
recipient countries' absorptive capabilities, such as a liberal trade policy, human capital development, and an
export-oriented FDI policy. Bangladesh in fact, opened her economy in the late 1980s to reap the benefits of
FDI in order to accelerate economic growth. The government set up Board of Investment (BOI) in 1989 to
promote and facilitate private investment both from domestic and overseas sources. The government also lifted
restrictions on capital and profit repatriation gradually and opened up almost all industrial sectors for foreigners
to invest either independently or jointly with the local partners. With all these incentives followed by a low labor
cost structure, Bangladesh has been an attractive destination for FDI in the South Asian region since the late
1980s as Bangladesh is suffering with high rate of saving investment gap over the year. Bangladesh is well
positioned as a favourable investment destination because of its large and growing local markets. She has yet
lagged behind and received low FDI inflow compared to other developing countries. Given the world’s scarce resources, external pressure finally urged the Bangladesh government into liberalizing the energy sector, a move
which almost immediately attracted increasing levels of FDI. Concurrently, the government also eased capital
controls and reduced its bureaucratic red tape to allow private firms to borrow foreign loans without
governmental permission, thus encouraging more joint ventures with international companies.
The net inflow of foreign direct investment (% of GDP) in Bangladesh is 0.91 as of 2011. Its highest
value over the past 42 years was 1.35 in 2005, while its lowest value was 0.05 in 1979. The figure is rising
continuously and stands to 1.00 percent in 2013 while it was 1.11 in 2012 in Bangladesh. Inflows of foreign
direct investment into Bangladesh rose 24 percent year-on-year to $1.6 billion in 2013 although the country
witnessed serious political unrest and an anti-business climate during the period. FDI inflows increased 13.75
percent to $1.29 billion in 2012, compared to the previous year, according to United Nations Conference on
Trade and Development (UNCTAD, 2014). The FDI inflows were $0.70 billion in 2009, $ 0.91 billion in 2010 and $1.14 billion in 2011 indicating a steady upward trend (WDI, 2014). The World Investment Report of the
UNCTAD, released recently, shows Bangladesh is placed as a second favoured investment destination in South
Asia after India, which got $ 28 billion or 78 percent of the total FDI inflows into the region in 2013. Pakistan
stood third in South Asia with $1.3 billion. The Board of Investment (BoI) of Bangladesh released the
UNCTAD, 2010 report at a press conference at its office in Dhaka recently. Of the $1.6 billion FDI that
Bangladesh received by 2009, $541 million came as equity (direct investment in Bangladesh), $361 million as
A Critical Analysis of Foreign Direct Investment (FDI) in Bangladesh: An Econometric Study
DOI: 10.9790/5933-1202033552 www.iosrjournals.org 37 | Page
intra-company loans (debt transactions between parent enterprises and affiliates) and $697 million were
reinvested earnings (investors' share of profits not distributed as profits).
A prominent feature of FDI inflows in Bangladesh is that the bulk of the FDI is concentrated in the non-
tradable services sectors which hardly contribute anything to export earnings but generate repayment obligations
in respect of profits, dividends and repatriation of capital. The composition of FDI changed in the direction of
manufacturing and other tradable sectors in 2009, but even then the services sectors are accounted for 62 percent
of total FDI inflows. In telecoms, FDI inflow declined by 61 percent, to $250 million in 2009 from $641 million in 2008. In power, gas and petroleum sectors, FDI fell by 49 percent and stood at $51 million in 2009, as against
$101 million in the year before. However, the FDI inflow in textile and wearing apparel increased by 8 percent
and stood at $136 million in 2009. In 2008, the inflow was $126 million. In the banking sector, FDI inflows
remained about the same as in the past year ($141) (UNCTAD, WDI, 2010). Report shows that the FDI inflows
into different sectors in 2013, telecommunications got $324 million (20%), mainly for the payments of 3G
licence fees and network expansion of the mobile phone operators. The banking sector, especially the foreign
banks, got $327 million (21%) to meet their statutory capital requirements under Basel II obligations. Textile
and weaving got $422 million (26%), power, gas and petroleum $99 million (6%), food products $40 million
(3%), agriculture and fishing $31 million (2%) and others $356 million (22%). The textile and weaving sector
are the major destination of FDI inflows in Bangladesh and it shares 26% of inflows in 2013. Agriculture and
Fishing is the lowest destination and it occupies only 2% of the foreign investment in Bangladesh. Telecom and Banking sectors are also another two attractive sectors for FDI inflows in Bangladesh and share are 20% and
21% respectively (Siddiqui, Daily Independent, 17 December, 2014). The reduction in FDI shares of
manufacturing demonstrates that it is no longer a stronghold for foreign investment and other sectors, such as
telecom and based on percentages gathered from the Bangladesh Board of Investment 2013. But, it continues to
be a matter of some disappointment that foreign investors still prefer other countries in the South Asian region,
Pakistan and Sri Lanka for instance, over Bangladesh as their destination. Pakistan is today torn by sectarian
strife. Bangladesh, in comparison offers a far safer place for investment. It did not suffer from a terrible anti-
insurgency fight like Sri Lanka did, and for which Sri Lanka’s FDI flow also dipped sharply. The remnants of
the militant bands in Bangladesh are on the run and the government is firmly committed to fight extremism. All
these create an interest for the author to empirically investigate the influences of different components of FDI on
it as well as to examine their causal relationships at the disaggregated level in Bangladesh with a view to
assisting policy making institutions.
1.5 Objective of the Study
This paper is guided by the following specific objectives:
i) to assess the current states of FDI and different components;
ii) to estimate the influences of different components on FDI;
iii) to measure the causality between FDI and its different components;
iv) to examine the short run dynamics to the long run equilibrium of the function;
v) to examine the response of FDI to its different components; and
vi) to assess the volatility of the FDI function.
II. Review of the Literature This paper has studied a number of research works on supporting the relationship between FDI,
different components of FDI and economic growth. Alfaro, et al. (2000) finds that FDI promotes economic
growth in economies with sufficiently developed financial markets. It may reduce the savings and thus, less
domestic investment which may result in the reduction in growth. Yanrui (2000) distinguishes FDI from other
forms of investment by its ability to transfer not only production know-how but also other technical, managerial
and marketing skills. He found that FDI brings into the host countries tremendous externalities, namely,
promotion of competition, and technical progress through investment in R&D, and through specialization.
Akinlo (2004) investigates the impact of FDI on economic growth in Nigeria, for the period 1970–2001. The
results show that both private capital and lagged foreign capital have small, and not a statistically significant effect, on the economic growth. He found that labour force and human capital have significant positive effect on
growth in Nigeria. Choong et al. (2004) investigate the patterns of FDI and economic growth among select
developed and East Asian countries. Results prove that the presence of FDI inflows creates a positive
technological diffusion in the long run only if the evolution of the domestic financial system has achieved a
certain minimum level. Carsten (2005) explores the linkages between political risk, institutions and foreign
direct investment inflows. The results show that government stability, the absence of internal conflict and ethnic
tensions, basic democratic rights and ensuring law and order are highly significant determinants of foreign
investment inflows. Liu, et al. (2005) examines empirically the interplay between exports, imports, FDI and
economic growth for nine Asian economies. The results reveal two way causal connections between the four
A Critical Analysis of Foreign Direct Investment (FDI) in Bangladesh: An Econometric Study
DOI: 10.9790/5933-1202033552 www.iosrjournals.org 38 | Page
variables for most of the sample economies. Fabienne (2007) explains the empirical evidence on the
relationship between FDI and economic growth is still inconclusive. Tang et al. (2008) investigate the causal
link between FDI, domestic investment and economic growth in China for the period 1988-2003. The results
show that FDI has not only assisted in overcoming shortage of capital, it has also stimulated economic growth
through complementing domestic investment in China. Miao (2009) states that empirical studies on inward
foreign direct investment and economic growth generate mixed results. Strong evidence shows that FDI in
manufacturing sector has a significant and positive effect on economic growth in the host economies. But, in non-manufacturing sectors do not play a significant role in enhancing economic growth. Ahamed and Fahian
(2010) state that FDI inward to the middle-income countries has the evidence for export-oriented manufacturing
sector as a major stimulus to the economic growth. Results show that reduced government’s ineffectiveness
along with supporting policy framework makes Bangladesh as an attractive destination of FDI, that has a
positive spillover and significant impacts affect over time through dynamic effects on economic growth. Zambe
and Yue (2010) examine the long-run impact of foreign direct investment and trade openness on economic
growth in Cote d’Ivoire. They found that both FDI and trade openness are significant in explaining output
growth. Rahman and Shahbaz (2011) investigate the effects of imports and foreign capital inflows on
economic growth in case of Pakistan over the period of 1990Q1-2008Q4. The results show that imports and
foreign capital inflows have positive and significant effect on the economic growth of Pakistan. Causality
analysis reveals bidirectional causal association among the variables, but strong causality is found from imports and foreign capital inflows to real GDP. Jadhav (2012) explores the role of economic, institutional and political
factors in attracting FDI in BRICS (Brazil, Russia, India, China & South Africa) economy. Findings indicate
that economic factors are more significant than institutional and political factors. Adhikary (2012) investigates
the impact of FDI, trade openness, domestic demand, and exchange rate on the export performance of
Bangladesh. He found FDI as an important factor in explaining the changes in exports both in the short run and
long-run. However, the study does not trace any significant causal relationship for the cases of trade openness,
domestic demand, and exchange rate.
III. Present Trends of FDI Inflows in Bangladesh Despite the wide-ranging incentives offered by Bangladesh to foreign investors, and the identification
of the country by global institutions as a highly attractive investment destination, the volume of FDI has
remained historically low in this country. In per capita terms, FDI in Bangladesh in 2008 was only $ 7, as
compared to $ 31 in India and $ 32 in Pakistan. Not only that the volume of FDI is low in Bangladesh, it also
lags well behind other countries of the region, as UNCTAD data presented in table below. FDI inflow to
Bangladesh was $1086 million in 2008, the highest so far in its history, but it fell significantly thereafter, falling
by 34.1 percent to $716 million in 2009. Report shows that Vietnam is the highest destination of foreign direct
investment inflows in the Asian countries. The highest foreign investment is arrived in 2007 in Vietnam and the
figure stands at 8.66 % of GDP while the lowest amount was 2.78 % of GDP in 1990. On the other hand,
India’s highest and lowest foreign direct investments are 0.042 and 2.61 percent in 1980 and 2009 respectively.
For Pakistan the net inflows of FDI are 0.183 and 3.67 the highest and the lowest in 1972 and 2007 respectively.
Again, the highest FDI in Bangladesh is 2.765 % of GDP in 2000. In every cases the net inflows of FDI is lower than the level (highest and lowest) of the other Asian countries. The FDI inflow in Bangladesh is below a little
bit from India and Philipines but manifolds lower from that of the Vietnam and Pakistan (WDI- 2014). The poor
scenario of the FDI inflows in Bangladesh indicates a clear message that there is a tremendous scope of foreign
direct investment here. The net FDI inflow is accounted US$ 5.36 million in 1981 and the figure rises to the
peak at US$ 1501.65 million in the year 2013 in Bangladesh. It falls drastically in the year 2001 and 2002. With
a small breaking down, it further rises continuously over the year in Bangladesh (WDI, 2014).
It is observed that there are three phases of net FDI inflows in Bangladesh. The first phase begins from
1972 and end at 1996, when inflows of foreign direct investment are almost remained the same. The second
phase begins from 1996 and ends at 2002, while net FDI inflows begins to rise and reaches to the peak point in
1999 and then falls at the end point in 2002. That is, this phase consists with the recovery and recession in the
field of FDI inflows in Bangladesh. The final phase begins from 2002 and it is continuing to date (2013). This phase is characterized by the upward rising trend of FDI inflows in Bangladesh but there is a little cut of the
figures from the last two years mainly for political unrest in the country. Report further shows that China is the
highest source of FDI inflows in Bangladesh and it projects for Bangladesh US$ 1676.19 million in 2013-14.
India is in the next position as the source of FDI inflows (157.22), while USA is in the third position in investing
100% foreign direct investment project in Bangladesh. Other individual remarkable sources of FDI inflows in
Bangladesh are Singapore, Japan, Taiwan, Hongkong, South Korea, and Malaysia in 2013-14 (BER, 2015). The
provisional data from Board of Investment shows that the number of proposed local projects declines from 1754
in 2006 to 1600 in 2010 in Bangladesh but the project value is increased from US$ 2662 million to US$ 6298
million in 2010. The number of proposed foreign projects is increased from 135 in 2006 to 185 in 2010 in
A Critical Analysis of Foreign Direct Investment (FDI) in Bangladesh: An Econometric Study
DOI: 10.9790/5933-1202033552 www.iosrjournals.org 39 | Page
Bangladesh. The project value is remained almost the same with drastic fluctuations. The project value of
foreign investment in Bangladesh was US$ 3,621 million in 2006 and it reaches at US$ 3,174 million in 2010
(BER, 2012). That is, the number of projects has decreased but the project values are increased remarkably in
recent years in Bangladesh.
3.1 FDI Inflows by Sectors in Bangladesh
A prominent feature of FDI inflows in Bangladesh is that the bulk of the FDI is concentrated in the non-tradable, services sectors which hardly contribute anything to export earnings but generate repayment
obligations in respect of profits, dividends and repatriation of capital. In the proposals with the Board of
Investment of Bangladesh (BOI) in 2010, the highest 30.8 percent of the investment was offered for the services
sectors. The proposed investments for other sectors were 30 percent for textiles, 18.8 percent for chemicals, 7.8
percent for engineering, tannery & leather, chemical and agro base industry in Bangladesh. In 2013-14, agro-
based industry accounts 28.70 million US$, tannery and leather 30.94 million US$, Engineering industry 222.38
million US$ and service industries are accounted by 1679.14 million US$ in Bangladesh.The composition of
FDI changed in the direction of manufacturing and other tradable sectors in 2009, but even then the services
sectors accounted for 62 percent of total FDI inflows. Power, gas and petrollium cuts 51.15 million US$ while
services 443.86, telecommunication 250.14, manufacturing sector 172.71, banking 142.57, and textiles cuts
136.38 million US$ in 2009 in Bangladesh (UNCTAD, World Investment Report, 2010). Report again indicates that most of the FDI flows in the service sector including banking in Bangladesh and it accounts of 85% of FDI
in 2013-14. Industry has been another sector for FDI inflows in Bangladesh. The agro based industry, the
ceramic industry, the tannery and leather industry, engineering industry have also been drawn the attention of
foreign investors in Bangladesh (BER, 2014).
3.2 Domestic Capital Formation in Bangladesh
All investment ultimately must be financed by saving by either domestic entities (e.g., firms, the
government, households) or foreigners. Therefore, the importance of capital formation of a country is inevitable
for the domestic investment which may be the engine of economic growth. The data base of World Bank (WDI,
2014) clearly indicates the actual scenario of the gross capital formation in Bangladesh from the very beginning
of the independence of Bangladesh. It shows that the gross capital formation in Bangladesh was only US$
295.40 million in 1972 but with the passage of time the figure stands at 42581.72 million US$ in 2013. In 1990, the gross capital formation was 5138.198 million US$; this was the rising point and the tendency is seen to date
in Bangladesh. But, it is a matter of fact that the rate of gross capital formation in Bangladesh is very poor to
enhance domestic investment.
3.3 Trade Openness in Bangladesh
Bangladesh, in fact, opened her economy in the late 1980s to reap the benefits of FDI in order to
accelerate economic growth. The government set up Board of Investment (BOI) in 1989 to promote and
facilitate private investment both from domestic and overseas sources. Bangladesh has significantly opened her
economy during the previous two decades from 17.57% in 1986 to 49.09% in 2008 in order to encourage cross-
border transactions. The bilateral trade balance for example between the two countries (Bangladesh and Japan)
is heavily tilted towards Japan, as Bangladesh imports vehicles, electronic goods and spare parts. On the other hand, Bangladesh mainly exports apparel items, leather and leather goods, and footwear to Japan. In FY2012-
13, Bangladesh exported goods worth $750.27 million to Japan, against $600.52 million in the previous year,
according to data from Export Promotion Bureau. In 2012-13, Bangladesh imported goods worth $1.19 billion
from Japan against $1.45 billion in the previous year, according to BB. At present, more than 180 Japanese
companies have operations in Bangladesh. (Daily Star, 24 February, 2015). Trade openness which is measured
as the ratio of export plus import to the GDP is going to increase gradually in Bangladesh but the trend is not
satisfactory at all. The GDP, export and import rise over the period and in 2005, the figures stand at 60277.56,
9994.81 and 13891.43 respectively. In 2013, the figures of GDP, export and import rise to 97261.98, 22905.71
and 26467.89 respectively. The degree of trade openness is also risen from 39.6 in 2005 to 50.8 in 2013.
3.4 Employment in Bangladesh Labor market situation in Bangladesh is fragile as high population growth continues to expand the
economically active population and privatized industries simultaneously lay off employees. Relatively high rates
of inflation combined with high levels of unemployment may lower real wages. According to Bangladesh Labor
Force Survey 2002-03 conducted by BBS, a labor force (above 15 years) of 4.43 crores (male 3.45 crores and
female 0.98 crores) is engaged in a variety of professions. Agriculture accounts for 51.69% of employment;
industry 13.56% and services 26%. It is observed that highest 44.70% labor force is engaged in self-
employment, 20.09 % of labor force was engaged as daily laborers and 13.77% as full time employed workers.

A Critical Analysis of Foreign Direct Investment (FDI) in Bangladesh: An Econometric Study
DOI: 10.9790/5933-1202033552 www.iosrjournals.org 40 | Page
18.28% of labor force was engaged as unpaid family laborers. In the Labour Force Survey 2005-06
economically active population (15 + age) was 4.74 crores (Male 3.61 and Female 1.13 crores) (L F S, 2010).
Labour is being migrated from agriculture to other professions over the years. It is remarkable that the farm and
non-farm employment is widened in the country with the passage of time. Being an individual sector,
agriculture till now is playing a vital role as the main source of employment in Bangladesh. The labour force in
Bangladesh is increased with increasing population but it is a matter of happiness female participation in labour
force is also increased by manifolds in the country. It is however, massive challenge for Bangladesh to find work for over 2 million people who enter the labor force every year. Most of them engage in self-employment in
low productive areas of the non-formal sector (BER, 2014).
3.5 Wage Rate in Bangladesh
The nominal wage rate indexes are increased for the fiscal year 2004-05 to 2008-09. Report shows
that WRI (wage rate index) is increased by 14.73 percent in 2012-13 while it was 11.89 percent in the previous
fiscal year. The sectoral growth of WRI is increased in all sectors except manufacturing over 16.08 percent in
2012-13 of which fishery and manufacturing WRI are increased by 16.08 and 10.48 percent respectively. On the
other hand, the WRI in agriculture and construction sectors are 21.44 and 16.73 percent in 2012-13 respectively.
Yet, the WRI in Bangladesh is very low compare to other South Asian countries.
3.6 Human Resource Development in Bangladesh
Bangladesh has made significant achievements in the areas of education and health in the past thirty
years, but many challenges remain because certain other elements for a strong capital base are missing. School
enrollment rates have increased but these ratios are lower than those in any comparator countries of East and
South Asia. HDI is increasing gradually and the population under poverty line is also decreasing. Both fertility
and mortality rate are decreasing over the year. Life expectancy of the citizen goes up from 56.9 in 1980 to 66.9
in 2010. Student enrolment in each sector as well as adult literacy rate is increasing over the year but, tertiary
enrolment remains low at about 7 percent, compared to 13.5 percent in India, 18 percent in Indonesia, 22
percent in China, and 30 percent in Malaysia (UNDP, 2010). Yet, Bangladesh has a low record of the
technological innovation. The shortage of skilled workers is also a cause of concern. Adult illiteracy, despite
improvements, remains high. The concerns about the quality of education are also remained.
IV. Methodology 4.1 Data, Sample and Model Specification
The data for this study have basically been collected from the secondary sources, those are: the
Statistical Yearbook of Bangladesh, Bangladesh Economic Review of various years, Bangladesh Economic
Survey, and Economic Indicators of Bangladesh Bank. Data of this study have been obtained majorly from the
World Development Indicators (WDI) of World Bank database and the Direction of Trade Statistics
(International Monetary Fund). Other sources of data have also been used for the requirement of the estimations.
The variables that have been used are: domestic investment proxy of gross capital formation, GDP growth rate,
foreign direct investment, financial intermediation, country’s real export, human capital and domestic credit availability. The collected data have frequently been transformed into logarithmic and generated in accordance
with the requirement of the time series econometric analysis that has made the study more valid and reliable.
Analyses of trends and characteristics of foreign direct investment and its various components have been made
mainly in terms of constant data based on 2005 for avoiding the inflationary effect in the data. The area of the
study is the whole country with the disaggregated level discussion with forty two (42) annual observations
covering the period 1972 to 2013. For model specification, the Neoclassical (Solow growth model), Endogenous
(Romer growth model for technological diffusion) and Aggregate Production Function (APF) growth models
have been used to meet the objectives as well as to estimate the regression function.
4.3 Estimable Foreign Direct Investment Function for Bangladesh
The foreign direct investment model to estimate was solely the following single equation suggested by Ahmed and Tanin (2010) in the literature:
wrltogcfgrgdpgdpfdi6543210
………… (4.3.1)
Where, fdi = foreign direct investment inflow (current US $), gdp = gross domestic product (current US $),
grgdp = the annual percentage of GDP growth rate, gcf = the gross capital formation, to = the trade openness, l =
the stock of labour force ratio to the total population, wr = the wage rate and μ = the error term. The above
structural equation makes up the FDI function that is going to be estimated in the logarithmic form.
wrltogcfgrgdpgdpfdi lnlnlnlnlnlnln6543210
….. (4.3.2)
A Critical Analysis of Foreign Direct Investment (FDI) in Bangladesh: An Econometric Study
DOI: 10.9790/5933-1202033552 www.iosrjournals.org 41 | Page
The endogenous variables of the model are: fdi and gdp (and consequently grgdp). The degree of trade openness
has been computed out of data on exports, imports ratio to the GDP of Bangladesh. The variables gcf, to, l, and
wr are treated as exogenous. The data of the variables of GDP function has been transformed into natural
logarithms because, the coefficients of the cointegrating vector can be interpreted as long run elasticities; the log
first difference can be interpreted as growth rates; it reduces the heteroscedasticity problem from the model; and
the log data tends to be stationary.
4.4 Econometric Designs
In order to fulfillment of the objectives and to test the hypotheses improved econometric analytical
techniques with up to date available data have been carried out throughout this paper. The procedure proceeds
as: First, as the pre-estimation techniques, the procedures, the nature of the data distribution have been
examined successively. One, the standard descriptive statistics are to be analyzed with the summary statistics.
Two, if a time series contains trend, seasonality or some other systematic components, the usual summary
statistics can be seriously misleading and should not be calculated. In the k-variable regression model, we shall
have in all k(k-1)/2 zero-order correlation coefficients. These k(k-1)/2 correlations can be put into a matrix,
called the correlation matrix R (Gujarati, 2012, pp. 937-938). In this way the correlation among domestic capital
formation, FDI, wage rate, human capital, trade openness and GDP growth rate are to be examined. Three,
There is one assumption of chosen CLRM that one should like to check, namely, the normality of the disturbance term ut .The J-B test of normality is an asymptotic, or large-sample test. if the p-value of the statistic
is very different from 0, one can reject the hypothesis that the residuals are normally distributed and the vice-
versa (Gujarati, 2012, pp. 147). Four, generally time series data suffers from structural break problem. The
Chow test is essential for long run time series to identify parameter stability over the period of investigation. In
this study, the period is broken by two sub-periods such as pre liberalization (1972-1990) and post liberalization
(1991-2013). If the value of computed F-statistic is greater than the critical value then we reject the null
hypothesis of structural stability is rejected, otherwise accepted (Maddala, 2001, pp. 173). Five, the pattern of
stability of time series data during both periods (pre and post-liberalization) as well as overall study is measured
by the Coppock’s Instability Index (1962). The coppock Instability Index thus, can be measured them by the
following algebraic formula:
100)]1loglog([ vAntiCII …………………. (4.4.1)
Second, any time series data is said to be stationary if its mean and variance are constant over time and the
value of the covariance between two-time series does not depend on the actual time at which the covariance is
computed (Gujarati, 1995). On the other hand, a series is non-stationary if it fails to satisfy any of the
conditions, i.e. its mean, variance or covariance change overtime. The time series tend to exhibit non-stationary
stochastic process is in the following form:
ttt
uYY 1
………………………………… (4.4.2)
Where, is a constant, utis the stochastic error term. If the coefficient of
1tY , in fact equal to 1 ( 1 ), then,
tY is said to have a unit root problem. The time series property of each variable is investigated under a univariate
analysis by implementing the ADF (Augmented Dickey- Fuller), D-F (GLS), PP (Philips-Perron) and the correlogram tests for the unit root (non-stationarity) problem. The presence of a unit root problem which
indicates non stationarity, cannot be rejected for levels of the variables at the 5% significance level. It may be
also found in the first difference. However, the non-stationarity problem then may be vanished after second
difference and so on.
The ADF test however, requires modifying as:
t
m
i tYttuYYtY 1 1121
; i=1,2-----------m. ………….. (4.4.3)
Where, u t is assumed to be identical and independently distributed random variable. Two, the D-F (GLS) t-test
is performed by testing the hypothesis a0 = 0 in the regression:
t
d
t
d
t
d
t
d
tuyyyy
.................
110 ……………………… (4.4.4)
Where ytd is locally de-trended series yt. The DF-GLS test is the popular solution to the problem of size
distortions and low power of unit root tests. If the critical value of DF-GLS test is lower than the calculated
value, the null hypothesis of existence of unit root problem accepted otherwise rejected and the data series are
non-stationary. But, the data series may be stationary in the first or second difference. The critical values of DF-
GLS test are shown by Elliott et al. (1996) for a model with linear trend (Maddala, 2001, pp. 550-551). Three, Phillips-Perron (1988) test is used to deal with serial correlation and heteroscedasticity. The PP test is the t value
associated with the estimated coefficient of ρ*. The series is stationary if ρ* is negative and significant. The test
is performed for all the variables where both the original series and the difference of the series are tested for

A Critical Analysis of Foreign Direct Investment (FDI) in Bangladesh: An Econometric Study
DOI: 10.9790/5933-1202033552 www.iosrjournals.org 42 | Page
stationarity. Four, the non-stationarity of time series data can be tested by using autocorrelation function (ACF)
based on the so-called Correlogram test. The ACF at lag k , denoted by ρk, is defined as:
n
YY
n
YYYY
Variance
ianceCo tkttk
k
2
0
)())((varˆ
……………… (4.4.5)
Where, n is the sample size and Y is the sample mean. Bartlett (1946) has shown that if a time series is purely
random that is, if it exhibits white noise, the sample autocorrelation coefficients are approximately normally
distributed with zero mean and variance 1/n. Following the properties of the standard normal distribution, the 95
percent confidence interval for any k
will be, )1(96.1
n
. Thus, if an estimated k
falls inside the interval
))1(96.1),1(96.1(nn
, the hypothesis cannot be rejected that the true k
is zero. But, if it lies outside
this confidence interval, the hypothesis can be rejected that the true k
is zero. If none of the estimated
correlations lies in the interval, the estimated autocorrelation shown by the table will be statistically significant
(Gujarati, 2011).
Third, in the event of the non-stationarity of each variable, the cointegrating relationship among variables
(tendency for variables to move together in the long run) is studied by the Johansen-Juselius procedure (Johansen 1988, Johansen-Juselius 1992, 1999) to overcome the associated problem of spurious correlation and
misleading inferences. Johansen (1988) suggests a maximum likelihood procedure to obtain cointegrating
vectors and speed of adjustment coefficient identifying the number of cointegration vectors within the vector
autoregressive (VAR) model. To identify the number of cointegration vectors, a likelihood ratio test of
hypothesis is used. The following Vector Autogressive (VAR) model is the basis of multivariate cointegration
of Johansen Maximum Likelihood approach:
tktktt
uZAZAZ 11
…………… (4.4.6)
Here, t
Z is an (n x 1) vector of I (1) variables including both endogenous and exogenous variables. i
A is an (n x
n) matrix of parameters, t
u is (n x 1) vector of white noise errors. The equation (4.4.6) can be estimated by OLS
because each variable in Z is regressed on the lagged values of its own and all other variables in the system.
Since, t
Z is assumed to be non-stationary, it is convenient to rewrite (4.4.6) in its first difference or error
correction form as:
tktkttkttuZZZZ
1111……… (4.4.7)
Where, )1(),11(),1(2121 kij
AAAandkiAAAF
The specification (4.4.7) provides information about the short- run and long- run adjustments to the changes in
tZ by estimating and respectively. Equation (4.4.7) differs from the standard first difference form of the
VAR model by only the inclusion of the termkt
Z
. This term shows about the long-run equilibrium
relationship between the variables int
Z . Information about the number of cointegrating relationship among the
variables in t
Z is given by the rank of the number matrix . If the rank of the matrix r is 0<r<n, there are
liner combinations of the variables that are stationary. The matrix can be decomposed into two matrices α and β
such that =αβ, where α is the error correction term and measures the speed of adjustment in t
Z and β
contains r distinct cointegrating vectors. The cointegrating rank of the above matrices r, can be formally tested
with the Maximum Eigenvalue test (λ max) and the Trace test (λ trace).
Fourth, If the data series are cointegrated, the ordinary least squares (OLS) method has been applied for
functional estimation by minimizing its error term with sum and squares method. For K-variable case, the
prominent matrix technique is to be applied for the estimation of the function. In case of multiple regressions or the K variable regression model, the ordinary least squares (OLS) method can be written more compactly in
matrix notation as:
uXy ˆˆ …………………………....………(4.4.8)
Where, is a K- element column vector of the OLS estimators of the regression coefficients and where i
u is an
1n column vector n residuals. As in the two and three variable models, in the k-variable case the OLS
estimators are obtained by minimizing the residuals that gives, ˆ Xyu ;
Thus, by simple calculation:
yXXX 1
)( …………………..…... (4.4.9)
A Critical Analysis of Foreign Direct Investment (FDI) in Bangladesh: An Econometric Study
DOI: 10.9790/5933-1202033552 www.iosrjournals.org 43 | Page
Where, IXXXX
)()(1 is an identity matrix of order )( kk . Equation (4.4.9) is a fundamental result of
the OLS theory in matrix notation for the case multiple regression model. It shows the vector can be
estimated from the given data that provides the best linear unbiased estimator that is BLUE (Gujarati, 1995, pp.
287-288). The Wald test for the multiple regression models to test the hypothesis 0i
,
we use this test
statistics with the corresponding partial r2 substituted in the place of the simple r2. The Wald test has a χ2-
distribution with d. f. r. if the test statistics is significant at the level, rejecting the hypothesis of coefficient
stability (Maddala, 2001, pp. 176-177). Fifth, the purpose of VECM model is to indicate the speed of
adjustment from the short run dynamics to the long run equilibrium state. The model is specified as:
tit
s
i
it
q
i
it
p
i
it
r
i
it
k
i
it
n
i
ittwrltogcfgrgdpgdpefdi
lnlnlnlnlnlnln6
1
5
1
4
1
3
1
2
1
1
1
……(4.4.10)
In this specification, the variables are cointegrated if the parameter (λ) of the error correction term is negative
and statistically significant in terms of its associated-t value. In case of λ being positive and statistically
significant, still there exists a long run causality but with a divergence. Sixth, VAR methodology superficially
resembles simultaneous equation modeling in that it is considered several endogenous variables together. But, each endogenous variable is explained by its lagged, or past, values in the model. Seventh, Granger (1988)
developed a test to check the causality between variables. Granger causality examines to what extent a change
from past values of a variable affect the subsequent changes of the other variable. In order to obtain the
estimated residuals єt, the Granger models with a dynamic error correction are as follows:
t
o
i
itiit
r
i
iit
k
i
iit
m
i
iit
n
i
iitttofdigdpdilecfdi
11111
lnlnlnlnlnln
…….(4.4.13)
Where, Δ indicates the difference operator, є implies nonzero serially independent random error terms, and λt-i is
the lagged error correction term obtained from the long run cointegrating relations between the variables. The F
statistics are the Wald statistics for the joint hypothesis, no causal relationship. It means that, the null hypothesis
is that t
X does not Granger cause t
Y and that t
Y does not Granger cause t
X in case of two variable
regression model for example. Eighth, just as an autoregression has a moving average representation, a vector
autoregression can be written as a vector moving average (VMA) model as:
1
0
1
i
i
i
teAx
……………..…… (4.4.14)
Where, i
zy )( and the unconditional mean of xi is . This equation is the VMA representation in that the
variables are expressed in terms of the current and past values of the two types of shocks (i.e., e1t and e2t). The
VMA representation is an essential feature of Sim’s (1980) methodology in that it allows tracing out the time
path of the various shocks on the variables contained in the VAR model. Impulse response analysis (IRA) is
performed in this study by giving a shock of one standard deviation ( 2 S.E. innovations) to GDP growth rate, FDI, financial intermediations, real export, human capital and domestic credits to visualize the duration of their
effects on the domestic investment in Bangladesh. Ninth, the variance decomposition analysis reveals that the
variance of FDI is primarily caused by its own variance followed by the volume of its various components as
well as to examine the volatility of FDI.
Finally, for model diagnostics two popular correcting autocorrelation methods are the B-G and the L-M test.
One, to avoid some of the pitfalls of the Durbin-Watson d test of autocorrelation, statisticians Breusch and
Godfrey have developed a test of autocorrelation. Assuming a regression model where the error term t
u follows
the th order autoregressive, AR( ) schemes as follows:
ttttt
uuuu
2211 ……………….… (4.4.15)
Where, єt is a white noise error term. This is simply the extension of the AR(1) scheme. The null hypothesis of the B-G test is that there is no serial autocorrelation up to the specified number of lags. Two, in the multiple
regression models to test the hypothesis 0i
,
we use this test statistics with the corresponding partial r2
substituted in the place of the simple r2. The L-M test like Wald test has a χ2- distribution with d. f. r. if the test
statistics is significant at the level, rejecting the hypothesis of coefficient stability (Maddala, 2001, pp. 176-177).
Three, to give some idea about White’s heteroscedasticity corrected standard errors, the variances of of k
variable regression model with the variance of any partial coefficient is obtained as:
22
22
)ˆ(
ˆˆ)ˆvar(
ji
iji
i
w
uw
……… (4.4.16)
A Critical Analysis of Foreign Direct Investment (FDI) in Bangladesh: An Econometric Study
DOI: 10.9790/5933-1202033552 www.iosrjournals.org 44 | Page
Since iu2
ˆ are not directly observable, White suggests the squared residual for each i. Where, i
u are the
residuals obtained from the k variable regression (Gujarati, 2012, pp. 439-440). Four, as the post estimation
techniques, the CUSUM and CUSUMSQ tests are to be applied to obtain whether the data set have structurally
broken or not. By applying these tests in the data series, the results will be more reliable and robust. It is
mentionable that among many other investments affecting factors, only systematically affecting stochastic
variables have been considered in this paper for econometric estimation.
V. Empirical Results 5.1 Result of the Chow Test
The Chow test results show that the calculated F-statistic is 1.708821 which is greater than the F-
critical value thus the null hypothesis of no structural break point in 1990 is rejected and it is also confirmed by
the p-value equals to 0.147529 which is also greater than any significance levels (α). The likelihood ratio (LR)
result is also significant as the p value is less than significance level α = 0.05. Thus, there is a structural breaking
point of foreign direct investment in Bangladesh in 1990.
Table 5.1.1: Results of the Structural Breakpoint of the FDI Function Chow Breakpoint Test: 1990
F-statistic 1.708821 Prob: (2, 42) 0.147529
Log likelihood ratio 14.94017 Prob: Chi-square (2) 0.036774
Source: Estimated from the Table: 4.1.1 (in Appendix).
5.2.2 Instability of Foreign Direct Investment in Bangladesh
The instability of domestic investment of Bangladesh is estimated by using Coppock Instability Index.
Result shows that the CII is 27.81 percent during the pre-liberalization regime and 9.46 percent during the Post-
liberalization regime. Therefore, it is clear indication that the instability in FDI is higher during Pre-
liberalization than Post-liberalization periods. That is, the data series of FDI suffer with instability problem and it is severe during pre-liberalization in Bangladesh.
5.2.3 Descriptive Statistics of FDI Function
The variables under study have been found normally distributed. The mean-to-median ratio of each
variable is approximately one. The standard deviation is also low compared to the mean, showing a small
coefficient of variation except the variable FDI. The range of variation between maximum and minimum is also
reasonable. The numeric of skewness of each variable is low and is mildly negatively skewed but for GDP and
trade openness is positively skewed. The figures for kurtosis of GDP, trade openness and wage rate variables are
below 3 which confirms near normality. The Jarque-Bera test statistics also accept the null hypothesis of normal
distribution of each variable, except two (lngdp and lnwr), with varying probabilities but they have been found
normal at their first difference. The Sum and Sum Sq. Dev. ensures that there is no structural break of the data.
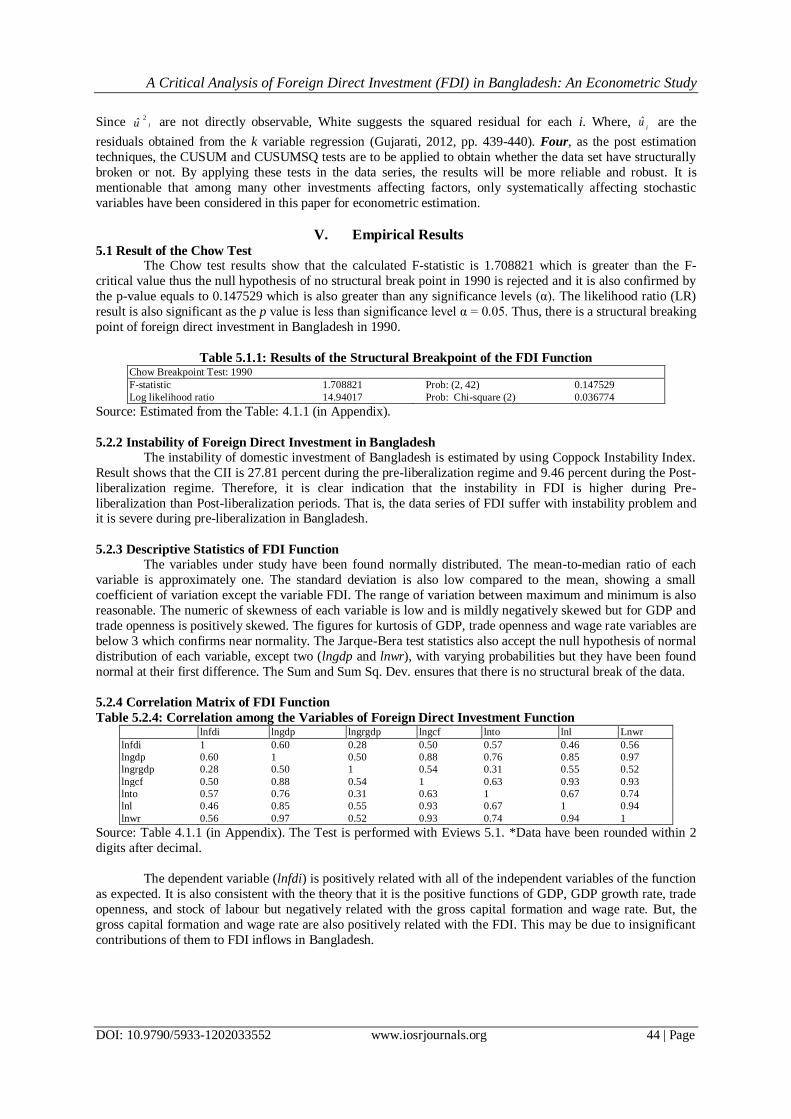
5.2.4 Correlation Matrix of FDI Function
Table 5.2.4: Correlation among the Variables of Foreign Direct Investment Function lnfdi lngdp lngrgdp lngcf lnto lnl Lnwr
lnfdi 1 0.60 0.28 0.50 0.57 0.46 0.56
lngdp 0.60 1 0.50 0.88 0.76 0.85 0.97
lngrgdp 0.28 0.50 1 0.54 0.31 0.55 0.52
lngcf 0.50 0.88 0.54 1 0.63 0.93 0.93
lnto 0.57 0.76 0.31 0.63 1 0.67 0.74
lnl 0.46 0.85 0.55 0.93 0.67 1 0.94
lnwr 0.56 0.97 0.52 0.93 0.74 0.94 1
Source: Table 4.1.1 (in Appendix). The Test is performed with Eviews 5.1. *Data have been rounded within 2
digits after decimal.
The dependent variable (lnfdi) is positively related with all of the independent variables of the function
as expected. It is also consistent with the theory that it is the positive functions of GDP, GDP growth rate, trade
openness, and stock of labour but negatively related with the gross capital formation and wage rate. But, the
gross capital formation and wage rate are also positively related with the FDI. This may be due to insignificant
contributions of them to FDI inflows in Bangladesh.

A Critical Analysis of Foreign Direct Investment (FDI) in Bangladesh: An Econometric Study
DOI: 10.9790/5933-1202033552 www.iosrjournals.org 45 | Page
5.3 Results of Unit Root Test of FDI Function
5.3.1 The Correlogram Test
Result shows the sample correlogram up to 14 lags. The striking feature of this sample correlogram is
that it starts at high value (about 0.525 at lag 1) and then tapers off gradually. At lag 6 the autocorrelation
coefficient is 0.346. This type of pattern is generally an indication that the time series is non-stationary. Similar
results of correlogram test have been found for the rest of the variables of FDI function. Thus, it is now the
requirement of differencing data first for further test to have the stationarity of the data. All the estimated sample autocorrelation coefficients fall inside of the interval at the first difference. Therefore, the null hypothesis of
non-stationarity can be rejected at 5% significance. This implies that the series is stationary after the first
difference because the unit root problem has been vanished then. That is, they all are integrated of order one
I(1).
5.3.2 Result of ADF, DF (GLS) and PP Unit Root Test
Table 5.3.2.1: Result of the Augmented Dickey-Fuller (ADF) Unit Root Test
The test is conducted using Eviews 5.1; * Critical values (5%) are from Mackinnon (1991).
Note: 95% critical value for the Augmented Dickey – Fuller statistic=-2.9665
Where, lnfdi = foreign direct investment; lngdp = output of the country used as the proxy of economic growth;
lngrgdp = growth rate of GDP; lngcf = gross fixed capital formation; lnto = trade openness; lnl = labour force
ratio to the total population; lnwr = general wage rate. Δ= First Difference, Critical values (5%) are from
Mackinnon (1991).
Table 5.3.2.1 presents the level values as non-stationary because the calculated values are lower than
the critical values in absolute term. The null hypothesis could not be rejected then and the data are non-
stationary at their levels. Table further indicates that the non-stationarity problem vanished after the first
difference of the data because the ADF, DF (GLS) and PP statistics are greater than their critical values at 1%
and 5% level of significance and the null hypothesis of non-stationarity have been rejected. Thus, the data have been stationary after the first difference with the integration of order one i.e. I (1).
5.4 Result of the Cointegration Test
Cointegration test clarifies the existence of long run equilibrium relationship between the variables.
Cointegration method usually uses two test statistics for testing the cointegration: the trace (Tr) test and the
max-eigen value (max
) test. Table 5.4.1 explains the trace and max-eigen value statistics for foreign direct
investment (Δlnfdi) and GDP in Bangladesh (Δlngdp) are 68.40 and 39.92 for the null hypothesis r = 0; both the
values are greater than the critical values of 15.49 and 14.26 at 5% ( with 0.0000 probability) levels of
significance in the first row. Thus, the null hypothesis of no cointegration is rejected. In the second row of the table, the trace and max-eigen value statistics both are also greater than the critical values at 5 % (with 0.0000
probability) significance level. Hence, the null hypothesis of no cointegration is also rejected. Thus, there are 2
(two) cointegrating stable relations between FDI and the GDP growth in Bangladesh. Results also show that the
null hypothesis of at most two cointegrating vectors (H0: r <= 0 and H0: r <= 1) are rejected at 5% level of
significance, according to both the trace and max-eigen value statistics. The results therefore, indicate that there
are 2 (two) cointegrating long run relationship between the pair-wise variables of the FDI function. Since the
data are stationary at the first difference, the cointegrated relationships of the differenced variables have been
Var
iab
les With An Intercept but Not A Trend With An Intercept and A Linear Trend
ADF
Statistic
D-F
(GLS)
Statistic
PP
Statistic
Crit.Value
(1%)
Crit.
Value
(5%)
ADF
Statistic
D-F (GLS)
Statistic
PP
Statistic
Crit.Value
(1%)
Crit.
Value
(5%)
lnfdi -3.27 -0.41 -3.21 -3.61 -2.94 -4.54 -4.64 -4.44 -4.20 -3.52
lngdp 2.42 0.86 -0.88 -3.62 -2.94 -0.77 -3.51 -4.05 -4.22 -3.53
lngrgdp -1.07 -1.52 -6.82 -3.62 -2.94 -4.10 -7.09 -11.42 -4.24 -3.54
lngcf -3.55 -0.51 -3.97 -3.60 -2.94 -4.74 -2.47 -4.94 -4.20 -3.52
lnto -1.12 -1.32 -1.65 -3.61 -2.94 -7.40 -1.99 -7.38 -4.21 -3.52
lnl -1.61 -0.16 -1.68 -3.61 -2.94 -1.67 -1.64 -2.43 -4.21 -3.53
lnwr -3.31 1.30 -2.83 -3.60 -2.94 -3.54 -1.29 -3.19 -4.20 -3.52
Δlnfdi -6.40 -7.45 -14.51 -3.61 -2.94 -6.33 -6.17 -15.23 -4.21 -3.53
Δlngdp -7.48 -5.14 -11.04 -3.61 -2.94 -7.40 -6.38 -10.86 -4.21 -3.53
Δlngrgdp -10.90 -3.27 -49.31 -3.61 -2.94 -10.74 -9.90 -53.27 0.89 1.68
Δlngcf -7.75 -2.51 -10.79 -3.61 -2.94 -9.06 -4.68 -17.53 0.71 1.58
Δlnto -6.20 -1.68 -6.49 -3.61 -2.94 -6.08 -4.26 -6.28 0.51 2.33
Δlnl -9.10 -10.13 -11.13 -3.61 -2.94 -6.56 -6.70 -14.11 0.75 1.43
Δlnwr -4.20 -2.14 -4.18 -3.61 -2.94 -4.67 -3.31 -4.04 0.40 1.90

A Critical Analysis of Foreign Direct Investment (FDI) in Bangladesh: An Econometric Study
DOI: 10.9790/5933-1202033552 www.iosrjournals.org 46 | Page
justified and they all have been contegrated in the long run. Therefore, there are two cointegrating equations
among the variables and they are converging each other in the long run.
Table 5.4.1: Cointegration Result between FDI and GDP in Bangladesh
0H
AH
Eigen
Value
Trace
Statistics
5% Crit.
Value
Probability** Max-
eigen
Value
5% Crit.
Value
Probability** \Hypothesis
r=0 r=1 0.640737 68.40224 15.49471 0.0000 39.92430 14.2646 0.0000 None*
r<=1 r=2 0.518189 28.47794 3.841466 0.0000 28.47794 3.841466 0.0000 Atmost 1*
Cointegration Result between FDI and GDP Growth Rate
r=0 r=1 0.755106 80.61985 15.49471 0.0000 54.87020 14.2646 0.0000 None*
r<=1 r=2 0.483277 25.74965 3.841466 0.0000 25.74965 3.841466 0.0000 Atmost 1*
Cointegration Result between FDI and Gross Capital Formation
r=0 r=1 0.627310 66.05025 15.49471 0.0000 38.49335 14.2646 0.0000 None*
r<=1 r=2 0.506675 27.55689 3.841466 0.0000 27.55689 3.841466 0.0000 Atmost 1*
Cointegration Result between FDI and Trade Openness in Bangladesh
r=0 r=1 0.624367 67.53655 15.49471 0.0000 38.18655 14.2646 0.0000 None*
r<=1 r=2 0.528843 29.35000 3.841466 0.0000 29.35000 3.841466 0.0000 Atmost 1*
Cointegration Result between FDI and Stock of Labour
r=0 r=1 0.635175 57.54394 15.49471 0.0000 39.32519 14.2646 0.0000 None*
r<=1 r=2 0.373212 18.21876 3.841466 0.0000 18.21876 3.841466 0.0000 Atmost 1*
Cointegration between Foriegn Direct Investment and Wage Rate
r=0 r=1 0.638637 57.48364 15.49471 0.0000 39.69704 14.2646 0.0000 None*
r<=1 r=2 0.366228 17.78660 3.841466 0.0000 17.78660 3.841466 0.0000 Atmost 1*
The tests are performed with the software Eviews- 5.1
Note: * denotes the rejection of the hypothesis at 0.05 levels. **MacKinnon-Haug-Michelis (1999) p-values.
The trace and Max-eigen value tests indicate 2 cointegrating eqn(s) at the 0.05 level.
5.5 Estimation of Foreign Direct Investment Function Since all variables are cointegrated each other, the function follows the properties of ordinary least squares
(OLS) method. It is therefore, very much convenient to estimate the function (4.3.2) with the OLS method. In
this case, the software Eviews-5.1 has been conducted. The estimated function is as follows:
)1.5.5.....(................................................................................ln8638.1ln6542.3
ln0494.0*ln5359.0ln2792.0ln0520.11343.0ln
wrl
togcfgrgdpgdpfdi
[0.501009] [-0.645439] [1.148393] [-6.827668] -0.057755] [-0.873212] [0.647473]
Note: t-values are shown by the parentheses.
The estimated coefficients of the FDI function (4.3.1) indicate that FDI inflows in Bangladesh are no
doubt influenced by its various factors but the gross capital formation significantly negatively affects FDI. That
is, an increase in gross capital formation, FDI will be decreased by 5 percent. GDP growth rate and wage rate in
Bangladesh again positively affect FDI by 3 and 1.9 percent respectively but they are insignificant. FDI in
Bangladesh is also negatively influenced by the GDP, stock of labour and trade openness but the effects are
insignificant. That is, GDP, gross capital formation, trade openness and stock of labour affect FDI negatively of which gross capital formation is significant. In contrast, GDP growth rate and wage rate positively affect FDI in
Bangladesh. The Wald test of FDI function confirms that the coefficients are jointly significant because the
probabilities are less than the significance level (α=0.05, 0.01) for both F-statistic and Chi-square test that
ensure the rejection of the null hypothesis of insignificant coefficients. Thus, the coefficients are jointly
significant for the FDI function.
5.6 Long Run Causality Test for VECM of FDI Function
If two variables are cointegrated with same order, there must exist an Error Correction Mechanism
(ECM/VECM). The estimated coefficient of error correction term shows the long run effect and the estimated
coefficient of lagged variables shows the short run effect. The VECM results confirm that the long run
relationships exist between FDI and GDP, FDI and trade openness, FDI and stock of labour in Bangladesh. The short run relationships exist between FDI and GDP growth rate, FDI and gross capital formation while the
VECM term is significant for GDP, gross capital formation and stock of labour in Bangladesh that means there
is short term equilibrium with long term dynamics between these pair-wise variables.
5.7 Result of VAR Model for FDI Function
According to the theory of elasticity, it is known to all that the coefficients of the cointegrating
equation with log value is known as the long term elasticity of the function. The lag differenced VAR

A Critical Analysis of Foreign Direct Investment (FDI) in Bangladesh: An Econometric Study
DOI: 10.9790/5933-1202033552 www.iosrjournals.org 47 | Page
coefficients are known as short run elasticity of the function. The VAR result shows that the elasticity of the
gross capital formation is significant at both 1 and 5 percent level of significance that means, an increase in
gross capital formation may decrease FDI inflows by 54 percent in the long run. Result further shows that the
coefficients of the GDP, gross capital formation, stock of labour and the wage rate are statistically significant at
both 5 and 1 percent level of significance. The GDP and gross capital formation are positively elastic while the
stock of labour and the wage rate in Bangladesh are negatively elastic with FDI in the short run.
5.8 Result of the Granger Causality Test
Table 5.8.1: Results of Pair-wise Granger Causality Test of FDI Function Null Hypothesis Obs. Lag F-Statistic Probability Decisions
Δlngdp does not Granger Cause Δlnfdi
Δlnfdi does not Granger Cause Δlngdp 38
3
3.89854
0.65980
0.01792
0.58302
Rejected**
Accepted
Δlngrgdp does not Granger Cause Δlnfdi
Δlnfdi does not Granger Cause Δlngrgdp 38
3 6.78164
2.50089
0.00120
0.07773
Rejected**
Rejected*
Δlngcf does not Granger Cause Δlnfdi
Δlnfdi does not Granger Cause Δlngcf 38
3 2.37408
0.54095
0.08921
0.65784
Rejected*
Accepted
Δlnto does not Granger Cause Δlnfdi
Δlnfdi does not Granger Cause Δlnto 38
3 2.66555
0.25759
0.06506
0.85534
Rejected*
Accepted
Δlnl does not Granger Cause Δlnfdi
Δlnfdi does not Granger Cause Δlnl 39
2 0.40216
2.89878
0.67201
0.06880
Accepted
Rejected*
Δlnwr does not Granger Cause Δlnfdi
Δlnfdi does not Granger Cause Δlnwr 39
2 0.49097
2.96132
0.61630
0.06522
Accepted
Rejected*
Source: Table 4.1.1 (in Appendix) with first difference data. The tests are performed with Eviews 5.1.
Note: * indicates the significance of null hypothesis at 0.05 levels, ** indicates the significance of the null
hypothesis at 0.01 levels.
Result shows that GDP causes FDI as F-statistics is significant while FDI does not Granger cause GDP
as the null hypothesis is accepted. GDP growth rate and FDI in Bangladesh cause each other to grow at the same
direction as both the hypotheses are rejected. The GCF Granger causes FDI to grow, but FDI does not cause so.
Trade openness in Bangladesh causes FDI to grow but, FDI does not Granger cause trade openness. Labour does not cause FDI to grow but, FDI cause labour to grow. Wage rate of Bangladesh does not Granger cause FDI but,
FDI causes wage rate to grow in Bangladesh. Thus, there are bidirectional causalities between FDI and GDP
growth rate that is, they cause each other to grow at the same tandem in the short run; otherwise, unidirectional
causality exists between the pair-wise residual variables of the FDI function in Bangladesh.
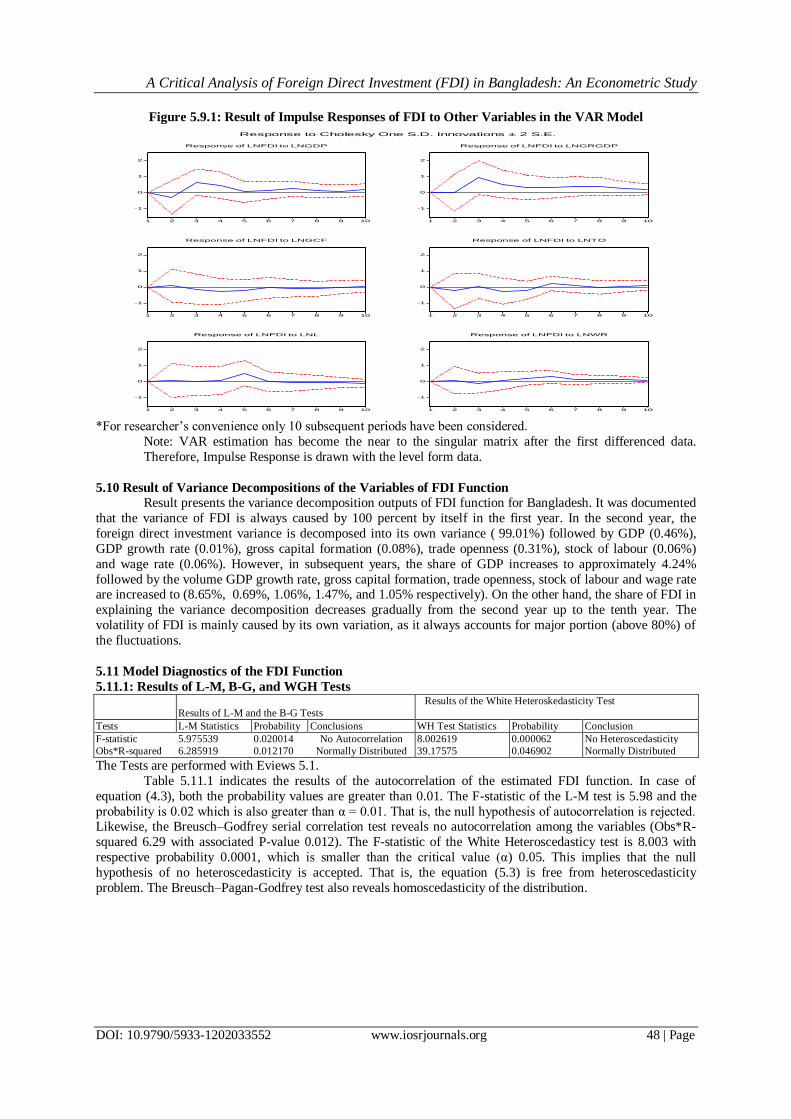
5.9 Result of Impulse Response Analysis of the Variables in the VAR Model
Figure presents the response of FDI to growth rate of GDP which reveals that it was only favourable in
the third, fifth and eighth periods but negative in all other periods. Thus, this has a bad implication on the
performances of Bangladesh economy. Likewise, gross capital formation had negative effect on FDI in the first,
fifth and eighth period but decreases henceforth. Indeed, trade openness has a bad effect in the third, fifth and
seventh periods but it has overall steady positive effect on foreign direct investment. Stock of labour and wage rate have slow positive and steady effects on FDI but they are converging with foreign direct investment in
Bangladesh over the period. Therefore, the response of all independent variables is either positive or negative in
the short run but in the long run they are responded towards the foreign direct investment in Bangladesh.
A Critical Analysis of Foreign Direct Investment (FDI) in Bangladesh: An Econometric Study
DOI: 10.9790/5933-1202033552 www.iosrjournals.org 48 | Page
Figure 5.9.1: Result of Impulse Responses of FDI to Other Variables in the VAR Model
*For researcher’s convenience only 10 subsequent periods have been considered.
Note: VAR estimation has become the near to the singular matrix after the first differenced data.
Therefore, Impulse Response is drawn with the level form data.
5.10 Result of Variance Decompositions of the Variables of FDI Function
Result presents the variance decomposition outputs of FDI function for Bangladesh. It was documented
that the variance of FDI is always caused by 100 percent by itself in the first year. In the second year, the
foreign direct investment variance is decomposed into its own variance ( 99.01%) followed by GDP (0.46%),
GDP growth rate (0.01%), gross capital formation (0.08%), trade openness (0.31%), stock of labour (0.06%)
and wage rate (0.06%). However, in subsequent years, the share of GDP increases to approximately 4.24%
followed by the volume GDP growth rate, gross capital formation, trade openness, stock of labour and wage rate are increased to (8.65%, 0.69%, 1.06%, 1.47%, and 1.05% respectively). On the other hand, the share of FDI in
explaining the variance decomposition decreases gradually from the second year up to the tenth year. The
volatility of FDI is mainly caused by its own variation, as it always accounts for major portion (above 80%) of
the fluctuations.
5.11 Model Diagnostics of the FDI Function
5.11.1: Results of L-M, B-G, and WGH Tests
Results of L-M and the B-G Tests
Results of the White Heteroskedasticity Test
Tests L-M Statistics Probability Conclusions WH Test Statistics Probability Conclusion
F-statistic 5.975539 0.020014 No Autocorrelation 8.002619 0.000062 No Heteroscedasticity
Obs*R-squared 6.285919 0.012170 Normally Distributed 39.17575 0.046902 Normally Distributed
The Tests are performed with Eviews 5.1.
Table 5.11.1 indicates the results of the autocorrelation of the estimated FDI function. In case of
equation (4.3), both the probability values are greater than 0.01. The F-statistic of the L-M test is 5.98 and the
probability is 0.02 which is also greater than α = 0.01. That is, the null hypothesis of autocorrelation is rejected. Likewise, the Breusch–Godfrey serial correlation test reveals no autocorrelation among the variables (Obs*R-
squared 6.29 with associated P-value 0.012). The F-statistic of the White Heteroscedasticy test is 8.003 with
respective probability 0.0001, which is smaller than the critical value (α) 0.05. This implies that the null
hypothesis of no heteroscedasticity is accepted. That is, the equation (5.3) is free from heteroscedasticity
problem. The Breusch–Pagan-Godfrey test also reveals homoscedasticity of the distribution.
-1
0
1
2
1 2 3 4 5 6 7 8 9 10
Response of LNFDI to LNGDP
-1
0
1
2
1 2 3 4 5 6 7 8 9 10
Response of LNFDI to LNGRGDP
-1
0
1
2
1 2 3 4 5 6 7 8 9 10
Response of LNFDI to LNGCF
-1
0
1
2
1 2 3 4 5 6 7 8 9 10
Response of LNFDI to LNTO
-1
0
1
2
1 2 3 4 5 6 7 8 9 10
Response of LNFDI to LNL
-1
0
1
2
1 2 3 4 5 6 7 8 9 10
Response of LNFDI to LNWR
Response to Cholesky One S.D. Innovations ± 2 S.E.
A Critical Analysis of Foreign Direct Investment (FDI) in Bangladesh: An Econometric Study
DOI: 10.9790/5933-1202033552 www.iosrjournals.org 49 | Page
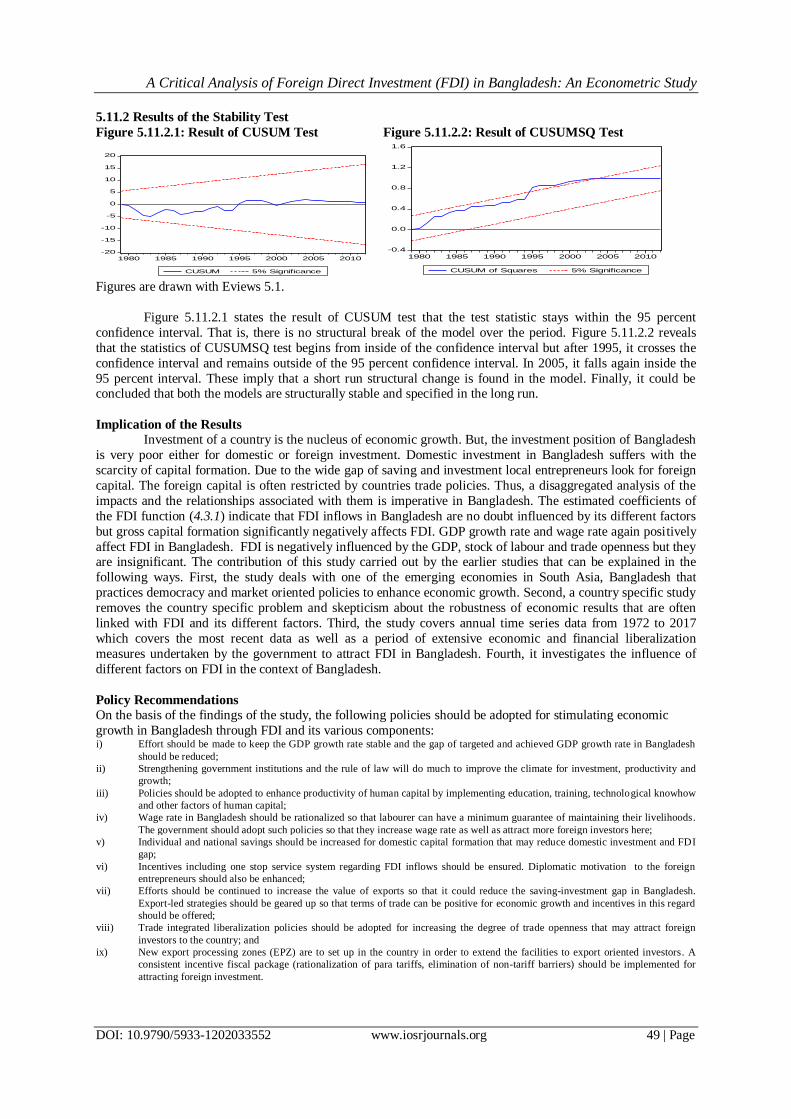
5.11.2 Results of the Stability Test
Figure 5.11.2.1: Result of CUSUM Test Figure 5.11.2.2: Result of CUSUMSQ Test
Figures are drawn with Eviews 5.1.
Figure 5.11.2.1 states the result of CUSUM test that the test statistic stays within the 95 percent
confidence interval. That is, there is no structural break of the model over the period. Figure 5.11.2.2 reveals
that the statistics of CUSUMSQ test begins from inside of the confidence interval but after 1995, it crosses the
confidence interval and remains outside of the 95 percent confidence interval. In 2005, it falls again inside the
95 percent interval. These imply that a short run structural change is found in the model. Finally, it could be concluded that both the models are structurally stable and specified in the long run.
Implication of the Results
Investment of a country is the nucleus of economic growth. But, the investment position of Bangladesh
is very poor either for domestic or foreign investment. Domestic investment in Bangladesh suffers with the
scarcity of capital formation. Due to the wide gap of saving and investment local entrepreneurs look for foreign
capital. The foreign capital is often restricted by countries trade policies. Thus, a disaggregated analysis of the
impacts and the relationships associated with them is imperative in Bangladesh. The estimated coefficients of
the FDI function (4.3.1) indicate that FDI inflows in Bangladesh are no doubt influenced by its different factors
but gross capital formation significantly negatively affects FDI. GDP growth rate and wage rate again positively
affect FDI in Bangladesh. FDI is negatively influenced by the GDP, stock of labour and trade openness but they are insignificant. The contribution of this study carried out by the earlier studies that can be explained in the
following ways. First, the study deals with one of the emerging economies in South Asia, Bangladesh that
practices democracy and market oriented policies to enhance economic growth. Second, a country specific study
removes the country specific problem and skepticism about the robustness of economic results that are often
linked with FDI and its different factors. Third, the study covers annual time series data from 1972 to 2017
which covers the most recent data as well as a period of extensive economic and financial liberalization
measures undertaken by the government to attract FDI in Bangladesh. Fourth, it investigates the influence of
different factors on FDI in the context of Bangladesh.
Policy Recommendations
On the basis of the findings of the study, the following policies should be adopted for stimulating economic
growth in Bangladesh through FDI and its various components: i) Effort should be made to keep the GDP growth rate stable and the gap of targeted and achieved GDP growth rate in Bangladesh
should be reduced;
ii) Strengthening government institutions and the rule of law will do much to improve the climate for investment, productivity and
growth;
iii) Policies should be adopted to enhance productivity of human capital by implementing education, training, technological knowhow
and other factors of human capital;
iv) Wage rate in Bangladesh should be rationalized so that labourer can have a minimum guarantee of maintaining their livelihoods.
The government should adopt such policies so that they increase wage rate as well as attract more foreign investors here;
v) Individual and national savings should be increased for domestic capital formation that may reduce domestic investment and FDI
gap;
vi) Incentives including one stop service system regarding FDI inflows should be ensured. Diplomatic motivation to the foreign
entrepreneurs should also be enhanced;
vii) Efforts should be continued to increase the value of exports so that it could reduce the saving-investment gap in Bangladesh.
Export-led strategies should be geared up so that terms of trade can be positive for economic growth and incentives in this regard
should be offered;
viii) Trade integrated liberalization policies should be adopted for increasing the degree of trade openness that may attract foreign
investors to the country; and
ix) New export processing zones (EPZ) are to set up in the country in order to extend the facilities to export oriented investors. A
consistent incentive fiscal package (rationalization of para tariffs, elimination of non-tariff barriers) should be implemented for
attracting foreign investment.
-20
-15
-10
-5
0
5
10
15
20
1980 1985 1990 1995 2000 2005 2010
CUSUM 5% Significance
-0.4
0.0
0.4
0.8
1.2
1.6
1980 1985 1990 1995 2000 2005 2010
CUSUM of Squares 5% Significance
A Critical Analysis of Foreign Direct Investment (FDI) in Bangladesh: An Econometric Study
DOI: 10.9790/5933-1202033552 www.iosrjournals.org 50 | Page
Besides, Bangladesh can learn a valuable lesson from India and China where, an important source of
FDI has been their expatriate nationals. The numbers for India are also impressive, but not nearly as large as for
China because the Indian policymakers until 2002 were not welcoming of their expatriate citizen. The lesson for
Bangladeshi policymakers is to welcome the non-resident Bangladeshi (NRB) citizens, especially those who are
interested in investment and business. Finally, policy alone is not sufficient to attract the handsome inflow of
FDI. Overcoming the aforesaid impediments towards the inflow of FDI in Bangladesh should be met up. If it is
possible, definitely Bangladesh would be able to attract a lion’s share of FDI among South Asian regions and thereby achieve its target of higher economic growth and sustainable development in the long run.
VI. Conclusion The objectives of this paper are to examine the influences of different components of FDI on it as well
as to examine their causal relationships at the disaggregated level. In this case, a complete econometric
procedure has been carried out. Results indicate that there is no structural break point in 1990 in the FDI inflow
as well as high instability index is found in the pre-liberalization period in Bangladesh. The time series
properties of the data have been tested and found the data are non-stationary at their level but all are found
stationary after first difference with integrated of order one. There exists 2 (two) cointegrating long run significant and converging relationships between FDI and its different components as the trace and max-eigen
value statistics of Johansen method are significant for every case. The estimated coefficients of the FDI function
indicate that FDI inflows in Bangladesh are influenced by its different factors but gross capital formation
significantly negatively affects it while GDP growth rate and wage rate affect FDI positively. It is thus,
negatively influenced by the GDP, stock of labour and trade openness but they are insignificant. Results also
show that the long run relationships exist between GDP growth rate and stock of labour to FDI while short run
relationships exist between GDP and gross capital formation to FDI. There is a long run significant elasticity
between gross capital formation and FDI while short run significant elasticities are exist between GDP, gross
capital formation, stock of labour and wage rate to FDI. The result of the Granger Causality test indicates that
there are bidirectional causalities between FDI and GDP growth rate otherwise; unidirectional causality exists
between the pair-wise variables of the FDI function. The response of all variables is either positive or negative in the short run but in the long run they all are responded towards FDI in Bangladesh. Result confirms that the
volatility of FDI is very high and it accounts majorly above 80 percent. Therefore, the policy issues will be
concerned as to which variables are relatively useful and which factors contribute to inflow FDI and how the
positive influences of different components of FDI could be accelerated to improve economic growth in
Bangladesh. Again, it will also be concerned with the nature of the economy (absorbing capacity), as well as
with total factor productivity (TFP); whether or not they are better to pursue policies, which increase efficiency
of the absorbing capacity of Bangladesh.
Appendix
Table 4.1.1: Trends of the Variables for FDI Function in Bangladesh (in Current US$)
Year ln fdi
ln
gdp
ln
grgdp lngcf ln to ln wr Year ln fdi
ln
gdp
Lngrg
dp
Lngc
f ln to ln wr
1972 11.41 22.56 0.00 1.55 3.85 4.88 1995 14.46 24.36 1.59 2.95 3.46 7.55
1973 14.67 22.81 1.20 2.16 3.27 5.15 1996 16.42 24.43 1.53 2.99 3.53 7.60
1974 14.60 23.25 2.26 1.99 2.73 5.40 1997 18.75 24.47 1.68 3.03 3.52 7.67
1975 14.25 23.69 0.00 1.82 2.71 5.50 1998 19.06 24.51 1.65 3.07 3.54 7.72
1976 15.51 23.03 1.73 2.29 2.95 5.53 1999 19.01 24.55 1.58 3.10 3.51 7.78
1977 15.76 22.99 0.98 2.44 2.59 5.63 2000 19.45 24.58 1.78 3.14 3.56 7.82
1978 15.86 23.31 1.96 2.45 2.80 5.85 2001 18.18 24.57 1.66 3.14 3.63 7.88
1979 0.00 23.47 1.57 2.42 2.87 6.07 2002 17.77 24.59 1.49 3.14 3.51 7.98
1980 15.96 23.62 -0.20 2.67 3.07 6.20 2003 19.41 24.67 1.66 3.15 3.53 8.04
1981 15.49 23.71 1.34 2.87 3.14 6.34 2004 19.92 24.76 1.84 3.18 3.58 8.10
1982 15.76 23.62 0.87 2.88 3.17 6.39 2005 20.45 24.82 1.78 3.20 3.68 8.16
1983 12.91 23.57 1.39 2.83 3.13 6.53 2006 20.41 25.00 1.89 3.26 3.81 8.24
1984 0.00 23.70 1.64 2.77 3.044 6.60 2007 20.29 25.10 1.95 3.26 3.88 8.35
1985 0.00 23.80 1.17 2.79 3.06 6.80 2008 20.75 25.24 1.80 3.27 3.84 8.52
1986 14.70 23.78 1.45 2.82 2.99 6.99 2009 20.53 25.35 1.62 3.27 3.78 8.61
1987 14.98 23.89 1.32 2.77 2.99 7.09 2010 20.57 25.47 1.72 3.27 3.73 8.66
1988 14.42 23.97 0.77 2.79 3.05 7.16 2011 20.89 25.58 1.87 3.31 3.92 8.77
1989 12.42 24.01 0.96 2.82 3.15 7.26 2012 21.11 25.62 1.88 3.34 3.97 8.91
1990 14.99 24.13 1.78 2.84 3.21 7.30 2013 21.13 25.73 1.79 3.35 3.93 9.03
1991 14.15 24.16 1.21 2.83 3.05 7.35 2014 21.15 25.71 1.78 3.38 3.90 9.01
1992 15.13 24.18 1.62 2.85 3.01 7.40 2015 21.13 25.72 1.79 3.40 3.91 9.02
1993 16.46 24.22 1.52 2.89 3.22 7.44 2016 21.14 25.70 1.80 3.37 3.92 9.03
1994 16.23 24.24 1.41 2.91 3.16 7.49 2017 21.15 25.72 1.79 3.38 3.91 9.01

A Critical Analysis of Foreign Direct Investment (FDI) in Bangladesh: An Econometric Study
DOI: 10.9790/5933-1202033552 www.iosrjournals.org 51 | Page
Sources: World Development Indicators 2014 & 2018. Bangladesh Economic Reviews, Statistical Year Books
of Bangladesh, and various Domestic and International Reports. Trade openness and real terms are own
estimated.
*Data have been rounded within 2 digits after decimal.
Bibliography [1]. Adhikary, B. K. (2012). Impact of foreign direct investment, trade openness, domestic demand, and exchange rate on the export
performance of Bangladesh: A VEC approach. Economics Research International, Oita-ken, Japan. Retrieved from
http://dx.doi.org/10.1155/2012/463856. Cited on 17/09/2015.
[2]. Ahamed, M. G., & Tanin, F. (2010). Determinants of and the relationship between FDI and economic growth in Bangladesh. Bonn
Econ Discussion Papers, (BGSE), University of Bonn.
[3]. Akinlo, A. E. (2004). Foreign direct investment and growth in Nigeria: An empirical investigation. Journal of Policy Modeling,
Vol. 26, pp. 627–39.
[4]. Alfaro, L., Chanda, A., Kalemli-Ozcan, S. & Sayek, S. (2000). FDI and economic growth: The role of local financial markets.
University of Houston, USA: Harvard Business School.
[5]. Asteriou, D., & Hall, S. G. (2007). Applied econometrics (Rev. ed.). New York, USA: Palgrere Macmillian.
[6]. BB. (1991-2003). Economic trends. [Monthly issues from 06/1991 to 07/2003]. Dhaka: Bangladesh Bank.
[7]. BB. (2011). Monetary policy statement July-December 2010. Dhaka: Bangladesh Bank.
[8]. BBS. (1995-2005). Statistical year books of Bangladesh. Bangladesh Bureau of Statistics, Dhaka: Government of Bangladesh.
[9]. BER. (2005-2014). Bangladesh economic review. Dhaka: Finance Division, Ministry of Finance, Government of Bangladesh.
[10]. Bhavan, T., Xu, C., & Zhong, C. (2011). Determinants and growth effect of FDI in South Asian economies: Evidence from a panel
data analysis. International Business Research, Canadian Center of Science and Education, Vol. 4, No. 1.
[11]. Choong, C-K., Yusop, Z., & Soo, S-C. (2004). Foreign direct investment, economic growth, and financial sector development: A
comparative analysis. ASEAN Economic Bulletin, Vol. 21, No. 3, pp. 278-89.
[12]. Coppock, J. D. (1962). International economic stability. New York, USA: McGraw Hill Companies Inc.
[13]. Dickey, D. A., & Fuller, W. A. (1979). Distributions of the estimators for autoregressive time series with a unit root. Journal of the
American Statistical Association, Vol. 74, No. 366, pp. 1057-1072.
[14]. Dickey, D. A., & Fuller, W. A. (1981). Likelihood ratio statistics for autoregressive time series with a unit root. Econometrica, Vol.
49, pp. 1057-1072.
[15]. Enders, W. (2004). Applied econometric time series (2nd ed.). New York, USA: John Wiley & Sons Inc.
[16]. Fabienne, F. (2004). Foreign direct investment and host country economic growth: Does the investor’s country of origin play a role?
Transnational Corporations, Vol. 16, No, 2, pp. 42-76.
[17]. Fuller, W. A. (1976). Introduction to statistical time series. New York, USA: John Wiley and Sons.
[18]. Granger, C. W. J. (1988). Some recent developments in a concept of causality. Journal of Econometrics, Vol. 39, No. 1-2, pp. 199-
211.
[19]. Greenaway, D., Sapsford, D., & Pfaffenzeller, S. (2007). Foreign direct investment, economic performance and trade liberalization.
The Authors Journal compilation, Oxford, U.K: Blackwell Publishing Ltd.
[20]. Gujarati, D. (2011). Econometrics by example. London, U.K: Palgrave Macmillan Publishers Limited.
[21]. Gujarati, D. N. (2012). Basic Econometrics (4th ed.). New Delhi, India: Tata Mcgraw-Hill Publishing Company Limited.
[22]. Higgins, B. (1996). Economic development: Problems, principles and policies (Rev. ed.). New Delhi, India: Universal Book Stall.
[23]. Islam, N. M. (2011). An introduction to sample methods: Theory and applications. Dhaka: Mullick & Brothers.
[24]. Jadhav, P. (2012). Determinants of foreign direct investment in BRICS economies: Analysis of economic, institutional and political
factor. Social and Behavioral Sciences, Vol. 37, pp. 5-14.
[25]. Johansen, S. (1988). Statistical analysis of cointegration vectors. Journal of Economic Dynamics and Control, Vol. 12, pp. 231-254.
[26]. Johansen, S. (1991). Estimation and hypothesis testing of cointegration vectors in Gaussian vector autoregressive models.
Econometrica, Vol. 59, No. 6, pp. 1551-1580.
[27]. Kothari, C. R. (2010). Research methodology: Methods & techniques (2nd ed.). New Delhi, India: New Age International Publishers
Ltd.
[28]. Lind, D. A., Marchal, W. G., & Wathen, A. S. (2010). Statistical techniques in business and economics. Irwin, New York:
McGraw-Hill.
[29]. Liu, X., Burridgez, P. & Sinclair, P. J. N. (2002). Relationships between economic growth, foreign direct investment and trade:
evidence from China. Applied Economics, University of Birmingham, UK, Vol. 34, pp. 1433-1440.
[30]. Liu, X., Shu, C., & Sinclair, P. (2005). Trade, foreign direct investment and economic growth in Asian economies. Business School,
Loughborough University, Leicestershire, LE11 3TU.
[31]. Liu, X., Wang, X. C., & Wei, Y. (2001). Causal links between foreign direct investment and trade in China. China Economic
Review, Vol. 12, No. 2-3, pp. 190–202.
[32]. Mackinnon, J. G. (1996). Numerical distribution functions for unit root and cointegration tests. Journal of Applied Econometrics,
Vol. 11, No. 6, pp. 601-618.
[33]. Madala, G. S. (2002). Introduction to Econometrics (3rd ed.). New York, USA: John Wiley & Sons. Ltd.
[34]. Miao, W. (2009). Manufacturing FDI, and economic growth: Evidence from Asian economies. Applied Economics, Vol. 41, No. 8.
[35]. Mortaza M. G. & Narayan, C. D. (2007). Foreign direct investment, trade liberalization and economic growth: Empirical evidence
from South Asia and implications for Bangladesh. Working Paper Series 0712, Dhaka, Bangladesh: Policy Analysis Unit,
Bangladesh Bank.
[36]. Noorzoy, M. S. (1979). Flows of direct investment and their effects on investment in Canada. Economic Letters, Vol. 2, No. 3, pp.
357-361.
[37]. Perkins, D. H., Radelet, S., Sndograss, D. R., Gillis, M. & Roemer, M. (2001). Economics of development ( 5th ed.). New York,
USA: W.W Norton & Company.
[38]. Phillips, P. C. B., & Perron, P. (1988). Testing for a unit root in time series regression. Biometrika, Vol. 75, No. 2, pp. 335-346.
[39]. Rahman, M. M., & Shahbaz, M. (2011). Do imports and foreign capital inflows lead economic growth? Cointegration and causality
analysis in Pakistan. COMSATS Institute of Information Technology, Lahore, Pakistan: MPRA Paper No. 29805.
[40]. Romer, P. M. (1994). The origin of endogenous growth. Journal of Economic Perspectives, Vol. 8, No. 1, pp. 3-22.
[41]. Seddighi, H. R., Lawer, K. A., & Katos, A. V. (2000). Econometrics: A practical approach. Routledge, New York: USA.

A Critical Analysis of Foreign Direct Investment (FDI) in Bangladesh: An Econometric Study
DOI: 10.9790/5933-1202033552 www.iosrjournals.org 52 | Page
[42]. Siddiqui, S T. (2014, December 16). FDIs in Bangladesh : Not as bad as suggested but well below the potential. Dhaka: The Daily
Independent, the Press.
[43]. Solow, R. M. (1956). A contribution to the theory of economic growth. Quarterly Journal of Economics. Vol. 70, pp. 65-94.
[44]. Stern, N. (2002). The investment climate, governance, and inclusion in Bangladesh. Washington, D.C., USA: World Bank.
[45]. Tang, S., Selvanathan, E. A., & Selvanathan S. (2008). Foreign direct investment, domestic investment, and economic growth in
China: A time series analysis. Research Paper No. 19, UNU-WIDER, United Nations University.
[46]. Todaro, M. P., & Stephen C. S. (2003). Economic development (8th ed.). Singapore: Pearson Education Inc.
[47]. Turabian, K. L. (2003). A manual for writers of research papers, theses, and dissertations (7th ed.). Revised by Wayne, C. B. et al.,
London, UK: the University of Chicago Press.
[48]. UNCTAD. (2014). World Development Report. USA: UN Publications.
[49]. UNCTAD. (2010). UNCTAD investment brief. Investment Issues Analysis Br., USA: UN Publications.
[50]. UNDP. (2010). Human development report. United Nations Development Program, USA: UN Publications.
[51]. World Bank. (2014). World Development Indicators. Data Base, of WB, New York.
[52]. Yao, S. (2006). On economic growth, FDI and exports in China. Applied Economics, Hendon, London, UK, Vol. 38, pp. 339–351.
[53]. Yusop, Z. (1992). Factors influencing foreign direct investment in the manufacturing sector of Malaysia. Masters Thesis,
University Partanian, Malaysia. Retrived from pasir.upm.edu.my/8039/. Cited on 01/11/2015.
[54]. Zambe B, N. S., & Yaoxing, Y. (2010). The relationship between foreign direct investment, trade openness and growth in Cote
d’Ivoire. International Journal of Business and Management, Canadian Center of Science and Education, Vol. 5, No. 7.
[55]. Zhang, K. H. (2001). Does foreign direct investment promote economic growth? Evidence from East Asia and Latin America.
Journal of Western Economic Association, Vol. 13, No. 2, p. 175-185.
Dr. Md. Raihan Islam. “A Critical Analysis of Foreign Direct Investment (FDI) in Bangladesh: An
Econometric Study.” IOSR Journal of Economics and Finance (IOSR-JEF), 12(2), 2021, pp. 35-52.