a county under pressure - kent.gov.uk · tally unlock the viability of development. ... as the main...
TRANSCRIPT

2 KENT AND MEDWAY GROWTH AND INFRASTRUCTURE FRAMEWORK | 2018 UPDATE
EXECUTIVE SUMMARYThe link between infrastructure and growth is well known. Robust infrastructure can fundamen-
tally unlock the viability of development. Infrastructure frameworks such as the Kent and Med-
way Growth and Infrastructure Framework (GIF) should be at the forefront in spatial planning
considerations, but freedoms and flexibilities need to be extended to allow for a tighter and
more collaborative response to barriers to infrastructure delivery.
PURPOSE OF THE GIF
There is value in having infrastructure and growth requirements considered over a wider geography to
provide a spatial perspective. The GIF has been prepared by Kent County Council (KCC) to provide a view
of emerging development and infrastructure requirements to support growth across Kent and Medway.
KCC has worked closely with Medway Council, districts and boroughs, and key strategic partners in the
preparation of this framework.
The GIF provides a strategic framework across the County, for identifying and prioritising investment
across a range of infrastructure, for planned growth up to 2031. It draws together information and
data from a range of sources, including district Local Plans, Infrastructure Delivery Plans (IDPs) and
infrastructure and service providers. The framework is also fundamental in providing robust evidence
to attract investment and engagement, and in supporting the case for public funding bids and pack-
aging projects for major private sector investment.
Ultimately, the GIF will help to ensure that Kent residents enjoy a good quality of life through well-planned,
sustainable development that is supported by the right infrastructure and services. By planning strategically,
it enables Kent and Medway to respond to the growth pressures on the County’s housing and infrastructure
needs, while supporting growth pressures from London.
A COUNTY UNDER PRESSURE
Over recent years, Kent and Medway have delivered some of the highest rates of housing de-
livery in the country; however, the infrastructure has not kept up with the pace of growth. Growing
congestion on roads and in towns, overcrowded trains and ever longer waiting times to access health facili-
ties have meant a continued challenge to the quality of life for residents and businesses. For years, housing
THE GROWTH CHALLENGE
Kent and Medway’s growth aspiration up to 2031 is equivalent to building another town the
size of Faversham every year, for 20 years! Our ambition is high. In 2016/17, we delivered the
highest completion rate of all the shire areas in the country*. However, the scale of the challenge can-
not be underestimated - the pace of development remains behind an average requirement of 8,900
homes per annum to 2031.
and population growth has far outpaced the delivery of the infrastructure required to sustain it. Combined
with unprecedented funding challenges, local services across the County have been brought to breaking
point. Nonetheless, the County remains critically important to national productivity and is strategically located
as the main international gateway into the UK from Europe, being a key link to the investment being made
in the Midlands Engine and Northern Powerhouse. The County holds important connections in relation to
London, as well as already having made crucial contributions to the Government’s housing agenda.
The UK is the third worst country for congestion in Europe in terms of peak hours spent in congestion, with
the most traffic hotspots1. There was a 14.3% increase in the number of vehicles on major roads in Kent
between 2006 and 20162. Additionally, there has been an increase of 42% in people using train stations in
Kent in the past ten years3. In 2016/2017, 1.8 million people used Ebbsfleet International Station, whilst the
passenger usage of Canterbury West has almost doubled in the last ten years.

3KENT COUNTY COUNCIL
1 http://inrix.com/press-releases/traffic-congestion-cost-uk-motorists-more-than-30-billion-in-2016/; 2 https://www.dft.gov.uk/traffic-counts/area.php?region=South+East&la=Kent; 3 Office of Rail and Road
*Shire Counties exclude all Unitary Authorities within each geographical county
4 KENT AND MEDWAY GROWTH AND INFRASTRUCTURE FRAMEWORK | 2018 UPDATE
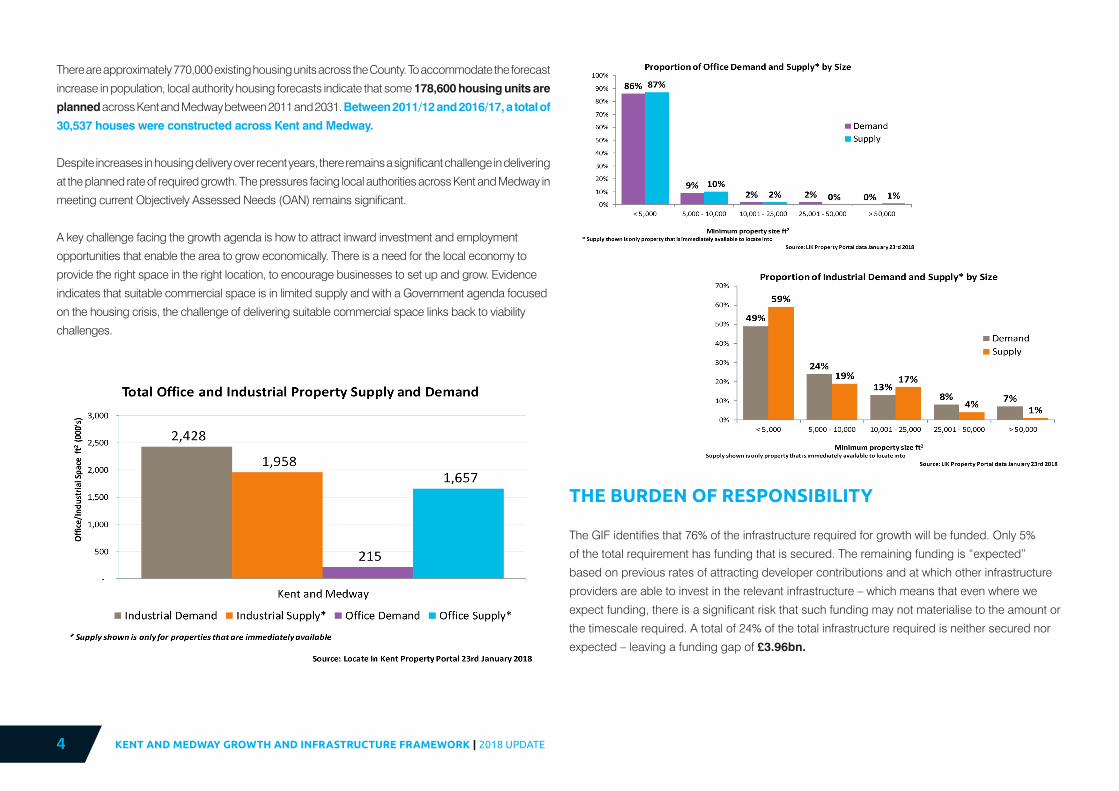
A key challenge facing the growth agenda is how to attract inward investment and employment
opportunities that enable the area to grow economically. There is a need for the local economy to
provide the right space in the right location, to encourage businesses to set up and grow. Evidence
indicates that suitable commercial space is in limited supply and with a Government agenda focused
on the housing crisis, the challenge of delivering suitable commercial space links back to viability
challenges.
THE BURDEN OF RESPONSIBILITY
The GIF identifies that 76% of the infrastructure required for growth will be funded. Only 5%
of the total requirement has funding that is secured. The remaining funding is “expected”
based on previous rates of attracting developer contributions and at which other infrastructure
providers are able to invest in the relevant infrastructure – which means that even where we
expect funding, there is a significant risk that such funding may not materialise to the amount or
the timescale required. A total of 24% of the total infrastructure required is neither secured nor
expected – leaving a funding gap of £3.96bn.
There are approximately 770,000 existing housing units across the County. To accommodate the forecast
increase in population, local authority housing forecasts indicate that some 178,600 housing units are
planned across Kent and Medway between 2011 and 2031. Between 2011/12 and 2016/17, a total of
30,537 houses were constructed across Kent and Medway.
Despite increases in housing delivery over recent years, there remains a significant challenge in delivering
at the planned rate of required growth. The pressures facing local authorities across Kent and Medway in
meeting current Objectively Assessed Needs (OAN) remains significant.

5KENT COUNTY COUNCIL
WHAT HAVE WE ACHIEVED?
Since the original publication of the Kent and Medway GIF in September 2015, the authorities
and infrastructure providers across Kent and Medway have worked collaboratively to secure the
following private and public investments:
• Securing almost £120mn of Local Growth Funding from Central Government for transport
schemes, including the new junction 10A scheme on the M20 at Ashford;
• Securing £27mn of funding under LGF3 (2016) to deliver:
- Dartford Town Centre transformation;
- Ashford International Rail Connectivity (Ashford Spurs);
- Fort Halstead;
- A2500 Lower Road Improvement;
- Kent & Medway Engineering and Design Growth and Enterprise Hub;
- Leigh Flood Storage Area and East Peckham - unlocking growth;
- A2 Off-slip at Wincheap, Canterbury.
• A commitment from Government to deliver a new Lower Thames Crossing and identification of
significant private sector interest in its financing;
• Government support and funding of £155,000 for Otterpool Park Garden Town;
• Since 2015, £121,449,009 has been secured through s106 contributions;
• Delivered 15,068 new dwellings from 2015/16 to 2016/17 in Kent and Medway.
Based on total identified funding, further analysis identifies the following breakdown for infrastruc-
ture funding*:
*Estimated based on GIF project lists
Based on the total infrastructure requirement, further analysis identifies the following breakdown
for who is the principal body responsible for delivery*:
**Private Sector/Developer Bodies:
• Highways contractors
• Bus companies
• Rail franchises
• Dover Harbour Board
• Broadband providers
• Social care providers
• Academy/Further Education groups and organ-
isations
***Public Sector:
• DfE
• DfT and Highways England
• National Rail
• NHS England
• Local Government Capital Budgets
• Skills Funding Agency
• South East LEP grants

6 KENT AND MEDWAY GROWTH AND INFRASTRUCTURE FRAMEWORK | 2018 UPDATE
KEY MESSAGES TO GOVERNMENT
• There is a need for more forward funding of strategic infrastructure by Government –
like the Housing Infrastructure Fund;
• Government funding needs to be easier and less costly to access – local authorities cur-
rently spend hundreds of thousands of pounds on the preparation of business cases for every
round of funding that is announced, often with different requirements, objectives and timescales;
• There should be a mechanism for enabling local authorities to bring forward sites
with unimplemented planning permission – in some cases, planning permissions are not
implemented for good reason, but where there is unnecessary delay in new development being
brought forward, local authorities should have the ability to intervene;
• The Government should unlink infrastructure funding from specific growth proposals
– too often, strategic infrastructure goes under-funded, as the impact of that infrastructure is
shared by many development sites and existing settlements. It is therefore difficult to attribute
entirely to specific settlements;
• The Government should establish greater power of direction over utility companies
where practices are stalling development – utility companies across the board create some
of the most costly and time-consuming barriers to development, with the risk and cost of new
utility provision often falling disproportionately on developers.The Housing Finance Institute (HFI)
paper “How to build homes, fast” was partly informed by the GIF and highlights the importance
of improving the timely provision of utilities. It also recommends the need for Infrastructure
Dependencies Mapping to understand the requirements for utilities within an area, and for direct
intervention to force improvement performance.
NEXT STEPS
Tackling these challenges will require innovative thinking and proactive collaboration between local authori-
ties, Government and industry. The Government is already reviewing its model for the Community Infrastruc-
ture Levy (CIL) and exploring the issues leading to unimplemented planning permissions. In working with
the Government to further develop solutions, Kent and Medway has set out the following action plan:
1. Defining the investment gap: We will make clear the shortfall in capital investment identified for
delivering planned, high-quality growth across Kent and Medway;
2. Pioneering a “place-based” approach: We will pioneer an approach that sees greater co-or-
dination of investment in homes, infrastructure and jobs to build quality communities, and new ways
of working with Government and its agencies across Kent and Medway. In this, we will work with the
local planning authorities to enable coherent new towns and settlements where infrastructure is avail-
able to support, but recognise where infrastructure is insufficient to accommodate further growth;
3. Exploring innovation in financing the funding gap: We will explore new ways of closing the
funding gap and ways of working with Government and other potential funders in addressing the
shortfall in capital funding;
4. Commercial supply and demand: We will work with local partners to develop key actions to re-
spond to the gaps identified between the supply and demand of commercial space, such as through
encouraging speculative commercial development or funding incentives;
5. Future-proofing Kent and Medway’s infrastructure: We will future-proof the infrastructure we
deliver today to the greatest extent possible, building in resilience, innovation and flexibility;
6. Creating well-designed communities: We will work with local partners and the industry in ensur-
ing high-quality, innovative and inclusive design across the County;
7. Collaborating with infrastructure providers: We will work and liaise with the utilities companies,
the health sector and other providers to ensure that their medium- to long-term planning aligns with
Kent and Medway’s growth agenda;
8. Creating an increasingly robust evidence base: For the GIF to continue to be a valuable tool
in helping us understand the county-wide growth agenda and associated delivery challenges, we will
continue to develop and evolve the Framework, working with partners.
7KENT COUNTY COUNCIL
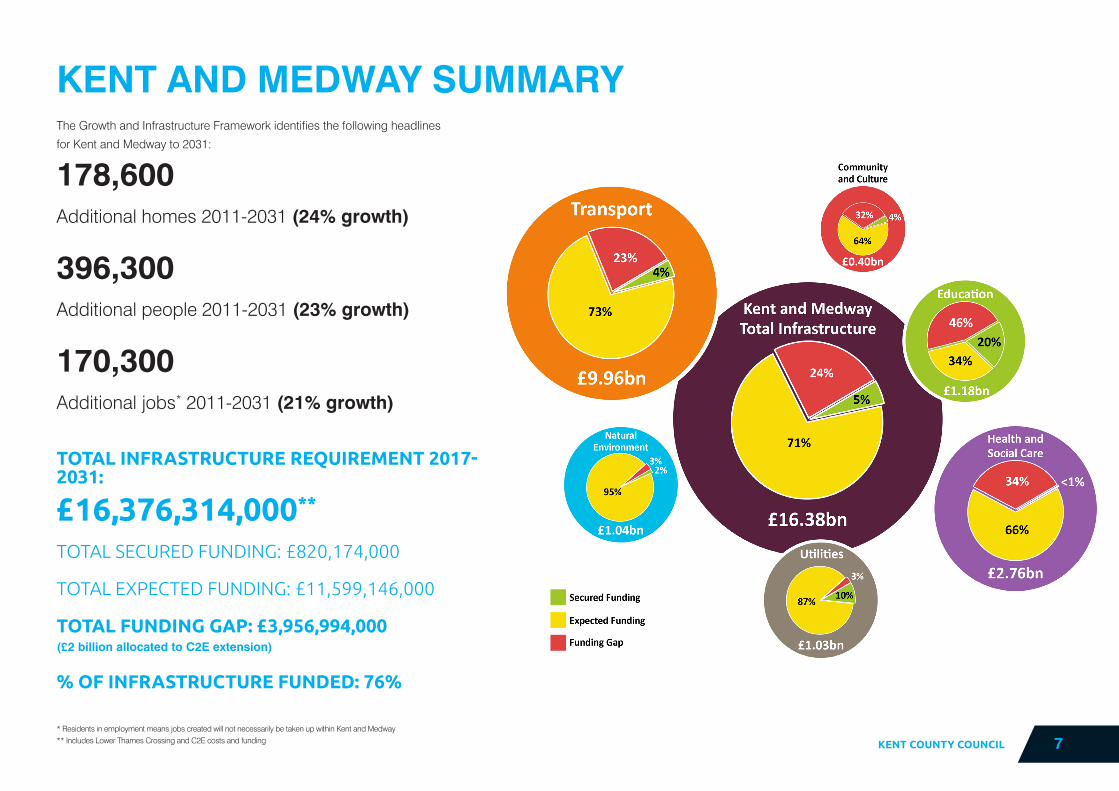
KENT AND MEDWAY SUMMARYThe Growth and Infrastructure Framework identifies the following headlines
for Kent and Medway to 2031:
178,600Additional homes 2011-2031 (24% growth)
396,300Additional people 2011-2031 (23% growth)
170,300Additional jobs* 2011-2031 (21% growth)
TOTAL INFRASTRUCTURE REQUIREMENT 2017- 2031:
£16,376,314,000**
TOTAL SECURED FUNDING: £820,174,000
TOTAL EXPECTED FUNDING: £11,599,146,000
TOTAL FUNDING GAP: £3,956,994,000(£2 billion allocated to C2E extension)
% OF INFRASTRUCTURE FUNDED: 76%
* Residents in employment means jobs created will not necessarily be taken up within Kent and Medway** Includes Lower Thames Crossing and C2E costs and funding

COMMUNITY & CULTURE: £0.40BN
HEALTH & SOCIAL CARE: £2.76BN
Major projects include Tunbridge Wells Cultural Hub and county-wide sports and recreation
provision.
TRANSPORT: £9.96BN
Major projects include the Lower Thames Crossing and associated strategic road corridor through
to the Channel ports, Crossrail extension to Ebbsfleet, a solution to Operation Stack and lorry
parking.
Secured
Expected
Gap
Major projects include providing sufficient education places caused by growth, especially in sec-
ondary education.
EDUCATION: £1.18BN
Secured
Expected
Gap
Major projects include sufficient county-wide energy and water provision.
UTILITIES: £1.03BN
Secured
Expected
Gap
Major projects include the Thames Estuary flood risk management programme and flood risk and
coastal erosion protection for the Romney Marshes.
NATURAL ENVIRONMENT: £1.04BN
Secured
Expected
Gap
Secured
Expected
Gap
Major projects include transformation of the health estate and implementing KCC’s Accommoda-
tion Strategy.
Secured
Expected
Gap
COSTS FUNDING
COSTS FUNDING
COSTS FUNDING
COSTS FUNDING
COSTS FUNDING
COSTS FUNDING