a country divided: the growing opportunity gap in …/media/files/pdfs/community developme… ·...
TRANSCRIPT
A Country Divided: The Growing Opportunity
Gap in America
REUBEN FINIGHANUniversity of Melbourne
ROBERT PUTNAMHarvard University
Unauthorized use and/or duplication of this material without express and written permission from the paper’s author is strictly prohibited. Excerpts and links may be used, provided that full and clear credit is given to Robert Putnam, Reuben Finighan and www.stlouisfed.org with appropriate and specific
direction to the original content.
The views expressed in this article are those of the authors and do not represent an endorsement by the Federal Reserve Bank of St. Louis or the Federal Reserve System.
Economic Mobility: Research & Ideas on Strengthening Families, Communities & the Economy140
A bedrock American principle is the idea that all individuals should have the opportunity to succeed on the basis of their own effort, skill, and ingenuity.
—Ben Bernanke, former Chair of the U.S. Federal Reserve Board, 2007
Are the destinies of children from poor and wealthy families diverg-ing? This paper explains why this is the question to ask if we wish to study equality of opportunity in America today. Drawing on the research behind Robert Putnam’s (2015) Our Kids: The American
Dream in Crisis, we show that, since the 1970s, children in the top-third and the bottom-third of the socioeconomic hierarchy have sharply diverged on factors predicting life success. This gaping “opportunity gap” augurs a collapse of social mobility in the decades ahead. Given the causes of the opportunity gap, we explore promising policy options for restoring equality of opportunity in America.
The U.S. Federal Reserve was an innovation of a period that makes an ideal starting point for this discussion: the Progressive Era. The reforms of the Progressive Era were a response to the soaring income inequality and financial instability of the Gilded Age in the late 19th century. Widespread unease with these conditions sparked decades of national debate and efforts by reformers that would reshape the nation. Central banking was a key innovation, directed at softening the blows of financial crises, but this paper takes greater inspira-tion from the many fundamental institutional changes that helped equalize incomes and opportunity. These changes began in the Progressive Era and were completed in the years following Franklin D. Roosevelt’s New Deal, laying the foundations for the Golden Age of the 1950s and 1960s—a period of high growth, during which income inequality reached its lowest ebb.
History is now repeating. Since the 1970s, income inequality has again soared to levels not seen since early in the 20th century. While the economy more than doubled over these four decades, the rising tide did not lift all boats.1 As a result, the past century traces a U-shaped curve from one Gilded Age to another, with an intervening period of relative equality. This is, in the words of economic historians Claudia Goldin and Lawrence Katz, “a tale of
1 See Organization for Economic Co-operative Development (2015) United States real GDP data, available
at http://stats.oecd.org/.
A Country Divided: The Growing Opportunity Gap in America 141
two half centuries” (Goldin and Katz 2001). The second of these half-centuries also changed how Americans are spatially distributed. From a society defined by economic integration in 1970, with around 65 percent of people living in middle-income neighborhoods, America has reached unprecedented levels of economic segregation, with around 60 percent of people now living in majority rich or poor neighborhoods (Bischoff and Reardon 2014).2 Income inequality has heightened, but paradoxically it has become less and less visible in citizens’ neighborhoods and everyday lives.
This provokes a question of exceptional importance: Does the return to a Gilded Age matter? Income inequality is conceptually distinct from equality of opportunity, and for most Americans it is also morally distinct (Page and Jacobs 2009).3 Indeed, following his remarks on equality of opportunity, as cited at the opening of this paper, Bernanke argued that “we do not guaran-tee equality of economic outcomes, and nor should we” (Bernanke 2007). Americans tend to care less about inequality of income than other Western nations, but across all ideological lines they are committed to equality of opportunity. The distribution of income matters less than the ideal that every child, regardless of his or her social background, has a similar opportunity to earn a place higher on that distribution.
Yet there is a creeping sense that equality of opportunity has been eroded over this same period. Polls show that the number of Americans who believe equality of opportunity characterizes American society has, after many decades of stability, begun to slide (Page and Jacobs 2009).4 President Barack Obama, as well as presidential candidates like Jeb Bush and Hillary Clinton, have all emphasized equality of opportunity as a crucial issue in today’s economy
2 See also Fry and Taylor (2012); and Jargowsky (2013).
3 Scholars disagree about the degree to which Americans favor equality of outcomes, but all agree that
equality of opportunity is a virtually universally shared value. See Hochschild (1981); Bartels (2008);
Newman and Jacobs (2010); and McCall (2013). See Kohut and Dimock (2013) for evidence that
“Americans’ core values and beliefs about economic opportunity, and the nation’s economic outlook,
remain largely optimistic and unchanged.”
4 Page and Jacobs (p. 51) report that in 2007 three-quarters of us believe that “it’s still possible to start
out poor in this country, work hard, and become rich.” On the other hand, Gallup (as cited in McCall 2013:
182) reported that the fraction of Americans “satisfied with the opportunity for a person in this nation to
get ahead by working hard” fell from 76 percent in 2001 to 53 percent in 2012. Moreover, a poll in 2014
found that “only roughly 4-in-10 (42 percent) Americans say that the American Dream—that if you work
hard, you’ll get ahead—still holds true today, [whereas] nearly half of Americans (48 percent) believe
that the American Dream once held true but does not anymore,” while “most Americans (55 percent)
believe that one of the biggest problems in the country is that not everyone is given an equal chance to
succeed in life” in Jones, Cox, and Navarro-Rivera (2014).
Economic Mobility: Research & Ideas on Strengthening Families, Communities & the Economy142
(Obama 2013; Sarlin 2015; and Badger 2015). Many social scientists, politi-cians, and citizens—although by no means all—suspect that high inequality may tighten the connection between children’s and parents’ incomes. But this connection is, ultimately, an empirical question. It is one that this paper addresses in the first two sections.
The first section turns to the problem of measuring social mobility—and why the right question is “what is happening in the lives of America’s kids?” It explains why standard social mobility measures are necessarily lagging indica-tors, and that they cannot yet detect the effects on mobility of the immense socioeconomic changes that occurred over the last few decades. On the other hand, there is powerful evidence that formative experiences in childhood are the most important determinants of opportunity. The rationale of Our Kids, then, is to avoid the lagging indicator problem by directly tracking the evolving differences between children’s lives on either side of the socioeconomic divide.
In defining this divide, we follow sociologists like Douglas Massey in using educational attainment as the core indicator of a family’s social class (Massey 2007). Education is not only strongly linked to income, but also tends to be the more powerful predictor of child-related outcomes. Roughly the lower third of Americans by class has a high school education or less (“poor” fami-lies in this paper), the middle third has some post-secondary education, while roughly the upper third has a BA or more (“rich” families).
The second section examines the evidence on how opportunity indicators differ across the lives of wealthier and poorer children. Central to this are a series of “scissor” graphs, showing that class-based gaps between children have tended to increase since the 1970s, following a characteristic pattern like a scissors’ diverging blades. This scissor pattern is found across many domains of children’s lives, and we focus on family structure, parenting style, schools, and community connectedness. While children in wealthy families have access to more opportunities than ever before, children in poor families face ever-mounting barriers.
The final section asks how we can reverse the incipient decline of social mobility in America. It draws on the lessons of the early 20th century, as the previous Gilded Age was eventually transmuted into a Golden Age of wide-spread prosperity in mid-century America. This decades-long project required innovations—including the public high school—at all scales of community and governance, and much learning from successes and failures alike. What will be the modern equivalent of the Progressive Era’s high school? Following Our Kids, the paper surveys evidence on the most promising policy interventions in such areas as working-class incomes, universal early childhood education, school and community desegregation, and on-ramps for employment outside of the college track.
A Country Divided: The Growing Opportunity Gap in America 143
Measuring Social Mobility
Standard measures of social mobility assess the correlation between par-ents’ position on the socioeconomic hierarchy and that of their children, both measured at the same stage of the life cycle. For this reason, time series data cannot yet speak persuasively about the effects on social mobility of the soaring inequality of the past few decades. Children only display their full earnings potential when they have finished their education and established their careers, in their 30s and 40s. Americans in their mid-30s today were born around 1980, before income gaps had substantially opened. Those in their mid-20s were born at a time where gaps had expanded somewhat, but we cannot use their earnings yet—many of them, especially future top-earners, are still scrounging students with minimal income. Inevitably there are lags measured in decades between socioeconomic change that affects kids and the visible effects on those kids as adults. Conventional indicators of social mobility therefore provide only a “rearview mirror” take on the problem, some 30 to 40 years out of date.
To avoid the rearview mirror problem Our Kids draws upon a different kind of time series data, concerning the changing nature of childhood in America. A vast body of economic, psychological and neuroscientific research indicates that formative experiences between birth and the end of the teens—and especially in early childhood—are the most powerful determinants of an individual’s later success. For example, the experience of poverty leaves perma-nent marks on the developing brain, impairing basic psychological functions like executive function and working memory; access to extracurricular pro-grams in teenage years is associated with the development of soft skills that are at least as important as hard academic skills in educational and career success; and so on. These “opportunity indicators” strongly predict educational success and income. Thus, what “equality of opportunity” means in practice is that each child has reasonably similar access to healthy emotional and cognitive development.
Opportunity indicators are therefore a valuable proxy for equality of opportunity. For predicting how today’s children and young adults will fare in the future—to look out the front windshield and see where America is heading—they are the best and only tools available. If a single opportunity indicator showed a large and increasing class divide, this might give us pause. What we see in the following section, however, are growing divides across a host of factors that are known to be crucial for children’s life chances. The evidence suggests that a crisis of social mobility is set to unfold over the coming decades.
Economic Mobility: Research & Ideas on Strengthening Families, Communities & the Economy144
The Evidence: A Growing Divide
Our Kids was woven from two different threads of research, one quantitative and the other qualitative. The quantitative contribution comprises novel analyses of longitudinal datasets as well as reviews of existing research. This was comple-mented and informed by hundreds of hours of qualitative interviews with scores of rich kids and poor kids across the country, yielding insights into how different forms of advantage and disadvantage accrue and interact.
This paper focuses on the quantitative analysis. It summarizes some of the most salient findings of Our Kids, focusing on class divides in family structure, parenting styles, schools and education, and community, that shape children’s futures. Readers interested in the full detail of the argument and the richness of the personal stories should turn to the book and its sources.
Family Structure As the economic fault line has widened into a chasm, the families on either
side have begun to look increasingly different. These family differences in turn provide very different starting conditions for children, potently shaping their prospects for success and well-being in adulthood. Fifty years ago, such differences were not so striking. Most American families consisted of a bread-winner dad, a homemaker mom, and the kids: a stable, Ozzie-and-Harriet-style union. Divorce was uncommon, and births outside of marriage were rare in all social strata—4 percent overall in 1950, although the rate was slightly higher among the economically disadvantaged (Cherlin 2010).
In the 1970s, this family structure bifurcated into two distinct patterns closely correlated with class. In the college-educated, upper third of American society, a “neo-traditional” marriage pattern emerged, mirroring the 1950s family structure except that now both parents typically work outside the home and delay childbearing until their careers are under way. In the high-school-educated lower third of the population, by contrast, a more kaleidoscopic pattern began to emerge: childbearing became increasingly disconnected from marriage, sexual partnerships became less durable, and single-parent families became the norm.5
5 Landmark scholarly recognition was McLanahan (2004). On single-parent families: In the first half of the
20th century most single-parent families were such because of the death of a parent, but that fraction
sharply declined from the 1930s to the 1970s. Leaving orphans aside, the fraction of 16-year-olds living
with two biological parents declined from 85 percent in the 1960s to 59 percent in the 1990s. Ellwood
and Jencks (2004).
A Country Divided: The Growing Opportunity Gap in America 145
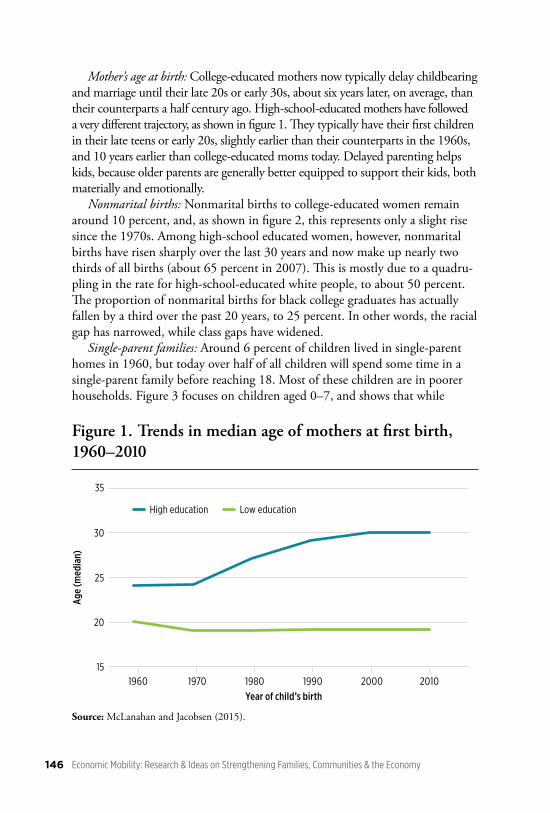
Source: McLanahan and Jacobsen (2015).
Year of child’s birth1960 1970 1980 1990 2000 2010
35
30
25
20
15
Age
(med
ian)
High education Low education
Mother’s age at birth: College-educated mothers now typically delay childbearing and marriage until their late 20s or early 30s, about six years later, on average, than their counterparts a half century ago. High-school-educated mothers have followed a very different trajectory, as shown in figure 1. They typically have their first children in their late teens or early 20s, slightly earlier than their counterparts in the 1960s, and 10 years earlier than college-educated moms today. Delayed parenting helps kids, because older parents are generally better equipped to support their kids, both materially and emotionally.
Nonmarital births: Nonmarital births to college-educated women remain around 10 percent, and, as shown in figure 2, this represents only a slight rise since the 1970s. Among high-school educated women, however, nonmarital births have risen sharply over the last 30 years and now make up nearly two thirds of all births (about 65 percent in 2007). This is mostly due to a quadru-pling in the rate for high-school-educated white people, to about 50 percent. The proportion of nonmarital births for black college graduates has actually fallen by a third over the past 20 years, to 25 percent. In other words, the racial gap has narrowed, while class gaps have widened.
Single-parent families: Around 6 percent of children lived in single-parent homes in 1960, but today over half of all children will spend some time in a single-parent family before reaching 18. Most of these children are in poorer households. Figure 3 focuses on children aged 0–7, and shows that while
Economic Mobility: Research & Ideas on Strengthening Families, Communities & the Economy146
Figure 1. Trends in median age of mothers at first birth, 1960–2010
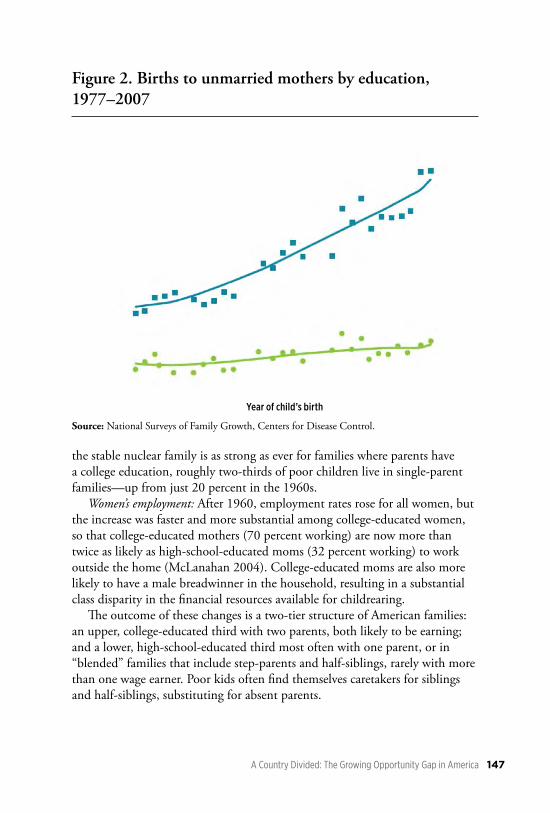
the stable nuclear family is as strong as ever for families where parents have a college education, roughly two-thirds of poor children live in single-parent families—up from just 20 percent in the 1960s.
Women’s employment: After 1960, employment rates rose for all women, but the increase was faster and more substantial among college-educated women, so that college-educated mothers (70 percent working) are now more than twice as likely as high-school-educated moms (32 percent working) to work outside the home (McLanahan 2004). College-educated moms are also more likely to have a male breadwinner in the household, resulting in a substantial class disparity in the financial resources available for childrearing.
The outcome of these changes is a two-tier structure of American families: an upper, college-educated third with two parents, both likely to be earning; and a lower, high-school-educated third most often with one parent, or in “blended” families that include step-parents and half-siblings, rarely with more than one wage earner. Poor kids often find themselves caretakers for siblings and half-siblings, substituting for absent parents.
Source: National Surveys of Family Growth, Centers for Disease Control.
Figure 2. Births to unmarried mothers by education, 1977-2007
19801975 1985 1990 1995 2000 2005 2010
80%
70%
60%
50%
40%
30%
20%
10%
0%
High school or less Bachelor’s degree or more
Year of child’s birth
Figure 2. Births to unmarried mothers by education, 1977–2007
A Country Divided: The Growing Opportunity Gap in America 147

There are competing structural and cultural explanations for these changes, with evidence pointing in both directions. As Our Kids explains, poor women value marriage as much as affluent women. They also equally believe that mar-riage should be delayed until the couple has achieved economic well-being.6 The problem is that the wages of men without college degrees have stagnated or fallen since the early 1970s, and both unemployment and financial strains discourage and undermine stable relationships. Similar patterns were seen in past episodes of economic malaise like the Great Depression (Cavan and Ranck 1938). On the other hand, while marriage rates fell sharply during the 1930s, the non-marital birth rate remained essentially constant despite relatively prim-itive forms of birth control. This suggests that changed values have played a significant role in the rise of non-marital births during the hard times of more recent decades (Bachu 1999). Changing personal values are part of the story, but they are probably secondary to economic trends.
6 Edin and Kefalas (2005) as summarized in Smock and Greenland (2010), 582–83.
Figure 3. Children (aged 0-7) living in a single-parent family, by parental education
19801975 1985 1990 1995 2000 2005 2010
Year of child’s birth
70%
60%
50%
40%
30%
20%
10%
0%
High school or less Bachelor’s degree or more
Note: Includes both single mothers and single fathers. About 4 percent of children—most of them from lower-income backgrounds—are being raised primarily by their grandparents. Source: IPUMS (census 1970, 1980, 1990, 2000) and ACS 2001–12. Also McLanahan and Percheski 2008.
Figure 3. Children (aged 0–7) living in a single-parent family, by parental education
Economic Mobility: Research & Ideas on Strengthening Families, Communities & the Economy148
ParentingNeurobiological research emphasizes that early childhood developmental
experiences are crucial for the brain development that underpins later success in life.7 Healthy infant brain development requires connecting with caring, consistent adults, in give-and-take learning—“contingent reciprocity,” or “serve-and-return” interaction (National Scientific Council on the Developing Child 2004). Different patterns of parenting and caregiving can therefore help, or hurt, a child’s cognitive and socioemotional development. Supportive care-giving, especially before the age of five, is key for the development of the brain’s basic executive functions—concentration, impulse control, mental flexibility, and working memory.
The corollary of this is that early damage is harder and more costly to reme-diate later in the child’s development. It is associated with poorer adult health, educational, economic, and well-being outcomes (Center on the Developing Child 2012). Adverse events that cause such damage are much more likely for poorer children, and even children who are not so poor—children living at twice the poverty level are two to five times more likely than their less impov-erished peers to experience parental death or imprisonment, physical abuse, neighborhood violence, and drugs or alcoholism in the family.8
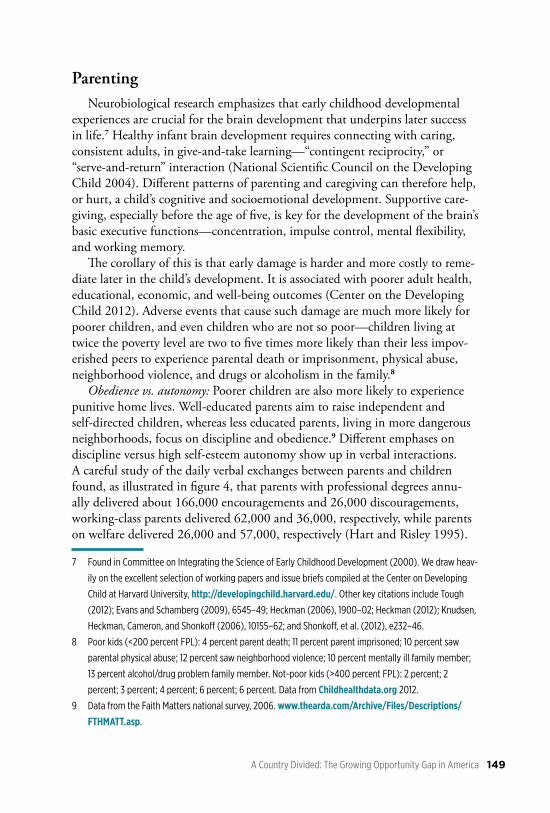
Obedience vs. autonomy: Poorer children are also more likely to experience punitive home lives. Well-educated parents aim to raise independent and self-directed children, whereas less educated parents, living in more dangerous neighborhoods, focus on discipline and obedience.9 Different emphases on discipline versus high self-esteem autonomy show up in verbal interactions. A careful study of the daily verbal exchanges between parents and children found, as illustrated in figure 4, that parents with professional degrees annu-ally delivered about 166,000 encouragements and 26,000 discouragements, working-class parents delivered 62,000 and 36,000, respectively, while parents on welfare delivered 26,000 and 57,000, respectively (Hart and Risley 1995).
7 Found in Committee on Integrating the Science of Early Childhood Development (2000). We draw heav-
ily on the excellent selection of working papers and issue briefs compiled at the Center on Developing
Child at Harvard University, http://developingchild.harvard.edu/. Other key citations include Tough
(2012); Evans and Schamberg (2009), 6545–49; Heckman (2006), 1900–02; Heckman (2012); Knudsen,
Heckman, Cameron, and Shonkoff (2006), 10155–62; and Shonkoff, et al. (2012), e232–46.
8 Poor kids (<200 percent FPL): 4 percent parent death; 11 percent parent imprisoned; 10 percent saw
parental physical abuse; 12 percent saw neighborhood violence; 10 percent mentally ill family member;
13 percent alcohol/drug problem family member. Not-poor kids (>400 percent FPL): 2 percent; 2
percent; 3 percent; 4 percent; 6 percent; 6 percent. Data from Childhealthdata.org 2012.
9 Data from the Faith Matters national survey, 2006. www.thearda.com/Archive/Files/Descriptions/FTHMATT.asp.
A Country Divided: The Growing Opportunity Gap in America 149
A large body of research links parental stress with these harsher and less attentive forms of parenting, and worse outcomes for children (Deater-Deckard 2004; Hoff, Laursen, and Tardif 2002, 239; Simons et al. 1994; Conger and Donnellan 2007). Economic stress in particular disrupts family relations, fosters withdrawn and inconsistent parenting, and directly increases chronic stress among children. In Scarcity (2013), behavioral economists Sendhil Mullainathan and Eldar Shafir explain that under conditions where time and money are scarce, the brain’s ability to grasp, manage, and solve problems falters, and IQ can fall almost a full standard deviation—or as much as missing a whole night’s sleep. “Good parenting,” they write, “requires band-width. It requires complex decisions and sacrifice… This is hard for anyone, whatever his resources. It is doubly hard when your bandwidth is reduced” (Mullainathan and Shafir 2013, 156). The poor are using all their “bandwidth” (working memory) worrying about how to pay the rent, or whether the car will operate today, and this prevents them from using this bandwidth for other pressing problems that they need to solve. While around 20 percent of college-educated families experience financial worries, this figure is close to 50 percent for high-school-educated families.10
10 See DDB Needham Life Style surveys, http://bowlingalone.com/?page_id=7.
Source: Hart and Risley (1995).
Welfare Working-class
Social class of parents
Verb
al e
ncou
rage
men
ts a
nddi
scou
rage
men
ts p
er y
ear (
est.)
Professional
180,000
160,000
140,000
120,000
100,000
80,000
60,000
40,000
20,000
0
Encouragements Discouragements
Economic Mobility: Research & Ideas on Strengthening Families, Communities & the Economy150
Figure 4. Class differences in verbal parenting
Poorer and wealthier parents’ contrasting emphasis on obedience versus independence may also be understood as an adaptation to their respective social circumstances: Well-off parents focus on “promotive” strategies, nur-turing their children’s talents in comfortable settings with many opportunities and few dangers; while poorer families employ “preventive” strategies, aimed at keeping their children safe in rough neighborhoods where dangers far outnum-ber opportunities (Furstenberg et al. 1999).
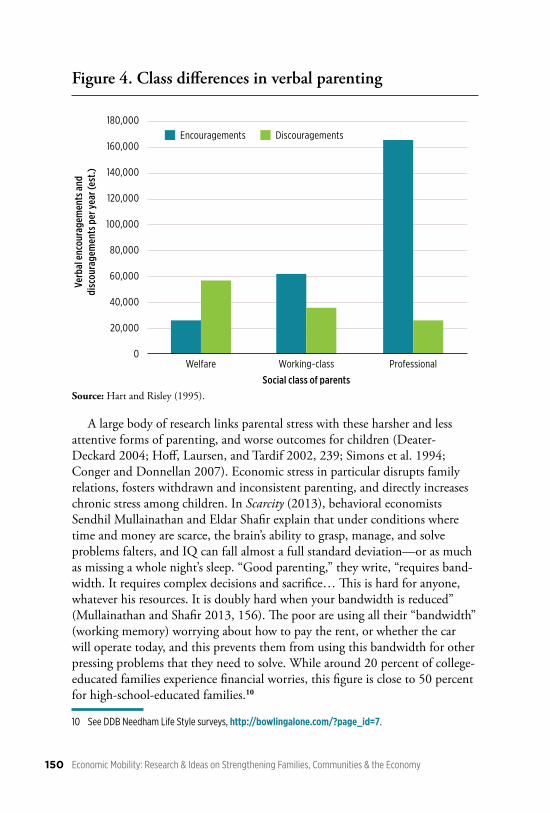
Investment of money: Class differences in financial resources are also reflected in different levels of “enrichment spending.” While parents’ annual spending in this category for the top 10 percent of children has doubled from 1973 to 2005, to almost $7,000 (inflation-adjusted) per year, the bottom 10 percent of children still receive only $750. The increase for wealthy children, shown in figure 5, is concentrated in private education and childcare, but also reflects music lessons, summer camp, travel, school supplies, computers, extracurric-ular activities, recreation, and leisure. These differences in parental investment are strong predictors of children’s cognitive development.
Investment of time: Parents at all educational and income levels are spending more time with their kids nowadays than their counterparts did a half-century
Source: Kornrich and Furstenberg (2013).
Figure 5. Trends in spending on children per child, by household income, in constant (2008) dollars, 1972-2007
19801975 1985 1990 1995 2000 2005 2010Year of child’s birth
$7,000
$6,000
$5,000
$4,000
$3,000
$2,000
$1,000
$0
Top decile Eighth decile Third decile Bottom decile
Figure 5. Trends in spending on children per child, by household income, in constant (2008) dollars, 1972–2007
A Country Divided: The Growing Opportunity Gap in America 151
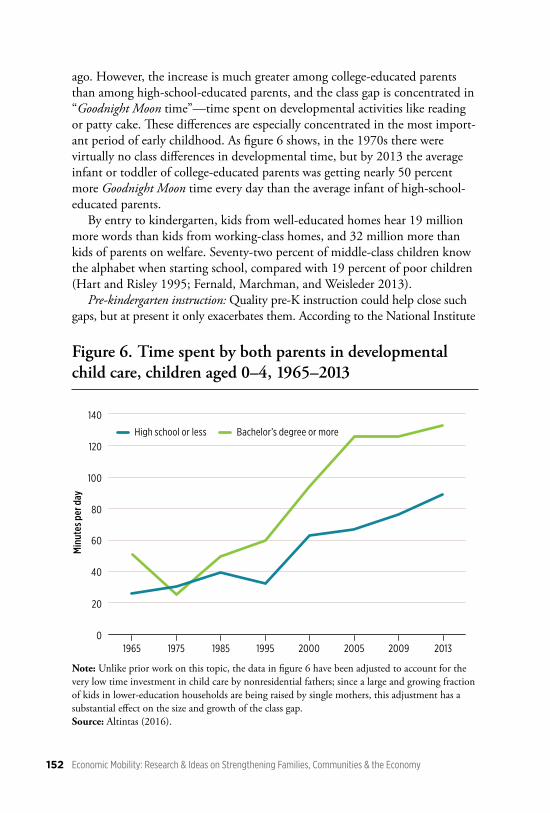
ago. However, the increase is much greater among college-educated parents than among high-school-educated parents, and the class gap is concentrated in “Goodnight Moon time”—time spent on developmental activities like reading or patty cake. These differences are especially concentrated in the most import-ant period of early childhood. As figure 6 shows, in the 1970s there were virtually no class differences in developmental time, but by 2013 the average infant or toddler of college-educated parents was getting nearly 50 percent more Goodnight Moon time every day than the average infant of high-school-educated parents.
By entry to kindergarten, kids from well-educated homes hear 19 million more words than kids from working-class homes, and 32 million more than kids of parents on welfare. Seventy-two percent of middle-class children know the alphabet when starting school, compared with 19 percent of poor children (Hart and Risley 1995; Fernald, Marchman, and Weisleder 2013).
Pre-kindergarten instruction: Quality pre-K instruction could help close such gaps, but at present it only exacerbates them. According to the National Institute
Note: Unlike prior work on this topic, the data in figure 6 have been adjusted to account for the very low time investment in child care by nonresidential fathers; since a large and growing fraction of kids in lower-education households are being raised by single mothers, this adjustment has a substantial effect on the size and growth of the class gap.Source: Altintas (2016).
Figure 6. Time spent by both parents in developmental child care, children aged 0-4, 1965-2013
140
120
100
80
60
40
20
1965 1975 1985 1995 2000 2005 2009 20130
Min
utes
per
day
High school or less Bachelor’s degree or more
Figure 6. Time spent by both parents in developmental child care, children aged 0–4, 1965–2013
Economic Mobility: Research & Ideas on Strengthening Families, Communities & the Economy152
for Early Education Research, “At age four, enrollment in pre-K (public and private) is about 65 percent for the lowest 40 percent of families by income and 90 percent for the highest income quintile. At age three when state pre-K is rarely provided, enrollment is only about 40 percent for low-income and moderate-income families while it is 80 percent for the top-income quintile” (Barnett 2011).11 This is precisely the stage that brain science suggests is so critical.
Schools and CollegesPoor children bring substantial disadvantage to their first day of school.
Does the average school help level the playing field, or does it too only enlarge the gap between poorer and wealthier children?
The public school system was partly created to equalize access to education across the classes, and yet, in outcomes at least, America’s education system is becoming more unequal: The gap in elementary and secondary school performance (as measured by test scores) between children from poor and rich families has grown by 30–40 percent over the past 25 years. Yet schools themselves do not seem to be driving this gap—the gap is already large by the time children enter kindergarten, and does not grow substantially as children progress through school (Reardon 2011).
School economic polarization: Why do schools fail to contribute to closing the opportunity gap? Because of the increasing class segregation of American communities, rich kids and poor kids are increasingly concentrated in different and unequal schools. However, the evidence suggests that the primary explana-tion is not to be found in typical measures of school inputs, like spending per pupil, student-teacher ratios, and teacher training and seniority. Instead, the effect schools have on students has more to do with the challenges and assets that children bring with them to school. Affluent kids bring highly engaged parents, one of the strongest contributors to school success, as well as high expectations for themselves and their classmates (Henderson and Berla 1994).12 Poor kids are much more likely to bring the stress of crumbling families, depri-vation, and dangerous neighborhoods. Carrel and Hoekstra (2010) found that kids exposed to domestic violence reduced other kids’ achievement, especially in high-poverty schools.
Part of the reason that schools are ineffective at leveling the playing field, then, is that 30 to 40 years of increasing social segregation has shunted
11 See also Meyers et al. (2004).
12 Other recent overviews of the vast literature on the effects of parental engagement include: Jeynes
(2007); Hill and Tyson (2009); Jeynes (2004); Van Voorhis et al. (2013); and Dufur, Parcel, and McKune
(2013). For a recent polemic debate about whether parental involvement is overrated, see Robinson and
Harris (2014); and Miksic (2014).
A Country Divided: The Growing Opportunity Gap in America 153
high-income and low-income students into separate schools. “One of the most consistent findings in research on education” is that poor kids achieve more in high-income schools. In fact, some studies find that the correlation of a student’s high school learning with her classmates’ family backgrounds is greater than the correlation with her own family background.13
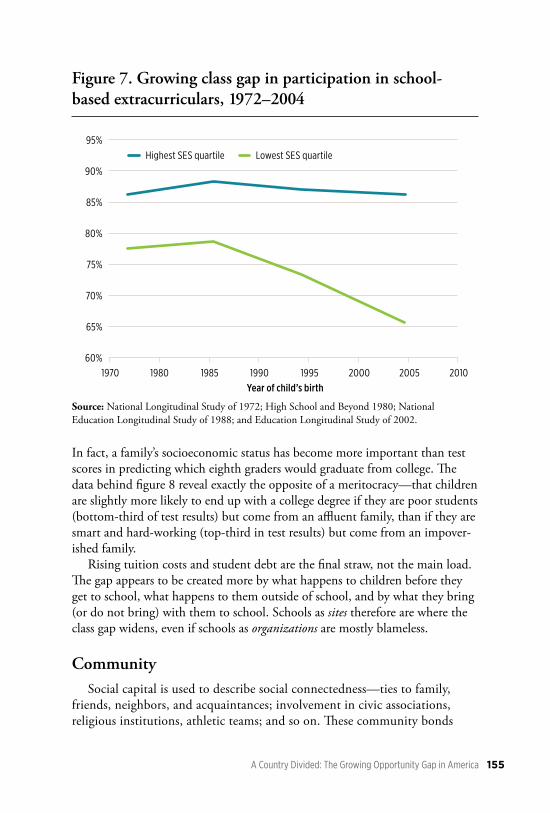
Extracurricular activities: Another difference between schools on either side of the class divide is their provision of extracurricular activities. Extracurriculars are especially important for developing noncognitive skills and habits, such as grit, teamwork, leadership, and sociability. Soft skills and extracurricu-lar participation can be as important as hard skills and formal schooling in explaining educational attainment and earnings 10 years later (Lieras 2008; Cunha, Heckman, and Schennach 2010; Covay and Carbonaro 2010). Poor kids are three times as likely to participate in neither sports nor clubs (30 percent vs. 10 percent), and half as likely to participate in both sports and clubs (22 percent vs. 44 percent) (Theokas and Bloch 2006). As captured in figure 7, between 1972 and 2004, the participation gap in all extracurriculars between poor and rich kids grew from less than 10 percent to more than 20 percent, and the same growing gap appears for most extracurricular activities viewed separately—from football to choral singing. This is partly caused by the increase of pay-to-play policies, which disproportionately affect poor kids and effectively privatize extracurricular participation, excluding precisely the stu-dents who most need these experiences (C.S. Mott’s Children’s Hospital 2012; Huntington Bank Annual Backpack Index 2014).
Trends in college completion: For a range of socioeconomic outcomes college graduation is much more important than college entrance. While the class gap in college completion was substantial 30 to 40 years ago, it has steadily expanded to a gulf. By the beginning of the 21st century only about 10 percent of children in the lowest income quartile completed college, compared with more than 50 percent of children in the highest quartile (Mortenson 2012).
13 Useful entryways to the massive literature on this topic include Coleman et al. (1966), 325; Orfield and
Eaton (1996); Fischer et al. (1996); Kahlenberg (2003), esp. 153–55; Rumberger and Palardy (2005);
Logan, Minca, and Adar (2012); and for a comprehensive recent overview, Palardy (2013). Van Ewijk
and Sleegers (2010), found that the effect of the socioeconomic composition of a child’s classroom
on his or her test scores is twice as large as the effect of the socioeconomic composition of his or her
school. This entire line of research was stimulated in the 1960s by concerns about the effects of racial
segregation, and in that era class segregation heavily overlapped with racial segregation. During the
past half-century, however, class segregation has grown, while racial segregation has diminished, and it
is now possible to compare the adverse effects of racial and class segregation. While racial segregation
continues to be a major national problem, virtually all relevant studies have concluded that class segre-
gation is at least as pernicious in its effects on student achievement. See Kahlenberg (2007).
Economic Mobility: Research & Ideas on Strengthening Families, Communities & the Economy154
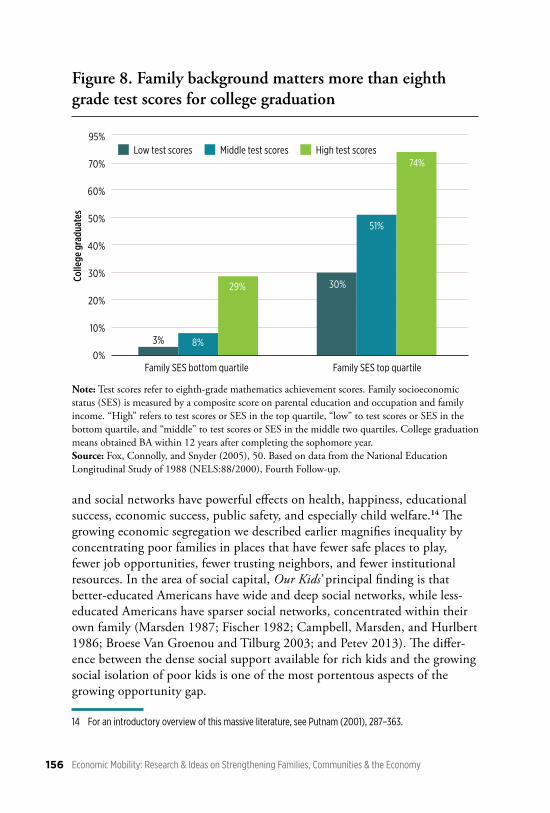
In fact, a family’s socioeconomic status has become more important than test scores in predicting which eighth graders would graduate from college. The data behind figure 8 reveal exactly the opposite of a meritocracy—that children are slightly more likely to end up with a college degree if they are poor students (bottom-third of test results) but come from an affluent family, than if they are smart and hard-working (top-third in test results) but come from an impover-ished family.
Rising tuition costs and student debt are the final straw, not the main load. The gap appears to be created more by what happens to children before they get to school, what happens to them outside of school, and by what they bring (or do not bring) with them to school. Schools as sites therefore are where the class gap widens, even if schools as organizations are mostly blameless.
CommunitySocial capital is used to describe social connectedness—ties to family,
friends, neighbors, and acquaintances; involvement in civic associations, religious institutions, athletic teams; and so on. These community bonds
Source: National Longitudinal Study of 1972; High School and Beyond 1980; National Education Longitudinal Study of 1988; and Education Longitudinal Study of 2002.
Figure 7. Growing class gap in participation in school-based extracurriculars, 1972-2004
198070 1985 1990 1995 2000 2005 201019Year of child’s birth
95%
90%
85%
80%
75%
70%
65%
60%
Highest SES quartile Lowest SES quartile
Figure 7. Growing class gap in participation in school-based extracurriculars, 1972–2004
A Country Divided: The Growing Opportunity Gap in America 155
and social networks have powerful effects on health, happiness, educational success, economic success, public safety, and especially child welfare.14 The growing economic segregation we described earlier magnifies inequality by concentrating poor families in places that have fewer safe places to play, fewer job opportunities, fewer trusting neighbors, and fewer institutional resources. In the area of social capital, Our Kids’ principal finding is that better-educated Americans have wide and deep social networks, while less-educated Americans have sparser social networks, concentrated within their own family (Marsden 1987; Fischer 1982; Campbell, Marsden, and Hurlbert 1986; Broese Van Groenou and Tilburg 2003; and Petev 2013). The differ-ence between the dense social support available for rich kids and the growing social isolation of poor kids is one of the most portentous aspects of the growing opportunity gap.
14 For an introductory overview of this massive literature, see Putnam (2001), 287–363.
Note: Test scores refer to eighth-grade mathematics achievement scores. Family socioeconomic status (SES) is measured by a composite score on parental education and occupation and family income. “High” refers to test scores or SES in the top quartile, “low” to test scores or SES in the bottom quartile, and “middle” to test scores or SES in the middle two quartiles. College graduation means obtained BA within 12 years after completing the sophomore year.Source: Fox, Connolly, and Snyder (2005), 50. Based on data from the National Education Longitudinal Study of 1988 (NELS:88/2000), Fourth Follow-up.
Figure 8. Family background matters more than 8th grade test scores for college graduation
95%
60%
70%
50%
40%
30%
20%
10%
0%
Colle
ge g
radu
ates
Family SES bottom quartile Family SES top quartile
3% 8%
29% 30%
51%
74%Low test scores Middle test scores High test scores
Figure 8. Family background matters more than eighth grade test scores for college graduation
Economic Mobility: Research & Ideas on Strengthening Families, Communities & the Economy156
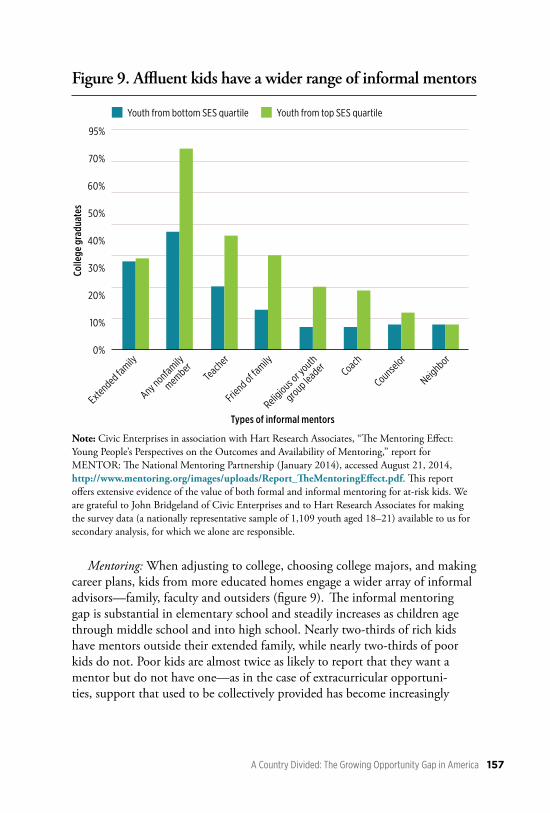
Mentoring: When adjusting to college, choosing college majors, and making career plans, kids from more educated homes engage a wider array of informal advisors—family, faculty and outsiders (figure 9). The informal mentoring gap is substantial in elementary school and steadily increases as children age through middle school and into high school. Nearly two-thirds of rich kids have mentors outside their extended family, while nearly two-thirds of poor kids do not. Poor kids are almost twice as likely to report that they want a mentor but do not have one—as in the case of extracurricular opportuni-ties, support that used to be collectively provided has become increasingly
Note: Civic Enterprises in association with Hart Research Associates, “The Mentoring Effect: Young People’s Perspectives on the Outcomes and Availability of Mentoring,” report for MENTOR: The National Mentoring Partnership (January 2014), accessed August 21, 2014, http://www.mentoring.org/images/uploads/Report_TheMentoringEffect.pdf. This report offers extensive evidence of the value of both formal and informal mentoring for at-risk kids. We are grateful to John Bridgeland of Civic Enterprises and to Hart Research Associates for making the survey data (a nationally representative sample of 1,109 youth aged 18–21) available to us for secondary analysis, for which we alone are responsible.
Figure 9. Family background matters more than 8th grade test scores for college graduation
95%
60%
70%
50%
40%
30%
20%
10%
0%
Colle
ge g
radu
ates
Youth from bottom SES quartile Youth from top SES quartile
Types of informal mentors
Extended family
Any nonfamily
memberTe
acher
Friend of fa
mily
Religious o
r youth
group leader
Coach
Counselor
Neighbor
Figure 9. Affluent kids have a wider range of informal mentors
A Country Divided: The Growing Opportunity Gap in America 157
privatized, and thus less available to poor kids.15 Poor kids’ isolation reduces their access to information that would help
them navigate important decisions, and also reduces their access to other kinds of resources that networks provide. One example is the notion of family and community “air bags” that deploy when adolescents encounter risks or make missteps.16 Studies over the last 40 years tend to find that, if anything, drug use and binge drinking are more common among privileged teens than their less affluent peers.17 Youth development is not about avoiding all mistakes, but learning from those you do make. All kids—rich, poor, black, white, brown—do dumb things. Poor families, however, lack the resources and connections to minimize the negative consequences of such misadventures.
Policy Implications
The evidence above paints a gloomy picture for the future of social mobil-ity in America. Notably, these findings are well-aligned with other studies in the literature—Chetty et al. (2014a), for example, identify a strikingly similar pattern of factors as most important for determining which U.S. regions are more socioeconomically mobile: “High mobility areas have (1) less residential segregation, (2) less income inequality, (3) better primary schools, (4) greater social capital, and (5) greater family stability” (Chetty et al. 2014a).18
Children born today are likely to be the most socioeconomically divided generation in many decades. Given the lagging nature of social mobility measures, this generation will not show up in standard measures for several decades. Policy responses to social mobility thus suffer from a time-lag problem very similar to that of carbon dioxide emissions and global warming. Also like global warming, this makes a wait-and-see approach highly risky—costs are likely to be catastrophically large if we wait for decades to confirm what the evidence already suggests is clear. We need a bias for action.
15 In our discussion of mentoring, “rich” and “poor” refer to the top and bottom quartiles of a composite
measure of socioeconomic status.
16 Although Robert Putnam may have coined the term “air bag” in this context, he is not the first person
to notice the phenomenon. The anthropologist Sherry Ortner (2006, 99) reports that “I heard, from
[upper-middle class] parents and grown children alike, about an amazing array of what I came to think
of as “rescuing mechanisms” on behalf of children who seemed to be in trouble: counseling, therapy,
rehab programs, tutoring, booster courses, abortions for pregnant daughters, expensive legal services
for sons in trouble with the law.”
17 Analysis of Monitoring the Future surveys, 1976–2012, the DEA’s annual national survey of drug usage
among American teens. See also Humensky (2010), 19; and Patrick et al. (2012).
18 See also endnote 45 in chapter 1, Chetty et al. (2014b).
Economic Mobility: Research & Ideas on Strengthening Families, Communities & the Economy158
Policy action on income inequality is often stalled by the concern that taxation and redistribution entail reduced economic efficiency—that there is, in the words of economist Arthur Okun (1975), a “Big Tradeoff” between equity and efficiency. Notably, Okun himself argued that this trade-off does not apply to policies that improve equality of opportunity. In fact, failing to address the opportunity gap is expected to be immensely costly for the nation as a whole, largely due to lost labor productivity. Workers who are prevented from developing their full capacities, like the high-scoring eighth graders held back by poverty in figure 8, will contribute far less to general prosperity than they otherwise could.
Holzer et al. (2008) estimate that the total cost of poverty for the U.S. economy, due to lost labor productivity, increased crime, and reduced public health, is at least $500 billion per year. Bradbury and Triest (2014) find that lower social mobility slows economic growth, such that low-mobility cities like Atlanta experience immense costs—if Atlanta had the same equality of oppor-tunity that high-mobility Salt Lake City has, its economy would be 11 percent bigger.19 If Our Kids is right, these costs will sharply increase over the coming decades, reducing the living standards of American children on both sides of the socioeconomic divide.
This paper opened by revisiting a period during which the United States faced similar challenges—the Gilded Era of the late 19th century. The gradual process of correcting such a complex, multifaceted problem was assisted greatly by the nature of the U.S. federal system, which provides enormous scope for experimentation on multiple levels of government. Federal-level reforms, like Roosevelt’s New Deal, were important drivers of change, but many of the most important institutional innovations originated at lower levels of community governance.
Take the invention of high schools, a central innovation of the Progressive Era. Small towns and villages in the Midwest were forerunners in the “high school movement” from 1910 to 1920. The movement soon spread through-out those states, and then across the country, such that around 73 percent of American teens would enroll in public high school in 1940. In later decades, universal high school education would be the bedrock of the expansion of col-lege education across the socioeconomic classes, improving social mobility and contributing probably more than any other innovation to American economic growth in the 20th century. Public high schools required investment from wealthy families but ultimately benefited rich and poor alike (Goldin and Katz
19 “Metropolitan area” is defined operationally as the “commuting zone” around a central city. We are
grateful to Bradbury and Triest for calculating these specific estimates of the implications of their
broader quantitative findings. Other relevant recent studies are Hsieh et al. (2013); and Marrero and
Rodriguez (2013).
A Country Divided: The Growing Opportunity Gap in America 159

1999). This is a classic example of a policy that simultaneously fostered both growth (by increasing workforce productivity) and equality (by leveling the playing field).
What will be today’s equivalent to the Progressive Era’s high school? In what follows, some promising candidates for major reform are discussed.
Increasing Working Class IncomesResearch indicates that one most important prescription is to restore
working-class incomes. Higher incomes contribute to improving each of the opportunity indicators examined—reducing parental stress, increasing investment in children, improving marriage stability, providing access to safer communities and better schools, and offering more opportunities to network. On the larger scale, increases in working-class incomes are likely to reduce the number of communities marred by high levels of crime and economic segrega-tion.
Increases in family income have especially marked effects upon child development when they occur during preschool and elementary school years. Duncan, Ziol-Guest, and Kalil (2010) find that a $3,000 increase in family income during a child’s first five years of life, controlling for other factors, leads to around a 20 percent higher income for the children later in life.
Programs like the Earned Income Tax Credit (EITC) and Child Tax Credit (CTC) go some way toward boosting the incomes of poor families, but they are too small at present, and they only help the working poor—not the poorest of poor children, whose parents have no income to tax. The EITC could be expanded especially for families with young children, and the CTC could be made fully-refundable, so that it reaches the children in the very poorest of households. The poorest children also especially depend upon antipov-erty programs like food stamps, housing vouchers, and child care support. Strengthening the part of the safety net that reaches the poorest children is likely to have the greatest value, both for economic growth and equality of opportunity.
Universal Early Childhood EducationOne particularly promising intervention is universal early childhood edu-
cation, which, in its higher-quality forms, may go at least some way toward equalizing child development across the socioeconomic divide. Controlled trials show that high-quality programs positively impact academic results, adult earnings, and criminal behavior, with the more expensive programs providing an estimated 6 to 10 percent return on investment (Heckman 2012; Heckman
Economic Mobility: Research & Ideas on Strengthening Families, Communities & the Economy160
et al. 2009).20 As with the spread of public high schools, early childhood education is spreading rapidly in some states—including in the conservative state, Oklahoma, where 74 percent of four-year-olds were enrolled by 2012 (Gormley, Phillips, and Gayer 2008; Gormley et al. 2005; Gormley et al. 2004).
Such a program can be complemented by other schemes that aid early development, such as paid parental leave in the first year of life and programs that coach poor parents in parenting skills. Successful examples of the latter include Nurse-Family Partnerships, HIPPY, Child First, and the UK Troubled Families initiative (Waldfogel and Washbrook 2011; Baker, Piotrkowski, and Brooks-Gunn 1999; Lowell et al. 2011; Policy Paper 2014).21
Reducing Community and School SegregationReducing residential class and racial segregation would not only increase
diversity in schools, but also provide poorer children access to safer neighbor-hoods with richer networks and resources. Two proven methods—mandatory inclusionary zoning (MIZ) and community land trusts (CLTs)—involve non-market allocation of some of the housing stock. MIZs require new real estate developments to keep a percentage of housing units affordable for low-income families. The first in the United States, the Moderately Priced Dwelling Unit program in Montgomery County, Maryland, now counts 12,000 afford-able dwellings (NLIHC 2014). There are more than 100 such programs in California districts alone. In the CLT model, on the other hand, land is owned and developed by a nonprofit whose purpose is to preserve housing affordabil-ity for low-income families. CLTs exist in hundreds of U.S. communities, such as Boston’s Dudley Neighbors Incorporated and the Burlington Community Land Trust in Vermont.
A final promising approach for reducing segregation is helping families with young children to move out of the most disadvantaged communities. The best-studied example is Moving to Opportunity, which provided vouchers for such families to move to neighborhoods with lower poverty rates. Recent studies suggest that the impacts on children’s academic scores and other opportunity indicators can be substantial and are largest where children move early, stay in the new neighborhoods longer, and escape from the most disadvantaged and violent communities (Chetty, Hendren, and Katz 2015; Turner, Nichols, and Comey 2012; Will-Burdick et al. 2011).
20 Other researchers, while agreeing that the rate of return from early childhood education is favorable,
view the Heckman estimate as perhaps too high, based as it is on a single landmark study begun in the
1960s of the Perry Preschool in Ypsilanti, Michigan.
21 See also Harrison (2010).
A Country Divided: The Growing Opportunity Gap in America 161

One option for directly reducing socioeconomic segregation in schools is to “soften” or redraw enrollment boundaries (Madar 2015). In cities where rich and poor neighborhoods are close to one another, the necessary boundary changes may be relatively small. In other cases, boundaries may need to be extended to cover both wealthy suburban areas and poorer urban areas—with subsidized busing of children as required. Another strategy is to encourage charter schools to employ parallel admission lotteries, by family income and other demographic characteristics. This approach has significantly increased diversity at schools like Community Roots of Fort Greene in Brooklyn (Kahlenberg and Potter 2012).
On-Ramps to EmploymentWhatever merit “four-year college for all” has as an ideal, it is a fact that very
few children from disadvantaged backgrounds now obtain four-year degrees. While this disparity must be addressed, there is an undeniable need for alterna-tive on-ramps to successful careers. Three options stand out: career and technical education in secondary schools, apprenticeships in workplaces, and revamped and strengthened community colleges.
Some high schools are pioneering innovative approaches to what is termed “career and technical education.” A notable example is the Career Academies program, a school-within-a-school that offers academic and technical training for a specific career and partners with local employers to provide relevant work experience. This approach appears to produce excellent results: A controlled trial found that Career Academy students’ later earnings were 17 percent higher than nonparticipants, they experienced no disadvantage in achieving postsecondary degrees, and they were more likely to marry and to live with their biological children (Kemple 2008).
Apprenticeships are another underused on-ramp to work, and in countries like the UK and Germany they are an important non-college track into well paid employment. Apprenticeships combine on-the-job training with coordi-nated in-class supplementation, and, for isolated poor children, apprenticeships often have the added benefit of providing a potential mentor in their work-place supervisor. South Carolina is one state with a high-quality apprenticeship program supported by modest tax credits of $1,000 per apprentice, and some of the biggest investors in the program have been large German companies like BMW and Bosch. Effective programs can be lucrative for participants: A study of a Washington state apprenticeship program, costing an average of around $5,500 per apprentice, found it increased earnings in the following two and a half years by $78,000 compared to nonparticipants—and expected lifetime earn-ings increased by a remarkable $440,000 (Workforce Training and Education Coordinating Board 2014).
Economic Mobility: Research & Ideas on Strengthening Families, Communities & the Economy162
Community colleges are the third on-ramp outside the college track and play a crucial role in encouraging upward mobility. However, at present they have low completion rates—barely one-third of students emerge with a two- or four-year degree within six years (Shapiro et al. 2014). This is in part due to the immense challenge of teaching underprepared students and the insufficient resources that community colleges typically receive. The high drop-out rate is also a reflection of the challenges facing underprepared kids who lack social support as they try to navigate the complexities of today’s community college offerings.
But these challenges are not insurmountable. The Accelerated Study in Associate Programs (ASAP) initiative at the City University of New York (CUNY) is one of the most effective community college interventions yet designed. It combines intensive advising and career counseling, highly struc-tured degree pathways to reduce the complexity of navigating a pathway to graduation, a requirement that students attend full-time, and financial supports like free public transportation and textbooks. A carefully controlled study found it doubled graduation rates (Scrivener et al. 2015). Additional investment was required, but by dramatically increasing graduation rates the program lowered the total cost per degree.
Other LeversThere are many other promising interventions beyond the above list, and
likely many that have yet to be invented. Notable options include reducing incarceration rates for non-violent crimes, such as many of those associated with the war on drugs (Shoenberger 2012);22 accepting the kaleidoscopic nature of family structure in the 21st century and shifting the stigma from unwed parenting to unplanned parenting; and replacing failed community ties with high-quality mentoring and coaching programs, with institutions such as churches, schools, or AmeriCorps leading the charge.
Conclusion
Equal opportunity is set to diminish in America in coming decades. Across all ethnicities, poorer and wealthier children have diverged on a range of important opportunity indicators: the structure of their families, the money spent by parents and the time spent with their parents, access to extracurricular activities, test scores in schools, college entrance and especially college comple-tion, and much beyond. These factors in turn shape each child’s endowment of cognitive and noncognitive skills, as well as their access to human, cultural, and
22 See also Sykes and Pettit (2014).
A Country Divided: The Growing Opportunity Gap in America 163
social capital. Growing gaps between poor and wealthy children translate into starkly diverging destinies.
This opportunity gap is a “purple,” bipartisan problem with the potential to galvanize red and blue Americans alike. Both have legitimate arguments about its causes: Progressives rightly identify the deterioration of economic conditions for working-class families as a key trigger of these trends, but the cultural changes bemoaned by conservatives undeniably have played an important role. Both have strong reasons to be concerned about its economic effects: Progressives may emphasize equity, while conservatives may emphasize the importance of economic growth, since the nation is, at present, effectively squandering the talents of one-third of its future workforce. Finally, there are shared values at stake: For all their differences, both sides of American politics cherish what Bernanke described, at the outset of this paper, as the “bedrock principle of equality of opportunity.”
Fittingly, then, promising policy innovations are emerging in red and blue jurisdictions alike, from the early childhood education investments of Oklahoma to apprenticeship programs in Washington state. If history is to be our guide, widespread experimentation will be essential to solving the problem. The Gilded Age of the late 19th century was transmuted into wider prosperity only through policy experimentation on all levels of government, from the public high schools that sprouted in small Midwestern towns to the sweeping changes of Roosevelt’s New Deal.
The evidence reviewed by this paper points to the urgency of such reforms. Given the lagging nature of social mobility measures, today’s data reveal only the tip of the oncoming iceberg. Delay will allow opportunity gaps to further expand, increasing the task ahead and dooming a large part of a generation to despair. It is advisable, then, to err on the side of action. Examples of prom-ising reforms include increasing lower-class incomes, making early childhood education universal, desegregating schools and neighborhoods, and improving on-ramps to well-paid employment outside of the four-year college track. Restoring equal opportunity will be costly; ignoring it will be costlier still.
Economic Mobility: Research & Ideas on Strengthening Families, Communities & the Economy164
References
Altintas, Evrim. 2016. “Widening Education-Gap in Developmental Childcare Activities in the United States,
1965–2013.” Journal of Marriage and Family 78 (1): 26–42.
Bachu, Amara. 1999. “Trends in Premarital Childbearing: 1930 to 1994.” Current Population Reports, 23–197.
Washington, D.C.: U.S. Census Bureau. www.census.gov/prod/99pubs/p23-197.pdf.
Badger, Emily. 2015. “Hillary Clinton is Getting Serious about Social Mobility.” Washington Post March 23.
Baker, Amy J. L., Chaya S. Piotrkowski, and Jeanne Brooks-Gunn. 1999. “The Home Instruction Program for
Preschool Youngsters (HIPPY).” The Future of Children 9 (1): 116–33.
Barnett, W. Stephen, Megan E. Carolan, Jen Fitzgerald, and James H. Squires. 2011. The State of Preschool
2011: State Preschool Yearbook. New Brunswick, NJ: National Institute for Early Education Research.
http://nieer.org/publications/state-preschool-2011.
Bartels, Larry M. 2008. Unequal Democracy: The Political Economy of the New Gilded Age. Princeton, NJ:
Princeton University Press.
Bernanke, Ben S. 2007. “The Level and Distribution of Economic Well-Being.” Remarks before the Greater
Omaha Chamber of Commerce, Omaha, NE, February 6. www.federalreserve.gov/newsevents/speech/bernanke20070206a.htm.
Bischoff, Kendra, and Sean F. Reardon. 2014. “Residential Segregation by Income, 1970–2009.” In Diversity
and Disparities: America Enters a New Century, edited by John Logan, 208–34. New York: Russell Sage
Foundation. www.russellsage.org/publications/diversity-and-disparities.
Bradbury, Katharine, and Robert K. Triest. 2014. “Inequality of Opportunity and Aggregate Economic
Performance.” Paper prepared for the conference Inequality of Economic Opportunity, Federal Reserve
Bank, Boston, October.
Broese Van Groenou, Marjolein I., and Theo Van Tilburg. 2003. “Network Size and Support in Old Age:
Differentials by Socio-Economic Status in Childhood and Adulthood.” Ageing and Society 23:625–45.
Bruce, Mary, and John Bridgeland. 2014. The Mentoring Effect: Young People’s Perspectives on the Outcomes
and Availability of Mentoring. Washington, D.C.: Civic Enterprises in association with Hart Research
Associates for MENTOR: The National Mentoring Partnership.
C. S. Mott Children’s Hospital. 2012. “Pay-to-Play Sports Keeping Lower-Income Kids Out of the Game.”
National Poll on Children’s Health 15 (3) May. http://mottnpch.org/reports-surveys/pay-play-sports-keeping-lower-income-kids-out-game.
Campbell, Karen E., Peter V. Marsden, and Jeanne S. Hurlbert. 1986. “Social Resources and Socioeconomic
Status.” Social Networks 8:97–117.
Carrell, Scott E., and Mark L. Hoekstra. 2010. “Externalities in the Classroom: How Children Exposed to
Domestic Violence Affect Everyone’s Kids.” American Economic Journal: Applied Economics 2:211–28.
A Country Divided: The Growing Opportunity Gap in America 165
Cavan, Ruth Shonle, and Katherine Howland Ranck. 1938. The Family and the Depression. Chicago: University
of Chicago Press.
Center on the Developing Child at Harvard University. 2012. “InBrief: The Science of Neglect.” InBrief Series,
Harvard University. http://developingchild.harvard.edu/wp-content/uploads/2015/05/InBrief-The-Science-of-Neglect-3.pdf.
Cherlin, Andrew J. 2010. “Demographic Trends in the United States: A Review of Research in the 2000s.”
Journal of Marriage and Family 72 (June): 406.
Chetty, Raj, Nathaniel Hendren, and Lawrence F. Katz. 2015. The Effects of Exposure to Better Neighborhoods
on Children: New Evidence from the Moving to Opportunity Experiment. NBER Working Paper 21156.
Chetty, Raj, Nathaniel Hendren, Patrick Kline, and Emmanuel Saez. 2014a. “Where is the Land of
Opportunity? The Geography of Intergenerational Mobility in the United States.” The Quarterly Journal
of Economics 129 (4): 1553–623.
Chetty, Raj, Nathaniel Hendren, Patrick Kline, Emmanuel Saez, and Nicholas Turner. 2014b. “Is the United
States Still a Land of Opportunity? Recent Trends in Intergenerational Mobility.” American Economic
Review Papers & Proceedings 104:141–47.
Childhealthdata.org. “National Survey of Children’s Health 2011/12.” 2012. Data Resource Center for Child and
Adolescent Health, Child and Adolescent Health Measurement Initiative. www.childhealthdata.org/learn/topics_questions/2011-12-nsch.
Coleman, James S., et al. 1966. Equality of Educational Opportunity. Washington, D.C.: U.S. Department of
Health, Education & Welfare, Office of Education, OE-38001 and supplement, 325.
Committee on Integrating the Science of Early Childhood Development, Youth and Families Board on
Children, and National Research Council. 2000. From Neurons to Neighborhoods: The Science of Early
Child Development, ed. Jack P. Shonkoff and Deborah A. Phillips. Washington, D.C.: National Academies
Press.
Conger, Rand D., and M. Brent Donnellan. 2007. “An Interactionist Perspective on the Socioeconomic Context
of Human Development.” Annual Review of Psychology 58:175–99.
Covay, Elizabeth, and William Carbonaro. 2010. “After the Bell: Participation in Extracurricular Activities,
Classroom Behavior, and Academic Achievement.” Sociology of Education 83:20–45.
Cunha, Flavio, James J. Heckman, and Susanne M. Schennach. 2010. “Estimating the Technology of Cognitive
and Noncognitive Skill Formation.” Econometrica 78:883–931.
Deater-Deckard, Kirby. 2004. Parenting Stress. New Haven, CT: Yale University Press.
Dufur, Mikaela J., Toby L. Parcel and Benjamin A. McKune. 2013. “Does Capital at Home Matter More Than
Capital at School? The Case of Adolescent Alcohol and Marijuana Use.” Journal of Drug Issues 43:85–102.
Duncan, Greg J., K. M. Ziol-Guest, and A. Kalil. 2010. “Early-Childhood Poverty and Adult Attainment,
Behavior, and Health.” Child Development 81:306–25.
Economic Mobility: Research & Ideas on Strengthening Families, Communities & the Economy166
Edin, Kathryn, and Maria J. Kefalas. 2005. Promises I Can Keep: Why Poor Women Put Motherhood before
Marriage. Berkeley, CA: University of California Press.
Ellwood, David T., and Christopher Jencks. 2004. “The Spread of Single-Parent Families in the United States
Since 1960.” In The Future of the Family, edited by Daniel Patrick Moynihan, Timothy M. Smeeding, and
Lee Rainwater, 25–65. New York: Russell Sage Foundation.
Evans, Gary W., and Michelle A. Schamberg. 2009. “Childhood poverty, chronic stress, and adult working
memory.” The Proceedings of the National Academy of Sciences 106 (April 21): 6545–49.
Fernald, Anne, Virginia A. Marchman, and Adriana Weisleder. 2013. “SES Differences in Language Processing
Skill and Vocabulary Are Evident at 18 Months.” Developmental Science 16 (March): 234–48.
Fischer, Claude S. 1982. To Dwell among Friends: Personal Networks in Town and City. Chicago: University of
Chicago Press.
Fischer, Claude S., Michael Hout, Martín Sánchez Jankowski, Samuel R. Lucas, Ann Swidler, and Kim Vos.
1996. Inequality by Design: Cracking the Bell Curve Myth. Princeton, NJ: Princeton University Press.
Fox, Mary Ann, Brooke A. Connolly, and Thomas D. Snyder. 2005. “Youth Indicators 2005: Trends in the
Well-Being of American Youth.” Washington, D.C.: U.S. Department of Education, National Center for
Education Statistics, 50.
Fry, Richard, and Paul Taylor. 2012. “The Rise of Residential Segregation by Income,” Pew Social and
Demographic Trends August 1. www.pewsocialtrends.org/2012/08/01/the-rise-of-residential-segregation-by-income/.
Furstenberg, Frank F., Thomas D. Cook, Jacquelynne Eccles, Glen H. Elder Jr., and Arnold Sameroff. 1999.
Managing to Make It: Urban Families and Adolescent Success. Chicago: University of Chicago Press.
Goldin, Claudia, and L. F. Katz. 1999. “Human Capital and Social Capital: The Rise of Secondary Schooling in
America, 1910–1940.” Journal of Interdisciplinary History 29:683–723.
Goldin, Claudia, and Lawrence F. Katz. 2001. “Decreasing (and then Increasing) Inequality in America: A Tale
of Two Half-Centuries.” In The Causes and Consequences of Increasing Income Inequality, edited by Finis
Welch, 37–82. Chicago: University of Chicago Press.
Gormley, William T., Deborah Phillips, and Ted Gayer. 2008. “Preschool Programs Can Boost School
Readiness.” Science 320 (27 June): 1723–24.
Gormley, William T., Jr., Ted Gayer, Deborah Phillips, and Brittany Dawson. 2004. “The Effects of Oklahoma’s
Universal Pre-K Program on School Readiness: An Executive Summary.” Washington, D.C.: Georgetown
University: Center for Research on Children in the U.S.
Gormley, William T., Jr., Ted Gayer, Deborah Phillips, and Brittany Dawson. 2005. “The Effects of Universal
Pre-K on Cognitive Development.” Developmental Psychology 41 (November): 872–84.
Harrison, Tondi M. 2010. “Family Centered Pediatric Nursing Care: State of the Science.” Journal of Pediatric
Nursing 25 (October): 335–43.
A Country Divided: The Growing Opportunity Gap in America 167
Hart, Betty, and Todd R. Risley. 1995. Meaningful Difference in the Everyday Experience of Young American
Children. Baltimore, MD: Paul H. Brookes.
Heckman, James J. 2006. “Skill Formation and the Economics of Investing in Disadvantaged Children.”
Science 30 (June): 1900–02.
Heckman, James J. 2012. “An Effective Strategy for Promoting Social Mobility.” Boston Review. http://bostonreview.net/forum/promoting-social-mobility-james-heckman.
Heckman, James J., Seong Hyeok Moon, Rodrigo Pinto, Peter A. Savelyev, and Adam Yavitz. 2009. “The Rate
of Return to the HighScope Perry Preschool Program.” Journal of Public Economics 94:114–28. http://jenni.uchicago.edu/papers/Heckman_Moon_etal_2010_JPubEc_v94_n1.pdf.
Henderson, Anne T., and Nancy Berla, eds. 1994. A New Generation of Evidence: The Family is Critical to
Student Achievement. Washington, D.C.: National Committee for Citizens in Education, 1.
Hill, Nancy E., and Diana F. Tyson. 2009. “Parental Involvement in Middle School: A Meta-Analytic
Assessment of the Strategies That Promote Achievement.” Developmental Psychology 45 (May):
740–63.
Hochschild, Jennifer L. 1981. What’s Fair? American Beliefs about Distributive Justice. Cambridge, MA:
Harvard University Press.
Hoff, Erika, Brett Laursen, and Twila Tardif. 2002. “Socioeconomic Status and Parenting.” In Handbook of
Parenting 2nd ed. Vol. 2, edited by Marc H. Bornstein, 239. Mahwah, NJ: Lawrence Erlbaum Associates.
Holzer, Harry J., Diane Whitmore Schanzenbach, Greg J. Duncan, and Jens Ludwig. 2008. “The Economic
Costs of Childhood Poverty in the United States.” Journal of Children and Poverty 14:41–61.
Hsieh, Chang-Tai, Eric Hurst, Charles I. Jones, and Peter J. Klenow. 2013. “The Allocation of Talent and U.S.
Economic Growth.” NBER Working Paper 18693.
Humensky, Jennifer L. 2010. “Are Adolescents with High Socioeconomic Status More Likely to Engage in
Alcohol and Illicit Drug Use in Early Adulthood?” Substance Abuse Treatment, Prevention, and Policy
5:19.
“Huntington Bank Annual Backpack Index 2007–2013.” http://mms.businesswire.com/media/20130723005089/en/376266/1/2013HuntingtonBackpackIndexSupplyList.pdf?download=1.
Jargowsky, Paul A. 2013. “Concentration of Poverty in the New Millennium: Changes in Prevalence,
Composition, and Location of High Poverty Neighborhoods.” A Report by The Century Foundation and
Rutgers Center for Urban Research and Education. http://tcf.org/assets/downloads/Concentration_of_Poverty_in_the_New_Millennium.pdf.
Jeynes, William H. 2004. “A Meta-Analysis of the Efficacy of Different Types of Parental Involvement
Programs for Urban Students.” Urban Education 47 (July): 706–42.
Jeynes, William H. 2007. “The Relationship between Parental Involvement and Urban Secondary School
Student Academic Achievement: A Meta-Analysis.” Urban Education 42 (January): 82–110.
Economic Mobility: Research & Ideas on Strengthening Families, Communities & the Economy168
Jones, Robert P., Daniel Cox, and Juhem Navarro-Rivera. 2014. “Economic Insecurity, Rising Inequality, and
Doubts About The Future: Findings from the 2014 American Values Survey.” Washington, D.C.: Public
Religion Research Institute (PRRI). http://publicreligion.org/site/wp-content/uploads/2014/09/AVS-web.pdf.
Kahlenberg, Richard D. 2003. “Economic School Integration.” In The End of Desegregation? edited by
Stephen J. Caldas and Carl L. Bankston III, 153–55. Hauppauge, NY: Nova Science Publishers Inc.
Kahlenberg, Richard D. 2007. “Socioeconomic School Integration.” North Carolina Law Review 85:1545–94.
Kahlenberg, Richard D., and Halley Potter. 2012. Diverse Charter Schools: Can Racial and Socioeconomic
Integration Promote Better Outcomes for Students? New York: Poverty & Race Research Action Council,
and The Century Foundation.
Kemple, James J. 2008. “Career Academies: Long-Term Impacts on Work, Education, and Transitions to
Adulthood.” MDRC Report (June). www.mdrc.org/publication/career-academies-long-term-impacts-work-education-and-transitions-adulthood.
Knudsen, Eric I., James J. Heckman, Judy L. Cameron, and Jack P. Shonkoff. 2006. “Economic,
Neurobiological, and Behavioral Perspectives on Building America’s Future Workforce.” The Proceedings
of the National Academy of Sciences 103 (July): 10155–62.
Kohut, Andrew, and Michael Dimock. 2013. “Resilient American Values: Optimism in an Era of Growing
Inequality and Economic Difficulty.” Report for Council on Foreign Relations Press. www.cfr.org/united-states/resilient-american-values/p30203.
Kornrich, Sabino, and Frank Furstenberg. 2013. “Investing in Children: Changes in Parental Spending on
Children, 1972–2007.” Demography 50 (February): 1–23.
Lleras, Christy. 2008. “Do Skills and Behaviors in High School Matter? The Contribution of Noncognitive
Factors in Explaining Differences in Educational Attainment and Earnings.” Social Science Research
37:888–902.
Logan, John R., Elisabeta Minca, and Sinem Adar. 2012. “The Geography of Inequality: Why Separate Means
Unequal in American Public Schools.” Sociology of Education 85:287–301.
Lowell, Darcy I., Alice S. Carter, Leandra Godoy, Belinda Paulicin, and Margaret J. Briggs-Gowan. 2011. “A
Randomized Controlled Trial of Child FIRST: A Comprehensive Home-Based Intervention Translating
Research Into Early Childhood Practice.” Child Development 82 (January): 193–208.
Madar, Josiah. 2015. “Inclusionary Housing Policy in New York City: Assessing New Opportunities,
Constraints, and Trade-offs.” NYU Furman Center White Paper (March).
Marrero, Gustavo A., and Juan G. Rodriguez. 2013. “Inequality of opportunity and growth.” Journal of
Development Economics 104:107–22.
Marsden, Peter V. 1987. “Core Discussion Networks of Americans.” American Sociological Review 52:122–31.
Massey, Douglas S. 2007. Categorically Unequal: The American Stratification System. New York: Russell Sage
Foundation.
A Country Divided: The Growing Opportunity Gap in America 169

McCall, Leslie. 2013. The Undeserving Rich: American Beliefs about Inequality, Opportunity, and
Redistribution. Cambridge, UK: Cambridge University Press.
McLanahan, Sara. 2004. “Diverging Destinies: How Children Are Faring under the Second Demographic
Transition.” Demography 41 (4): 607–27.
McLanahan, Sara, and Christine Percheski. 2008. “Family Structure and the Reproduction of Inequalities.”
Annual Review of Sociology 34 (August): 257–76.
McLanahan, Sara, and Wade Jacobsen. 2015. “Diverging Destinies Revisited.” In Families in an Era of
Increasing Inequality: Diverging Destinies, edited by Paul R. Amato, Alan Booth, Susan M. McHale, and
Jennifer Van Hook. New York: Springer.
Meyers, Marcia K., Dan Rosenbaum, Christopher Ruhm and Jane Waldfogel. 2004. “Inequality in Early
Childhood Education and Care: What Do We Know?” In Social Inequality, edited by Kathryn M.
Neckerman. New York: Russell Sage Foundation.
Miksic, Mai. 2014. “Is Parent Involvement Really a Waste of Time? Recent Polemic versus the Research
Record.” Policy Briefings: IDEALAB. CUNY Institute for Education Policy. http://ciep.hunter.cuny.edu/is-parent-involvement-really-a-waste-of-time-recent-polemic-versus-the-research-record/.
Mortenson, Thomas G. 2012. “Family Income and Unequal Educational Opportunity.” Postsecondary
Education Opportunity 245 (November).
Mullainathan, Sendhil, and Eldar Shafir. 2013. Scarcity: Why Having Too Little Means So Much. New York:
Times Books, 156.
National Low Income Housing Coalition (NLIHC). 2014. “40 Years Ago: Montgomery County, Maryland
Pioneers Inclusionary Zoning.” http://nlihc.org/article/40-years-ago-montgomery-county-maryland-pioneers-inclusionary-zoning.
National Scientific Council on the Developing Child. 2004. “Young Children Develop in an Environment of
Relationships.” Center on the Developing Child Working Paper 1.
Newman, Katherine S., and Elisabeth S. Jacobs. 2010. Who Cares? Public Ambivalence and Government
Activism from the New Deal to the Second Golden Age. Princeton, NJ: Princeton University Press.
Obama, Barack. 2013. “Remarks by the President on Economic Mobility.” The Whitehouse. https://www.whitehouse.gov/the-press-office/2013/12/04/remarks-president-economic-mobility.
Okun, Arthur M. 1975. Equality and Efficiency: The Big Tradeoff. Washington, D.C.: The Brookings Institution.
Orfield, Gary, and Susan E. Eaton. 1996. Dismantling Desegregation. New York: The New Press.
Ortner, Sherry B. 2006. Anthropology and Social Theory: Culture, Power, and the Acting Subject. Durham,
NC: Duke University Press, 99.
Page, Benjamin I., and Lawrence R. Jacobs. 2009. Class War? What Americans Really Think about Economic
Inequality. Chicago: University of Chicago Press.
Palardy, Gregory J. 2013. “High School Socioeconomic Segregation and Student Attainment.” American
Educational Research Journal 50:714–54.
Economic Mobility: Research & Ideas on Strengthening Families, Communities & the Economy170

Patrick, Megan E., Patrick Wightman, Robert F. Schoeni, and John E. Schulenberg. 2012. “Socioeconomic
Status and Substance Use among Young Adults: A Comparison across Constructs and Drugs.” Journal of
Studies on Alcohol and Drugs 73:772–82.
Petev, Ivaylo D. 2013. “The Association of Social Class and Lifestyles: Persistence in American Sociability, 1974
to 2010.” American Sociological Review 78:633, 651.
“Policy Paper: 2010 to 2015 Government Policy: Support for Families.” 2014. Department for Communities
and Local Government. www.gov.uk/government/publications/2010-to-2015-government-policy-support-for-families/2010-to-2015-government-policy-support-for-families.
Putnam, Robert D. 2001. Bowling Alone: The Collapse and Revival of American Community. New York: Simon
& Schuster Paperbacks, 287–363.
Putnam, Robert D. 2015. Our Kids: The American Dream in Crisis. New York: Simon & Schuster.
Reardon, Sean F. 2011. “The Widening Academic Achievement Gap between the Rich and the Poor: New
Evidence and Possible Explanations.” In Whither Opportunity? Rising Inequality, Schools, and Children’s
Life Chances, edited by Greg J. Duncan and Richard M. Murnane. New York: Russell Sage Foundation.
Robinson, Keith, and Angel L. Harris. 2014. The Broken Compass: Parental Involvement with Children’s
Education. Cambridge: Harvard University Press.
Rumberger, Russell W., and Gregory J. Palardy. 2005. “Does Segregation Still Matter? The Impact of Student
Composition on Academic Achievement in High School.” The Teachers College Record 107 (September):
1999–2045.
Sarlin, Benjy. 2015. “Jeb Bush: Opportunity Gap is ‘Defining Issue of Our Time.’” MSNBC, Jan 23.
Scrivener, Susan, Michael J. Weiss, Alyssa Ratledge, Timothy Rudd, Colleen Sommo, and Hannah Fresques.
2015. “Doubling Graduation Rates: Three-Year Effects of CUNY’s Accelerated Study in Associate
Programs (ASAP) for Developmental Education Students.” MDRC Report. www.mdrc.org/publication/doubling-graduation-rates.
Shapiro, Doug, Afet Dundar, Xin Yuan, Autumn T. Harrell, and Phoebe Khasiala Wakhungu. 2014. Completing
College: A National View of Student Attainment Rates – Fall 2008 Cohort (Signature Report No.
8). Herndon, VA: National Student Clearinghouse Research Center. http://nscresearchcenter.org/wp-content/uploads/SignatureReport8.pdf.
Shoenberger, Nicole. 2012. “Young Men’s Contact with Criminal Justice System.” National Center for Family
& Marriage Research FP-12–01. www.bgsu.edu/content/dam/BGSU/college-of-arts-and-sciences/NCFMR/documents/FP/FP-12-01.pdf.
Shonkoff, Jack P., Andrew S. Garner, The Committee on Psychosocial Aspects of Child and Family Health,
Committee on Early Childhood, Adoption, and Dependent Care, and Section on Developmental and
Behavioral Pediatrics. 2012. “The Lifelong Effects of Early Childhood Adversity and Toxic Stress.”
Pediatrics 129 (January): e232–46.
A Country Divided: The Growing Opportunity Gap in America 171
Simons, Ronald L., Les B. Whitbeck, Janet N. Melby, and Chyi-In Wu. 1994. “Economic Pressure and Harsh
Parenting.” In Families in Troubled Times: Adapting to Change in Rural America, edited by Rand D.
Conger and Glen H. Elder, Jr., 207–22. New York: Aldine De Gruyter.
Smock, Pamela L., and Fiona Rose Greenland. 2010. “Diversity in Pathways to Parenthood: Patterns,
Implications, and Emerging Research Directions.” Journal of Marriage and Family 72 (2): 576–93.
Sykes, Bryan L., and Becky Pettit. 2014. “Mass Incarceration, Family Complexity, and the Reproduction of
Childhood Disadvantage.” The ANNALS of the American Academy of Political and Social Science 654
(July): 127–49.
Theokas, Christina, and Margot Bloch. 2006. “Out-of-School Time is Critical for Children: Who Participates in
Programs?” Research-to-Results Fact Sheet #2006–20. Washington, D.C.: Child Trends.
Tough, Paul. 2012. How Children Succeed: Grit, Curiosity, and the Hidden Power of Character. New York:
Houghton Mifflin Harcourt.
Turner, Margaret Austin, Austin Nichols, and Jennifer Comey. 2012. Benefits of Living in High-Opportunity
Neighborhoods: Insights from the Moving to Opportunity Demonstration. Washington, D.C.: Urban
Institute.
University of Minnesota, Minnesota Population Center. IPUMS, https://usa.ipums.org/usa/.
U.S. Department of Commerce, U.S. Census Bureau. American Community Survey (AMC). www.census.gov/programs-surveys/acs/data/data-via-ftp.html.
U.S. Department of Education, Institute of Education Sciences, and National Center for Education Statistics.
2001. High School and Beyond, 1980: A Longitudinal Survey of Students in the United States. Ann Arbor,
MI: Inter-university Consortium for Political and Social Research [distributor]. www.icpsr.umich.edu/icpsrweb/ICPSR/studies/7896/version/2.
U.S. Department of Education, National Center for Education Statistics. 1990. National Education Longitudinal
Study, 1988. Chicago, IL: National Opinion Research Center [producer], 1989. Ann Arbor, MI: Inter-
university Consortium for Political and Social Research [distributor]. www.icpsr.umich.edu/icpsrweb/ICPSR/studies/9389/version/1.
U.S. Department of Education, National Center for Education Statistics. 1992. National Longitudinal Study
of the Class of 1972. Chicago, IL: National Opinion Research Center [producer]. Ann Arbor, MI: Inter-
university Consortium for Political and Social Research [distributor], 1999. www.icpsr.umich.edu/icpsrweb/ICPSR/studies/8085/version/1.
U.S. Department of Education, National Center for Education Statistics. 2002. National Education
Longitudinal Study. Chicago, IL: National Opinion Research Center [producer]. Ann Arbor, MI: Inter-
university Consortium for Political and Social Research [distributor]. www.icpsr.umich.edu/icpsrweb/ICPSR/studies/4275.
U.S. Department of Health and Human Services, Centers for Disease Control. National Survey of Family
Growth. www.cdc.gov/nchs/nsfg.htm.
Economic Mobility: Research & Ideas on Strengthening Families, Communities & the Economy172
Van Ewijk, Reyn, and Peter Sleegers. 2010. “The Effect of Peer Socioeconomic Status on Student
Achievement: A Meta-Analysis.” Educational Research Review 5:134–50.
Van Voorhis, Frances L., Michelle F. Maier, Joyce L. Epstein, and Chrishana M. Lloyd with Therese Leung. 2013.
“The Impact of Family Involvement on the Education of Children Ages 3 to 8: A Focus on Literacy and
Math Achievement Outcomes and Socio-Emotional Skills.” MDRC Report. www.mdrc.org/sites/default/files/The_Impact_of_Family_Involvement_FR.pdf.
Waldfogel, Jane, and Elizabeth Washbrook. 2011. “Early Years Policy.” Child Development Research 2011:1–12.
Will-Burdick, J., J. Ludwig, S.W. Raudenbush, R.J. Sampson, L. Sanbonmatsu, and P. Sharkey. 2011.
“Converging Evidence for Neighborhood Effects on Children’s Test Scores: An Experimental, Quasi-
Experimental, and Observational Comparison.” In Whither Opportunity? Rising Inequality, Schools, and
Children’s Life Chances, edited by Greg J. Duncan and Richard J. Murnane, 255–76. New York: Russell
Sage Foundation.
Workforce Training and Education Coordinating Board. 2014. “2014 Workforce Training Results by Program.”
Olympia, WA. www.wtb.wa.gov/WorkforceTrainingResults.asp.
A Country Divided: The Growing Opportunity Gap in America 173