a cost/benefit analysis of -...
TRANSCRIPT

Cost benefit analysis of Savannah’s tourism sector
A COST/BENEFIT
ANALYSIS OF
SAVANNAH’S
TOURISM SECTOR SEPTEMBER 2017

Cost benefit analysis of Savannah’s tourism sector
2
Tourism Economics
Tourism Economics is an Oxford Economics company with a singular objective: combine an
understanding of tourism dynamics with rigorous economics to answer the most important
questions facing destinations, developers, and strategic planners. By combining quantitative
methods with industry knowledge, Tourism Economics designs custom market strategies,
destination recovery plans, tourism forecasting models, tourism policy analysis, and economic
impact studies.
With over four decades of experience of our principal consultants, it is our passion to work as
partners with our clients to achieve a destination’s full potential.
Oxford Economics is one of the world’s leading providers of economic analysis, forecasts and
consulting advice. Founded in 1981 as a joint venture with Oxford University’s business college,
Oxford Economics enjoys a reputation for high quality, quantitative analysis and evidence-based
advice. For this, its draws on its own staff of 150 highly-experienced professional economists; a
dedicated data analysis team; global modeling tools, and a range of partner institutions in Europe,
the US and in the United Nations Project Link. Oxford Economics has offices in London, Oxford,
Dubai, Philadelphia, and Belfast.
2017
All data shown in tables and charts are Oxford Economics’ own data/analysis, except where
otherwise stated and cited in footnotes.
All information in this report is copyright © Oxford Economics Ltd.
The modelling and results presented here are based on information provided by third parties, upon
which Oxford Economics has relied in producing its report and forecasts in good faith. Any
subsequent revision or update of those data will affect the assessments and projections shown.
To discuss the report further please contact:
Geoff Lacher [email protected]
Tourism Economics
303 W. Lancaster Ave, Suite 2E, Wayne, PA 19087
Tel: +1 610-995-9600

Cost benefit analysis of Savannah’s tourism sector
3
TABLE OF CONTENTS Table of contents ............................................................................................ 3
Executive Summary ....................................................................................... 4
Introduction ..................................................................................................... 6
1. Social impacts ............................................................................................ 7
1.1 Introduction ......................................................................................... 7
1.2 Resident attitudes ............................................................................... 7
1.3 Business owner attitudes .................................................................... 9
1.4 Well-being ......................................................................................... 10
1.5 Summary ........................................................................................... 11
2. Congestion impacts .................................................................................. 12
2.1 Introduction ....................................................................................... 12
2.2 Congestion cost analysis .................................................................. 12
2.3 Tourism related congestion analysis................................................. 13
3. Economic impacts .................................................................................... 15
3.1 introduction ........................................................................................ 15
3.2 Economic impact summary ............................................................... 15
4. Fiscal impacts .......................................................................................... 18
4.1 Introduction ....................................................................................... 18
4.2 Fiscal benefits ................................................................................... 18
4.3 Fiscal costs ....................................................................................... 19
5. Cost-benefit comparision and conclusion ................................................ 23
5.1 Cost-benefit comparision .................................................................. 23
5.2 Conclusion ........................................................................................ 24
Works Cited .................................................................................................. 25
Appendix 1: Additional Well-Being analysis ................................................. 26
Appendix 2: Economic and fiscal impact methodology ................................ 29
Appendix 3: Additional economic impact analysis ....................................... 31
Appendix 4: Additional fiscal analysis .......................................................... 34

Cost benefit analysis of Savannah’s tourism sector
4
EXECUTIVE SUMMARY Tourism Economics engaged with the City of Savannah to provide a
comprehensive economic impact and cost-benefit analysis for the
Savannah tourism sector. The analysis quantifies the economic impact of
tourism in detail, as well as the fiscal, economic, and social costs of
sustaining the tourism sector.
SOCIAL IMPACTS
Our analysis of local surveys suggests that residents are generally satisfied
with Savannah’s tourism industry and encourage its further development.
Traffic and congestion appear to be the main concern for residents.
Conversely, residents are proud that their city is known as a premier
destination and appreciate the shopping, dining, and cultural opportunities it
brings. Most of all they support the industry due to the perceived economic
benefits it provides.
Our analysis of the National Gallup-Sharecare Well-Being Index indicates
that the size of a local tourism industry does not significantly impact a
community’s well-being. In sum, we could find no evidence that the tourism
sector imposes a significant social cost on the City of Savannah.
CONGESTION IMPACTS
We found that the added cost of congestion (above what is to be expected
in a city of Savannah’s size) is equal to $22.6 million. However, this
additional cost could be attributable to factors such as Savannah’s urban
design. Further investigation found no discernible relationship between the
size of a community’s tourism sector and the per capita cost of congestion
on a national level, and therefore indicate that the cost of additional
congestion should not be attributed solely to the tourism sector and the
$22.6 million should be considered a very high-end estimate.
ECONOMIC IMPACTS
We consider income for residents to be the main economic benefit of
tourism. Our analysis indicates that $2.5 billion in tourism industry spending
generates $866 million in income when indirect and induced impacts are
considered.
FISCAL IMPACTS
Tourism supports a total of $98.7 million in government revenue for the City
of Savannah (Table 10). User fees are the greatest source of revenue,
generating $27.0 million dollars. Property taxes ($21.1 million), sales and
business taxes ($15.9 million), and selective taxes ($20.8 million) are other
key contributors.
$866m Local income generated by
tourism
$22.6m High-end estimate of
congestion costs due to
tourism
$98.7m Government revenue
generated for the City of
Savannah by tourism

Cost benefit analysis of Savannah’s tourism sector
5
In total, the fiscal expenses associated with the tourism sector equal $51.3
million. These are incurred in a combinations of recurring budget items
dedicated to support and promote tourism, police expenses, city services,
overhead, and other expenses.
COST-BENEFIT COMPARISION
Given that we could find no evidence that the tourism sector imposes a
significant social cost (or at least a cost significantly higher than the social
benefits) on the City of Savannah, we focus our analysis on fiscal and
economic costs and benefits.
We consider two types of costs and benefits. One for residents, and one for
the city government. For residents, we consider income generated by
tourism to be the benefit of tourism and congestion to be the cost. For the
city government, we consider the government revenue from taxes and user
fees to be the benefit and the expenses to be the cost.
Residents receive $866.4 million of income supported by tourism. They
suffer $22.6 million in lost fuel and time due to additional congestion in the
city. Residents therefore receive a net benefit of $843.7 million, or a benefit
of $5,740 per resident (Table 1). They receive $38.36 dollars of benefit for
every dollar of cost.
Table 1: Cost benefit analysis for residents
Income supported by tourism $866,358,000
Cost of congestion $22,585,000
Net benefit $843,773,000
Net benefit per resident $5,740
Benefit-to-cost ratio 38.36
Source: Tourism Economics
The City of Savannah receives $98.7 million of government revenue
supported by tourism, and the City of Savannah incurs $51.2 million of
expenses relating to tourism. The City of Savannah therefore receives a net
benefit of $47.5 million, or a benefit of $323 per resident (Table 2). For
every dollar spent supporting the tourism industry, the City of Savannah
gains $1.93 in revenue.
Table 2: Cost benefit analysis for the City of Savannah
Goverment revenue supported by tourism $98,747,000
City of Savannah expenses on tourism $51,328,000
Net benefit $47,419,000
Net benefit per resident $323
Benefit-to-cost ratio 1.92
Source: Tourism Economics
$844m Total net benefit for residents
$5,740 Net benefit per resident
$47.5m Total net benefit for the City
of Savannah
$1.93-to-$1 Benefit to cost ratio for the
City of Savannah
$51.3m City of Savannah expenses
associated with tourism

Cost benefit analysis of Savannah’s tourism sector
6
INTRODUCTION Tourism Economics (“we”) engaged with the City of Savannah to provide a
comprehensive economic impact and cost-benefit analysis for the
Savannah tourism1 sector. The analysis quantifies the economic impact of
tourism in detail, as well as the fiscal, economic, and social costs of
sustaining the tourism sector.
The fiscal costs of tourism measured include expenses dedicated for
tourism specific purposes, police costs associated with tourism, and a
category that combines city services, overhead and other expenses. Other
costs include congestion and the potential negative social impacts of
tourism. These costs are compared to the positive economic and fiscal
impacts of tourism.
The benefits of tourism are measured by both the income and city revenue
generated by tourism. This includes not only spending by visitors, but also
the capital investment required to develop and sustain the tourism sector.
The report is organized in five main sections
(1) The social impacts of tourism
(2) Congestion impacts
(3) Economic impact
(4) Fiscal impact
(5) Summary and conclusion
Three appendices give further details on social impacts, research methods,
and economic impacts.
1 Tourists are defined as individuals who travel 50 miles or more to the City of Savannah for leisure, business,
or personal reasons. This includes day and overnight trips.

Cost benefit analysis of Savannah’s tourism sector
7
1. SOCIAL IMPACTS
1.1 INTRODUCTION
To evaluate the social costs of tourism, we rely on three main data sources.
(1) A survey of Savannah residents and business owners performed by
John Salazar and James Duffy of the University of South Carolina
Beaufort
(2) The Tourism Management Plan Survey conducted by The
EXPERIENCE Institute
(3) The Gallup-Sharecare Well-Being Index: a national study examining
the psychical, economic, and social well-being of a community
1.2 RESIDENT ATTITUDES
1.2.1 University of South Carolina, Beaufort study
Salazar and Duffy randomly surveyed households in Savannah and
received a total of 407 responses to their 26-question survey. This survey
examined the following topics:
(1) Frequency of visitor engagement.
(2) Tourism’s contribution to the economy.
(3) Tourism management.
(4) Tourism infrastructure needs.
(5) How tourism impacts residents.
(6) Tourism industry program needs.
(7) Impacts of the tourism industry on life and the community. (Salazar
& Duffy, p2)
Overall, Salazar and Duffy find that the residents are very supportive of the
tourism industry (see Table 3). Residents believe that tourism development
should continue in the city, that tourism is a positive economic force for the
city, and that the benefits of tourism outweigh the costs.
Table 3: Savannah residents’ responses to key questions
Tourism development questions Agreement
Tourism industry is important to Savannah’s future 90%
Proud that the city has become such a high profile destination 84%
Savannah’s Historic Landmark District is positive and should be actively encouraged 73%
Economic questions
Local tourism community contributes to the city’s economic health 82%
Tourism related tax revenues benefit residents 74%
Cost benefit questions
The positive benefits of tourism outweigh the negative impacts 75%
The impact of tourism in Savannah is positive and should actively be encouraged 73%
Source: University of South Carolina Beaufort
75% Residents’ agreement that
the benefits of tourism
outweigh the costs
Cost benefit analysis of Savannah’s tourism sector
8
Residents also expressed a high level of agreement (3.9 on a scale of 1 to
5) that tourism contributes to “better shopping, dining and cultural
opportunities for Savannah’s residents” (p6).
The authors do report concerns about local congestion, stating:
“Respondents’ perspectives on the future of the City of Savannah primarily
focus on concerns about growth of the number of visitors in an area which
already feels (by residents) to be too congested on surface streets...
Parking, buses, and traffic which poses real and perceived inconvenience to
the everyday lives of Savannah residents, and responses seems to prove
that people believe that problems on these fronts will only get worse unless
significant infrastructure changes are made, or alternative solutions are
posed.” (Salazar & Duffy p5).
Further analysis of congestion issues can be found in section 2.
Concerns about crime are addressed in open-ended questions, however,
these are typically phrased as a concern about local crime negatively
impacting the tourism sector, rather than crimes by tourists impacting
residents.
The authors note that residents of the downtown neighbourhoods generally
have the same opinions as residents of outlying neighbourhoods, they did
believe that “noise from afterhours commercial activities” is a greater
concern, but they also believe that tourism creates more shopping, dining,
and cultural opportunities. As would be expected, it appears that those living
in the area most visited by tourists feel both the costs and benefits of
tourism more intensely.
As a whole, the results of their survey led Salazar and Duffy to believe that
residents are appreciative of the tourism sector and in favor of its future
development. They conclude:
In the end, the residential community at large seems to really love the City of
Savannah and the amenities and attractions that they can experience
regularly, and that tourists come to see on their travels. The benefits of
tourism are sometimes lost in the day-to-day struggles with parking and
accessibility, but for the most part, might be described by residents as a
“necessary evil” in order to reap the rewards of a thriving tourism industry.
(p11)
While concerns about congestion, parking, and noise do arise in the survey,
overall positive sentiment and hope for the future dominate the survey
results.

Cost benefit analysis of Savannah’s tourism sector
9
1.2.2 Tourism Management Plan Survey
We also performed an independent analysis on a survey conducted by The
EXPERIENCE Institute on the City of Savannah’s Tourism Management
Plan. The survey received 928 total responses from the Savannah area
residents, and we analyzed 390 total open-ended responses left by
respondents (open-ended questions were optional). In these open-ended
responses, we identified 229 complaints/concerns with the tourism industry
and categorized these complaints/concerns by key theme (Table 4).
Table 4: Complaints identified in Tourism Management Plan Survey
Theme of complaint/concern Responses
Too many hotels 45 19.7%
Too many STVRs 31 13.5%
Crowding out locals 29 12.7%
Congestion 28 12.2%
Loss of authenticity 25 10.9%
Too few parking spots 25 10.9%
High cost of living 16 7.0%
Too much noise and inebriated tourists 15 6.6%
Too many trolleys, carriages, and/or tour busses 8 3.5%
Low paying jobs 7 3.1%
Sources: Tourism Economics; City of Savannah
Percent of total complaints
We found that the primary concern of residents is the real or perceived
imbalance between hotels/STVR and residential housing stock.
1.3 BUSINESS OWNER ATTITUDES
Salazar and Duffy also surveyed upper management tourism professionals
in Savannah. They received a total of 173 responses to their 26-question
survey. Perhaps unsurprisingly, the business owners believe strongly in
tourism’s positive impact on Savannah, and disagree that tourism has
reached its capacity in the city (Table 5).
Table 5: Savannah tourism professionals’ responses to key questions
The tourism professionals also agree with citizens that congestion and
traffic are likely the largest issue facing the tourism/resident relationships in
the city. Salazar and Duffy summarize: “It is the basic infrastructure issues
of parking and traffic, with and without pedestrians, that are most often
Cost benefit questions Agreement
The local tourism community contributes to the economic health of our community 96%
Tourism creates better shopping, dining, and cultural opportunities for residents 90%
Overall, the positive benefits of tourism outweigh the negative impacts of tourism 90%
Tourism development questions
It appears that tourism has reached its capacity in Savannah’s Historic Landmark District 21%
I believe that Savannah is growing too rapidly due to tourism 12%
It appears that tourism has reached its capacity in the metro Savannah area 8%
Source: University of South Carolina Beaufort

Cost benefit analysis of Savannah’s tourism sector
10
perceived by the survey’s respondents, generating the negative feedback”
(p14).
1.4 WELL-BEING
The Gallup-Sharecare Well-Being Index describes itself as:
“The world’s largest data set on well-being, with over 2.5 million surveys
fielded to date. The Well-Being Index provides unmatched, in-depth
insight into the well-being of populations, is frequently cited by national
media, and has been leveraged by Nobel laureates and academicians
for peer-review and scholarly articles. Gallup interviews 500 people
every day; the result is a sample that projects to an estimated 95% of
U.S. adults.” (Gallup-Sharecare)
This survey examines well-being in 189 communities across the US in five
key areas: purpose, social, financial, community, and physical. These
separate inputs are combined into a well-being score.
Savannah scored a 60.6, ranking 162 out of the 189 communities, well
below the average Well-Being score for a community of 62.0 and below
other neighbouring cities (Table 6).
Table 6: Well-Being Score data in Savannah, nearby coastal
communities, and national averages
Source: Gallup-Sharecare Well-Being Index
However, the local tourism sector may or may not be a factor in Savannah’s
low Well-Being score. Many cities with very large tourism sectors such as
Las Vegas and Orlando scored relatively well in the survey (61.7 and 62.3,
respectively). To determine the importance of tourism in impacting
community Well-Being, we calculated the percentage of jobs in the leisure
and hospitality sector for all of the communities (using BEA data) and then
examined the relationship between the size of the local tourism sector and
Well-Being Score.
Community Score
Hilton Head Island 64.9
Charleston 62.9
Jacksonville 62.2
Myrtle Beach 62.1
National average 62.0
National median 61.8
Savannah 60.6

Cost benefit analysis of Savannah’s tourism sector
11
Statistical analysis demonstrated that while there is a slight positive
correlation between the size of a community’s tourism sector and its Well-
Being score (Fig 1), this relationship has a very low R2 score2 of 0.02 and is
not statistically significant (p>0.05). These results indicate that the size of
a local tourism sector does not have a negative impact on a
community’s well-being. See Appendix 1 for additional analysis on each
of the five components of the Well-Being Index.
Fig. 1: Well-Being Score and size of local leisure and hospitality sector
A further examination of the data revealed that of the 11 communities that
have a higher percentage of employment in the leisure and hospitality
sector, only one, Gulfport, Mississippi, had a lower Well-Being Score. This
indicates that Savannah’s combination of a large tourism sector and poor
Well-Being Score is relatively unique.
In sum, while Savannah did score poorly on the Well-Being Index, there is
no evidence to suggest that the tourism industry is a root cause of this poor
performance.
1.5 SUMMARY
We could find no evidence that the tourism sector imposes a significant
social cost or benefit on the city of Savannah. Resident concerns typically
revolve around congestion, which is covered in Section 2, and residents’
main interests in tourism relate to perceived economic benefits, which are
examined in Section 3.
2 An R2 score measure the degree to which two variables are correlated, the number ranges from 0 to 1 with
0 equating to no correlation and 1 equating to perfect correlation; an R2 of 0.02 indicates that the two
variables are 2% correlated, a very weak correlation.

Cost benefit analysis of Savannah’s tourism sector
12
2. CONGESTION IMPACTS
2.1 INTRODUCTION
To examine the cost of congestion in the city of Savannah, we use Texas
A&M’s Urban Mobility Scorecard. This study analyzes “traffic speed data
collected by INRIX on 1.3 million miles of urban streets and highways, along
with highway performance data from the Federal Highway Administration”
(Texas A&M Transportation Institute website). This data is analyzed to
calculate the amount of congestion in 471 urban areas. Additional data in
the report includes the number of commuters in each community, the total
annual hours of delay, and the total cost of congestion. We use 2015 data
as this is the latest available.
The report gives a variety of key metrics on congestion in Chatham County
including excess fuels used, hours of delay, and total costs of congestions
(including both wasted fuel and commuters’ time) (Table 7).
Table 7: Key congestion metrics in Chatham County
Population 276,000
Excess fuel used 3,528,000
Hours of delay 8,013,000
Congestion costs $178,620,000
Cost per citizen $647
Sources: Urban Mobility Scorecard;
US Census Bureau; Tourism Economics
2.2 CONGESTION COST ANALYSIS
While these findings demonstrate that $179 million dollars of fuel and time is
wasted in Chatham County, we should account for the fact that all
communities have some level of congestion and compare Chatham
County’s figure to a ‘normal’ amount of congestion.
To evaluate Savannah’s level of congestion, we extracted data on the 144
communities in in the Southeast. Analysis of this data demonstrated a clear
relationship between the local population size and the congestion cost per
citizen. For example, congestion costs in New Orleans, LA (pop. 975,000) is
$1,040 per capita, while in Hinesville, GA (pop. 61,000), the cost is only
$171 per capita.
After evaluating several relationship types, we determined that the natural
log of population was the best predictor of per capita commuting costs
(R2=0.54, p<0.001) (Fig. 2).

Cost benefit analysis of Savannah’s tourism sector
13
Fig. 2: The relationship between population and the per capita cost of congestion
This analysis demonstrates that Chatham County has a greater per capita
cost of commuting than would be expected of a city its size.
To quantify the cost of this excess congestion on the City of Savannah (as
opposed to the entire county), we compared its $647 per capita cost of
congestion to our line of best fit (i.e. the black line on Fig. 2). This line
represents what a city of Savannah’s size should expect based on a
regression analysis and indicated that Savannah should expect a per capita
cost of congestion of $494. We consider this the added cost of congestion.
We then multiply the difference by the population of Savannah to determine
the total cost of the additional congestion, $22.6 million (Table 8).
Table 8: The cost of additional congestion
Per capita cost in Savannah $647
Expected per capita cost - $494
Added cost $154
Population of Savannah X 147,000
Total added costSources: Urban Mobility Scorecard;
US Census Bureau; Tourism Economics
$22,585,000
2.3 TOURISM RELATED CONGESTION ANALYSIS
These results demonstrate that the added cost of congestion (above what is
to be expected) is equal to $22.6 million. However, this additional cost could
be attributable to any number of factors.
Therefore, we sought to analyze the relationship between the size of a city’s
tourism sector and congestion. We found 54 communities in which the BEA
and Urban Mobility Scorecard used the same geography and compared the
percentage of jobs in the leisure and hospitality sector to the congestion
Chatham County
$0
$200
$400
$600
$800
$1,000
$1,200
0 200 400 600 800 1,000 1,200 1,400 1,600 1,800
Per capita cost
Population, 000'sSources: Urban Mobility Scorecard;US Census Bureau; Tourism Economics
$22.6m Cost of additional congestion
in Savanah

Cost benefit analysis of Savannah’s tourism sector
14
cost per capita. While there is a slight positive correlation, the result shows
almost no predictive power (R2=0.01) and is not statistically significant. This
analysis indicates that the size of the local tourism sector does not impact a
city’s congestion (Fig. 3).
Fig. 3: The relationship between share of jobs in the leisure and hospitality sector and per
capita congestion costs
As an additional test, we examined whether the leisure and hospitality
sector impacted congestion while controlling for population size. A
multivariate regression analysis demonstrates that even after controlling for
population, the size of the tourism sector has no impact on congestion
(Table 9). The share of jobs in the leisure and hospitality sector is not a
statistically significant predictor and has essentially no predictive power on
per capita congestion costs (PR2=0.01; p>0.1).
Table 9: Multivariate regression analysis results
Dependent variable = Per capita congestion cost
Coef. Std. Err. p Partial correlation 2̂
L&H share 987 1283 0.45 0.01
ln(population) 136 35 0.00 0.23
Constant -351 246 0.16 --
Source: Tourism Economics; BEA; Urban Mobility Scorecard; US Census Bureau
Given the lack of any discernible relationship between the size of a
community’s tourism sector and the per capita cost of congestion on a
national level, we should consider the $22.6 million dollars of additional
cost to be a very high-end estimate. Our analysis indicates that
Savannah’s congestion problem is not related to the large local tourism
sector.
Chatham County
$0
$200
$400
$600
$800
$1,000
$1,200
6% 8% 10% 12% 14% 16%
Per capita cost
Share of jobs in the leisure and hospitality industrySources: Urban Mobility Scorecard;US Census Bureau; Tourism Economics
1% Correlation between per
capita congestion costs and
the size of a community’s
tourism sector; a statistically
insignificant amount

Cost benefit analysis of Savannah’s tourism sector
15
3. ECONOMIC IMPACTS
3.1 INTRODUCTION
Tourism is the fifth-largest private employer in the State of Georgia and
supported $16.6 billion of in-state wages (Tourism Economics, 2016).
Residents of Savannah benefit from the numerous jobs needed to support
the industry. To measure these impacts, we performed an economic impact
analysis on Savannah’s tourism sector (methodology detailed in Appendix
2). This analysis uses a combination of survey data, private sector data on
hotels and air traffic, government employment and tax data, and an
economic model of Savannah’s economy to measure not only the impact of
tourism spending but also the downstream supply chain and income effects.
3.2 ECONOMIC IMPACT SUMMARY
Tourism has a substantial economic impact on the City of Savannah (this
includes the Savannah Airport but not Tybee Island). Our analysis indicates
that in 2016, $2.5 billion in tourism industry spending occured in the city,
including $2.3 billion in visitor spending and $0.2 billion in capital
expenditures (i.e. new development and major renovations).
This spending ultimately generates $3.4 billion in total business sales, $0.9
billion in income, 27,586 total jobs (Table 10 - additional details in Appendix
3).
Table 10:The economic impact of Savannah’s tourism sector, 2016
(dollar figures in millions)
Total tourism demand $2,464
Visitor spending $2,254
Capital expenditures $210
Total business sales $3,357
Direct business sales $2,464
Indirect and induced sales $893
Total income* $866
Direct income $583
Indirect and induced income $284
Total jobs* 27,586
Direct jobs 20,561
Indirect and induced jobs 7,025Source: Tourism Economics
Impacts on Savannah
Spending in Savannah
*Jobs and income refer to jobs and income
generated in Savannah. A portion of these jobs are
held by individuals that are not residents of the City
of Savannah.
$2.5b Total tourism demand in
Savannah, 2016
$866m Total tourism supported
income in Savannah, 2016

Cost benefit analysis of Savannah’s tourism sector
16
The food and beverage sector is the chief beneficiary of the tourism industry
spending, receiving $635 million in total business sales. Tourism spending
also supported $920 million in industries not typically associated with
tourism, predominately through capital investment and induced/indirect
impacts (Fig. 4).
Fig. 4: Total tourism supported business sales by sector (millions),
2016 (see appendix 3 for further details)
$920
$635
$571
$554
$411
$180
Other
Food & beverage
Retail trade
Transportation
Lodging
Recreation and entertainment
$0 $200 $400 $600 $800 $1,000
Source: Tourism Economics Dollars, millions
Cost benefit analysis of Savannah’s tourism sector
17
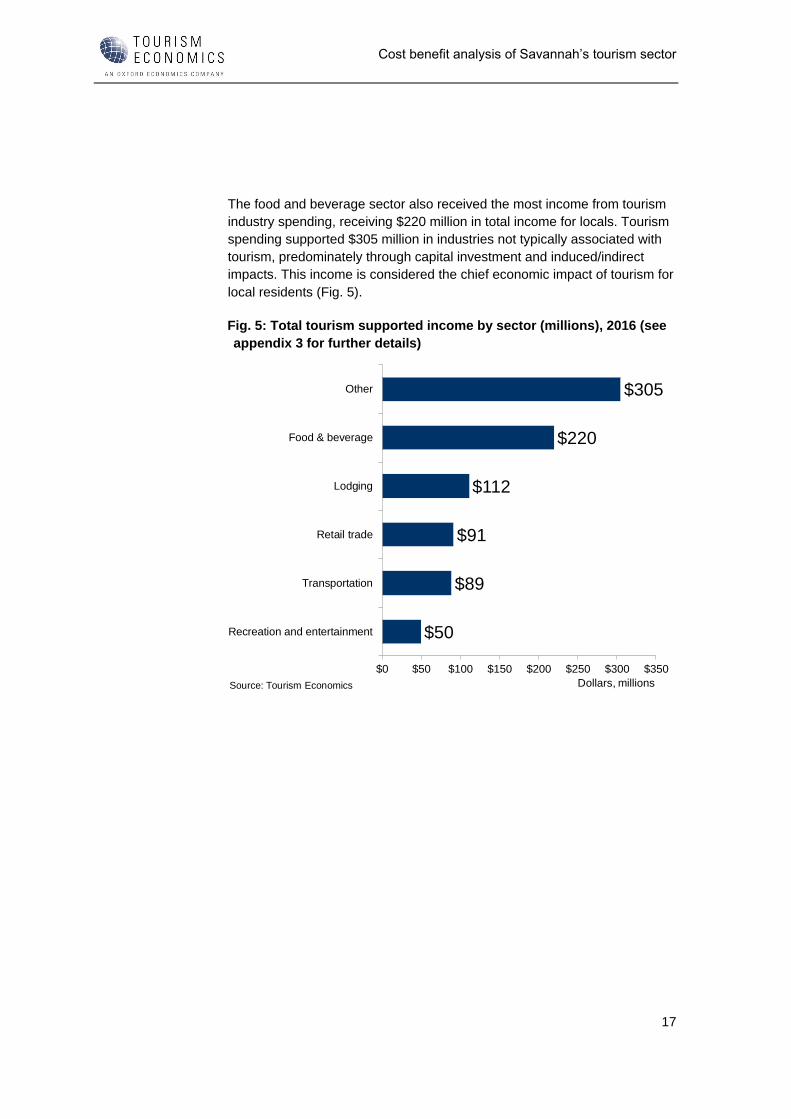
The food and beverage sector also received the most income from tourism
industry spending, receiving $220 million in total income for locals. Tourism
spending supported $305 million in industries not typically associated with
tourism, predominately through capital investment and induced/indirect
impacts. This income is considered the chief economic impact of tourism for
local residents (Fig. 5).
Fig. 5: Total tourism supported income by sector (millions), 2016 (see
appendix 3 for further details)
$305
$220
$112
$91
$89
$50
Other
Food & beverage
Lodging
Retail trade
Transportation
Recreation and entertainment
$0 $50 $100 $150 $200 $250 $300 $350
Source: Tourism Economics Dollars, millions

Cost benefit analysis of Savannah’s tourism sector
18
4. FISCAL IMPACTS
4.1 INTRODUCTION
To measure the positive impacts of tourism on the City of Savannah’s
finances, we use the economic model discussed in the previous section.
To measure the negative impacts of tourism on the City of Savannah’s
finances, we examined the City’s Comprehensive Annual Financial Report
(CAFR), the City’s 2017 budget (using projected 2016 figures), and other
select documents provided by the City of Savannah and Visit Savannah
(methodology detailed in Appendix 2). Our analysis here includes enterprise
funds which are largely self-sustaining. Tourists generate additional user
fees which fund the enterprise funds, but a share of the expenses of the
programs under the enterprise funds are also attributed to tourists. We
provide additional analysis that excludes enterprise funds in Appendix 4.
4.2 FISCAL BENEFITS
Tourism has a substantial fiscal impact on all levels of government. Our
analysis indicates that tourism supports $423.6 million dollars in total
government revenue (Table 11) in 2016 (we use the term ”government
revenue” here instead of “taxes” as this figure includes service fees such as
water and sewage) .
Table 11: Government revenue generated (millions) by tourism in the
city of Savannah for different levels of government, 2016
Government Tax revenue
Federal $202.2
State $80.0
County $42.7
City $98.7
Total $423.6
Sources: IMPLAN; Tourism Economics

Cost benefit analysis of Savannah’s tourism sector
19
Tourism supports a total of $98.7 million in government revenue for the City
of Savannah (Table 12). User fees are the greatest source of government
revenue, generating $27.0 million dollars. Property taxes ($21.1 million),
sales and business taxes ($15.9 million), and selective taxes ($20.8 million)
are other key contributors.
Table 12: Government revenue generated for the City of Savannah by
the tourism industry, 2016
Tax Direct Indirect/induced Total
Property taxes $15.4 $5.7 $21.1
Sales and business taxes $12.2 $3.7 $15.9
Selective taxes* $20.7 $0.1 $20.8
User fees** $2.6 $24.4 $27.0
Other $10.0 $3.9 $14.0
Total $60.9 $37.9 $98.7
Sources: IMPLAN; Tourism Economics
*includes hotel and auto rental tax
**includes items such as water, sewage, parking, facility rental, etc.
4.3 FISCAL COSTS
We examined three different types of fiscal costs: expenses dedicated for
tourism specific purposes, police costs associated with tourism, and a
category that combines city services, overhead and other expenses.
4.3.1 Tourism funds
We examined the City of Savannah’s 2017 adopted budget (link) to
determine recurring expenses dedicated entirely to tourism. In total, we
found four items with a total of $10.0 million in projected expenses for 2016
(Table 13). Note that in some items we list the total expenditure of a
department or expense type, while other specific line items are broken out
as the total includes some non-tourism spending (for instance the
hotel/motel tax fund also contributes $9.6 million to the City of Savannah’s
general revenue fund).
Table 13: Expenses dedicated entirely to tourism purposes, 2016
Contribution to Visit Savannah $6,416,025
Total expenditures $1,249,662
Tourism and Promotion $2,232,843
Total expenditures $145,224
Total $10,043,754
Sources: Savannah 2017 budget; Tourism Economics
River Street Hospitality Center
Hotel/motel tax
Tourism Management & Ambassadorship
General Fund Interdepartmental
$98.7m Total tourism supported
government revenue for the
City of Savannah in 2016

Cost benefit analysis of Savannah’s tourism sector
20
4.3.2 Police expenses
We examined the police department independently as 1) it is the second
largest individual department in the city, and 2) the department possess
data that allows us to estimate the percent of its effort devoted to tourists.
The Savannah-Chatham Metropolitan Police Department (SCMPD)
provided a dataset of arrest and citations from August 2016 to July 2017
that included the offenses committed and the home zip code of the offender.
We examined the data and found that 89.6% of incidents involved Chatham
County residents (Table 14), 4.3% involved residents of a nearby county
(too close to be considered tourists), and 6.2% of arrests involved
individuals from far enough away to be considered tourists (i.e. the county
seat was more than 50 miles from Savannah).
Table 14: Police arrests and citations by origin of offender.
Incidents Percent of total
Chatham residents 6,451 89.6%
Residents of nearby counties 307 4.3%
Residents of "tourist" counties 445 6.2%
Total 7,203 100.0%
Sources: Tourism Economics; SCMPD
A closer examination of the arrests of “tourists” (Table 15) indicates that
many are probably not tourists as we would typically define them. “Theft by
shoplifting” and “Hold for other agency” are more likely to involve career
criminals than leisure travellers who perhaps had too much to drink. This
indicates that 6.2% might be a high-end estimate of the SCMPD’s
involvement in tourism.
Table 15: Police codes most often cited in “tourist” incidents
Code Incidents
Theft by shoplifting 47
Hold for other agency 38
DUI less safe alcohol 32
Possession marijuana 31
Disorderly conduct 26
Escort without a license 24
Obstruction of an offficer 15
Possession of controlled substance 15
Criminal trespassing 14
Battery 10
Public drunkenness 10
Simple battery 9
DUI alcohol .08 grams or more 8
Sources: Tourism Economics; SCMPD
The SCMPD’s projected budget in 2016 was $68.8 million, therefore we
estimate that $4.3 million should be considered expenses on tourism (Table
16), though as noted above, this should be considered a high-end estimate.

Cost benefit analysis of Savannah’s tourism sector
21
Table 16: Tourism’s share of the police budget (dollar amounts in
millions)
Police budget $68.8
Tourist's share of incidents x 6.2%
Tourism share of police expenses $4.3
Sources: Tourism Economics; SCMPD
4.3.3 Services, overhead and other expenses
Aside from expenses directly associated with tourism, and SCMPD
expenses related to tourism, we also sought to assign a percentage of other
City of Savannah’s expenses and overhead costs to tourism. These events
range in their involvement with tourism (e.g. expenses on the St. Patricks
Day Parade might be highly related to tourism, and expenses on Senior
Services might be not at all related to tourism), however assigning a
percentage to each City of Savannah expense is impossible due to lack of
any appropriate data or metric so a universal ratio is applied.
In calculating the total amount of services, overhead and other expenses
attributable to tourism, we use the total expenditures line projected for 2016
from the 2017 adopted budget (which has already removed inter-
department transfers). From this number, we subtract the tourism funds and
the police funds that have already been accounted for, and refer to the
remaining expenses, $242.6 million, as services, overhead, and other
expenses in 2016 (Table 17). This category covers a range of items; the
majority of these expenses are related to public works departments such as
the Public Works and Water Resources Bureau and the Sanitation Bureau.
These bureaus are largely funded by user fees (and thus have a much
smaller impact on the city’s net fiscal position than their expenses would
indicate). However, since user fees are included as a fiscal benefit (in
section 4.2), they are also included here as a cost.
Other costs include general services such as the Fire and Emergency
Services Bureau and the Community and Economic Development Bureau
and overhead costs like General Administration. Departments such as these
may have little direct involvement in the tourism industry, but tourism places
additional strain on their services and should therefore be held accountable
for a portion of the spending.
We assign tourism a share of these expenses in proportion to the relative
size of tourism’s contribution to the economy. Based on data provided by
the BEA and the Census Bureau, we estimate that there are 134,661 total
jobs in the City of Savannah (this includes seasonal, part-time, self-
employed, and temporary positions), and given our prior estimate of 20,561
direct tourism jobs (see Table 10), we calculate that tourism directly
represents approximately 15.3% of Savannah’s economy. Therefor we
assign $37.0 million of services, overhead and other expenses to tourism.
$4.3m Expenses by the SCMPD
attributable to tourism

Cost benefit analysis of Savannah’s tourism sector
22
Table 17: Tourism’s share of services, overhead and other expenses,
2016
Total expenditures $321.4
Tourism funds - $10.0
Police funds - $68.8
Services, overhead, and other expenses $242.5
Total Savannah employment 134,661
Direct tourism employment ÷ 20,561
Tourism's share of economy 15.3%
Services, overhead, and other expenses $242.5
Tourism's share of economy x 15.3%
Tourism's share of expenses $37.0
Sources: Tourism Economics; City of Savannah; BEA; Census Bureau
City of Savannah expenses
Tourism's share of services, overhead, and other expenses
Tourism's share of Savannah economy
4.3.4 Total expenses
In total, the City of Savannah’s fiscal expenses related to tourism sum to
$51.3 million in 2016 (Table 18).
Table 18: Total City of Savannah fiscal expenses associated with
tourism (millions), 2016
Tourism dedicated expenses $10.0
Police expenses $4.3
Overhead and other expenses $37.0
Total $51.3
Source: Tourism Economics
$51.3m Total fiscal expenses on
tourism by the city of
Savannah

Cost benefit analysis of Savannah’s tourism sector
23
5. COST-BENEFIT COMPARISION
AND CONCLUSION
5.1 COST-BENEFIT COMPARISION
We consider two types of costs and benefits. One for residents, and one for
the City of Savannah. For residents, we consider income generated by
tourism (Section 3.2) to be the benefit of tourism and congestion (Section
2.2) to be the cost. For the City of Savannah, we consider the tax revenue
(Section 4.2) to be the benefit and the expenses (Section 4.3) to be the
cost.
Residents receive $866.4 million of income supported by tourism. They
suffer $22.6 million in lost fuel and time due to additional congestion in the
city (though this could be attributed to a number of factors besides tourism,
we use this estimate as a high-end estimate of the costs). Residents
therefore receive a net benefit of $843.7 million, or a benefit of $5,740 per
resident (Table 19). They receive $38.36 dollars of benefit for every dollar of
cost.
Table 19: Cost benefit analysis for residents
Income supported by tourism $866,358,000
Cost of congestion $22,585,000
Net benefit $843,773,000
Net benefit per resident $5,740
Benefit-to-cost ratio 38.36
Source: Tourism Economics
The City of Savannah receives $98.7 million of revenue supported by
tourism, and the City of Savannah spends $51.3 million on promoting and
supporting tourism. The City of Savannah therefore receives a net benefit of
$47.5 million, or a benefit of $323 per resident (Table 20). For every dollar
spent supporting the tourism industry, the City of Savannah gains $1.93 in
revenue.
Table 20: Cost benefit analysis for the City of Savannah
Goverment revenue supported by tourism $98,747,000
City of Savannah expenses on tourism $51,328,000
Net benefit $47,419,000
Net benefit per resident $323
Benefit-to-cost ratio 1.92
Source: Tourism Economics
$844m Total net benefit for residents
$47.5m Total net benefit for city
government
$5,740 Net benefit per resident
$1.93-to-$1 Benefit to cost ratio for the
City of Savannah

Cost benefit analysis of Savannah’s tourism sector
24
5.2 CONCLUSION
While various problems associated with the tourism industry may bother
residents, our findings indicate that tourism is a substantial positive force in
the financial health of both city residents and the city government.
It appears that residents have, by and large, reached a similar conclusion,
as Salazar and Duffy state in their report; “The benefits of tourism are
sometimes lost in the day-to-day struggles with parking and accessibility,
but for the most part, might be described by residents as a ‘necessary evil’
in order to reap the rewards of a thriving tourism industry” (p11).
We believe that continued funding of departments, grants, and programs
that support the tourism industry will ensure that the Citizens and
government of Savannah continue to reap these rewards in the future.

Cost benefit analysis of Savannah’s tourism sector
25
WORKS CITED City of Savannah. (2017). 2017 Adopted Budget & Five-Year Capital
Improvement Program. Available at
http://www.savannahga.gov/DocumentCenter/View/9302
Salazar, J., & Duffy, J. (2015). Savannah Tourism Sentiment Survey
Summary: Resident and Tourism Professionals.
Sharecare Inc. (2017). Gallup-Sharecare Well-Being Index. Retrieved
September 15, 2017, from http://www.well-beingindex.com/
Texas A&M Transportation Institute. (2015). 2015 Urban Mobility Scorecard.
Retrieved September 15, 2017, from https://mobility.tamu.edu/ums/
The EXPERIENCE Institute. (2017). Survey Data_condensed [Xls].
Cost benefit analysis of Savannah’s tourism sector
26
APPENDIX 1: ADDITIONAL WELL-
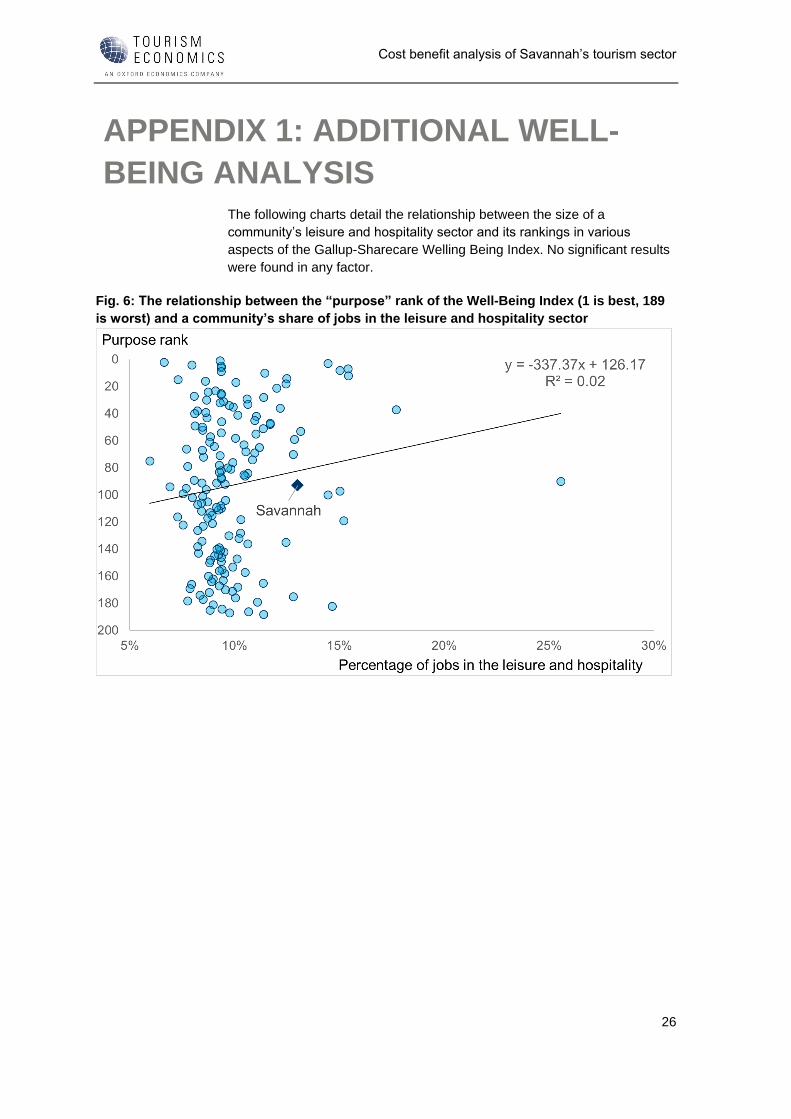
BEING ANALYSIS The following charts detail the relationship between the size of a
community’s leisure and hospitality sector and its rankings in various
aspects of the Gallup-Sharecare Welling Being Index. No significant results
were found in any factor.
Fig. 6: The relationship between the “purpose” rank of the Well-Being Index (1 is best, 189
is worst) and a community’s share of jobs in the leisure and hospitality sector

Cost benefit analysis of Savannah’s tourism sector
27
Fig. 7: The relationship between the “social” rank of the Well-Being Index (1 is best, 189 is
worst) and a community’s share of jobs in the leisure and hospitality sector
Fig. 8: The relationship between the “financial” rank of the Well-Being Index (1 is best, 189
is worst) and a community’s share of jobs in the leisure and hospitality sector

Cost benefit analysis of Savannah’s tourism sector
28
Fig. 9: The relationship between the “community” rank of the Well-Being Index (1 is best,
189 is worst) and a community’s share of jobs in the leisure and hospitality sector
Fig. 10: The relationship between the “purpose” rank of the Well-Being Index (1 is best, 189
is worst) and a community’s share of jobs in the leisure and hospitality sector

Cost benefit analysis of Savannah’s tourism sector
29
APPENDIX 2: ECONOMIC AND
FISCAL IMPACT METHODOLOGY
ECONOMIC IMPACT METHODOLOGY
We began our calculations by determining total visitor spending and capital
investment related to tourism in Savannah. For this, we utilized a variety of
data including:
• Visitor volume and expenditures by category (lodging, retail, public transportation, automobile transportation, food service, entertainment/recreation, travel arrangement) from Longwoods International, DK Shifflet, and the US Travel Industry;
• BEA and BLS data on employment by industry;
• BEA and BLS data on wages by industry;
• Lodging revenue and average daily rates (Smith Travel Research) – state and county detail;
• Savannah Department of Revenue data on lodging taxes;
• US Census data on seasonal second homes by county;
• Aviation-related spending for visitors based on airport and passenger data; and
• Capital investment data from Georgia’s Tourism Satellite Account
This comprehensive set of data provides a holistic view of visitor activity that
is constrained by known measurements. These datasets complement and
crosscheck one another.
Our analysis of tourism’s impact on Savannah starts with this spending but
also considers the downstream effects of this injection of spending into the
local economy. To determine the total economic impact of tourism in
Savannah, we input tourism spending into a model of the Savannah
economy created in IMPLAN. This model calculates three distinct types of
impact: direct, indirect, and induced.
Tourism creates direct economic value within a discreet group of sectors
(e.g. recreation, transportation). This supports a relative proportion of jobs,
wages, taxes, and GDP within each sector. Each directly affected sector
also purchases goods and services as inputs (e.g. food wholesalers,
utilities) into production. These impacts are called indirect impacts. Lastly,
the induced impact is generated when employees whose wages are
generated either directly or indirectly by tourism, spend those wages in the
local economy (Fig. 11).

Cost benefit analysis of Savannah’s tourism sector
30
Fig. 11: How tourism spending flows through the economy and
generates economic benefits
We calculate the impacts on business sales, jobs, wages, and taxes on all
three levels of impact.
FISCAL IMPACT METHODOLOGY
Part of IMPLAN’s modeling process it to create tax impacts at the federal,
state, county, and city levels. These impacts are specific to both the region of
study (i.e. Savannah) and the industries being impacted. We review the initial
output of the model and compare these results to Savannah’s
Comprehensive Annual Financial Report (CAFR), Savannah’s adopted 2017
budget, and key indicators on the local economy from the BEA to ensure that
the output is logical given known tax revenue and economic data. This
examination indicated that the hotel/motel tax and automotive rental tax were
not properly accounted for and that user fees were severely underestimated,
so we created customized estimates here.

Cost benefit analysis of Savannah’s tourism sector
31
APPENDIX 3: ADDITIONAL
ECONOMIC IMPACT ANALYSIS
Table 21: The impact of tourism on business sales in Savannah, 2016, millions
Direct Indirect Induced Total
Agriculture, Fishing, Mining - $0.1 $0.1 $0.2
Construction and Utilities $133.8 $51.8 $16.3 $201.8
Manufacturing - $20.9 $8.4 $29.3
Wholesale Trade - $40.4 $23.6 $64.0
Air Transport $155.0 $1.2 $1.1 $157.3
Other Transport $135.2 $46.3 $10.7 $192.2
Retail Trade $528.7 $14.4 $27.9 $571.0
Gasoline Stations $200.9 $1.4 $2.0 $204.3
Communications - $30.1 $14.3 $44.4
Finance, Insurance and Real Estate $87.0 $107.6 $116.9 $311.6
Business Services $76.2 $124.6 $28.1 $228.9
Education and Health Care - $1.1 $77.3 $78.4
Recreation and Entertainment $155.5 $14.5 $9.8 $179.8
Lodging $402.5 $3.9 $4.6 $411.0
Food & Beverage $588.9 $13.1 $32.5 $634.5
Personal Services - $16.0 $26.4 $42.4
Government - $4.9 $0.8 $5.7
TOTAL $2,463.7 $492.5 $400.8 $3,356.9
Source: Tourism Economics
Tourism industry generated business sales, millions
Fig. 12: The impact of tourism on business sales in Savannah, 2016
Food & Beverage
Retail Trade
Lodging
FIRE*
Business Services
Gasoline Stations
Construction and Utilities
Other Transport
Recreation and Entertainment
Air Transport
Education and Health Care
Wholesale Trade
Communications
Personal Services
Manufacturing
Government
Agriculture, Fishing, Mining
$0 $200 $400 $600 $800
Direct
Indirect
Induced
Source: Tourism Economics
Dollars, millions*Finance, insurance and real estate

Cost benefit analysis of Savannah’s tourism sector
32
Table 22: The impact of tourism on local income in Savannah, 2016, millions
Direct Indirect Induced Total
Agriculture, Fishing, Mining - $0 $0 $0
Construction and Utilities $44 $10 $3 $56
Manufacturing - $5 $2 $7
Wholesale Trade - $13 $8 $20
Air Transport $10 $0 $0 $10
Other Transport $43 $17 $4 $64
Retail Trade $74 $6 $11 $91
Gasoline Stations $12 $1 $1 $14
Communications - $6 $2 $8
Finance, Insurance and Real Estate $8 $17 $9 $34
Business Services $39 $57 $13 $109
Education and Health Care - $1 $45 $45
Recreation and Entertainment $43 $4 $3 $50
Lodging $109 $1 $1 $112
Food & Beverage $201 $6 $13 $220
Personal Services - $8 $12 $20
Government - $4 $0 $4
TOTAL $583 $157 $127 $866
Source: Tourism Economics
Tourism industry generated income, millions
Fig. 13: The impact of tourism income in Savannah, 2016
Food & Beverage
Lodging
Business Services
Retail Trade
Other Transport
Construction and Utilities
Recreation and Entertainment
Education and Health Care
FIRE*
Wholesale Trade
Personal Services
Gasoline Stations
Air Transport
Communications
Manufacturing
Government
Agriculture, Fishing, Mining
$0 $50 $100 $150 $200 $250
Direct
Indirect
Induced
Source: Tourism Economics
Dollars, 000's*Finance, insurance and real estate

Cost benefit analysis of Savannah’s tourism sector
33
Table 23: The impact of tourism on local employment in Savannah, 2016, millions
Direct Indirect Induced Total
Agriculture, Fishing, Mining - 1 1 2
Construction and Utilities 445 159 48 651
Manufacturing - 90 34 124
Wholesale Trade - 164 96 260
Air Transport 120 3 3 126
Other Transport 849 333 71 1,254
Retail Trade 2,922 187 339 3,448
Gasoline Stations 345 22 31 399
Communications - 111 38 149
Finance, Insurance and Real Estate 284 676 331 1,291
Business Services 480 1,237 301 2,017
Education and Health Care - 19 779 798
Recreation and Entertainment 1,976 329 134 2,439
Lodging 3,931 41 50 4,022
Food & Beverage 9,210 274 557 10,041
Personal Services - 168 347 515
Government - 44 6 51
TOTAL 20,561 3,860 3,165 27,586
Source: Tourism Economics
Tourism industry generated employment
Fig. 14: The impact of tourism on employment in Savannah, 2016
Food & Beverage
Lodging
Retail Trade
Recreation and Entertainment
Business Services
FIRE*
Other Transport
Education and Health Care
Construction and Utilities
Personal Services
Gasoline Stations
Wholesale Trade
Communications
Air Transport
Manufacturing
Government
Agriculture, Fishing, Mining
0 2,000 4,000 6,000 8,000 10,000 12,000
Direct
Indirect
Induced
Source: Tourism Economics
Jobs*Finance, insurance and real estate

Cost benefit analysis of Savannah’s tourism sector
34
APPENDIX 4: ADDITIONAL FISCAL
ANALYSIS This appendix provides additional analysis on the fiscal impacts of tourism
in which enterprise funds are ignored. The enterprise funds involve
programs which are largely self-sustaining as they generate revenue by
selling services such as water, sewer and parking. These changes are
reflected in a reduction of “user fees” in Table 24 (analogous to Table 12 in
the main text) and a conversion of “Total expenditures” to “Total non-
enterprise expenditures” in Table 25 (analogous to Table 17 in the main
text). These changes alter the final estimate of the impacts of the city’s
finances.
After removing user fee revenue accruing to the enterprise funds, we find
that tourism generates a total of $71.9 million of revenue for the City of
Savannah. The vast majority of this revenue comes from taxes and a
relatively small share comes from user fees.
Table 24: Revenue generated for the City of Savannah by the tourism
industry, 2016
Tax Direct Indirect/induced Total
Property taxes $15.4 $5.7 $21.1
Sales and business taxes $12.2 $3.7 $15.9
Selective taxes* $20.7 $0.1 $20.8
User fees** $0.1 $0.03 $0.2
Other $10.0 $3.9 $14.0
Total $58.4 $13.5 $71.9
Sources: IMPLAN; Tourism Economics
*includes hotel and auto rental tax
**includes items such as leisure service facility rental

Cost benefit analysis of Savannah’s tourism sector
35
The City of Savannah has a total of $201 million non-enterprise expenses.
After performing the same calculations as outlined in section 4.3, we
calculate tourism’s share of these expenses as $18.6 million.
Table 25 Tourism’s share of services, overhead and other expenses,
2016
Total non-enterprise expenditures $201.0
Tourism funds - $10.0
Police funds - $68.8
Overhead and other expenses $122.1
Total Savannah employment 134,661
Direct tourism employment ÷ 20,561
Tourism's share of economy 15.3%
Services, overhead, and other expenses $122.1
Tourism's share of economy x 15.3%
Tourism's share of expenses $18.6
Sources: Tourism Economics; City of Savannah; BEA; Census Bureau
City of Savannah expenses
Tourism's share of Savannah economy
Tourism's share of services, overhead, and other expenses
Total fiscal expenses associated with tourism equals $32.9 million (see
section 4.3 for calculations of “Tourism dedicated expenses” and “Police
expenses”).
Table 26 Total fiscal expenses associated with tourism (millions), 2016
Tourism dedicated expenses $10.0
Police expenses $4.3
Overhead and other expenses $18.6
Total $32.9
Source: Tourism Economics
The City of Savannah government receives $71.9 million of revenue
supported by tourism, and the City of Savannah government spends $32.9
million on promoting and supporting tourism. The City of Savannah
therefore receives a net benefit of $40.0 million, or a benefit of $265 per
resident (Table 20). For every dollar spent supporting the tourism industry,
the City of Savannah gains $2.18 in revenue.
Table 27 Cost benefit analysis for the City of Savannah
Goverment revenue supported by tourism $71,921,000
City of Savannah expenses on tourism $32,942,000
Net benefit $38,979,000
Net benefit per resident $265
Benefit-to-cost ratio 2.18
Source: Tourism Economics

Cost benefit analysis of Savannah’s tourism sector
36