a control system for preventing cavitation of centrifugal
TRANSCRIPT

ScienceDirect
Available online at www.sciencedirect.comAvailable online at www.sciencedirect.com
ScienceDirectEnergy Procedia 00 (2017) 000–000
www.elsevier.com/locate/procedia
1876-6102 © 2017 The Authors. Published by Elsevier Ltd.Peer-review under responsibility of the Scientific Committee of The 15th International Symposium on District Heating and Cooling.
The 15th International Symposium on District Heating and Cooling
Assessing the feasibility of using the heat demand-outdoor temperature function for a long-term district heat demand forecast
I. Andrića,b,c*, A. Pinaa, P. Ferrãoa, J. Fournierb., B. Lacarrièrec, O. Le Correc
aIN+ Center for Innovation, Technology and Policy Research - Instituto Superior Técnico, Av. Rovisco Pais 1, 1049-001 Lisbon, PortugalbVeolia Recherche & Innovation, 291 Avenue Dreyfous Daniel, 78520 Limay, France
cDépartement Systèmes Énergétiques et Environnement - IMT Atlantique, 4 rue Alfred Kastler, 44300 Nantes, France
Abstract
District heating networks are commonly addressed in the literature as one of the most effective solutions for decreasing the greenhouse gas emissions from the building sector. These systems require high investments which are returned through the heatsales. Due to the changed climate conditions and building renovation policies, heat demand in the future could decrease, prolonging the investment return period. The main scope of this paper is to assess the feasibility of using the heat demand – outdoor temperature function for heat demand forecast. The district of Alvalade, located in Lisbon (Portugal), was used as a case study. The district is consisted of 665 buildings that vary in both construction period and typology. Three weather scenarios (low, medium, high) and three district renovation scenarios were developed (shallow, intermediate, deep). To estimate the error, obtained heat demand values were compared with results from a dynamic heat demand model, previously developed and validated by the authors.The results showed that when only weather change is considered, the margin of error could be acceptable for some applications(the error in annual demand was lower than 20% for all weather scenarios considered). However, after introducing renovation scenarios, the error value increased up to 59.5% (depending on the weather and renovation scenarios combination considered). The value of slope coefficient increased on average within the range of 3.8% up to 8% per decade, that corresponds to the decrease in the number of heating hours of 22-139h during the heating season (depending on the combination of weather and renovation scenarios considered). On the other hand, function intercept increased for 7.8-12.7% per decade (depending on the coupled scenarios). The values suggested could be used to modify the function parameters for the scenarios considered, and improve the accuracy of heat demand estimations.
© 2017 The Authors. Published by Elsevier Ltd.Peer-review under responsibility of the Scientific Committee of The 15th International Symposium on District Heating and Cooling.
Keywords: Heat demand; Forecast; Climate change
Energy Procedia 148 (2018) 242–249
1876-6102 © 2018 The Authors. Published by Elsevier Ltd.This is an open access article under the CC BY-NC-ND license (https://creativecommons.org/licenses/by-nc-nd/4.0/)Selection and peer-review under responsibility of the scientific committee of the 73rd Conference of the Italian Thermal Machines Engineering Association (ATI 2018).10.1016/j.egypro.2018.08.074
10.1016/j.egypro.2018.08.074
© 2018 The Authors. Published by Elsevier Ltd.This is an open access article under the CC BY-NC-ND license (https://creativecommons.org/licenses/by-nc-nd/4.0/)Selection and peer-review under responsibility of the scientific committee of the 73rd Conference of the Italian Thermal Machines Engineering Association (ATI 2018).
1876-6102
Available online at www.sciencedirect.com
Energy Procedia 00 (2018) 000–000www.elsevier.com/locate/procedia
73rd Conference of the Italian Thermal Machines Engineering Association (ATI 2018), 12-14September 2018, Pisa, Italy
A control system for preventing cavitation of centrifugal pumpsValentino Cucita,b,∗, Fabio Burlonb, Gianfranco Fenua, Riccardo Furlanettob, Felice
Andrea Pellegrinoa, Michele Simonatob
aDepartment of Engineering and Architecture, Via Valerio 10, 34128 Trieste , ItalybThe Research Hub by Electrolux Professional Spa, Viale Treviso 15, 33170 Pordenone, Italy
Abstract
Cavitation is a well-known phenomenon that may occur, among other turbo-machines, in centrifugal pumps and can result insevere damage of both the pump and the whole hydraulic system. There are situations in which, in principle, the cavitation couldbe avoided by detecting the condition of incipient cavitation, and changing slightly the working point of the whole system inorder to move away from that condition. In the present paper two simple closed-loop control strategies are implemented, actingon the pump’s rotational speed and fed by the measurements of a set of inertial sensors. In particular, the research is focused ona centrifugal pump normally employed in hydraulic systems. The pump operates in a dedicated test rig, where cavitation can beinduced by acting on a reservoir’s pressure. Three accelerometers are installed in the pump body along three orthogonal axes.An extensive set of experiments has been carried out at different flow rates and a number of signals’ features both in the timedomain and in the frequency domain have been considered as indicators of incipient cavitation. The amount of energy of the signalcaptured by the accelerometer in the component orthogonal to the flow direction, in the band from 10 to 12.8 kHz, demonstratedto be effective in detecting the incipient cavitation, by selecting a proper (condition-dependent) threshold. Therefore, two simplecontrollers have been designed: the first regulates the speed of the pump, to recover from cavitation, bringing the indicator backto the nominal value, while the second allows to reduce the pump’s rotational speed when the cavitation detector indicates theincipient cavitation and restoring the nominal speed when possible. The latter approach is rather general, because the threshold-based detector can be substituted by any detector providing binary output. Experimental results are reported that demonstrate theeffectiveness of the approach.
c© 2018 The Authors. Published by Elsevier Ltd.This is an open access article under the CC BY-NC-ND license (https://creativecommons.org/licenses/by-nc-nd/4.0/)Selection and peer-review under responsibility of the scientific committee of the 73rd Conference of the Italian Thermal MachinesEngineering Association (ATI 2018).
Keywords: Cavitation; Centrifugal pump; Closed-loop control
∗Corresponding author. Tel.: +39-348-765-7762;E-mail address: [email protected]
1876-6102 c© 2018 The Authors. Published by Elsevier Ltd.This is an open access article under the CC BY-NC-ND license (https://creativecommons.org/licenses/by-nc-nd/4.0/)Selection and peer-review under responsibility of the scientific committee of the 73rd Conference of the Italian Thermal Machines EngineeringAssociation (ATI 2018).
2 Valentino Cucit / Energy Procedia 00 (2018) 000–000
1. Introduction
Cavitation is an unwanted phenomenon that affects the operating functions of centrifugal machines with a liquidworking fluid. The cavitation phenomenon takes place due to local evaporation of the fluid caused by a lowering ofthe pressure. If the pressure falls below the vapor pressure of the fluid, steam bubbles are created. When the bubblesreach regions of higher pressure, they implode in contact with the surfaces of the machine, generating pressure wavesthat cause erosion [1]. If the phenomenon of cavitation persists for a long time, it may cause severe mechanicalconsequences. Furthermore, the onset of cavitation has a negative influence on the performance of the machine.In pumps it causes a decrease in the flow rate and the total head generated, while in turbines a decrease in powerand efficiency. Therefore it is necessary to detect and avoid the development of cavitation in centrifugal machines.In abnormal operating conditions of centrifugal pumps, especially in cavitation conditions, vibrations and noise arepresent; many studies use acoustic noise and vibrations to detect cavitation formation. Cudina [2] presents a method toidentify, through acoustic noise, the formation of cavitation and its complete development. Zhang [3] uses the pumpvibrations, analyzing the energy of the accelerometers’ signals, in the frequency range between 10 and 25 kHz, toidentify the critical cavitation point. Baldassarre [4] presents a method to detect the incipient cavitation through imageanalysis: the aim is to identify in real time the presence of cavitation (analyzing images of the impeller blade) andto alert with an acoustic signal, in case of incipient cavitation. Other methods use statistics of the accelerometers’signals to identify the operating status of the centrifugal pump. Nasiri [5] identifies a set of indicators that allow,when fed to a neural network, the detection of the operating states of the pump. The author divides the pump workingcondition into three classes: normal condition, developed cavitation and fully developed cavitation. Mohammad [6],instead, develops a system for detecting the phenomenon, based on five different cavitation conditions, through amulti-class Support Vector Machine (SVM) classifier [7]. The indicators used for the classification of cavitation wereobtained from the statistical analysis of vibrations in the time domain and in the frequency domain. Muralidharan[8] has developed a fault detection method for centrifugal pumps using SVM. To derive the features, used in SVM,the Continuous Wavelet Transform (CWT) of the vibration signals was carried out. In that study, several good anddefective conditions have been identified on the operation of the pump. In the present work, two control schemes arepresented for regulating the pump with the aim to keep its working condition away from the fully developed cavitationphenomenon. The first controller acts based on a real valued index computed from the sensors’ measures. A secondstrategy is based on a discrete (binary) index, corresponding to the output of a generic “cavitation detector”. Thepaper is organized as follows: in Section 2, the test rig and the instrumentation necessary for carrying out the tests onthe pump are presented, Section 3 is dedicated to the methods for detecting cavitation and for regulating the pumpaccordingly. In Section 4 the results of two kind of experiments are reported and finally, in Section 5, conclusions aredrawn and some possible developments are mentioned.
2. Materials
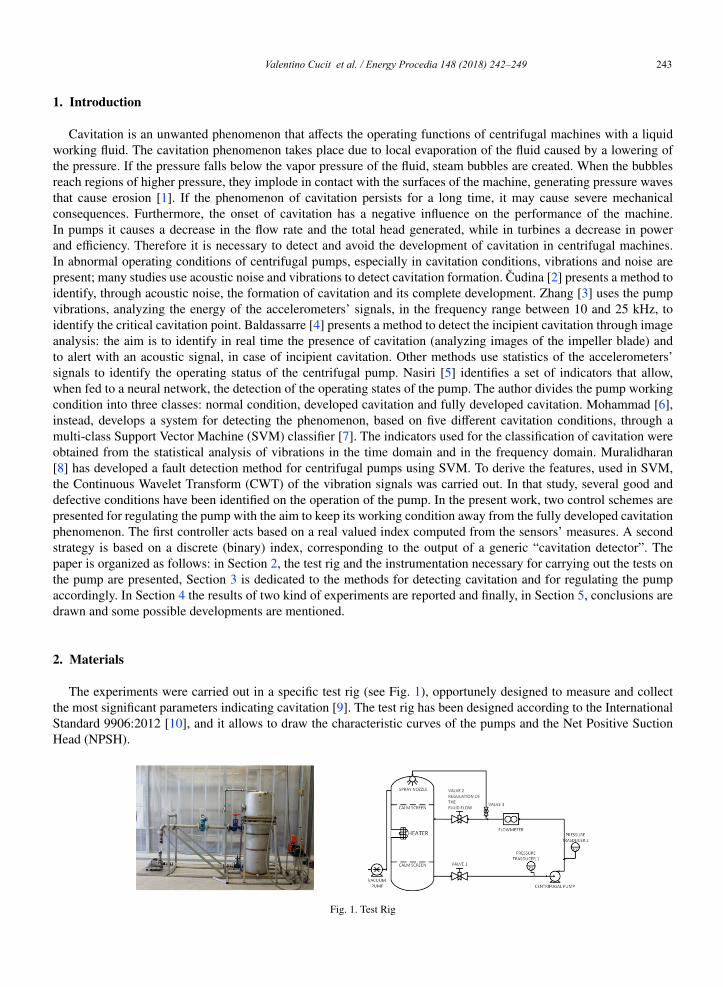
The experiments were carried out in a specific test rig (see Fig. 1), opportunely designed to measure and collectthe most significant parameters indicating cavitation [9]. The test rig has been designed according to the InternationalStandard 9906:2012 [10], and it allows to draw the characteristic curves of the pumps and the Net Positive SuctionHead (NPSH).
Fig. 1. Test Rig
brought to you by COREView metadata, citation and similar papers at core.ac.uk
provided by Archivio istituzionale della ricerca - Università di Trieste
Valentino Cucit et al. / Energy Procedia 148 (2018) 242–249 243
Available online at www.sciencedirect.com
Energy Procedia 00 (2018) 000–000www.elsevier.com/locate/procedia
73rd Conference of the Italian Thermal Machines Engineering Association (ATI 2018), 12-14September 2018, Pisa, Italy
A control system for preventing cavitation of centrifugal pumpsValentino Cucita,b,∗, Fabio Burlonb, Gianfranco Fenua, Riccardo Furlanettob, Felice
Andrea Pellegrinoa, Michele Simonatob
aDepartment of Engineering and Architecture, Via Valerio 10, 34128 Trieste , ItalybThe Research Hub by Electrolux Professional Spa, Viale Treviso 15, 33170 Pordenone, Italy
Abstract
Cavitation is a well-known phenomenon that may occur, among other turbo-machines, in centrifugal pumps and can result insevere damage of both the pump and the whole hydraulic system. There are situations in which, in principle, the cavitation couldbe avoided by detecting the condition of incipient cavitation, and changing slightly the working point of the whole system inorder to move away from that condition. In the present paper two simple closed-loop control strategies are implemented, actingon the pump’s rotational speed and fed by the measurements of a set of inertial sensors. In particular, the research is focused ona centrifugal pump normally employed in hydraulic systems. The pump operates in a dedicated test rig, where cavitation can beinduced by acting on a reservoir’s pressure. Three accelerometers are installed in the pump body along three orthogonal axes.An extensive set of experiments has been carried out at different flow rates and a number of signals’ features both in the timedomain and in the frequency domain have been considered as indicators of incipient cavitation. The amount of energy of the signalcaptured by the accelerometer in the component orthogonal to the flow direction, in the band from 10 to 12.8 kHz, demonstratedto be effective in detecting the incipient cavitation, by selecting a proper (condition-dependent) threshold. Therefore, two simplecontrollers have been designed: the first regulates the speed of the pump, to recover from cavitation, bringing the indicator backto the nominal value, while the second allows to reduce the pump’s rotational speed when the cavitation detector indicates theincipient cavitation and restoring the nominal speed when possible. The latter approach is rather general, because the threshold-based detector can be substituted by any detector providing binary output. Experimental results are reported that demonstrate theeffectiveness of the approach.
c© 2018 The Authors. Published by Elsevier Ltd.This is an open access article under the CC BY-NC-ND license (https://creativecommons.org/licenses/by-nc-nd/4.0/)Selection and peer-review under responsibility of the scientific committee of the 73rd Conference of the Italian Thermal MachinesEngineering Association (ATI 2018).
Keywords: Cavitation; Centrifugal pump; Closed-loop control
∗Corresponding author. Tel.: +39-348-765-7762;E-mail address: [email protected]
1876-6102 c© 2018 The Authors. Published by Elsevier Ltd.This is an open access article under the CC BY-NC-ND license (https://creativecommons.org/licenses/by-nc-nd/4.0/)Selection and peer-review under responsibility of the scientific committee of the 73rd Conference of the Italian Thermal Machines EngineeringAssociation (ATI 2018).
2 Valentino Cucit / Energy Procedia 00 (2018) 000–000
1. Introduction
Cavitation is an unwanted phenomenon that affects the operating functions of centrifugal machines with a liquidworking fluid. The cavitation phenomenon takes place due to local evaporation of the fluid caused by a lowering ofthe pressure. If the pressure falls below the vapor pressure of the fluid, steam bubbles are created. When the bubblesreach regions of higher pressure, they implode in contact with the surfaces of the machine, generating pressure wavesthat cause erosion [1]. If the phenomenon of cavitation persists for a long time, it may cause severe mechanicalconsequences. Furthermore, the onset of cavitation has a negative influence on the performance of the machine.In pumps it causes a decrease in the flow rate and the total head generated, while in turbines a decrease in powerand efficiency. Therefore it is necessary to detect and avoid the development of cavitation in centrifugal machines.In abnormal operating conditions of centrifugal pumps, especially in cavitation conditions, vibrations and noise arepresent; many studies use acoustic noise and vibrations to detect cavitation formation. Cudina [2] presents a method toidentify, through acoustic noise, the formation of cavitation and its complete development. Zhang [3] uses the pumpvibrations, analyzing the energy of the accelerometers’ signals, in the frequency range between 10 and 25 kHz, toidentify the critical cavitation point. Baldassarre [4] presents a method to detect the incipient cavitation through imageanalysis: the aim is to identify in real time the presence of cavitation (analyzing images of the impeller blade) andto alert with an acoustic signal, in case of incipient cavitation. Other methods use statistics of the accelerometers’signals to identify the operating status of the centrifugal pump. Nasiri [5] identifies a set of indicators that allow,when fed to a neural network, the detection of the operating states of the pump. The author divides the pump workingcondition into three classes: normal condition, developed cavitation and fully developed cavitation. Mohammad [6],instead, develops a system for detecting the phenomenon, based on five different cavitation conditions, through amulti-class Support Vector Machine (SVM) classifier [7]. The indicators used for the classification of cavitation wereobtained from the statistical analysis of vibrations in the time domain and in the frequency domain. Muralidharan[8] has developed a fault detection method for centrifugal pumps using SVM. To derive the features, used in SVM,the Continuous Wavelet Transform (CWT) of the vibration signals was carried out. In that study, several good anddefective conditions have been identified on the operation of the pump. In the present work, two control schemes arepresented for regulating the pump with the aim to keep its working condition away from the fully developed cavitationphenomenon. The first controller acts based on a real valued index computed from the sensors’ measures. A secondstrategy is based on a discrete (binary) index, corresponding to the output of a generic “cavitation detector”. Thepaper is organized as follows: in Section 2, the test rig and the instrumentation necessary for carrying out the tests onthe pump are presented, Section 3 is dedicated to the methods for detecting cavitation and for regulating the pumpaccordingly. In Section 4 the results of two kind of experiments are reported and finally, in Section 5, conclusions aredrawn and some possible developments are mentioned.
2. Materials
The experiments were carried out in a specific test rig (see Fig. 1), opportunely designed to measure and collectthe most significant parameters indicating cavitation [9]. The test rig has been designed according to the InternationalStandard 9906:2012 [10], and it allows to draw the characteristic curves of the pumps and the Net Positive SuctionHead (NPSH).
Fig. 1. Test Rig

244 Valentino Cucit et al. / Energy Procedia 148 (2018) 242–249Valentino Cucit / Energy Procedia 00 (2018) 000–000 3
The pump in the test rig is installed in a closed circuit where is possible to change the barometric load of the freesurface level of the tank and the temperature of the fluid. The three-phase centrifugal pump in use has the electricaland hydraulic characteristics shown in Table 1.
Table 1. Centrifugal pump characteristics
Electrical quantities
Power supply 400 VPower rate 2.2 kWCurrent 5.4 ASpeed 2800 rpmFrequency 50 Hz
Hydraulic quantities
Flow rate 0 m3/s to 0.0158 m3/sTotal head 0 m to 16 m
The tank is designed to avoid the gas inclusion in the aspiration of the pump. Inside the tank are present: twocalm screens, two electric heaters (one of 17 kW and the other of 9 kW), a spray nozzle device and a vacuum inletfor controlling the pressure in the free surface level inside the tank. There are two manually regulated valves, one inthe bottom side of the tank and the other in the upper part. Various sensors have been installed to detect hydraulic,mechanical and electrical quantities. The hydraulic quantities include: the upstream and downstream pressure of thepump, the tank pressure, the flow rate and the fluid temperature. The pressure measurement sections are positioned ata distance of 2 diameters from the suction and from the outlet section of the pump. The measuring range is between-1 and 1 bar for the pressure transducers in the suction side, and between -1 and 3 bar in the delivery side. Theseinstruments are provided by Trafag, need a power supply of 24 Vdc and provide a signal output 4-20 mA. Theprecision output on full scale is 0.15%. The flow meter is positioned after the outlet section of the pump at a distanceof 10 diameters from the pipe curve. The outlet section of the flow meter is positioned 5 diameters from the branchconnecting the spray nozzle used for deaeration purposes. Such distances are needed for having an accurate measure ofthe fluid flow. The flow meter is provided by Endress Hauser, it requires a power supply of 230 Vac, delivers an outputsignal between 4-20 mA and has a fluid flow measurement range between 0 m3/s and 0.0158 m3/s. Its error is 0.5%on the read value. For reaching a uniform velocity and pressure distribution at the suction of the pump, 12 diametersare guaranteed in length from the pump suction. The tank pressure is measured through a pressure transducer. Thetransducer has the following characteristics: measurement range from 0 to -1 bar, voltage output between 1 and 5Vdc, error at full scale of 2%. To detect the temperature of the fluid, necessary to obtain the vapor pressure, a thermal-resistance was installed in the tank. The Pt100 used has an accuracy of 0.01% and a measuring range between -50 and600 ◦C.
The mechanical quantities measured include: pump vibrations along orthog-
Fig. 2. Accelerometer position
onal directions and pump’s rotational speed. The vibrations were acquired bythree piezoelectric ICB accelerometers, installed on the pump volute (see Fig. 2)in the following position: X axis in the direction of the rotation axis of the pump,Y and Z axes in the radial directions of the volute. In a previous work by someof the authors [9], three accelerometers were used with a range from -50 to50 g and sensitivity of 100 mV/g, not enough to detect the vibrations duringfully developed cavitation. Therefore, them have been replaced with three ac-celerometers having the following characteristics: sensitivity of 10 mV/g and a
range of -500 to 500 g. In the system has been also installed an inverter used to regulate the pump’s rotational speed.The use of this device increases the cost of the system by an amount that corresponds roughly to the cost of the pumpalone. The inverter model is the Combivert F5 Basic by KEB, with the following characteristics: maximum powerof 4 kW , maximum current of 15 A and frequency range between 0 and 400 Hz. Through the inverter feedback ispossible to acquire the number of revolutions per time unit. The analogue output of the inverter in voltage, 0-10 V, isconverted first in frequency and then in the rpm of the centrifugal pump. Finally, to measure the electrical quantities
4 Valentino Cucit / Energy Procedia 00 (2018) 000–000
in all the different conditions a power meter was used, to get the current value, voltage value and the power absorbedby the pump (Yokogawa digital power meter with accuracy of 0.1% of reading).
3. Methods
3.1. Cavitation detection
Fig. 3. Cavitation detection
In order to characterize the pump, many tests were carried out under both nominal conditions, varying the pumpflow rate (from 0 m3/s to 0.0158 m3/s), and cavitation condition, varying the tank pressure load. Through the analysisof the tests’ results the most significant curves have been drawn: characteristic curve, which shows the relationshipbetween flow rate (Q) and total head (H), and NPSH curve dependency of total head (H), used to identify cavitation.The test rig allows to test various pump configurations in different operating conditions, obtained by varying the fluidtemperature and its properties, adding detergent and additives [11]. According to standards [10], cavitation occurs inthe pump when the total head decreases more than 3% compared to analogous conditions in the absence of cavitation.In the test rig, to induce cavitation, the tank pressure is reduced by means of a vacuum pump. Vibration measurementallows to detect cavitation inception. The statistical indicators considered for the analysis of the vibrations, obtainedfrom the three accelerometers (along the X, Y and Z axis) at the sample rate of 25.6 kHz, are shown in Table 2, where αrepresents the acceleration, µα represents the mean and σα the standard deviation of the sequence αi, i = 0, . . . ,N −1.Another parameter analyzed, in different frequency spectra, is the energy of the signal, defined as the integral of thePower Spectral Density (PSD) [12]:
Energy =∫ f2
f1PSD( f )d f . (1)
The frequencies considered for computing the signal energy are f1 =10 kHz and f2 =12.8 kHz, because they demon-strated to be effective in detecting cavitation. These frequencies have been selected based on the investigation pre-sented in [13], where the author analyses different frequency bands in order to find the most sensible to cavitation

Valentino Cucit et al. / Energy Procedia 148 (2018) 242–249 245Valentino Cucit / Energy Procedia 00 (2018) 000–000 3
The pump in the test rig is installed in a closed circuit where is possible to change the barometric load of the freesurface level of the tank and the temperature of the fluid. The three-phase centrifugal pump in use has the electricaland hydraulic characteristics shown in Table 1.
Table 1. Centrifugal pump characteristics
Electrical quantities
Power supply 400 VPower rate 2.2 kWCurrent 5.4 ASpeed 2800 rpmFrequency 50 Hz
Hydraulic quantities
Flow rate 0 m3/s to 0.0158 m3/sTotal head 0 m to 16 m
The tank is designed to avoid the gas inclusion in the aspiration of the pump. Inside the tank are present: twocalm screens, two electric heaters (one of 17 kW and the other of 9 kW), a spray nozzle device and a vacuum inletfor controlling the pressure in the free surface level inside the tank. There are two manually regulated valves, one inthe bottom side of the tank and the other in the upper part. Various sensors have been installed to detect hydraulic,mechanical and electrical quantities. The hydraulic quantities include: the upstream and downstream pressure of thepump, the tank pressure, the flow rate and the fluid temperature. The pressure measurement sections are positioned ata distance of 2 diameters from the suction and from the outlet section of the pump. The measuring range is between-1 and 1 bar for the pressure transducers in the suction side, and between -1 and 3 bar in the delivery side. Theseinstruments are provided by Trafag, need a power supply of 24 Vdc and provide a signal output 4-20 mA. Theprecision output on full scale is 0.15%. The flow meter is positioned after the outlet section of the pump at a distanceof 10 diameters from the pipe curve. The outlet section of the flow meter is positioned 5 diameters from the branchconnecting the spray nozzle used for deaeration purposes. Such distances are needed for having an accurate measure ofthe fluid flow. The flow meter is provided by Endress Hauser, it requires a power supply of 230 Vac, delivers an outputsignal between 4-20 mA and has a fluid flow measurement range between 0 m3/s and 0.0158 m3/s. Its error is 0.5%on the read value. For reaching a uniform velocity and pressure distribution at the suction of the pump, 12 diametersare guaranteed in length from the pump suction. The tank pressure is measured through a pressure transducer. Thetransducer has the following characteristics: measurement range from 0 to -1 bar, voltage output between 1 and 5Vdc, error at full scale of 2%. To detect the temperature of the fluid, necessary to obtain the vapor pressure, a thermal-resistance was installed in the tank. The Pt100 used has an accuracy of 0.01% and a measuring range between -50 and600 ◦C.
The mechanical quantities measured include: pump vibrations along orthog-
Fig. 2. Accelerometer position
onal directions and pump’s rotational speed. The vibrations were acquired bythree piezoelectric ICB accelerometers, installed on the pump volute (see Fig. 2)in the following position: X axis in the direction of the rotation axis of the pump,Y and Z axes in the radial directions of the volute. In a previous work by someof the authors [9], three accelerometers were used with a range from -50 to50 g and sensitivity of 100 mV/g, not enough to detect the vibrations duringfully developed cavitation. Therefore, them have been replaced with three ac-celerometers having the following characteristics: sensitivity of 10 mV/g and a
range of -500 to 500 g. In the system has been also installed an inverter used to regulate the pump’s rotational speed.The use of this device increases the cost of the system by an amount that corresponds roughly to the cost of the pumpalone. The inverter model is the Combivert F5 Basic by KEB, with the following characteristics: maximum powerof 4 kW , maximum current of 15 A and frequency range between 0 and 400 Hz. Through the inverter feedback ispossible to acquire the number of revolutions per time unit. The analogue output of the inverter in voltage, 0-10 V, isconverted first in frequency and then in the rpm of the centrifugal pump. Finally, to measure the electrical quantities
4 Valentino Cucit / Energy Procedia 00 (2018) 000–000
in all the different conditions a power meter was used, to get the current value, voltage value and the power absorbedby the pump (Yokogawa digital power meter with accuracy of 0.1% of reading).
3. Methods
3.1. Cavitation detection
Fig. 3. Cavitation detection
In order to characterize the pump, many tests were carried out under both nominal conditions, varying the pumpflow rate (from 0 m3/s to 0.0158 m3/s), and cavitation condition, varying the tank pressure load. Through the analysisof the tests’ results the most significant curves have been drawn: characteristic curve, which shows the relationshipbetween flow rate (Q) and total head (H), and NPSH curve dependency of total head (H), used to identify cavitation.The test rig allows to test various pump configurations in different operating conditions, obtained by varying the fluidtemperature and its properties, adding detergent and additives [11]. According to standards [10], cavitation occurs inthe pump when the total head decreases more than 3% compared to analogous conditions in the absence of cavitation.In the test rig, to induce cavitation, the tank pressure is reduced by means of a vacuum pump. Vibration measurementallows to detect cavitation inception. The statistical indicators considered for the analysis of the vibrations, obtainedfrom the three accelerometers (along the X, Y and Z axis) at the sample rate of 25.6 kHz, are shown in Table 2, where αrepresents the acceleration, µα represents the mean and σα the standard deviation of the sequence αi, i = 0, . . . ,N −1.Another parameter analyzed, in different frequency spectra, is the energy of the signal, defined as the integral of thePower Spectral Density (PSD) [12]:
Energy =∫ f2
f1PSD( f )d f . (1)
The frequencies considered for computing the signal energy are f1 =10 kHz and f2 =12.8 kHz, because they demon-strated to be effective in detecting cavitation. These frequencies have been selected based on the investigation pre-sented in [13], where the author analyses different frequency bands in order to find the most sensible to cavitation

246 Valentino Cucit et al. / Energy Procedia 148 (2018) 242–249Valentino Cucit / Energy Procedia 00 (2018) 000–000 5
Table 2. Statistical indicators (µα and σα represent the mean and the standard deviation of the sequence αi, i = 0, . . . ,N − 1 )
Indicator Formula
Root mean square (RMS)
√√√1N
N−1∑i=0
α2i
Max value (MAX) maxi|αi |
Crest factor (CF)MAXRMS
Kurtosis (K)
N−1∑i=0
(αi − µα)4
Nσ4α
inception. The selected frequencies are in good agreement with other theoretical analyses [3],[14],[15],[16],[17],[18]where is reported that the noise excited during the collapse of cavitation bubbles, has a particular effect on the vi-bration energy in high frequency bands. Furthermore, high frequency components of the signals are firstly affectedby cavitation inception [3],[13],[14],[15]. The authors of [14] divide the vibration signal into 4 frequency bands. Therange in which the effect of cavitation is more evident is between 10 kHz and 51.2 kHz. In [15] the author identifiesthe frequency intervals from 10 kHz to 15 kHz, and between 15 kHz and 20 kHz, as frequency bands influenced bycavitation inception. In [13], for the same test rig used in the present work, the frequency range 10 - 12.8 kHz hasbeen shown to be effective for detecting cavitation inception. We report an example, chosen from several experimentsperformed in different operating conditions. Figure 3 shows the total head and the energy of the Z-axis accelerometerin the frequency range 10 kHz-12.8 kHz as a function of the NPSH (at the nominal flow rate of 0.0083 m3/s). Fromright (beginning of the test) to left (end of the test), is possible to observe a decrease of the total head, due to the actionof the vacuum pump. According to [10], cavitation occurs when the total head falls below the threshold depicted indashed line. Notice that the decrease of the total head is accompanied by a an increase of the energy. Figure 3 showsalso the RMS of the Z axis accelerometer signal, computed using a sliding window of 1 s. The energy along the Z axisis employed in all the experiments reported below.
3.2. Control schemes
In the following, experiments performed with two different controllers (shown in Fig. 4) are reported. Both thecontrollers act on the pump speed, precisely they reduce the speed when cavitation occurs. Indeed, by decreasing thepump’s rotational speed, the kinetic component of the total pressure decreases and the static component increasesabove the vapor pressure. The first controller (Fig. 4, left) is a classical servo that simply tracks a constant referencew. It is based on proportional and integrative (PI) actions and allows to keep the indicator value w (the energy of thesignal of axis Z) at a desired level, by acting on the pump rotational speed. The desired level can be chosen as theindicator value measured in a cavitation-free working condition (step 3 of the procedure reported below). It is assumedtherefore that such indicator value, corresponds to a cavitation-free condition, even for a (small) variation of the pumpspeed. A formal stability analysis of the control system is out of the scope of the present work. However, under theassumption that a monotonic relationship holds between the rotational speed, the energy (1) and the cavitation indices,and by choosing moderate values of the proportional and integral actions1, a stable control system is obtained. Such acontrol scheme has been employed in a test carried out according to the following procedure:
1. Activation of the pump.2. Waiting for the rest time (Ts).3. Computation of the initial conditions Hinit and EnergyZinit at time T1.
1 with the proper sign
6 Valentino Cucit / Energy Procedia 00 (2018) 000–000
4. Activation of the vacuum pump.5. Switching off the vacuum pump when cavitation conditions are reached.6. Waiting for the rest time (Ts).7. Activation of the control with EnergyZinit as set point.8. Switch off the control and the pump.
The idea is to find the proper reference value for the indicator (the energy value for the Z axis) during a first phase,where the control is off and the pump is assumed to operate in cavitation-free condition. More precisely, the set point,used in the PI control, is calculated at step 3 of the previous procedure. At all times, the vibrations are acquired atthe sampling rate of 25.6 kHz, from which the statistics are obtained at 1 Hz. The proportional gain (KP) and theintegral gain (KI) of the PI controller have been selected manually by several trials. Satisfactory results have beenobtained by choosing KP = 1.2 and KI = 0.9. The results of one of the many different experiments performed, arereported in the next section. The second control strategy (control 2, Fig. 4, right) is designed for exploiting the outputof a generic binary classifier (the “detector”) whose output is 1 when cavitation is occurring and -1 otherwise. Thedetector may operate on some signals’ features or even on the raw signal/signals. However, the control scheme doesnot depend on the specific detector. For simplicity, in the experiments carried out and reported in the next section,a threshold-based detector was used, acting on the energy value for the Z axis already introduced. The controller isbasically an integrator which outputs a variation δn of the rotational speed, followed by a saturation at zero (to avoidincrease of speed with respect to the nominal speed n). The integrator is equipped with a simple anti-windup scheme(not shown in the figure) that basically stops integration when the output of the integrator is negative. Again, undermild assumptions, the stability is guaranteed. When the incipient cavitation is detected, the speed of the pump isreduced, while upon exiting, it is increased toward n.
inverter pumpKP +KI
sn
w
wmax{0, n}
nKI
s
+
n
inverter pump
detectorr 2 {−1, 1}
Fig. 4. Control 1 (left) and Control 2 (right)
4. Results
In the diagrams shown in Fig. 5, the results are reported, using the first control strategy. In particular, the consideredindicator (energy on the Z axis) and the pump speed (RPM) are shown as a function of time. During the test, performedat the flow rate of 0.0083 m3/s, a total head reduction of 3% has been obtained. The pump speed regulation is activatedwhen the system reaches the selected head reduction (according to the procedure described above). When activated,the PI controller acts reducing the pump speed, bringing the indicator back to its reference value. The bottom panel ofFig. 5 shows the NPSH evaluated using the measures acquired during the test. As expected, the NPSH decreases whenthe vacuum pump is active and reaches a steady value when it is turned off (at 112s). Then, as soon as the controlis activated (at 123s), an increase can be observed, corresponding to the new, cavitation-free operating condition. Inthe diagrams of Fig. 6a and Fig. 6b, the results of two tests carried out using the second control strategy (control 2)are reported. As can be seen by inspecting Fig. 4 (right), the controller can only reduce the speed of the pump, withrespect to the nominal speed n, in response to a positive output from the detector. The scheme is suitable for anybinary classifier employed as detector but, for the sake of simplicity, a threshold-based detector was used, acting onthe energy Z signal. Therefore, in the top panel of Fig. 6a and Fig. 6b the energy Z value is shown. The dashed linerepresents the threshold value. When the energy Z exceeds the threshold, the output of the detector is 1, otherwiseis -1. To identify the threshold value, any other detector may be used, for instance based on some statistics of the

Valentino Cucit et al. / Energy Procedia 148 (2018) 242–249 247Valentino Cucit / Energy Procedia 00 (2018) 000–000 5
Table 2. Statistical indicators (µα and σα represent the mean and the standard deviation of the sequence αi, i = 0, . . . ,N − 1 )
Indicator Formula
Root mean square (RMS)
√√√1N
N−1∑i=0
α2i
Max value (MAX) maxi|αi |
Crest factor (CF)MAXRMS
Kurtosis (K)
N−1∑i=0
(αi − µα)4
Nσ4α
inception. The selected frequencies are in good agreement with other theoretical analyses [3],[14],[15],[16],[17],[18]where is reported that the noise excited during the collapse of cavitation bubbles, has a particular effect on the vi-bration energy in high frequency bands. Furthermore, high frequency components of the signals are firstly affectedby cavitation inception [3],[13],[14],[15]. The authors of [14] divide the vibration signal into 4 frequency bands. Therange in which the effect of cavitation is more evident is between 10 kHz and 51.2 kHz. In [15] the author identifiesthe frequency intervals from 10 kHz to 15 kHz, and between 15 kHz and 20 kHz, as frequency bands influenced bycavitation inception. In [13], for the same test rig used in the present work, the frequency range 10 - 12.8 kHz hasbeen shown to be effective for detecting cavitation inception. We report an example, chosen from several experimentsperformed in different operating conditions. Figure 3 shows the total head and the energy of the Z-axis accelerometerin the frequency range 10 kHz-12.8 kHz as a function of the NPSH (at the nominal flow rate of 0.0083 m3/s). Fromright (beginning of the test) to left (end of the test), is possible to observe a decrease of the total head, due to the actionof the vacuum pump. According to [10], cavitation occurs when the total head falls below the threshold depicted indashed line. Notice that the decrease of the total head is accompanied by a an increase of the energy. Figure 3 showsalso the RMS of the Z axis accelerometer signal, computed using a sliding window of 1 s. The energy along the Z axisis employed in all the experiments reported below.
3.2. Control schemes
In the following, experiments performed with two different controllers (shown in Fig. 4) are reported. Both thecontrollers act on the pump speed, precisely they reduce the speed when cavitation occurs. Indeed, by decreasing thepump’s rotational speed, the kinetic component of the total pressure decreases and the static component increasesabove the vapor pressure. The first controller (Fig. 4, left) is a classical servo that simply tracks a constant referencew. It is based on proportional and integrative (PI) actions and allows to keep the indicator value w (the energy of thesignal of axis Z) at a desired level, by acting on the pump rotational speed. The desired level can be chosen as theindicator value measured in a cavitation-free working condition (step 3 of the procedure reported below). It is assumedtherefore that such indicator value, corresponds to a cavitation-free condition, even for a (small) variation of the pumpspeed. A formal stability analysis of the control system is out of the scope of the present work. However, under theassumption that a monotonic relationship holds between the rotational speed, the energy (1) and the cavitation indices,and by choosing moderate values of the proportional and integral actions1, a stable control system is obtained. Such acontrol scheme has been employed in a test carried out according to the following procedure:
1. Activation of the pump.2. Waiting for the rest time (Ts).3. Computation of the initial conditions Hinit and EnergyZinit at time T1.
1 with the proper sign
6 Valentino Cucit / Energy Procedia 00 (2018) 000–000
4. Activation of the vacuum pump.5. Switching off the vacuum pump when cavitation conditions are reached.6. Waiting for the rest time (Ts).7. Activation of the control with EnergyZinit as set point.8. Switch off the control and the pump.
The idea is to find the proper reference value for the indicator (the energy value for the Z axis) during a first phase,where the control is off and the pump is assumed to operate in cavitation-free condition. More precisely, the set point,used in the PI control, is calculated at step 3 of the previous procedure. At all times, the vibrations are acquired atthe sampling rate of 25.6 kHz, from which the statistics are obtained at 1 Hz. The proportional gain (KP) and theintegral gain (KI) of the PI controller have been selected manually by several trials. Satisfactory results have beenobtained by choosing KP = 1.2 and KI = 0.9. The results of one of the many different experiments performed, arereported in the next section. The second control strategy (control 2, Fig. 4, right) is designed for exploiting the outputof a generic binary classifier (the “detector”) whose output is 1 when cavitation is occurring and -1 otherwise. Thedetector may operate on some signals’ features or even on the raw signal/signals. However, the control scheme doesnot depend on the specific detector. For simplicity, in the experiments carried out and reported in the next section,a threshold-based detector was used, acting on the energy value for the Z axis already introduced. The controller isbasically an integrator which outputs a variation δn of the rotational speed, followed by a saturation at zero (to avoidincrease of speed with respect to the nominal speed n). The integrator is equipped with a simple anti-windup scheme(not shown in the figure) that basically stops integration when the output of the integrator is negative. Again, undermild assumptions, the stability is guaranteed. When the incipient cavitation is detected, the speed of the pump isreduced, while upon exiting, it is increased toward n.
inverter pumpKP +KI
sn
w
wmax{0, n}
nKI
s
+
n
inverter pump
detectorr 2 {−1, 1}
Fig. 4. Control 1 (left) and Control 2 (right)
4. Results
In the diagrams shown in Fig. 5, the results are reported, using the first control strategy. In particular, the consideredindicator (energy on the Z axis) and the pump speed (RPM) are shown as a function of time. During the test, performedat the flow rate of 0.0083 m3/s, a total head reduction of 3% has been obtained. The pump speed regulation is activatedwhen the system reaches the selected head reduction (according to the procedure described above). When activated,the PI controller acts reducing the pump speed, bringing the indicator back to its reference value. The bottom panel ofFig. 5 shows the NPSH evaluated using the measures acquired during the test. As expected, the NPSH decreases whenthe vacuum pump is active and reaches a steady value when it is turned off (at 112s). Then, as soon as the controlis activated (at 123s), an increase can be observed, corresponding to the new, cavitation-free operating condition. Inthe diagrams of Fig. 6a and Fig. 6b, the results of two tests carried out using the second control strategy (control 2)are reported. As can be seen by inspecting Fig. 4 (right), the controller can only reduce the speed of the pump, withrespect to the nominal speed n, in response to a positive output from the detector. The scheme is suitable for anybinary classifier employed as detector but, for the sake of simplicity, a threshold-based detector was used, acting onthe energy Z signal. Therefore, in the top panel of Fig. 6a and Fig. 6b the energy Z value is shown. The dashed linerepresents the threshold value. When the energy Z exceeds the threshold, the output of the detector is 1, otherwiseis -1. To identify the threshold value, any other detector may be used, for instance based on some statistics of the

248 Valentino Cucit et al. / Energy Procedia 148 (2018) 242–249Valentino Cucit / Energy Procedia 00 (2018) 000–000 7
signal(s) such as those of Table 2, or on raw data (for instance a Neural Network or an SVM). In the tests shown inboth Fig. 6a and Fig. 6b, the control system is kept active during the whole experiment. Some maneuvers such asturning on/off the vacuum pump and opening/closing a reservoir’s valve are carried out for varying the reservoir’spressure. In Fig. 6a, the control starts reducing the speed as soon as the detector’s output becomes positive (around60 s). The speed decreases until the vacuum pump is turned off; then, oscillates around the value that corresponds,for the actual reservoir’s pressure, to the detector’s threshold. As shown in Fig. 6b, the controller is able to bringthe speed back to its nominal value whenever possible, precisely when, due to the increased reservoir’s pressure, theoperating conditions change and the output of the detector becomes negative (corresponding to the Energy Z belowthe threshold, in the example). Precisely, the test consists of the following parts: the vacuum pump is turned on at time14 s, and turned off at 108s (14-108 s). Between (154-168 s) with the vacuum pump turned off the reservoir pressureincreases toward ambient pressure due to the manual opening of a valve. Then the valve is closed and during theintervals (185-260 s) and (297-341 s) the vacuum pump is turned on again. Finally, starting from 370 s, the pressureincreases toward ambient pressure, due to the manual opening of the valve.
Fig. 5. Test 1 (control 1). A test carried out using control 1. The plant is brought to a decrease of total head of 3%.
(a) Energy of axis Z and RPM for a test carried out using control2.
(b) A test carried out with control 2 where the detector’s response,may be observed.
Fig. 6.
5. Conclusion and further work
In the present paper simple closed-loop control strategies have been introduced, able to change slightly the work-ing point of a centrifugal pump, with the aim to avoid cavitation. In particular, such control strategies have beenimplemented in a dedicated test rig, inducing cavitation by acting on the reservoir’s pressure. The energy of the vi-brations of the pump body can be computed, using the signals acquired by using three mono-axial accelerometers
8 Valentino Cucit / Energy Procedia 00 (2018) 000–000
(properly installed on the centrifugal pump body). In facts, the amount of energy of acceleration signal (captured byan accelerometer in the component orthogonal to the flow direction) in the band from 10 to 12.8 kHz, may be usedeffectively to detect the incipient cavitation, by selecting a proper (condition-dependent) threshold. The proposed con-trol schemes rely on two different cavitation detectors, both based on the evaluation of the energy of the acquiredvibration signals; in both the schemes the controller acts on the centrifugal pump rotational speed, reducing it whencavitation occurs. In particular, the first proposed control scheme regulates the pump rotational speed, based on the ac-tual value of the energy-based cavitation indicator, bringing the indicator back to the nominal (cavitation-free) value,while the second control strategy allows to reduce the pump’s speed when a binary detector indicates the incipientcavitation, restoring the nominal speed when possible. The latter approach is rather general, because it relies on anydetector (based on the vibration signal energy) providing binary output (i.e. “-1” in the case of no cavitation, “+1”when cavitation occurs). The obtained results are promising and allow to further experiments, varying the pump size,and investigations, with the aim to develop an auto-tuning procedure for the proposed control schemes.
6. Acknowledgment
The authors are indebted to Prof. Diego Micheli for fruitful discussions and precious advises, and to MassimilianoKjuder for his support during the experiments.
References
[1] C. E. Brennen, Cavitation and bubble dynamics, Cambridge University Press, 2013.[2] M. Cudina, Detection of cavitation phenomenon in a centrifugal pump using audible sound, Mechanical systems and signal processing 17 (6)
(2003) 1335–1347.[3] N. Zhang, M. Yang, B. Gao, Z. Li, Vibration characteristics induced by cavitation in a centrifugal pump with slope volute, Shock and Vibration
2015.[4] A. Baldassarre, M. De Lucia, P. Nesi, Real-time detection of cavitation for hydraulic turbomachines, Real-Time Imaging 4 (6) (1998) 403–416.[5] M. Nasiri, M. Mahjoob, H. Vahid-Alizadeh, Vibration signature analysis for detecting cavitation in centrifugal pumps using neural networks,
in: Mechatronics (ICM), 2011 IEEE International Conference on, IEEE, 2011, pp. 632–635.[6] M. T. Shervani-Tabar, M. M. Ettefagh, S. Lotfan, H. Safarzadeh, Cavitation intensity monitoring in an axial flow pump based on vibration
signals using multi-class support vector machine, Proceedings of the Institution of Mechanical Engineers, Part C: Journal of MechanicalEngineering Science (2017) 0954406217729416.
[7] V. Vapnik, The nature of statistical learning theory, Springer science & business media, 2013.[8] V. Muralidharan, V. Sugumaran, V. Indira, Fault diagnosis of monoblock centrifugal pump using SVM, Engineering Science and Technology,
an International Journal 17 (3) (2014) 152–157.[9] F. Burlon, D. Micheli, R. Furlanetto, M. Simonato, V. Cucit, Cavitation detection and prevention in professional warewashing machines, Energy
Procedia 101 (2016) 718–725.[10] ISO, Rotodynamic pumps–hydraulic performance acceptance tests–grades 1, 2 and 3, International Standardization Organization, ISO 9906
(2012) 2012.[11] F. Burlon, D. Micheli, R. Furlanetto, M. Simonato, V. Cucit, Influence of polymer solution on pump performances, Energy Procedia 126 (2017)
722–729.[12] L. Chaparro, Signals and Systems using MATLAB, Academic Press, 2010.[13] F. Burlon, Energy efficiency improvement in professional ovens, Ph.D. thesis (2018).[14] B. Gao, P. Guo, N. Zhang, Z. Li, M. Yang, Experimental investigation on cavitating flow induced vibration characteristics of a low specific
speed centrifugal pump, Shock and Vibration 2017.[15] H. Kallingalthodi, Cavitation detection in a water jet propulsion unit, Master’s thesis (2009).[16] D. Buono, D. Siano, E. Frosina, A. Senatore, Gerotor pump cavitation monitoring and fault diagnosis using vibration analysis through the
employment of auto-regressive-moving-average technique, Simulation Modelling Practice and Theory 71 (2017) 61–82.[17] J. Lu, S. Yuan, S. Parameswaran, J. Yuan, X. Ren, Q. Si, Investigation on the vibration and flow instabilities induced by cavitation in a
centrifugal pump, Advances in Mechanical Engineering 9 (4) (2017) 1687814017696225.[18] N. Zhang, M. Yang, B. Gao, Z. Li, Investigation on vibration characteristics in a centrifugal pump with special slope volute, Advances in
Mechanical Engineering 7 (2) (2015) 936218.

Valentino Cucit et al. / Energy Procedia 148 (2018) 242–249 249Valentino Cucit / Energy Procedia 00 (2018) 000–000 7
signal(s) such as those of Table 2, or on raw data (for instance a Neural Network or an SVM). In the tests shown inboth Fig. 6a and Fig. 6b, the control system is kept active during the whole experiment. Some maneuvers such asturning on/off the vacuum pump and opening/closing a reservoir’s valve are carried out for varying the reservoir’spressure. In Fig. 6a, the control starts reducing the speed as soon as the detector’s output becomes positive (around60 s). The speed decreases until the vacuum pump is turned off; then, oscillates around the value that corresponds,for the actual reservoir’s pressure, to the detector’s threshold. As shown in Fig. 6b, the controller is able to bringthe speed back to its nominal value whenever possible, precisely when, due to the increased reservoir’s pressure, theoperating conditions change and the output of the detector becomes negative (corresponding to the Energy Z belowthe threshold, in the example). Precisely, the test consists of the following parts: the vacuum pump is turned on at time14 s, and turned off at 108s (14-108 s). Between (154-168 s) with the vacuum pump turned off the reservoir pressureincreases toward ambient pressure due to the manual opening of a valve. Then the valve is closed and during theintervals (185-260 s) and (297-341 s) the vacuum pump is turned on again. Finally, starting from 370 s, the pressureincreases toward ambient pressure, due to the manual opening of the valve.
Fig. 5. Test 1 (control 1). A test carried out using control 1. The plant is brought to a decrease of total head of 3%.
(a) Energy of axis Z and RPM for a test carried out using control2.
(b) A test carried out with control 2 where the detector’s response,may be observed.
Fig. 6.
5. Conclusion and further work
In the present paper simple closed-loop control strategies have been introduced, able to change slightly the work-ing point of a centrifugal pump, with the aim to avoid cavitation. In particular, such control strategies have beenimplemented in a dedicated test rig, inducing cavitation by acting on the reservoir’s pressure. The energy of the vi-brations of the pump body can be computed, using the signals acquired by using three mono-axial accelerometers
8 Valentino Cucit / Energy Procedia 00 (2018) 000–000
(properly installed on the centrifugal pump body). In facts, the amount of energy of acceleration signal (captured byan accelerometer in the component orthogonal to the flow direction) in the band from 10 to 12.8 kHz, may be usedeffectively to detect the incipient cavitation, by selecting a proper (condition-dependent) threshold. The proposed con-trol schemes rely on two different cavitation detectors, both based on the evaluation of the energy of the acquiredvibration signals; in both the schemes the controller acts on the centrifugal pump rotational speed, reducing it whencavitation occurs. In particular, the first proposed control scheme regulates the pump rotational speed, based on the ac-tual value of the energy-based cavitation indicator, bringing the indicator back to the nominal (cavitation-free) value,while the second control strategy allows to reduce the pump’s speed when a binary detector indicates the incipientcavitation, restoring the nominal speed when possible. The latter approach is rather general, because it relies on anydetector (based on the vibration signal energy) providing binary output (i.e. “-1” in the case of no cavitation, “+1”when cavitation occurs). The obtained results are promising and allow to further experiments, varying the pump size,and investigations, with the aim to develop an auto-tuning procedure for the proposed control schemes.
6. Acknowledgment
The authors are indebted to Prof. Diego Micheli for fruitful discussions and precious advises, and to MassimilianoKjuder for his support during the experiments.
References
[1] C. E. Brennen, Cavitation and bubble dynamics, Cambridge University Press, 2013.[2] M. Cudina, Detection of cavitation phenomenon in a centrifugal pump using audible sound, Mechanical systems and signal processing 17 (6)
(2003) 1335–1347.[3] N. Zhang, M. Yang, B. Gao, Z. Li, Vibration characteristics induced by cavitation in a centrifugal pump with slope volute, Shock and Vibration
2015.[4] A. Baldassarre, M. De Lucia, P. Nesi, Real-time detection of cavitation for hydraulic turbomachines, Real-Time Imaging 4 (6) (1998) 403–416.[5] M. Nasiri, M. Mahjoob, H. Vahid-Alizadeh, Vibration signature analysis for detecting cavitation in centrifugal pumps using neural networks,
in: Mechatronics (ICM), 2011 IEEE International Conference on, IEEE, 2011, pp. 632–635.[6] M. T. Shervani-Tabar, M. M. Ettefagh, S. Lotfan, H. Safarzadeh, Cavitation intensity monitoring in an axial flow pump based on vibration
signals using multi-class support vector machine, Proceedings of the Institution of Mechanical Engineers, Part C: Journal of MechanicalEngineering Science (2017) 0954406217729416.
[7] V. Vapnik, The nature of statistical learning theory, Springer science & business media, 2013.[8] V. Muralidharan, V. Sugumaran, V. Indira, Fault diagnosis of monoblock centrifugal pump using SVM, Engineering Science and Technology,
an International Journal 17 (3) (2014) 152–157.[9] F. Burlon, D. Micheli, R. Furlanetto, M. Simonato, V. Cucit, Cavitation detection and prevention in professional warewashing machines, Energy
Procedia 101 (2016) 718–725.[10] ISO, Rotodynamic pumps–hydraulic performance acceptance tests–grades 1, 2 and 3, International Standardization Organization, ISO 9906
(2012) 2012.[11] F. Burlon, D. Micheli, R. Furlanetto, M. Simonato, V. Cucit, Influence of polymer solution on pump performances, Energy Procedia 126 (2017)
722–729.[12] L. Chaparro, Signals and Systems using MATLAB, Academic Press, 2010.[13] F. Burlon, Energy efficiency improvement in professional ovens, Ph.D. thesis (2018).[14] B. Gao, P. Guo, N. Zhang, Z. Li, M. Yang, Experimental investigation on cavitating flow induced vibration characteristics of a low specific
speed centrifugal pump, Shock and Vibration 2017.[15] H. Kallingalthodi, Cavitation detection in a water jet propulsion unit, Master’s thesis (2009).[16] D. Buono, D. Siano, E. Frosina, A. Senatore, Gerotor pump cavitation monitoring and fault diagnosis using vibration analysis through the
employment of auto-regressive-moving-average technique, Simulation Modelling Practice and Theory 71 (2017) 61–82.[17] J. Lu, S. Yuan, S. Parameswaran, J. Yuan, X. Ren, Q. Si, Investigation on the vibration and flow instabilities induced by cavitation in a
centrifugal pump, Advances in Mechanical Engineering 9 (4) (2017) 1687814017696225.[18] N. Zhang, M. Yang, B. Gao, Z. Li, Investigation on vibration characteristics in a centrifugal pump with special slope volute, Advances in
Mechanical Engineering 7 (2) (2015) 936218.