a connectionist visual field analyzer - europe pubmed central
TRANSCRIPT

A Connectionist Visual Field Analyzer
David Coffey, B.S.Gordon Banks, Ph.D., M.D.
Department of NeurologyDecision Systems Laboratory
University of PittsburghPittsburgh, PA 15261
can be fruitfully considered. Examples of diag-noses include glaucoma, multiple sclerosis,stroke and tumors.2
We have built an artificial neural networkto analyze visual field maps. The program usesthe back-propagation method of learning and hasbeen trained with 62 different types of classi-cal visual field defects. When tested against 18unknowns, it was able to correctly classify 17of them. Connectionist networks are thus shownto be capable of efficiently recognizing two-dimensional geometric patterns.
Background
Visual field analysisWe have constructed a computer program
to assist in the diagnosis of human visual fielddefects using an artificial neural network. Theprogram simulates the skill neurologists andophthalmologists display when then they recog-nize and classify patterns represented in visualfield maps. The visual field map is a two dime-nsional representation of the ability of a patientto detect the presence of control objects con-fronting him at various angles from the positionof primary gaze (straight ahead) for each eyeand is measured using a device called a perime-ter.1 Normal persons have a blind spot in eachvisual field corresponding to the insensitivepart of the retina where the optic nerve exits,but any other regions of blind or diminishedsensitivity are abnormal. When a map is made ofthese abnormal regions (scotomata), the prop-erly trained physician can determine from thepattern of the scotoma the likely anatomicalsite of the causative lesion, whether retina,optic nerve or tract, visual radiations, or visualcerebral cortex. Once the site of damage isidentified, etiologic diagnoses which have a
predilection for damaging that particular site
0195-4210/89/0000/0276$01.00 C 1989 SCAMC, Inc.
While manually operated Goldmann-styleperimetry has been the preferred method ofneuro-ophthalmologists, fully automated peri-metry machines have been available and widelyused for some time. These machines, such asthe Octopus, have served as valuable screeningdevices, mainly in clinics which often lack theexpertise to properly interpret complex cases.The value of coupling such devices to an auto-matic interpretation program may be signifi-cant. There are several other potential benefitsof a program that can automatically interpretvisual fields. It could make any perimetry con-sultation more cost and time efficient by pro-viding a preliminary differential diagnosis andalerting the technician or physician as to thepossibility that the examination is flawed, sec-ondary to poor patient attention or other arti-facts. The program could also be useful in thesetting of neurologic ophthalmologic education.With the addition of a generator of artificialvisual fields, students could be presented testcases to interpret and then receive the pro-gram's interpretation. Unknown cases mightalso be given to the program by the trainee.
Previous work in automated visual field analysisKrakau3 and co-workers have developed a
system for computerized analysis of visual fieldmaps produced by automated perimeters. Theirmethod was to reduce the digitized data to aminimal set of 16 parameters which could besaid to specify a visual field with some degreeof uniqueness. The program extracted these pa-rameters from each of a set of sample cases andthen was prompted for the diagnosis. After theprogram was sufficiently trained in this manner,unknown cases could be presented to it.
276
Abstract

Unfortunately, in order for the machine to makethe diagnosis, the unknown set had to be identi-cal to one of the known sets. In other words,there was no ability to generalize from datathat varied from what it had already been shown.
Neural NetworksWhile Krakau's system exhibits some of
the features of machine learning, it is really analgorithmic model and bears little relation towhat we know of visual processing and patternrecognition in humans. The human visual systemis specially wired to facilitate rapid recognitionof objects of various shapes, colors, and tex-tures, and to associate them with symbols andconcepts. The process by which this is done isnot easily captured in conventional logic pro-gramming. It is our belief that the visual fieldexpert reads the fields almost instantaneouslyby recognizing patterns with which he has hadmuch past experience. While the nature of theunderlying human cognitive processes allowingsuch rapid recognition are still subject to muchdebate, many feel that it occurs without the useof symbolic reasoning and that the"connectionist" computational model4, which ishighly parallel, employs principles analogous tothe those operative in brain processing. Wewere interested in exploring the possibility thata visual field classifier could be practicallyimplemented in a computer program using a con-nectionist architecture. As well as providing apractical tool to assist in medical diagnosis,this may also serve to illuminate the possibili-ties of applying similar techniques to solvingmore difficult problems (e.g., recognition of ab-normalities in two and three dimensionalradiographic and magnetic resonance images).
Methods
Neural NetworksFigure 1 (after Rumelhart, et aT5) shows a
multilayer connectionist network. The units onthe left are called the input units. Differentstimuli will activate different patterns of inputunits. The units on the right are called the out-put units. The network will activate one ormore of the output units in response to theinput. The pattern of output activation repre-sents the network's solution to the problem ofclassification of the input unit stimulus. Theconnections between the units control thespreading of the activation from the input unitsto the output units according to weights as-signed to each connection. The "hidden" units
intermediate between the input and output unitsserve to govern the classification process.These artificial neural networks can be designedto solve problems in various ways. One of themost interesting and popular methods is to trainthe network to classify the input patterns cor-rectly by presenting data and giving it feedbackabout the appropriateness of the network's out-put. There are several ways of doing this, butprobably the most commonly employed is amethod called back-propagation. In this method,the network's input nodes are repeatedly acti-vated by an input vector and the activation ofthe output nodes is checked. After each presen-tation, the weights of the connections are ad-justed in such a way as to incrementally de-crease the activation of the output nodes whichrepresent incorrect classifications thus in-creasing the activation of the node representingthe correct classification. The algorithm forperforming the adjustment is called thegeneralized delta rule.6 To shorten developmenttime, we used a connectionist simulator calledNeuralWorks Professional 11.7 This package,running on an 80386-based microcomputerequipped with a 80387 math co-processor fa-cilitated rapid prototyping of networks.
Input Hidden OutputUnits Units Units
Figure 1. Multilayer Network
277
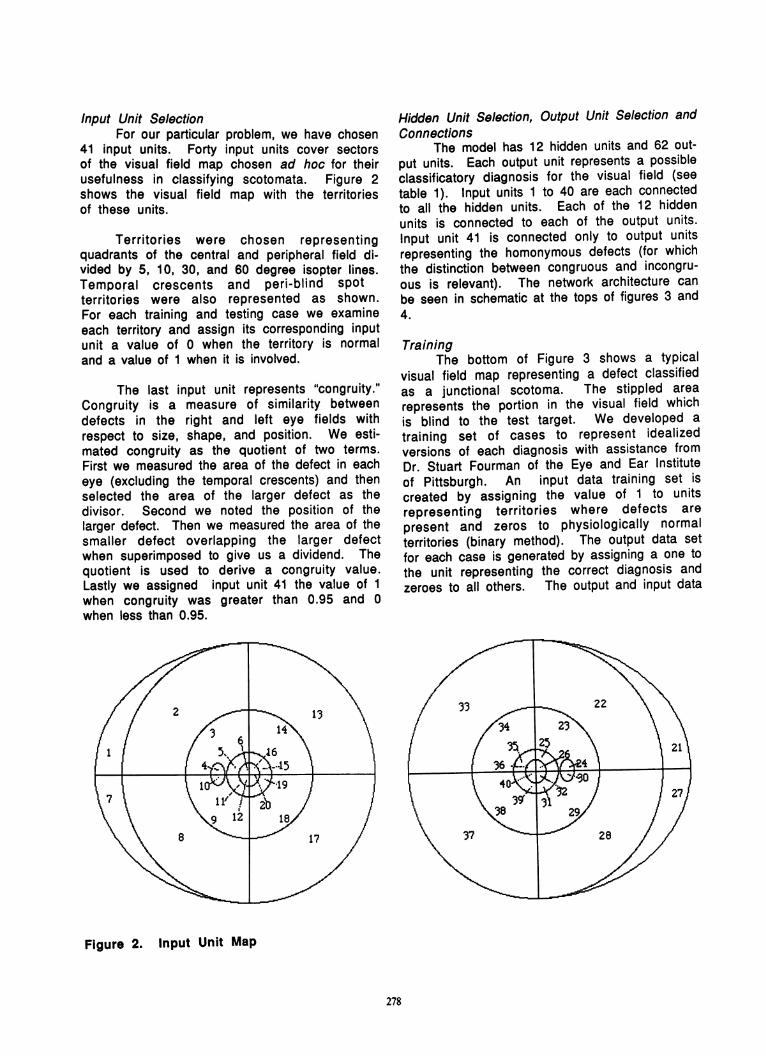
Input Unit SelectionFor our particular problem, we have chosen
41 input units. Forty input units cover sectorsof the visual field map chosen ad hoc for theirusefulness in classifying scotomata. Figure 2shows the visual field map with the territoriesof these units.
Territories were chosen representingquadrants of the central and peripheral field di-vided by 5, 10, 30, and 60 degree isopter lines.Temporal crescents and peri-blind spotterritories were also represented as shown.For each training and testing case we examineeach territory and assign its corresponding inputunit a value of 0 when the territory is normaland a value of 1 when it is involved.
The last input unit represents "congruity."Congruity is a measure of similarity betweendefects in the right and left eye fields withrespect to size, shape, and position. We esti-mated congruity as the quotient of two terms.First we measured the area of the defect in eacheye (excluding the temporal crescents) and thenselected the area of the larger defect as thedivisor. Second we noted the position of thelarger defect. Then we measured the area of thesmaller defect overlapping the larger defectwhen superimposed to give us a dividend. Thequotient is used to derive a congruity value.Lastly we assigned input unit 41 the value of 1when congruity was greater than 0.95 and 0when less than 0.95.
Hidden Unit Selection, Output Unit Selection andConnections
The model has 12 hidden units and 62 out-put units. Each output unit represents a possibleclassificatory diagnosis for the visual field (seetable 1). Input units 1 to 40 are each connectedto all the hidden units. Each of the 12 hiddenunits is connected to each of the output units.Input unit 41 is connected only to output unitsrepresenting the homonymous defects (for whichthe distinction between congruous and incongru-ous is relevant). The network architecture canbe seen in schematic at the tops of figures 3 and4.
TrainingThe bottom of Figure 3 shows a typical
visual field map representing a defect classifiedas a junctional scotoma. The stippled arearepresents the portion in the visual field whichis blind to the test target. We developed a
training set of cases to represent idealizedversions of each diagnosis with assistance fromDr. Stuart Fourman of the Eye and Ear Instituteof Pittsburgh. An input data training set iscreated by assigning the value of 1 to unitsrepresenting territories where defects are
present and zeros to physiologically normalterritories (binary method). The output data setfor each case is generated by assigning a one tothe unit representing the correct diagnosis andzeroes to all others. The output and input data
Figure 2. Input Unit Map
278

from a case comprise a training vector. Oncethe input units are set and processed, the outputunits are checked to see what classification hasresulted. We used the back propagation learningrule to reduce the weight on connections tooutput units that have been activated incor-rectly. One pass of the entire training set iscalled a cycle. We randomly shuffled the orderof the training vectors between cycles toprevent biasing the weights toward cases at thebeginning of the set. Initially, the activation ofthe output units is uniform but as the process isrepeated with the same training cases thousandsof times, the system converges such that theoutput unit representing the correct diagnosis isthe only one activated significantly by that par-ticular set of input units representing the testvisual field defect. This process is thenrepeated with all visual field defects represent-ing the possible diagnoses.
Resu Its
The training procedure described abovewas applied with 89 visual field training cases.Training continued until the sum of the absolutevalue of the error in all output units was lessthan 0.03 for all cases. It took 2350 iterationsto accomplish this goal. After training, presen-tation of any case which is identical to any ofthe training cases will, of course produce theactivation of the corresponding diagnosis, (asKrakau's system does). The advantage of theneural network model is seen when patterns arepresented that are novel to the system. Then theinput activation will spread through the systemresulting in activation of the output node(s)corresponding most closely to the most similarcases for which the system has been trained.
Rignt 4uncticng1i S;ome
Hopefully, such behavior will result in correctclassification of the input fields. Verificationof the program's ability to classify unknownfields was done using Bajandas and Kline'sNeuro-ophthalmology Review Manual.8 This is aboard review manual which contains a set ofpractice unknowns and answers (some quitechallenging). This set contained 18 unknownsrepresenting single lesions. The system wasable to correctly classify 17 of these exer-cises.
The bottom of Figure 3 shows one of theunknown field exercises from Bajandas and Klinerepresenting a right junctional scotoma which issomewhat less full that the one on which thesystem was trained. The input units 3-6, 9-12,23-26, 29-32, 34-36, and 38-40 are activatedas indicated in the figure by their enlarged size.The top of Figure 3 is a representation of thefinal state of the network indicating thatdespite the input not being identical to thetraining case, the system correctly generalizedto diagnose junctional scotoma. Note that thesize of each unit corresponds to its degree ofactivation and that the density of the linkweights between nodes corresponds to relativestrength of the contribution to the activation ofits target unit. Figure 4 shows a further exam-ple of an unusual bitemporal hemianopia whichmarkedly differed from the classic trainingcase.
.SI2I4gs7ggIs I I I i sI aIaI1
Figure 3. Junctional Scotoma

Discussion.
This program demonstrates the feasibilityof using a connectionist network for patternrecognition of simple two-dimensional shapes(the performance of the system on the unknownswas nearly perfect) and the ability of neuralnetworks to generalize: when given novel visualfield defects, it will try to fit it as closely aspossible to the training set, rather than failcompletely, as in the case of the Krakau system.Also, connectionist systems are often tolerantof errors in the input data. On one occasionwhile testing the system with the unknownshown in figure 4, input units 4 and 10 wereactivated (incorrectly). The system still wasable to correctly diagnose a bitemporalhemianopia.
In back-propagation neural networks, thehidden units which are intermediate between theinput and output nodes develop a configurationwhich aids the final output classification. Thecurrent version of our model has has not yetbeen pruned sufficiently to allow a meaningfulinterpretation of the hidden layer, but thestructure of the hidden units of an earliermodel, dedicated to recognizing only homony-mous defects, was interesting. Two of the hid-den units were strongly activated by activationof the macular input units. Three other hiddenunits were activated by quadrantanopias, oneeach for right inferior, right superior, and leftsuperior. The last hidden unit acted as a diago-nal line detector.
aitemporei nemanloi;a
~~~~'2 23 dA,Sb#me:sI~
One of the deficiencies of the artificialneural network is its inability to easily provideexplanations for how it arrived at a particularclassification. Humans have similar problems:how does one explain the method by which onerecognizes the face of his wife, for example?Certainly one could recapitulate a list of thewife's features, but these are rationalizationswhich are unlikely to mirror the actualprocessing in the visual system. This is sug-gested by the existence of patients with lesionsof the visual association cortex who develop theinability to recognize faces (prosopagnosia) de-spite being able to verbally describe thefeatures of their loved ones. If explanatorypower is desired of artificial neural networks,an additional module will have to be constructedfor that purpose.
We intend to continue developing thissystem, extending it to deal with clinical casesgenerated by the Octopus and Humphrey auto-mated perimeters. We also plan to add 10 moreclassifications of visual field defects to theoutput layer and train the model to classifymultiple lesion cases.
The main problem in extending a visualpattern analyzer such as this program to domore complex tasks such as recognition ofstructures and lesions in neuroimages, such asCT and MRI scans probably lies in the number ofinput units necessary to cover the resolutionthat would be needed for such analysis. With theadvent of VLSI devices which implement neuralnetwork hardware, solution of this problem maybe facilitated.
07 Oi006 O's 0" 0 1111 t1lb~~~~~~~~~~~.
280

Unit#55565758
HomonymousLeft5960616263646566676869707172
DefectsRight7374757677787980818283848586
Non-Homonymous Defe87888990919293949596979899100101
102103104105106107108109110111112113114115116
ClassificationNormalBitemporal HemianopiaCentral Bitemporal HemianopiaPseudo Bitemporal Hemianopia
Junctional ScotomaHemianopia, CongruousCentral HemianopiaHemianopia with Temporal Crescent SparingHemianopia with Macular Sparing, CongruousHemianopia, IncongruousSuperior Quadrantanopia with Macular Sparing, CongruousSuperior Quadrantanopia, IncongruousSuperior Quadrantanopia with Macular Splitting, CongruousSuperior Quadrantanopia, CentralInferior Quadrantanopia with Macular Sparing, CongruousInferior Quadrantanopia, IncongruousInferior Quadrantanopia with Macular Splitting, CongruousInferior Quadrantanopia, Central
ictsParacentral ScotomaRing ScotomaTubular FieldsCentral ScotomaCentrocecal ScotomaSuperior SectoranopiaSuperior Seidel ScotomaSuperior Arcuate ScotomaSuperior Altitudinal ScotomaSuperior Nasal StepInferior SectoranopiaInferior Seidel ScotomaInferior Arcuate ScotomaInferior Altitudinal ScotomaInferior Nasal Step
Table 1. Output Unit Assignments
281

References
1. Anderson DP (1982) Testing the Field ofVision. St. Louis, Mosby.
2. Glaser JS (1978) Neuro-ophthalmology. NewYork, Harper & Row.
3. Krakau CET & Holmin C (1985) Computerizedanalysis of visual fields. 2nd Europeanglaucoma symposium, Helsinki, 1984.Amsterdam, Dr. W. Junk. pp. 35-40.
4. McClelland JL & Rumelhart DE, eds (1986)Parallel Distributed Processing.Explorations in the Microstructure ofCognition. 2 vols. Cambridge MA, MITPress.
5. ibid vol 1. p. 3206. Rumelhard DE et al (1986) Learning internal
representations by error propagation. In:McClelland & Rumelhart, PDP op cit vol 1pp. 318-361.
7. NeuralWare Inc. Sewickley, PA.8. Bajandas FJ & Kline LB (1987) Neuro-
ophthalmology Review Manual. 2nd Ed.Thorofare NJ, Slack, Inc.
Acknowledgements
We would like to thank the Highland DriveVeterans Administration Medical Center inPittsburgh for granting us use of their comput-ing facilities.
282