a computerized analysis of the entire retinal ganglion ... · a computerized analysis of the entire...
TRANSCRIPT
Vision Research 49 (2009) 115–126
Contents lists available at ScienceDirect
Vision Research
journal homepage: www.elsevier .com/locate /v isres
A computerized analysis of the entire retinal ganglion cell populationand its spatial distribution in adult rats
M. Salinas-Navarro a,1, S. Mayor-Torroglosa a,1, M. Jiménez-López a,1, M. Avilés-Trigueros a,T.M. Holmes b, R.D. Lund c, M.P. Villegas-Pérez a, M. Vidal-Sanz a,*
a Laboratorio de Oftalmología Experimental, Facultad de Medicina, Universidad de Murcia, E-30100 Murcia, Spainb Catherine McCauley Centre, University College Dublin, Dublin, Irelandc Casey Eye Institute, Oregon Health and Sciences University, Portland, OR, USA
a r t i c l e i n f o a b s t r a c t
Article history:Received 25 June 2008Received in revised form 12 September 2008
Keywords:Retinal ganglion cellsVisual streakFluorescent tracersComputerized image analysisRetinaRatRetrograde labelling
0042-6989/$ - see front matter � 2008 Elsevier Ltd. Adoi:10.1016/j.visres.2008.09.029
* Corresponding author. Fax: +34 968 36 39 62.E-mail address: [email protected] (M. Vidal-Sanz).
1 These authors have contributed equally towards th
In adult albino (SD) and pigmented (PVG) rats the entire population of retinal ganglion cells (RGCs) wasquantified and their spatial distribution analyzed using a computerized technique. RGCs were back-labelled from the optic nerves (ON) or the superior colliculi (SCi) with Fluorogold (FG). Numbers of RGCslabelled from the ON [SD: 82,818 ± 3,949, n = 27; PVG: 89,241 ± 3,576, n = 6) were comparable to thoselabelled from the SCi [SD: 81,486 ± 4,340, n = 37; PVG: 87,229 ± 3,199; n = 59]. Detailed methodologyto provide cell density information at small scales demonstrated the presence of a horizontal region inthe dorsal retina with highest densities, resembling a visual streak.
� 2008 Elsevier Ltd. All rights reserved.
1. Introduction
The retinofugal system of the adult rat has been used extensivelyas an experimental model to study anatomical, physiological andbehavioural aspects of regeneration (Avilés-Trigueros, Sauvé, Lund,& Vidal-Sanz, 2000; Sasaki et al., 1996; Vidal-Sanz, Avilés-Trigueros,Whiteley, Sauvé, & Lund, 2002; Vidal-Sanz, Bray, Villegas-Pérez,Thanos, & Aguayo, 1987; Vidal-Sanz, Villegas-Pérez, Bray, & Aguayo,1993; Whiteley, Sauvé, Avilés-Trigueros, Vidal-Sanz, & Lund, 1998),degeneration (Lafuente, Villegas-Pérez, et al., 2002; Lund et al., 2007;Villegas-Pérez, Lawrence, Vidal-Sanz, Lavail, & Lund, 1998; Villegas-Pérez, Vidal-Sanz, Bray, & Aguayo, 1988; Villegas-Pérez, Vidal-Sanz,& Lund, 1996; Villegas-Pérez, Vidal-Sanz, Rasminsky, Bray, &Aguayo, 1993) and neuroprotection (Avilés-Trigueros et al., 2003;Lafuente López-Herrera, Mayor-Torroglosa, Miralles de Imperial,Villegas-Pérez, & Vidal-Sanz, 2002; Lund et al., 2007; Mayor-Tor-roglosa et al., 2005; Vidal-Sanz, et al., 2000; Vidal-Sanz, De la Villa,et al., 2007) in the mammalian central nervous system. Indeed, theuse of retrogradely transported neuronal tracers to identify theRGC population has allowed investigations into the effects of severaltypes of injuries to the primary visual pathway and quantification ofRGC survival (Lafuente, Villegas-Pérez, et al., 2002; Peinado-Ramón,
ll rights reserved.
is work.
Salvador, Villegas-Pérez, & Vidal-Sanz, 1996; Sellés-Navarro,Villegas-Pérez, Salvador-Silva, Ruiz-Gómez, & Vidal-Sanz, 1996).Moreover, orthogradely transported neuronal tracers have madeit possible to identify not only fine retinofugal projections(Avilés-Trigueros et al., 2000), but also to quantify the volume ofthe retinotectal afferents to the contralateral visual layers of thesuperior colliculus (SC) in normal circumstances and after a lesion(Avilés-Trigueros et al., 2003; Mayor-Torroglosa et al., 2005).
Previous studies have indicated that a majority of RGCs projectto the superior colliculi (SCi) (Lund, 1965; Perry, 1981) where RGCsaxons deploy in a very precise topographic manner (Linden & Per-ry, 1983; Sauvé, Girman, Wang, Keegan, & Lund, 2002; Sauvé, Gir-man, Wang, Lawrence, & Lund, 2001), but to date the exactmagnitude of this projection has not been quantified. The ratRGC population is distributed throughout the retina in a central-peripheral gradient and some authors have found a region withhighest RGC density in the dorsal temporal retina (Dreher, Sefton, Ni,& Nisbett, 1985; Fukuda, 1977; Jeffery, 1985; McCall, Robinson, &Dreher, 1987; Perry, 1981; Reese & Cowey, 1986; Schober & Gru-schka, 1977), but whether they adopt some form of regional spe-cialization remains controversial (Danias et al., 2002; Reese,2002). The Sprague–Dawley (SD) and Piebald Virol Glaxo (PVG)Brown Norway strains of rats with non-pigmented and pigmentedeyes, respectively, are commonly employed for a number of exper-imental approaches aimed at studying injury-induced RGC loss andits prevention, thus it was of interest to determine, as a baseline for
116 M. Salinas-Navarro et al. / Vision Research 49 (2009) 115–126
future studies, the population of RGCs in these rats, the proportionof this population responsible for the retinotectal projection aswell as their spatial distribution within the retina.
Using retrogradely transported tracers to label the entire RGCpopulation and an automated methodology to count fluorogold(FG)-labelled RGCs (Danias et al., 2002; Salinas-Navarro et al.,2005) and to represent their detailed spatial distribution (Vidal-Sanz, Salinas-Navarro, et al., 2007; Villegas-Pérez et al., 2006), we re-port the numbers of rat RGCs that project along the optic nerve bothin albino and pigmented adult rats. We have also determined thepopulation of RGCs that project to the main target regions in thebrain, the superior colliculi (SCi), and estimated the magnitude ofthe proportion of RGCs contributing to the retinotectal projection,providing direct evidence for the massive retinotectal projection inthe retinofugal system of adult rats. We have also analysed the spa-tial distribution of RGCs within the retina using detailed isodensitymaps, and found that there is a horizontally oriented region in thedorsal retina that contains the highest densities of RGCs, adoptingthe form of a visual streak (parts of this work have been presentedin abstract form, Salinas-Navarro et al., 2005;Vidal-Sanz, Salinas-Navarro, et al., 2007; Villegas-Pérez et al., 2006).
2. Materials and methods
2.1. Animals and anesthetics
Experiments were performed on 33 albino Sprague–Dawley (SD)(33 female) and 33 pigmented Piebald Virol Glaxo (PVG) Brown Nor-way (5 male and 28 female) adult (180–200 g) rats, obtained fromthe breeding colony of the University of Murcia (Murcia, Spain). Ratswere housed in temperature and light controlled rooms with a 12 hlight/dark cycle and had food and water ad libitum. Light intensitywithin the cages ranged from 9 to 24 lux. Animal manipulations fol-lowed institutional guidelines, European Union regulations for theuse of animals in research and the ARVO statement for the use of ani-mals in ophthalmic and vision research. Moreover, adequate mea-sures were taken to minimize pain or discomfort.
Surgical manipulations were carried out under general anesthe-sia induced with an intraperitoneal (i.p.) injection of a mixture ofketamine (70 mg/kg, Ketolar�, Parke-Davies, S.L., Barcelona, Spain)and xylazine (10 mg/kg, Rompún�, Bayer, S.A., Barcelona, Spain).During recovery from anaesthesia, rats were placed in their cages,and an ointment containing neomycin and prednisone (Oftalmol-osa Cusí Prednisona-Neomicina�; Alcon S.A., Barcelona, Spain)was applied on the cornea to prevent corneal desiccation. Animalswere sacrificed with an i.p. injection of an overdose of pentobarbi-tal (Dolethal Vetoquinol�, Especialidades Veterinarias, S.A., Alcob-endas, Madrid, Spain).
2.2. Retrograde labelling
2.2.1. Retrograde labelling from the optic nerveTo quantify the entire RGC population, FG was applied to the
intraorbitally transected ON following previously described meth-ods (Vidal-Sanz, Villegas-Pérez, Bray, & Aguayo, 1988; Villegas-Pérez et al., 1993) in 14 (female) SD and 3 (female) PVG rats. Inbrief, a small pledget of gelatine sponge soaked in saline containing3% Fluorogold� (FG) (Fluorochrome Inc., Engelwood, CO, USA) and10% dimethyl sulphoxide (DMSO) was applied to the ocular stumpof the cut optic nerve, approximately 3 mm from the optic disc(Lafuente López-Herrera, et al., 2002; Villegas-Pérez et al., 1993),and the animals processed 3 days later.
2.2.2. Retrograde labelling from the superior colliculiTo identify the population of RGCs that project to the superior
colliculi (SCi), their main target territory in the brain, we applied
the fluorescent tracer FG to both SCi in 19 (female) SD and 30(25 female; 5 male) PVG rats, following previously described meth-ods (Vidal-Sanz et al., 1988) that are standard in our laboratory. Inbrief, after exposing the midbrain, a small pledget of gelatinesponge (Espongostan� Film, Ferrosan A/S, Denmark) soaked in sal-ine containing 3% FG and 10% DMSO was applied over the entiresurface of both SCi.
2.2.3. Double labeling of retinal ganglion cellsTo further study the spatial distribution of RGCs, and to investi-
gate whether the appearance of a RGC high-density region withinthe dorsal retina was the consequence of an artifact due to thelabeling from the SCi, in 12 additional adult female SD rats we ap-plied two retrogradely transported tracers with different fluores-cence properties: FG and dextran tetramethylrhodamine (DTMR;3000 MW; Molecular Probes, Inc. Eugene, OR, USA). FG was appliedto both SCi and, 5 days later and 48 h prior to processing, smallcrystals of DMTR were applied to the ocular stump of the rightON, which had been intraorbitally sectioned approximately 2 mmfrom the eye, following previously described methods (LafuenteLópez-Herrera et al., 2002). DMTR diffuses passively through theaxon towards the cell soma producing an intense cell labelling(WoldeMussie, Ruiz, Wijono, & Wheeler, 2001). In these animals,DMTR would label the entire retinofugal projection whereas FGwould label only RGCs projecting to the SCi.
2.3. Tissue processing
Rats were deeply anesthetized, perfused transcardially throughthe ascending aorta first with saline and then with 4% paraformal-dehyde in 0.1 M phosphate buffer (PB) (pH 7.4). For the presentstudies determining retinal orientation is crucial, thus special carewas taken to maintain the orientation of each eye. Right after deepanesthesia and before fixation a suture was placed on the dorsalpole of each eye. Furthermore, the rectus muscle insertion intothe dorsal part of the eye, as well as, the nasal caruncle were usedas additional landmarks. Retinas from both eyes were dissected asflattened whole-mounts by making four radial cuts (the deepestone in the dorsal pole), post-fixed for an additional hour in thesame fixative, rinsed in 0.1 M PB, mounted vitreal side up onsubbed slides and covered with anti-fading mounting media con-taining 50% glycerol and 0.04% p-phenylenediamine in 0.1 M so-dium carbonate buffer (pH 9.0).
2.4. Retinal analysis
Retinas were examined and photographed under a fluorescencemicroscope (Axioscop 2 Plus; Zeiss Mikroskopie, Jena, Germany)equipped with an ultraviolet (BP 365/12, LP 397) filter that allowsthe observation of the white-gold FG-fluorescence, and with a rho-damine (BP 450–490, LP 520) filter that allows the observation ofthe orange-red DTMR fluorescence. The microscope was alsoequipped with a digital high-resolution camera (ProgResTM C10,Jenoptik, Jena, Germany), computer-driven motorized stage (Pro-ScanTM H128 Series, Prior Scientific Instruments, Cambridge, UK),controlled by IPP (IPP 5.1 for Windows�; Media Cybernetics, SilverSpring, MD, USA) with a microscope controller module (Scope-Pro�
5.0 for Windows�; Media Cybernetics, Silver Spring, MD, USA),following standard procedures in our laboratory (LafuenteLópez-Herrera, et al., 2002; Vidal-Sanz, Lafuente, Mayor, Mirallesde Imperial, & Villegas-Pérez, 2001). To make reconstructions ofretinal whole-mounts, retinal multiframe acquisitions were ac-quired in a raster scan pattern using a x10 objective (Plan-Neofluar,10�/0.30; Zeiss Mikroskopie, Jena, Germany). Single frames werefocused manually prior to the capture of the digitized images.The scan area covers the entire retina and with a frame size of
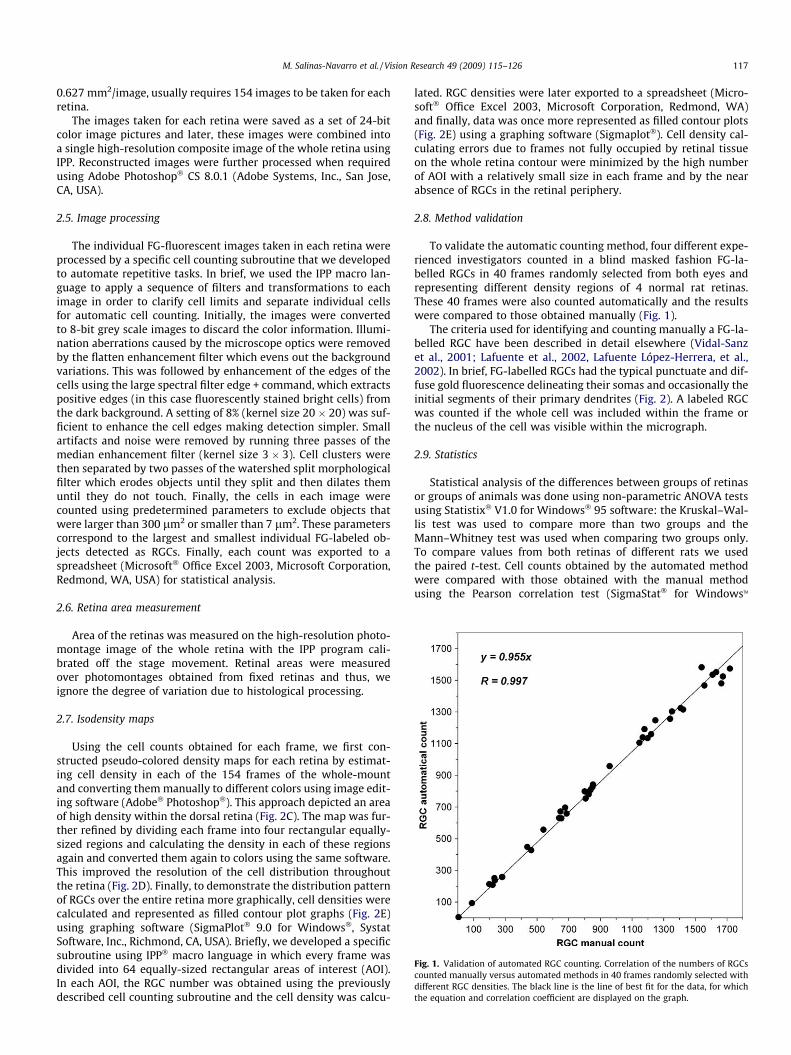
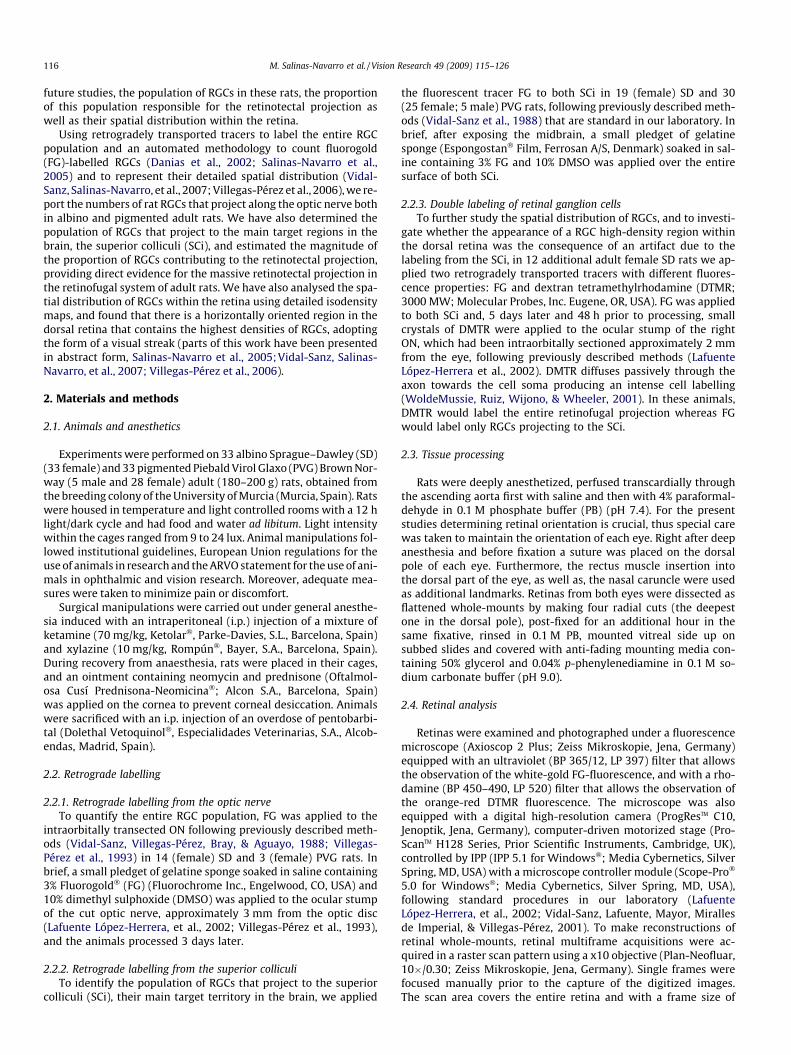
Fig. 1. Validation of automated RGC counting. Correlation of the numbers of RGCscounted manually versus automated methods in 40 frames randomly selected withdifferent RGC densities. The black line is the line of best fit for the data, for whichthe equation and correlation coefficient are displayed on the graph.
M. Salinas-Navarro et al. / Vision Research 49 (2009) 115–126 117
0.627 mm2/image, usually requires 154 images to be taken for eachretina.
The images taken for each retina were saved as a set of 24-bitcolor image pictures and later, these images were combined intoa single high-resolution composite image of the whole retina usingIPP. Reconstructed images were further processed when requiredusing Adobe Photoshop� CS 8.0.1 (Adobe Systems, Inc., San Jose,CA, USA).
2.5. Image processing
The individual FG-fluorescent images taken in each retina wereprocessed by a specific cell counting subroutine that we developedto automate repetitive tasks. In brief, we used the IPP macro lan-guage to apply a sequence of filters and transformations to eachimage in order to clarify cell limits and separate individual cellsfor automatic cell counting. Initially, the images were convertedto 8-bit grey scale images to discard the color information. Illumi-nation aberrations caused by the microscope optics were removedby the flatten enhancement filter which evens out the backgroundvariations. This was followed by enhancement of the edges of thecells using the large spectral filter edge + command, which extractspositive edges (in this case fluorescently stained bright cells) fromthe dark background. A setting of 8% (kernel size 20 � 20) was suf-ficient to enhance the cell edges making detection simpler. Smallartifacts and noise were removed by running three passes of themedian enhancement filter (kernel size 3 � 3). Cell clusters werethen separated by two passes of the watershed split morphologicalfilter which erodes objects until they split and then dilates themuntil they do not touch. Finally, the cells in each image werecounted using predetermined parameters to exclude objects thatwere larger than 300 lm2 or smaller than 7 lm2. These parameterscorrespond to the largest and smallest individual FG-labeled ob-jects detected as RGCs. Finally, each count was exported to aspreadsheet (Microsoft� Office Excel 2003, Microsoft Corporation,Redmond, WA, USA) for statistical analysis.
2.6. Retina area measurement
Area of the retinas was measured on the high-resolution photo-montage image of the whole retina with the IPP program cali-brated off the stage movement. Retinal areas were measuredover photomontages obtained from fixed retinas and thus, weignore the degree of variation due to histological processing.
2.7. Isodensity maps
Using the cell counts obtained for each frame, we first con-structed pseudo-colored density maps for each retina by estimat-ing cell density in each of the 154 frames of the whole-mountand converting them manually to different colors using image edit-ing software (Adobe� Photoshop�). This approach depicted an areaof high density within the dorsal retina (Fig. 2C). The map was fur-ther refined by dividing each frame into four rectangular equally-sized regions and calculating the density in each of these regionsagain and converted them again to colors using the same software.This improved the resolution of the cell distribution throughoutthe retina (Fig. 2D). Finally, to demonstrate the distribution patternof RGCs over the entire retina more graphically, cell densities werecalculated and represented as filled contour plot graphs (Fig. 2E)using graphing software (SigmaPlot� 9.0 for Windows�, SystatSoftware, Inc., Richmond, CA, USA). Briefly, we developed a specificsubroutine using IPP� macro language in which every frame wasdivided into 64 equally-sized rectangular areas of interest (AOI).In each AOI, the RGC number was obtained using the previouslydescribed cell counting subroutine and the cell density was calcu-
lated. RGC densities were later exported to a spreadsheet (Micro-soft� Office Excel 2003, Microsoft Corporation, Redmond, WA)and finally, data was once more represented as filled contour plots(Fig. 2E) using a graphing software (Sigmaplot�). Cell density cal-culating errors due to frames not fully occupied by retinal tissueon the whole retina contour were minimized by the high numberof AOI with a relatively small size in each frame and by the nearabsence of RGCs in the retinal periphery.
2.8. Method validation
To validate the automatic counting method, four different expe-rienced investigators counted in a blind masked fashion FG-la-belled RGCs in 40 frames randomly selected from both eyes andrepresenting different density regions of 4 normal rat retinas.These 40 frames were also counted automatically and the resultswere compared to those obtained manually (Fig. 1).
The criteria used for identifying and counting manually a FG-la-belled RGC have been described in detail elsewhere (Vidal-Sanzet al., 2001; Lafuente et al., 2002, Lafuente López-Herrera, et al.,2002). In brief, FG-labelled RGCs had the typical punctuate and dif-fuse gold fluorescence delineating their somas and occasionally theinitial segments of their primary dendrites (Fig. 2). A labeled RGCwas counted if the whole cell was included within the frame orthe nucleus of the cell was visible within the micrograph.
2.9. Statistics
Statistical analysis of the differences between groups of retinasor groups of animals was done using non-parametric ANOVA testsusing Statistix� V1.0 for Windows� 95 software: the Kruskal–Wal-lis test was used to compare more than two groups and theMann–Whitney test was used when comparing two groups only.To compare values from both retinas of different rats we usedthe paired t-test. Cell counts obtained by the automated methodwere compared with those obtained with the manual methodusing the Pearson correlation test (SigmaStat� for WindowsTM
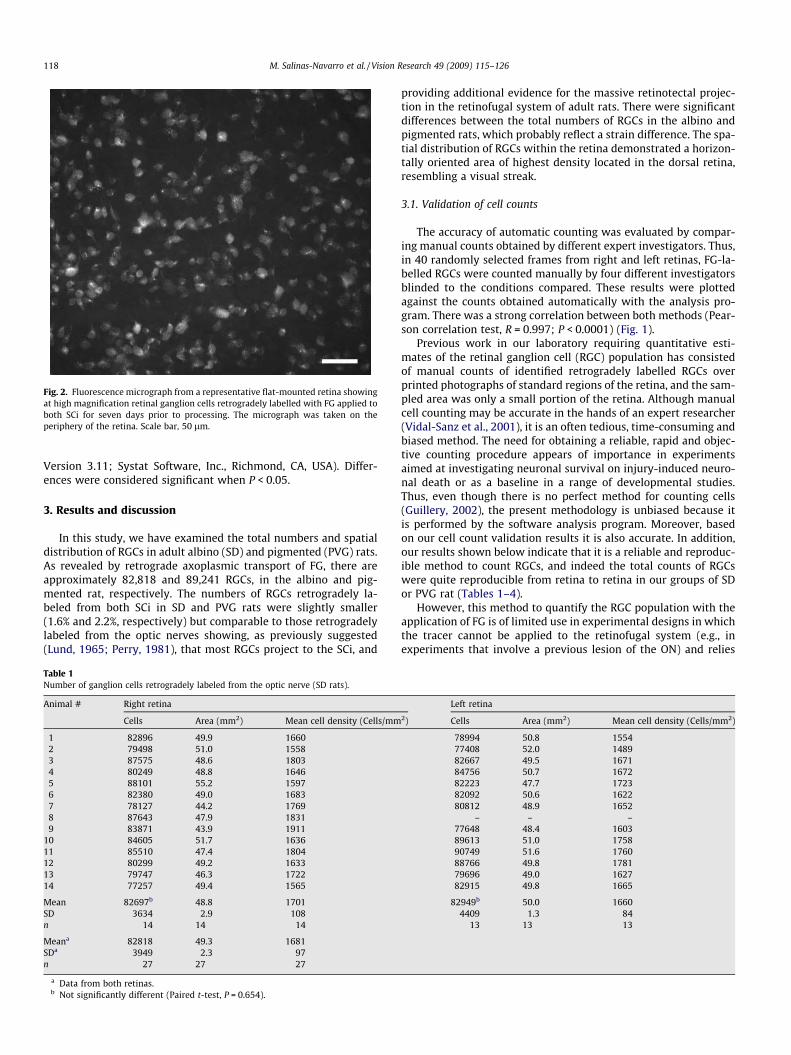
Fig. 2. Fluorescence micrograph from a representative flat-mounted retina showingat high magnification retinal ganglion cells retrogradely labelled with FG applied toboth SCi for seven days prior to processing. The micrograph was taken on theperiphery of the retina. Scale bar, 50 lm.
118 M. Salinas-Navarro et al. / Vision Research 49 (2009) 115–126
Version 3.11; Systat Software, Inc., Richmond, CA, USA). Differ-ences were considered significant when P < 0.05.
3. Results and discussion
In this study, we have examined the total numbers and spatialdistribution of RGCs in adult albino (SD) and pigmented (PVG) rats.As revealed by retrograde axoplasmic transport of FG, there areapproximately 82,818 and 89,241 RGCs, in the albino and pig-mented rat, respectively. The numbers of RGCs retrogradely la-beled from both SCi in SD and PVG rats were slightly smaller(1.6% and 2.2%, respectively) but comparable to those retrogradelylabeled from the optic nerves showing, as previously suggested(Lund, 1965; Perry, 1981), that most RGCs project to the SCi, and
Table 1Number of ganglion cells retrogradely labeled from the optic nerve (SD rats).
Animal # Right retina
Cells Area (mm2) Mean cell density (Cells/mm
1 82896 49.9 16602 79498 51.0 15583 87575 48.6 18034 80249 48.8 16465 88101 55.2 15976 82380 49.0 16837 78127 44.2 17698 87643 47.9 18319 83871 43.9 1911
10 84605 51.7 163611 85510 47.4 180412 80299 49.2 163313 79747 46.3 172214 77257 49.4 1565
Mean 82697b 48.8 1701SD 3634 2.9 108n 14 14 14
Meana 82818 49.3 1681SDa 3949 2.3 97n 27 27 27
a Data from both retinas.b Not significantly different (Paired t-test, P = 0.654).
providing additional evidence for the massive retinotectal projec-tion in the retinofugal system of adult rats. There were significantdifferences between the total numbers of RGCs in the albino andpigmented rats, which probably reflect a strain difference. The spa-tial distribution of RGCs within the retina demonstrated a horizon-tally oriented area of highest density located in the dorsal retina,resembling a visual streak.
3.1. Validation of cell counts
The accuracy of automatic counting was evaluated by compar-ing manual counts obtained by different expert investigators. Thus,in 40 randomly selected frames from right and left retinas, FG-la-belled RGCs were counted manually by four different investigatorsblinded to the conditions compared. These results were plottedagainst the counts obtained automatically with the analysis pro-gram. There was a strong correlation between both methods (Pear-son correlation test, R = 0.997; P < 0.0001) (Fig. 1).
Previous work in our laboratory requiring quantitative esti-mates of the retinal ganglion cell (RGC) population has consistedof manual counts of identified retrogradely labelled RGCs overprinted photographs of standard regions of the retina, and the sam-pled area was only a small portion of the retina. Although manualcell counting may be accurate in the hands of an expert researcher(Vidal-Sanz et al., 2001), it is an often tedious, time-consuming andbiased method. The need for obtaining a reliable, rapid and objec-tive counting procedure appears of importance in experimentsaimed at investigating neuronal survival on injury-induced neuro-nal death or as a baseline in a range of developmental studies.Thus, even though there is no perfect method for counting cells(Guillery, 2002), the present methodology is unbiased because itis performed by the software analysis program. Moreover, basedon our cell count validation results it is also accurate. In addition,our results shown below indicate that it is a reliable and reproduc-ible method to count RGCs, and indeed the total counts of RGCswere quite reproducible from retina to retina in our groups of SDor PVG rat (Tables 1–4).
However, this method to quantify the RGC population with theapplication of FG is of limited use in experimental designs in whichthe tracer cannot be applied to the retinofugal system (e.g., inexperiments that involve a previous lesion of the ON) and relies
Left retina
2) Cells Area (mm2) Mean cell density (Cells/mm2)
78994 50.8 155477408 52.0 148982667 49.5 167184756 50.7 167282223 47.7 172382092 50.6 162280812 48.9 1652
– – –77648 48.4 160389613 51.0 175890749 51.6 176088766 49.8 178179696 49.0 162782915 49.8 1665
82949b 50.0 16604409 1.3 84
13 13 13
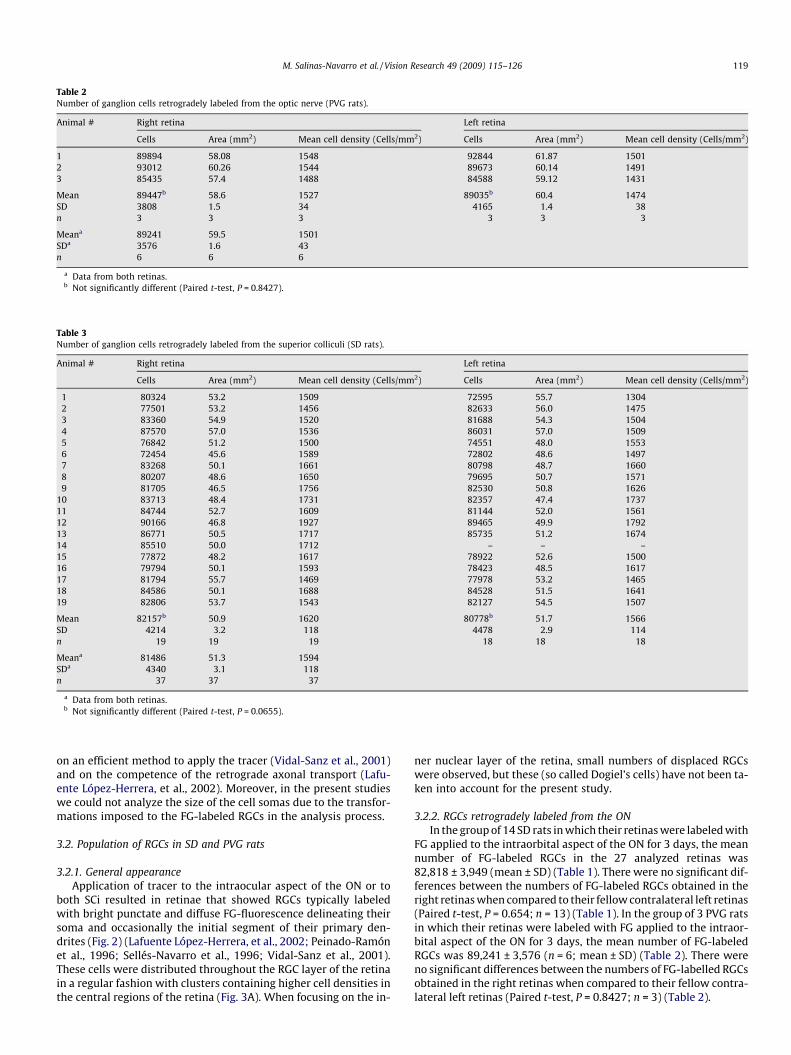
Table 2Number of ganglion cells retrogradely labeled from the optic nerve (PVG rats).
Animal # Right retina Left retina
Cells Area (mm2) Mean cell density (Cells/mm2) Cells Area (mm2) Mean cell density (Cells/mm2)
1 89894 58.08 1548 92844 61.87 15012 93012 60.26 1544 89673 60.14 14913 85435 57.4 1488 84588 59.12 1431
Mean 89447b 58.6 1527 89035b 60.4 1474SD 3808 1.5 34 4165 1.4 38n 3 3 3 3 3 3
Meana 89241 59.5 1501SDa 3576 1.6 43n 6 6 6
a Data from both retinas.b Not significantly different (Paired t-test, P = 0.8427).
Table 3Number of ganglion cells retrogradely labeled from the superior colliculi (SD rats).
Animal # Right retina Left retina
Cells Area (mm2) Mean cell density (Cells/mm2) Cells Area (mm2) Mean cell density (Cells/mm2)
1 80324 53.2 1509 72595 55.7 13042 77501 53.2 1456 82633 56.0 14753 83360 54.9 1520 81688 54.3 15044 87570 57.0 1536 86031 57.0 15095 76842 51.2 1500 74551 48.0 15536 72454 45.6 1589 72802 48.6 14977 83268 50.1 1661 80798 48.7 16608 80207 48.6 1650 79695 50.7 15719 81705 46.5 1756 82530 50.8 1626
10 83713 48.4 1731 82357 47.4 173711 84744 52.7 1609 81144 52.0 156112 90166 46.8 1927 89465 49.9 179213 86771 50.5 1717 85735 51.2 167414 85510 50.0 1712 – – –15 77872 48.2 1617 78922 52.6 150016 79794 50.1 1593 78423 48.5 161717 81794 55.7 1469 77978 53.2 146518 84586 50.1 1688 84528 51.5 164119 82806 53.7 1543 82127 54.5 1507
Mean 82157b 50.9 1620 80778b 51.7 1566SD 4214 3.2 118 4478 2.9 114n 19 19 19 18 18 18
Meana 81486 51.3 1594SDa 4340 3.1 118n 37 37 37
a Data from both retinas.b Not significantly different (Paired t-test, P = 0.0655).
M. Salinas-Navarro et al. / Vision Research 49 (2009) 115–126 119
on an efficient method to apply the tracer (Vidal-Sanz et al., 2001)and on the competence of the retrograde axonal transport (Lafu-ente López-Herrera, et al., 2002). Moreover, in the present studieswe could not analyze the size of the cell somas due to the transfor-mations imposed to the FG-labeled RGCs in the analysis process.
3.2. Population of RGCs in SD and PVG rats
3.2.1. General appearanceApplication of tracer to the intraocular aspect of the ON or to
both SCi resulted in retinae that showed RGCs typically labeledwith bright punctate and diffuse FG-fluorescence delineating theirsoma and occasionally the initial segment of their primary den-drites (Fig. 2) (Lafuente López-Herrera, et al., 2002; Peinado-Ramónet al., 1996; Sellés-Navarro et al., 1996; Vidal-Sanz et al., 2001).These cells were distributed throughout the RGC layer of the retinain a regular fashion with clusters containing higher cell densities inthe central regions of the retina (Fig. 3A). When focusing on the in-
ner nuclear layer of the retina, small numbers of displaced RGCswere observed, but these (so called Dogiel’s cells) have not been ta-ken into account for the present study.
3.2.2. RGCs retrogradely labeled from the ONIn the group of 14 SD rats in which their retinas were labeled with
FG applied to the intraorbital aspect of the ON for 3 days, the meannumber of FG-labeled RGCs in the 27 analyzed retinas was82,818 ± 3,949 (mean ± SD) (Table 1). There were no significant dif-ferences between the numbers of FG-labeled RGCs obtained in theright retinas when compared to their fellow contralateral left retinas(Paired t-test, P = 0.654; n = 13) (Table 1). In the group of 3 PVG ratsin which their retinas were labeled with FG applied to the intraor-bital aspect of the ON for 3 days, the mean number of FG-labeledRGCs was 89,241 ± 3,576 (n = 6; mean ± SD) (Table 2). There wereno significant differences between the numbers of FG-labelled RGCsobtained in the right retinas when compared to their fellow contra-lateral left retinas (Paired t-test, P = 0.8427; n = 3) (Table 2).
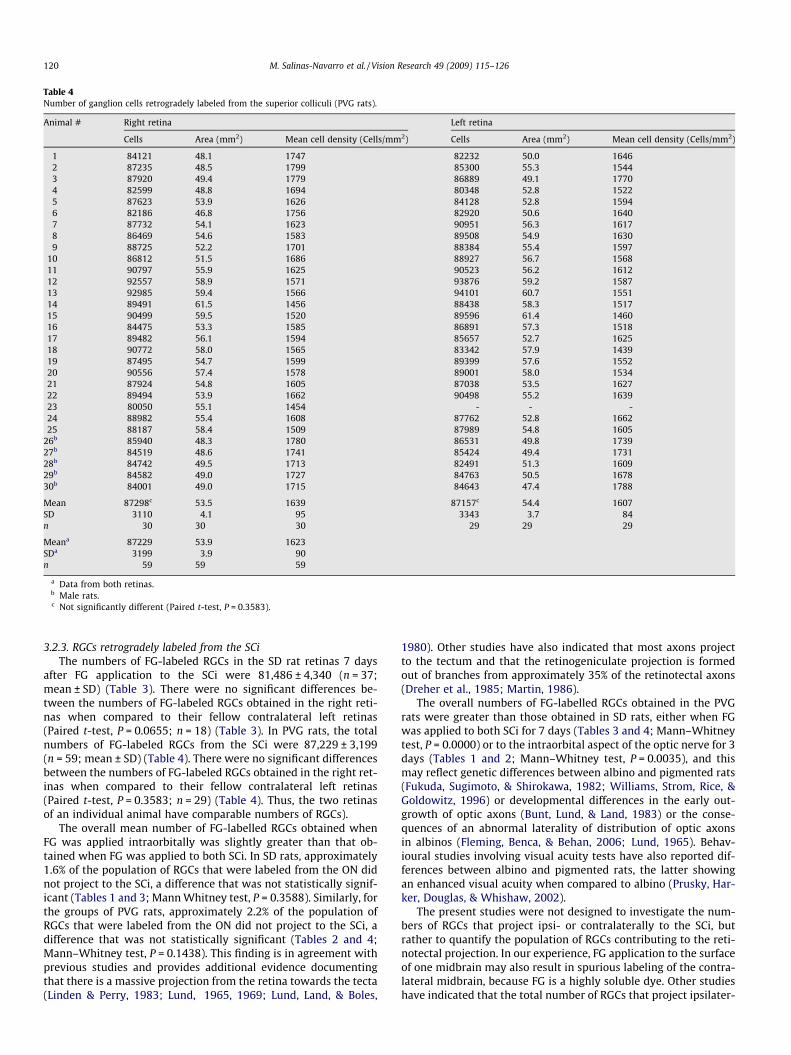
Table 4Number of ganglion cells retrogradely labeled from the superior colliculi (PVG rats).
Animal # Right retina Left retina
Cells Area (mm2) Mean cell density (Cells/mm2) Cells Area (mm2) Mean cell density (Cells/mm2)
1 84121 48.1 1747 82232 50.0 16462 87235 48.5 1799 85300 55.3 15443 87920 49.4 1779 86889 49.1 17704 82599 48.8 1694 80348 52.8 15225 87623 53.9 1626 84128 52.8 15946 82186 46.8 1756 82920 50.6 16407 87732 54.1 1623 90951 56.3 16178 86469 54.6 1583 89508 54.9 16309 88725 52.2 1701 88384 55.4 1597
10 86812 51.5 1686 88927 56.7 156811 90797 55.9 1625 90523 56.2 161212 92557 58.9 1571 93876 59.2 158713 92985 59.4 1566 94101 60.7 155114 89491 61.5 1456 88438 58.3 151715 90499 59.5 1520 89596 61.4 146016 84475 53.3 1585 86891 57.3 151817 89482 56.1 1594 85657 52.7 162518 90772 58.0 1565 83342 57.9 143919 87495 54.7 1599 89399 57.6 155220 90556 57.4 1578 89001 58.0 153421 87924 54.8 1605 87038 53.5 162722 89494 53.9 1662 90498 55.2 163923 80050 55.1 1454 - - -24 88982 55.4 1608 87762 52.8 166225 88187 58.4 1509 87989 54.8 1605
26b 85940 48.3 1780 86531 49.8 173927b 84519 48.6 1741 85424 49.4 173128b 84742 49.5 1713 82491 51.3 160929b 84582 49.0 1727 84763 50.5 167830b 84001 49.0 1715 84643 47.4 1788
Mean 87298c 53.5 1639 87157c 54.4 1607SD 3110 4.1 95 3343 3.7 84n 30 30 30 29 29 29
Meana 87229 53.9 1623SDa 3199 3.9 90n 59 59 59
a Data from both retinas.b Male rats.c Not significantly different (Paired t-test, P = 0.3583).
120 M. Salinas-Navarro et al. / Vision Research 49 (2009) 115–126
3.2.3. RGCs retrogradely labeled from the SCiThe numbers of FG-labeled RGCs in the SD rat retinas 7 days
after FG application to the SCi were 81,486 ± 4,340 (n = 37;mean ± SD) (Table 3). There were no significant differences be-tween the numbers of FG-labeled RGCs obtained in the right reti-nas when compared to their fellow contralateral left retinas(Paired t-test, P = 0.0655; n = 18) (Table 3). In PVG rats, the totalnumbers of FG-labeled RGCs from the SCi were 87,229 ± 3,199(n = 59; mean ± SD) (Table 4). There were no significant differencesbetween the numbers of FG-labeled RGCs obtained in the right ret-inas when compared to their fellow contralateral left retinas(Paired t-test, P = 0.3583; n = 29) (Table 4). Thus, the two retinasof an individual animal have comparable numbers of RGCs).
The overall mean number of FG-labelled RGCs obtained whenFG was applied intraorbitally was slightly greater than that ob-tained when FG was applied to both SCi. In SD rats, approximately1.6% of the population of RGCs that were labeled from the ON didnot project to the SCi, a difference that was not statistically signif-icant (Tables 1 and 3; Mann Whitney test, P = 0.3588). Similarly, forthe groups of PVG rats, approximately 2.2% of the population ofRGCs that were labeled from the ON did not project to the SCi, adifference that was not statistically significant (Tables 2 and 4;Mann–Whitney test, P = 0.1438). This finding is in agreement withprevious studies and provides additional evidence documentingthat there is a massive projection from the retina towards the tecta(Linden & Perry, 1983; Lund, 1965, 1969; Lund, Land, & Boles,
1980). Other studies have also indicated that most axons projectto the tectum and that the retinogeniculate projection is formedout of branches from approximately 35% of the retinotectal axons(Dreher et al., 1985; Martin, 1986).
The overall numbers of FG-labelled RGCs obtained in the PVGrats were greater than those obtained in SD rats, either when FGwas applied to both SCi for 7 days (Tables 3 and 4; Mann–Whitneytest, P = 0.0000) or to the intraorbital aspect of the optic nerve for 3days (Tables 1 and 2; Mann–Whitney test, P = 0.0035), and thismay reflect genetic differences between albino and pigmented rats(Fukuda, Sugimoto, & Shirokawa, 1982; Williams, Strom, Rice, &Goldowitz, 1996) or developmental differences in the early out-growth of optic axons (Bunt, Lund, & Land, 1983) or the conse-quences of an abnormal laterality of distribution of optic axonsin albinos (Fleming, Benca, & Behan, 2006; Lund, 1965). Behav-ioural studies involving visual acuity tests have also reported dif-ferences between albino and pigmented rats, the latter showingan enhanced visual acuity when compared to albino (Prusky, Har-ker, Douglas, & Whishaw, 2002).
The present studies were not designed to investigate the num-bers of RGCs that project ipsi- or contralaterally to the SCi, butrather to quantify the population of RGCs contributing to the reti-notectal projection. In our experience, FG application to the surfaceof one midbrain may also result in spurious labeling of the contra-lateral midbrain, because FG is a highly soluble dye. Other studieshave indicated that the total number of RGCs that project ipsilater-
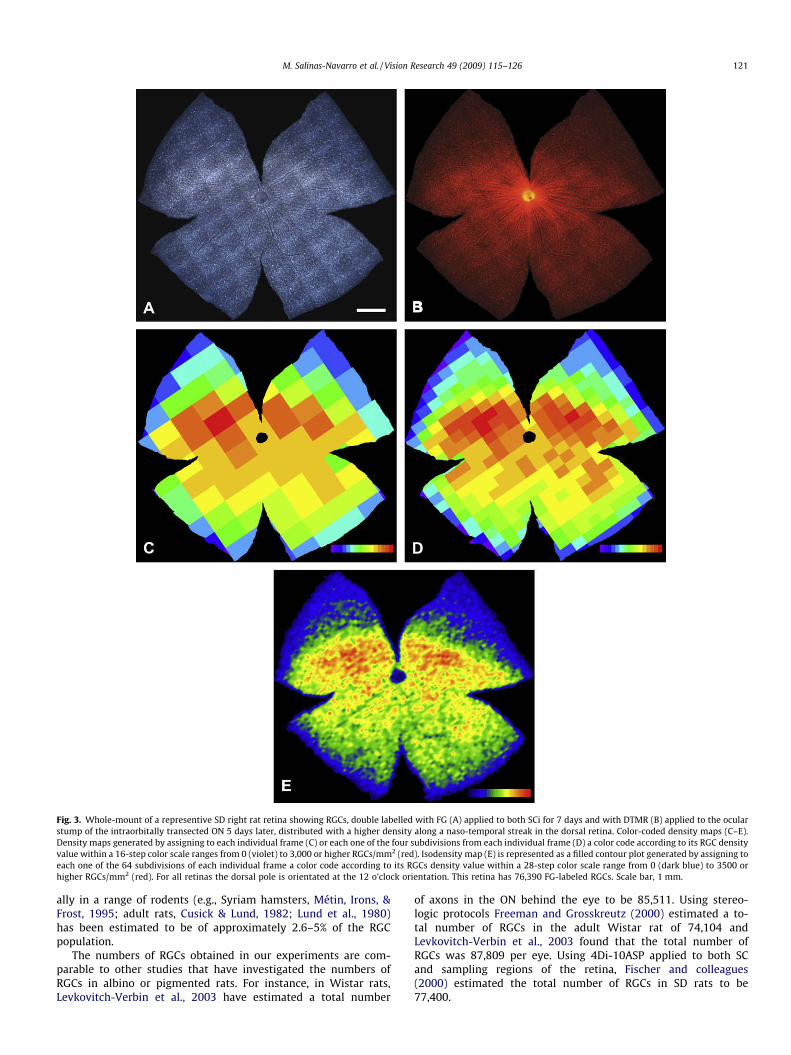
Fig. 3. Whole-mount of a representive SD right rat retina showing RGCs, double labelled with FG (A) applied to both SCi for 7 days and with DTMR (B) applied to the ocularstump of the intraorbitally transected ON 5 days later, distributed with a higher density along a naso-temporal streak in the dorsal retina. Color-coded density maps (C–E).Density maps generated by assigning to each individual frame (C) or each one of the four subdivisions from each individual frame (D) a color code according to its RGC densityvalue within a 16-step color scale ranges from 0 (violet) to 3,000 or higher RGCs/mm2 (red). Isodensity map (E) is represented as a filled contour plot generated by assigning toeach one of the 64 subdivisions of each individual frame a color code according to its RGCs density value within a 28-step color scale range from 0 (dark blue) to 3500 orhigher RGCs/mm2 (red). For all retinas the dorsal pole is orientated at the 12 o’clock orientation. This retina has 76,390 FG-labeled RGCs. Scale bar, 1 mm.
M. Salinas-Navarro et al. / Vision Research 49 (2009) 115–126 121
ally in a range of rodents (e.g., Syriam hamsters, Métin, Irons, &Frost, 1995; adult rats, Cusick & Lund, 1982; Lund et al., 1980)has been estimated to be of approximately 2.6–5% of the RGCpopulation.
The numbers of RGCs obtained in our experiments are com-parable to other studies that have investigated the numbers ofRGCs in albino or pigmented rats. For instance, in Wistar rats,Levkovitch-Verbin et al., 2003 have estimated a total number
of axons in the ON behind the eye to be 85,511. Using stereo-logic protocols Freeman and Grosskreutz (2000) estimated a to-tal number of RGCs in the adult Wistar rat of 74,104 andLevkovitch-Verbin et al., 2003 found that the total number ofRGCs was 87,809 per eye. Using 4Di-10ASP applied to both SCand sampling regions of the retina, Fischer and colleagues(2000) estimated the total number of RGCs in SD rats to be77,400.
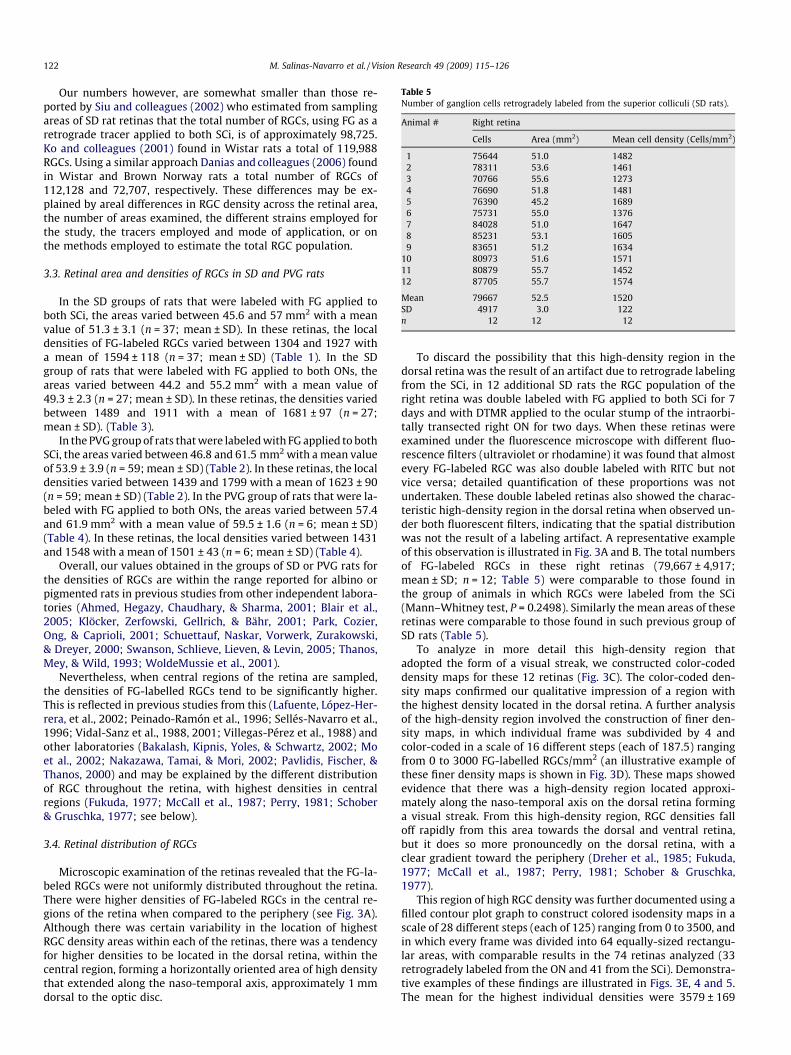
Table 5Number of ganglion cells retrogradely labeled from the superior colliculi (SD rats).
Animal # Right retina
Cells Area (mm2) Mean cell density (Cells/mm2)
1 75644 51.0 14822 78311 53.6 14613 70766 55.6 12734 76690 51.8 14815 76390 45.2 16896 75731 55.0 13767 84028 51.0 16478 85231 53.1 16059 83651 51.2 1634
10 80973 51.6 157111 80879 55.7 145212 87705 55.7 1574
Mean 79667 52.5 1520SD 4917 3.0 122n 12 12 12
122 M. Salinas-Navarro et al. / Vision Research 49 (2009) 115–126
Our numbers however, are somewhat smaller than those re-ported by Siu and colleagues (2002) who estimated from samplingareas of SD rat retinas that the total number of RGCs, using FG as aretrograde tracer applied to both SCi, is of approximately 98,725.Ko and colleagues (2001) found in Wistar rats a total of 119,988RGCs. Using a similar approach Danias and colleagues (2006) foundin Wistar and Brown Norway rats a total number of RGCs of112,128 and 72,707, respectively. These differences may be ex-plained by areal differences in RGC density across the retinal area,the number of areas examined, the different strains employed forthe study, the tracers employed and mode of application, or onthe methods employed to estimate the total RGC population.
3.3. Retinal area and densities of RGCs in SD and PVG rats
In the SD groups of rats that were labeled with FG applied toboth SCi, the areas varied between 45.6 and 57 mm2 with a meanvalue of 51.3 ± 3.1 (n = 37; mean ± SD). In these retinas, the localdensities of FG-labeled RGCs varied between 1304 and 1927 witha mean of 1594 ± 118 (n = 37; mean ± SD) (Table 1). In the SDgroup of rats that were labeled with FG applied to both ONs, theareas varied between 44.2 and 55.2 mm2 with a mean value of49.3 ± 2.3 (n = 27; mean ± SD). In these retinas, the densities variedbetween 1489 and 1911 with a mean of 1681 ± 97 (n = 27;mean ± SD). (Table 3).
In the PVG group of rats that were labeled with FG applied to bothSCi, the areas varied between 46.8 and 61.5 mm2 with a mean valueof 53.9 ± 3.9 (n = 59; mean ± SD) (Table 2). In these retinas, the localdensities varied between 1439 and 1799 with a mean of 1623 ± 90(n = 59; mean ± SD) (Table 2). In the PVG group of rats that were la-beled with FG applied to both ONs, the areas varied between 57.4and 61.9 mm2 with a mean value of 59.5 ± 1.6 (n = 6; mean ± SD)(Table 4). In these retinas, the local densities varied between 1431and 1548 with a mean of 1501 ± 43 (n = 6; mean ± SD) (Table 4).
Overall, our values obtained in the groups of SD or PVG rats forthe densities of RGCs are within the range reported for albino orpigmented rats in previous studies from other independent labora-tories (Ahmed, Hegazy, Chaudhary, & Sharma, 2001; Blair et al.,2005; Klöcker, Zerfowski, Gellrich, & Bähr, 2001; Park, Cozier,Ong, & Caprioli, 2001; Schuettauf, Naskar, Vorwerk, Zurakowski,& Dreyer, 2000; Swanson, Schlieve, Lieven, & Levin, 2005; Thanos,Mey, & Wild, 1993; WoldeMussie et al., 2001).
Nevertheless, when central regions of the retina are sampled,the densities of FG-labelled RGCs tend to be significantly higher.This is reflected in previous studies from this (Lafuente, López-Her-rera, et al., 2002; Peinado-Ramón et al., 1996; Sellés-Navarro et al.,1996; Vidal-Sanz et al., 1988, 2001; Villegas-Pérez et al., 1988) andother laboratories (Bakalash, Kipnis, Yoles, & Schwartz, 2002; Moet al., 2002; Nakazawa, Tamai, & Mori, 2002; Pavlidis, Fischer, &Thanos, 2000) and may be explained by the different distributionof RGC throughout the retina, with highest densities in centralregions (Fukuda, 1977; McCall et al., 1987; Perry, 1981; Schober& Gruschka, 1977; see below).
3.4. Retinal distribution of RGCs
Microscopic examination of the retinas revealed that the FG-la-beled RGCs were not uniformly distributed throughout the retina.There were higher densities of FG-labeled RGCs in the central re-gions of the retina when compared to the periphery (see Fig. 3A).Although there was certain variability in the location of highestRGC density areas within each of the retinas, there was a tendencyfor higher densities to be located in the dorsal retina, within thecentral region, forming a horizontally oriented area of high densitythat extended along the naso-temporal axis, approximately 1 mmdorsal to the optic disc.
To discard the possibility that this high-density region in thedorsal retina was the result of an artifact due to retrograde labelingfrom the SCi, in 12 additional SD rats the RGC population of theright retina was double labeled with FG applied to both SCi for 7days and with DTMR applied to the ocular stump of the intraorbi-tally transected right ON for two days. When these retinas wereexamined under the fluorescence microscope with different fluo-rescence filters (ultraviolet or rhodamine) it was found that almostevery FG-labeled RGC was also double labeled with RITC but notvice versa; detailed quantification of these proportions was notundertaken. These double labeled retinas also showed the charac-teristic high-density region in the dorsal retina when observed un-der both fluorescent filters, indicating that the spatial distributionwas not the result of a labeling artifact. A representative exampleof this observation is illustrated in Fig. 3A and B. The total numbersof FG-labeled RGCs in these right retinas (79,667 ± 4,917;mean ± SD; n = 12; Table 5) were comparable to those found inthe group of animals in which RGCs were labeled from the SCi(Mann–Whitney test, P = 0.2498). Similarly the mean areas of theseretinas were comparable to those found in such previous group ofSD rats (Table 5).
To analyze in more detail this high-density region thatadopted the form of a visual streak, we constructed color-codeddensity maps for these 12 retinas (Fig. 3C). The color-coded den-sity maps confirmed our qualitative impression of a region withthe highest density located in the dorsal retina. A further analysisof the high-density region involved the construction of finer den-sity maps, in which individual frame was subdivided by 4 andcolor-coded in a scale of 16 different steps (each of 187.5) rangingfrom 0 to 3000 FG-labelled RGCs/mm2 (an illustrative example ofthese finer density maps is shown in Fig. 3D). These maps showedevidence that there was a high-density region located approxi-mately along the naso-temporal axis on the dorsal retina forminga visual streak. From this high-density region, RGC densities falloff rapidly from this area towards the dorsal and ventral retina,but it does so more pronouncedly on the dorsal retina, with aclear gradient toward the periphery (Dreher et al., 1985; Fukuda,1977; McCall et al., 1987; Perry, 1981; Schober & Gruschka,1977).
This region of high RGC density was further documented using afilled contour plot graph to construct colored isodensity maps in ascale of 28 different steps (each of 125) ranging from 0 to 3500, andin which every frame was divided into 64 equally-sized rectangu-lar areas, with comparable results in the 74 retinas analyzed (33retrogradely labeled from the ON and 41 from the SCi). Demonstra-tive examples of these findings are illustrated in Figs. 3E, 4 and 5.The mean for the highest individual densities were 3579 ± 169
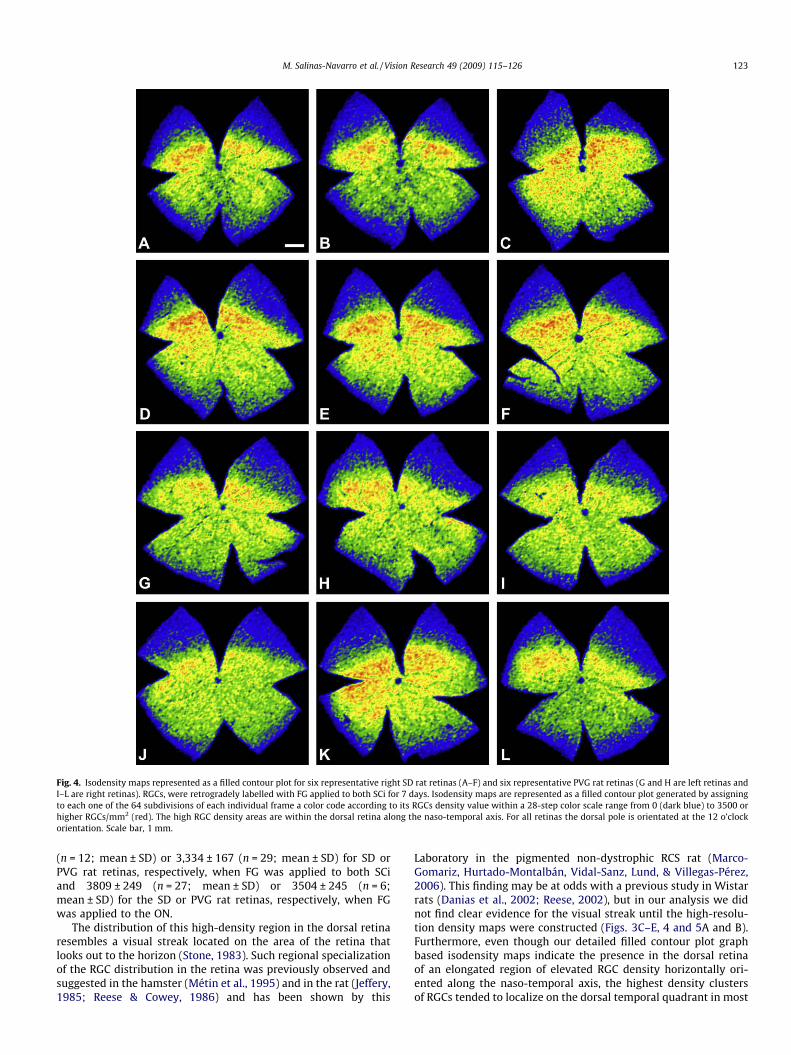
Fig. 4. Isodensity maps represented as a filled contour plot for six representative right SD rat retinas (A–F) and six representative PVG rat retinas (G and H are left retinas andI–L are right retinas). RGCs, were retrogradely labelled with FG applied to both SCi for 7 days. Isodensity maps are represented as a filled contour plot generated by assigningto each one of the 64 subdivisions of each individual frame a color code according to its RGCs density value within a 28-step color scale range from 0 (dark blue) to 3500 orhigher RGCs/mm2 (red). The high RGC density areas are within the dorsal retina along the naso-temporal axis. For all retinas the dorsal pole is orientated at the 12 o’clockorientation. Scale bar, 1 mm.
M. Salinas-Navarro et al. / Vision Research 49 (2009) 115–126 123
(n = 12; mean ± SD) or 3,334 ± 167 (n = 29; mean ± SD) for SD orPVG rat retinas, respectively, when FG was applied to both SCiand 3809 ± 249 (n = 27; mean ± SD) or 3504 ± 245 (n = 6;mean ± SD) for the SD or PVG rat retinas, respectively, when FGwas applied to the ON.
The distribution of this high-density region in the dorsal retinaresembles a visual streak located on the area of the retina thatlooks out to the horizon (Stone, 1983). Such regional specializationof the RGC distribution in the retina was previously observed andsuggested in the hamster (Métin et al., 1995) and in the rat (Jeffery,1985; Reese & Cowey, 1986) and has been shown by this
Laboratory in the pigmented non-dystrophic RCS rat (Marco-Gomariz, Hurtado-Montalbán, Vidal-Sanz, Lund, & Villegas-Pérez,2006). This finding may be at odds with a previous study in Wistarrats (Danias et al., 2002; Reese, 2002), but in our analysis we didnot find clear evidence for the visual streak until the high-resolu-tion density maps were constructed (Figs. 3C–E, 4 and 5A and B).Furthermore, even though our detailed filled contour plot graphbased isodensity maps indicate the presence in the dorsal retinaof an elongated region of elevated RGC density horizontally ori-ented along the naso-temporal axis, the highest density clustersof RGCs tended to localize on the dorsal temporal quadrant in most

Fig. 5. Isodensity maps represented as a filled contour plot for both left (A) and right (B) retinas, from a representative SD rat labelled with FG applied to the ocular stump ofthe intraorbitally transected ON for 3 days, showing the typical high-density distribution along a naso-temporal streak in the dorsal retina. Maps were generated by assigningto each one of the 64 subdivisions of each individual frame a color code according to its RGCs density value within a 28-step color scale range from 0 (dark blue) to 3500 orhigher RGCs/mm2 (red). For all retinas the dorsal pole is orientated at the 12 o’clock orientation. Scale bar, 1 mm.
124 M. Salinas-Navarro et al. / Vision Research 49 (2009) 115–126
retinas, and this is in agreement with previous studies (Dreheret al., 1985; Fukuda, 1977; McCall et al., 1987; Métin et al., 1995;Schober & Gruschka, 1977).
4. Summary
In SD and PVG strain of rats, the population of RGCs labeledwith FG from the ON or the SCi, may be counted automatically witha level of confidence that is comparable to that found when RGCsare counted manually. Our results indicate that only a small per-centage of the RGC population does not contribute to the retinotec-tal projection. In addition we also provide evidence for thedistribution of rat retinal ganglion cells adopting a form of regionalspecialization that resembles a horizontal visual streak rather thanan area centralis. Overall, the consistency and similarity of the re-sults obtained in the present studies speak for the presently usedmethod as an unbiased, reliable, reproducible and accurate wayto assess the RGC population in adult rats, with a level of accuracyhardly attained with other methods. Morever, the detailed isoden-sity maps constructed out of these counts provide a unique graphicsystem to assess regional RGC distribution in normal circum-stances and after injury (Garcia-Ayuso et al., 2008; Marco-Gomarizet al., 2006) and neuroprotection in several experimental models(Salinas-Navarro et al., 2006; Schnebelen et al., 2007, 2008;Vidal-Sanz et al., De la Villa, 2007).
Acknowledgments
The authors thank the technical contribution of M.E. Aguilera,J.M. Bernal and I. Cánovas.
Support: This work was supported by research grants from theRegional Government of Murcia CARM BIO2005/016469; Funda-ción Séneca 02989/PI/05, 05703/PI/07, 04446/GERM/07; SpanishMinistry of Education and Science SAF-2005-04812; and SpanishMinistry of Health ISCIII: FIS PIO06/0780 and RD07/0062/0001;and an unrestricted grant from Allergan Inc.
References
Ahmed, F. A., Hegazy, K., Chaudhary, P., & Sharma, S. C. (2001). Neuroprotectiveeffect of alpha(2) agonist (brimonidine) on adult rat retinal ganglion cells afterincreased intraocular pressure. Brain Research, 21, 133–139.
Avilés-Trigueros, M., Mayor-Torroglosa, S., García-Avilés, A., Lafuente, M. P.,Rodríguez, M. E., Miralles de Imperial, J., et al. (2003). Transient ischemia ofthe retina results in massive degeneration of the retinotectal projection:long-term neuroprotection with brimonidine. Experimental Neurology, 184,767–777.
Avilés-Trigueros, M., Sauvé, Y., Lund, R. D., & Vidal-Sanz, M. (2000). Selectiveinnervation of retinorecipient brainstem nuclei by retinal ganglion cell axonsregenerating through peripheral nerve grafts in adult rats. Journal ofNeuroscience, 20, 361–374.
Bakalash, S., Kipnis, J., Yoles, E., & Schwartz, M. (2002). Resistance of retinal ganglioncells to an increase in intraocular pressure is immune-dependent. InvestigativeOpthalmology and Visual Science, 43, 2648–2653.
Blair, M., Pease, M. E., Hammond, J., Valenta, D., Kielczewski, J., Levkovitch-Verbin,H., et al. (2005). Effect of glatiramer acetate on primary and secondarydegeneration of retinal ganglion cells in the rat. Investigative Ophthalmologyand Visual Science, 46, 884–890.
Bunt, S. M., Lund, R. D., & Land, P. W. (1983). Prenatal development of the opticprojection in albino and hooded rats. Brain Research, 282, 149–168.
Cusick, C. G., & Lund, R. D. (1982). Modification of visual callosal projections in rats.Journal of Comparative Neurology, 212, 385–398.
Danias, J., Shen, F., Goldblum, D., Chen, B., Ramos-Esteban, J., Podos, S. M., et al.(2002). Cytoarchitecture of the retinal ganglion cells in the rat. InvestigativeOpthalmology and Visual Science, 43, 587–594.
Danias, J., Shen, F., Kavalarakis, M., Chen, B., Goldblum, D., Lee, K., et al. (2006).Characterization of retinal damage in the episcleral vein cauterization ratglaucoma model. Experimental Eye Research, 82, 219–228.
Dreher, B., Sefton, A. J., Ni, S. Y., & Nisbett, G. (1985). The morphology, number,distribution and central projections of class I retinal ganglion cells in albino andhooded rats. Brain Behavioural Evolution, 26, 10–48.
Fischer, D., Pavlidis, M., & Thanos, S. (2000). Cataractogenic lens injuryprevents traumatic ganglion cell death and promotes axonal regenerationboth in vivo and in culture. Investigative Ophthalmology and Visual Science,41, 3943–3954.
Fleming, M. D., Benca, R. M., & Behan, M. (2006). Retinal projections to thesubcortical visual system in congenic albino and pigmented rats. Neuroscience,143, 895–904.
Freeman, E. E., & Grosskreutz, C. L. (2000). The effects of FK506 on retinal ganglioncells after optic nerve crush. Investigative Ophthalmology and Visual Science, 41,1111–1115.
Fukuda, Y. (1977). A three-group classification of rat retinal ganglion cells:Histological and physiological studies. Brain Research, 119, 327–334.
Fukuda, Y., Sugimoto, T., & Shirokawa, T. (1982). Strain differences in quantitativeanalysis of the rat optic nerve. Experimental Neurology, 75, 525–532.
Garcia-Ayuso, D., Salinas-Navarro, M., Coll-Alcaraz, L., Cánovas-Martínez, I., Bernal-Garro, J. M., Vidal-Sanz, M., et al. (2008). Characterization of the light-sensitivearciform region in the albino rat retina. Investigative Ophthalmology and VisualScience, 49 [E-Abstract 4395].
Guillery, R. W. (2002). On counting and counting errors. Journal of ComparativeNeurology, 447, 1–7.
Jeffery, G. (1985). The relationship between cell density and the nasotemporaldivision in the rat retina. Brain Research, 347, 354–357.
Klöcker, N., Zerfowski, M., Gellrich, N. C., & Bähr, M. (2001). Morphological andfunctional analysis of imcomplete CNS fiber tract lesion: Gradded crush of therat optic nerve. Journal of Neuroscience Methods, 110, 147–153.
M. Salinas-Navarro et al. / Vision Research 49 (2009) 115–126 125
Ko, M. L., Hu, D. N., Ritch, R., Sharma, S. C., & Chen, C. F. (2001). Patterns of retinalganglion cell survival after brain-derived neurotrophic factor administration inhypertensive eyes of rats. Neuroscience Letters, 305, 139–142.
Lafuente López-Herrera, M. P., Mayor-Torroglosa, S., Miralles de Imperial, J.,Villegas-Pérez, M. P., & Vidal-Sanz, M. (2002). Transient ischemia of the retinaresults in altered retrograde axoplasmic transport: neuroprotection withbrimonidine. Experimental Neurology, 178, 243–258.
Lafuente, M. P., Villegas-Pérez, M. P., Mayor, S., Aguilera, M. E., Miralles de Imperial,J., & Vidal-Sanz, M. (2002). Neuroprotective effects of brimonidine againsttransient ischemia-induced retinal ganglion cell death: a dose response in vivostudy. Experimental Eye Research, 74, 181–189.
Lafuente, M. P., Villegas-Pérez, M. P., Sellés-Navarro, I., Mayor-Torroglosa, S.,Miralles de Imperial, J., & Vidal-Sanz, M. (2002). Retinal ganglion celldeath after acute retinal ischemia is an ongoing process whose severityand duration depends on the duration of the insult. Neuroscience, 109,157–168.
Levkovitch-Verbin, H., Quigley, H. A., Martin, K. R. G., Zack, D. J., Pease, M. E., &Valenta, D. F. (2003). A model to study differences between primary andsecondary degeneration of retinal ganglion cells in rats by partial optic nervetransaction. Investigative Ophthalmology and Visual Science, 44, 3388–3393.
Linden, R., & Perry, V. H. (1983). Massive retinotectal projection in rats. BrainResearch, 272, 145–149.
Lund, R. D. (1965). Uncrossed visual pathways of hooded and albino rats. Science,149, 1506–1507.
Lund, R. D. (1969). Synaptic patterns of the superficial layers of the superiorcolliculus of the rat. Journal Comparative Neurology, 135, 179–208.
Lund, R. D., Land, P. W., & Boles, J. (1980). Normal and abnormal uncrossedretinotectal pathways in rats: An HRP study in adults. Journal ComparativeNeurology, 15, 711–720.
Lund, R. D., Wang, S., Lu, B., Girman, S., Holmes, T., Sauvé, Y., et al. (2007). Cellsisolated from umbilical cord tissue rescue photoreceptors and visual functionsin a rodent model of retinal disease. Stem Cells, 25, 602–611.
Marco-Gomariz, M. A., Hurtado-Montalbán, N., Vidal-Sanz, M., Lund, R. D., &Villegas-Pérez, M. P. (2006). Phototoxic-induced photoreceptor degenerationcauses retinal ganglion cell degeneration in pigmented rats. Journal ComparativeNeurology, 498, 163–179.
Martin, P. R. (1986). The projection of different retinal ganglion cell classes to thedorsal lateral geniculate nucleus in the hooded rat. Experimental Brain Research,62, 77–88.
Mayor-Torroglosa, S., De la Villa, P., Rodríguez, M. E., López-Herrera, M. P., Avilés-Trigueros, M., García-Avilés, A., et al. (2005). Ischemia results 3 months later inaltered ERG, degeneration of inner layers, and deafferented tectum:Neuroprotection with brimonidine. Investigative Ophthalmology Visual Science,46, 3825–3835.
McCall, M., Robinson, S. R., & Dreher, B. (1987). Differential retinal growth appearsto be the primary factor producing the ganglion cell density gradient in the rat.Neuroscience Letters, 79, 78–84.
Métin, C., Irons, W. A., & Frost, D. O. (1995). Retinal ganglion cells in normalhamsters and hamsters with novel retinal projections. I. Number, distribution,and size. Journal Comparative Neurology, 353, 179–199.
Mo, X., Yokoyama, A., Oshitari, T., Negishi, H., Dezawa, M., Mizota, A., et al. (2002).Rescue of axotomized retinal ganglion cells by BDNF gene electroporation inadult rats. Investigative Opthalmology and Visual Science, 43, 2401–2405.
Nakazawa, T., Tamai, M., & Mori, N. (2002). Brain-derived neurotophic factorprevents axotomized retinal ganglion cell death through MAPK and PI3Ksignaling pathways. Investigative Ophthalmology and Visual Science, 43,3319–3326.
Park, K. H., Cozier, F., Ong, O. C., & Caprioli, J. (2001). Induction of heat shock protein72 protects retinal ganglion cells in a rat glaucoma model. InvestigativeOphthalmology and Visual Science, 42, 1522–1530.
Pavlidis, M., Fischer, D., & Thanos, S. (2000). Photoreceptor degeneration in the RCSrat attenuates dendritic transport and axonal regeneration of ganglion cells.Investigative Ophthalmology and Visual Science, 41, 2318–2328.
Peinado-Ramón, P., Salvador, M., Villegas-Pérez, M. P., & Vidal-Sanz, M. (1996).Effects of axotomy and intraocular administration of NT-4, NT-3, and brain-derived neurotrophic factor on the survival of adult rat retinal ganglion cells. Aquantitative in vivo study. Investigative Ophthalmology and Visual Science, 37,489–500.
Perry, V. H. (1981). Evidence for an amacrine cell system in the ganglion cell layer ofthe rat retina. Neuroscience, 6, 931–944.
Prusky, G. T., Harker, K. T., Douglas, R. M., & Whishaw, I. Q. (2002). Variation invisual acuity within pigmented, and between pigmented and albino rat strains.Behavioural Brain Research, 136, 339–348.
Reese, B. E. (2002). Rat retinal ganglion cell topography. Investigative Ophthalmologyand Visual Science, 43, 587–594 [Letters for Danias et al.].
Reese, B. E., & Cowey, A. (1986). Large retinal ganglion cells in the rat: Theirdistribution and laterality of projection. Experimental Brain Research, 61,375–385.
Salinas-Navarro, M., Mayor-Torroglosa, S., Holmes, T., Ortiz, A., Bernal, J. M.,Canovas, I., et al. (2005). Automatic quantitative analysis of retinal ganglioncells that project to the superior colliculi in adult Sprague–Dawley rats.Investigative Ophthalmology and Visual Science, 46 [E-Abstract 271].
Salinas-Navarro, M., Triviño, A., Ramírez, A. I., Salazar, J. J., Ramírez, J. M., Villegas–Pérez, M. P., et al. (2006). Long term effects of laser-induced ocularhypertension: Retrograde degeneration of retinal ganglion cells. InvestigativeOphthalmology and Visual Science, 47. E-Abstract 1560.
Sasaki, H., Coffey, P., Villegas-Perez, M. P., Vidal-Sanz, M., Young, M. J., Lund, R. D.,et al. (1996). Light induced EEG desynchronization and behavioral arousal inrats with restored retinocollicular projection by peripheral nerve graft.Neuroscience Letters, 218, 45–48.
Sauvé, Y., Girman, S. V., Wang, S., Keegan, D. J., & Lund, R. D. (2002). Preservation ofvisual responsiveness in the superior colliculus of RCS rats after retinal pigmentepithelium cell transplantation. Neuroscience, 114, 389–401.
Sauvé, Y., Girman, S. V., Wang, S., Lawrence, J. M., & Lund, R. D. (2001). Progressivevisual sensitivity loss in the Royal College of Surgeons rat: perimetric study inthe superior colliculus. Neuroscience, 1, 51–63.
Schnebelen, C., Salinas-Navarro, M., Acar, N., Pasquis, B., Creuzot-Garcher, C. P.,Villegas-Pérez, M. P., et al. (2007). Time course of IOP elevation,electroretinographic changes and retinal ganglion cell loss in a rat model ofglaucoma induced by laser. Investigative Ophthalmology and Visual Science, 48[E-Abstract 206].
Schnebelen, C., Salinas-Navarro, M., Acar, N., Pasquis, B., Creuzot-Garcher, C. P.,Villegas-Pérez, M. P., et al. (2008). Effect of dietary Omega-3 and Omega-6 fattyacids on IOP elevation, electroretinographic changes and retinal ganglion cellloss in a laser-induced rat model of glaucoma. Investigative Ophthalmology andVisual Science, 49 [E-Abstract 5499].
Schober, W., & Gruschka, H. (1977). Retinal ganglion cells of the albino rat: Aqualitative and quantitative study. Zeitschrift fur Zellforschungundmikroskopische Anatomie, 91, 397–414.
Schuettauf, F., Naskar, R., Vorwerk, C. K., Zurakowski, D., & Dreyer, E. B. (2000).Ganglion cell loss after optic nerve crush mediated through AMPA-kainateand NMDA receptors. Investigative Ophthalmology and Visual Science, 4,4313–4316.
Sellés-Navarro, I., Villegas-Pérez, M. P., Salvador-Silva, M., Ruiz-Gómez, J. M., &Vidal-Sanz, M. (1996). Retinal ganglion cell death after different transientperiods of pressure-induced ischemia and survival intervals. A quantitativein vivo study. Investigative Ophthalmology and Visual Science, 37, 2002–2014.
Siu, A. W., Leung, M. C., To, C. H., Siu, F. K., Ji, J. Z., & So, K. F. (2002). Total retinalnitric oxide production is increased in intraocular pressure-elevated rats.Experimental Eye Research, 75, 401–406.
Stone, J. (1983). Parallel processing in the visual system. New York: Plenum Press.Swanson, K. I., Schlieve, C. R., Lieven, C. J., & Levin, L. A. (2005). Neuroprotective
effect of sulphydryl reduction in a rat optic nerve crush model. InvestigativeOphthalmology and Visual Science, 46, 3737–3741.
Thanos, S., Mey, J., & Wild, M. (1993). Treatment of the adult retina with microglia-suppressingfactorsretardsaxotomy-inducedneuronaldegradationandenhancesaxonal regeneration in vivo and in vitro. Journal of Neuroscience, 13, 455–466.
Vidal-Sanz, M., Avilés-Trigueros, M., Whiteley, S. J., Sauvé, Y., & Lund, R. D. (2002).Reinnervation of the pretectum in adult rats by regenerated retinal ganglion cellaxons: anatomical and functional studies. Progress in Brain Research, 137,443–452.
Vidal-Sanz, M., Bray, G. M., Villegas-Pérez, M. P., Thanos, S., & Aguayo, A. J. (1987).Axonal regeneration and synapse formation in the superior colliculus by retinalganglion cells in the adult rat. Journal of Neuroscience, 7, 2894–2909.
Vidal-Sanz, M., De la Villa, P., Avilés-Trigueros, M., Mayor-Torroglosa, S., Salinas-Navarro, M., Alarcón-Martínez, L., et al. (2007). Neuroprotection of retinalganglion cell function and their central nervous system targets. Eye, 21,S42–S45.
Vidal-Sanz, M., Lafuente, M. P., Mayor, S., Miralles de Imperial, J., & Villegas-Pérez,M. P. (2001). Retinal ganglion cell death induced by retinal ischemia:Neuroprotective effects of two alpha-2 agonists. Survey of Ophthalmology, 45,261–267.
Vidal-Sanz, M., Lafuente, M., Sobrado-Calvo, P., Selles-Navarro, I., Rodriguez, E.,Mayor-Torroglosa, S., et al. (2000). Death and neuroprotection of retinalganglion cells after different types of injury. Neurotoxicity Research, 2,215–227.
Vidal-Sanz, M., Salinas-Navarro, M., Jiménez-López, M., Valiente-Soriano, F. J.,García-Ayuso, D., Bernal, J. M., et al. (2007). Spatial distribution and quantitativeanálisis of retinal ganglion cells in adult albino rodents. InvestigativeOphthalmology and Visual Science, 48 [E-Abstract 134].
Vidal-Sanz, M., Villegas-Pérez, M. P., Bray, G. M., & Aguayo, A. J. (1988). Persistentretrograde labeling of adult rat retinal ganglion cells with the carbocyanine dyedil. Experimental Neurology, 102, 92–101.
Vidal-Sanz, M., Villegas-Pérez, M. P., Bray, G. M., & Aguayo, A. J. (1993). The use ofperipheral nerve grafts to study regeneration after CNS injury. Neuroprotocols, 3,29–33.
Villegas-Pérez, M. P., Aguilera, M. E., Salinas-Navarro, M., Mayor-Torroglosa, S.,Holmes, T., Bernal, J. M., et al. (2006). Retinal ganglion cells in adult albino andpigmented rats: Spatial distribution and quantitative analysis. InvestigativeOphthalmology and Visual Science, 47 [E-Abstract 3318].
Villegas-Pérez, M. P., Lawrence, J. M., Vidal-Sanz, M., Lavail, M. M., & Lund, R. D.(1998). Ganglion cell loss in RCS rat retina: A result of compression of axons bycontracting intraretinal vessels linked to the pigment epithelium. Journal ofComparative Neurology, 392, 58–77.
Villegas-Pérez, M. P., Vidal-Sanz, M., Bray, G. M., & Aguayo, A. J. (1988). Influences ofperipheral nerve grafts on the survival and regrowth of axotomized retinalganglion cells in adult rats. Journal of Neuroscience, 8, 265–280.
Villegas-Pérez, M. P., Vidal-Sanz, M., & Lund, R. D. (1996). Mechanism ofretinal ganglion cell loss in inherited retinal dystrophy. Neuroreport, 7,1995–1999.
Villegas-Pérez, M. P., Vidal-Sanz, M., Rasminsky, M., Bray, G. M., & Aguayo,A. J. (1993). Rapid and protracted phases of retinal ganglion cell loss
126 M. Salinas-Navarro et al. / Vision Research 49 (2009) 115–126
follow axotomy in the optic nerve of adult rats. Journal of Neurobiology,24, 23–36.
Whiteley, S. J., Sauvé, Y., Avilés-Trigueros, M., Vidal-Sanz, M., & Lund, R. D. (1998).Extent and duration of recovered pupillary light reflex following retinalganglion cell axon regeneration through peripheral nerve grafts directed tothe pretectum in adult rats. Experimental Neurology, 154, 560–572.
Williams, R. W., Strom, R. C., Rice, D. S., & Goldowitz, D. (1996). Genetic andenvironmental control of variation in retinal ganglion cell number in mice.Journal of Neuroscience, 16, 7193–7205.
WoldeMussie, E., Ruiz, G., Wijono, M., & Wheeler, L. A. (2001). Neuroprotection ofretinal ganglion cells by brimonidine in rats with laser-induced chronic ocularhypertension. Investigative Ophthalmology and Visual Science, 42, 2849–2855.