a computational analysis of a methanol steam reformer
TRANSCRIPT

Advances in Energy Research: 2nd
Edition
1 www.videleaf.com
Book Chapter
A Computational Analysis of a Methanol
Steam Reformer Using Phase Change
Heat Transfer
Hyemin Song1, Younghyeon Kim
1, Dongjin Yu
1, Byoung Jae
Kim2, Hyunjin Ji
3 and Sangseok Yu
2*
1Mechanical Engineering, Graduate School, Chungnam National
University, Korea 2School of Mechanical Engineering, Chungnam National
University, Korea 3Agency for Defense Development, Korea
*Corresponding Author: Sangseok Yu, School of Mechanical
Engineering, Chungnam National University, 99 Daehangno,
Yuseong-gu, Daejeon 34134, Korea
Published December 23, 2020
This Book Chapter is a republication of an article published by
Sangseok Yu, et al. at Energies in August 2020. (Song, H.; Kim,
Y.; Yu, D.; Kim, B.J.; Ji, H.; Yu, S. A Computational Analysis
of a Methanol Steam Reformer Using Phase Change Heat
Transfer. Energies 2020, 13, 4324.)
How to cite this book chapter: Hyemin Song, Younghyeon
Kim, Dongjin Yu, Byoung Jae Kim, Hyunjin Ji, Sangseok Yu. A
Computational Analysis of a Methanol Steam Reformer Using
Phase Change Heat Transfer. In: Fan Xiao, editor. Advances in
Energy Research: 2nd
Edition. Hyderabad, India: Vide Leaf.
2020.
© The Author(s) 2020. This article is distributed under the terms
of the Creative Commons Attribution 4.0 International
License(http://creativecommons.org/licenses/by/4.0/), which
permits unrestricted use, distribution, and reproduction in any
medium, provided the original work is properly cited.

Advances in Energy Research: 2nd
Edition
2 www.videleaf.com
Author Contributions: Conceptualization, Y.K. and B.J.K.;
Data curation, D.Y.; Formal analysis, H.J.; Writing—original
draft, H.S.; Writing—review & editing, S.Y.
Funding: This research was supported by a grant from the
Agency for Defense Development (ADD) (grant number:
UD180051GD).
Conflicts of Interest: The authors declare no conflict of interest.
Abstract
A methanol steam reformer converts methanol and steam into a
hydrogen-rich mixture through an endothermic reaction. The
methanol reformer is divided into a reaction section and a heat
supply section that transfers thermal energy from 200 to 300 °C.
This study presents the behavior of the methanol steam
reforming reaction using the latent heat of the steam. A
numerical analysis was separately conducted for two different
regimes assuming constant heat flux conditions. A methanol
steam reformer is an annulus structure that has a phase change
heat transfer from an outer tube to an inner tube. Different from
the steam zone temperature in the tube, the latent heat of steam
condensation decreases, and there is a gradual between-wall
temperature decrease along the longitudinal direction. Since the
latent heat of steam condensation is very sensitive to the
requested heat from the reformer, it is necessary to consider a
refined design of a methanol reformer to obtain a large enough
amount of heat by steam condensation.
Keywords
Computational Analysis; High-Pressure Methanol Steam
Reformer; Phase Change Heat Transfer; High Pressure Steam
Condensation; Hydrogen Production
Introduction
The exhaust gases from hydrocarbon fuel exacerbate global
warming, which has triggered an economy based on hydrogen.

Advances in Energy Research: 2nd
Edition
3 www.videleaf.com
Since global warming can be reduced with highly efficient
power plants, new types of power plants have also been
introduced in the world. Hydrogen energy has the advantage of
having a high energy density, low pollutants emission, and fuel
flexibility via various sources.
As of yet, the mass production of hydrogen is done by a
chemical reaction requiring hydrocarbons. Hydrocarbon-based
fuel-producing methods are the steam reforming process, partial
oxidation process, and autothermal reforming process. Among
them, the steam reforming process is not only economical but
also relatively high efficient. The methanol reformer is known
for its high energy density per volume, safety, and long-term
durability through proper maintenance [1,2]. Various
applications are examined such that the methanol reformer is
applied to the fuel cell vehicle in the Necar 3 (1997) and Necar 5
(2000). Another application of methanol reformers is a portable
fuel cell as a micro-reformer that is used for laptop computers
and military robots. Different from the above, the methanol
reformer is also used for a high-temperature stationary
PEMFC(Proton Exchange Membrane Fuel Cell), which is known
to be more tolerable to CO poisoning [3].
The methanol reformer is also applied to an air independent
power propulsion system for submarines [4]. Since methanol is
safer than hydrogen, it is very attractive to satisfy the
requirements of military operations. Prior to methanol reformers,
metal hydride was used to store hydrogen for fuel cells.
Compared with metal hydride, methanol reformers have longer
durability and a larger capacity of energy storage. Since the
methanol is reformed for submarines, the operating pressures are
very high. Even though the high pressure prevents a highly
efficient conversion operation, it is necessary to work the
reformer at that pressure to conceal the submarine from an
external signature.
Several studies have been done in the field of the methanol
steam reforming reaction. Amphlett et al. performed experiments
on methanol conversion and reported that methanol conversion
increased as the molar number of water vapor increased [5].

Advances in Energy Research: 2nd
Edition
4 www.videleaf.com
Reiyu Chein et al. conducted a numerical study on the steam
reforming reaction and identified the mole fractions of methanol,
hydrogen, and carbon monoxide in the reforming process [6].
This confirms the validity of numerical analysis for the methanol
steam reforming reaction. Additionally, Ataallah et al. developed
a three-dimensional model using CFD to study some parameters
and features that affect the performance of a methanol steam
reformer in a linear reactor with a straight channel [7]. They
reported that the performance of the methanol steam reforming
reaction at constant inlet mass flow rates and velocities varies
with the channel dimensions and operating conditions. Shuji et
al. investigated the behavior of catalyst materials, sheet paper
containing SiC fibers, catalyst powders, and catalyst pellets,
under different space velocities (SV) in the methanol steam
reforming reaction [8].
On the other hand, Ji et al. reported on the steam reforming of
methanol using phase change heat transfer [9,10]. Since the
methanol steam reforming temperature ranges from 200 to 300
°C, they had to select an appropriate phase change medium for
the temperature range. The phase change medium of their
methanol steam reformer was deionized water, and the
temperature and pressure of the phase change process were
determined by the operating condition of the methanol steam
reforming process. This idea is novel, and they experimentally
evaluated the performance of the methanol reformer; however,
the operating mechanism still needs to be examined. They also
show that the high-pressure operation of the methanol steam
reforming reaction produces a high concentration of carbon
monoxide. They also pointed out that the concentration of carbon
monoxide can be significantly reduced with the increasing SM
(Steam to Methanol) ratio [11].
In particular, since the reaction mechanism comprises important
parameters, the reaction kinetics are widely studied and reported
[1–8]. However, most of the methanol steam reforming
processes in literature are heated by the combustion of fuel or
hot gases. There are scarce reports about the methanol reforming
process with phase change heat transfer. Additionally, since the
phase change of water around 200 to 300 °C requires very high

Advances in Energy Research: 2nd
Edition
5 www.videleaf.com
vapor pressure, it is very difficult to find an experimental or
numerical study of the methanol steam reforming process with
phase change heat transfer.
In this study, a computational analysis was performed to
investigate the behavior of a high-pressure methanol steam
reforming process with phase change heat transfer. The water
vapor condensation and the methanol steam reforming reaction
take place in a hollow tube. Since the temperature of the phase
change medium in the radial direction is varied and in the
longitudinal direction as well, the methanol steam reforming
reaction is closely linked to those temperature distributions. The
computational sections are divided into two different regimes:
one for phase change heat transfer and the other for the methanol
steam reforming process.
Simulation Model
The methanol steam reforming process with phase change heat
transfer is conducted in annulus tubes that layer two different
sizes of tubes in the same center. The methanol and the steam
flow into the inner tube, and superheated steam flows into the
outer tube. The flow arrangement is a parallel flow. The
methanol steam reformer has two compartments, which require
two different analysis schemes. One is dominated by a two-phase
flow, and the other is dominated by the methanol steam
reforming process in porous media. Figure 1 shows the
geometric information of the computational analysis. There is a
methanol steam reforming zone inside of the hollow tube, and
heat is supplied from the outer tube to the reaction zone by the
phase change of the steam. The flow direction of the reformer
zone and phase change zone is parallel. The total height of the
tube is 700 mm, and the thickness between the inner shell and
outer shell is 2.1 mm. Since heat is transferred from the outer
shell to the inner shell, it is observed that the outer surface of the
inner shell has condensed vapors on it. The other conditions are
summarized in Table 1.

Advances in Energy Research: 2nd
Edition
6 www.videleaf.com
Figure 1: Geometry of methanol steam reformer for numerical
computation.
Table 1: Geometric and operating parameters of numerical computation.
Parameters Dimension Unit Expression
T1 280 °C Inlet temperature
Ts 279.9616 °C Saturation temperature
P1 64.1646 bar Inlet pressure of steam condensation
zone
P2 30 bar Inlet pressure of reaction zone
L 70 mm Total length

Advances in Energy Research: 2nd
Edition
7 www.videleaf.com
Lt 2.1082 mm Tube thickness
r1 2.9464 mm Inlet radius of heat source zone
r2 10.5918 mm Inlet radius of reaction zone
R 15.6459 mm Total radius
8055 kg/m3 Density of solid tube
Cp 480 J/kgK Specific heat of solid tube
k 15.1 W/mK Thermal conductivity of solid tube
Since the vapor flow goes down by gravity, water vapor
condenses on the inner surface of the outer tube. When the
temperature of the water vapor meets a vapor saturation state,
water droplets cover the outer tube, which act as heat transfer
resistance.
Reaction Kinetics
The reaction kinetics of the methanol steam reforming process
have been widely investigated. The following three processes are
known to be the main reactions of the methanol steam reforming
reaction [10–16]. The methanol steam reforming reaction is
described by three elementary reactions: methanol steam
reforming reaction (SR), methanol decomposition (MD), and
water gas shift (WGS) reaction.
Methanol steam reforming reaction (SR)
(1)
Water gas-shift reaction (WGS)
(2)
Methanol decomposition reaction (MD)
(3)
The Arrhenius equation is applied to calculate the chemical
reaction rate. The basic form of the Arrhenius equation is as
follows:
(4)

Advances in Energy Research: 2nd
Edition
8 www.videleaf.com
where Ea is the activation energy, A is the pre-exponential factor,
and k is the reaction rate constant. The kinetics constants of the
methanol steam reforming reaction at 200 to 300 °C are shown
in Table 2 [14–17].
Table 2: Constants of the Arrhenius equation for methanol steam
reforming reaction.
Reaction Step A[kmol/m3s] Ea[kJ/mol] Reaction Name
1.43 × 10⁹ 1.22 × 10⁸ Methanol decomposition
reaction
5.115 × 10⁷ 8.77 × 10⁷ Water–gas shift reaction
2.002 × 10⁹ 9.27 × 10⁷ Steam reforming
reaction
Governing Equations
The gas mixture of the methanol and steam flows through the
inner tube, and the steam reforming reaction is progressed. The
governing equations are as follows:
Continuity equation
(5)
Momentum equation
g (6)
Energy balance equation
( ) (7)
(8)
∫
(
)
. (9)

Advances in Energy Research: 2nd
Edition
9 www.videleaf.com
The reforming zone is filled with a catalyst. The reaction zone is
set up to be porous media, and the catalytic reaction on the
surface of the pellet is simulated by chemical kinetics. It is
assumed that the porous media is charged homogenously, and
the flow is laminar. Darcy’s law is used to determine the internal
velocity.
(10)
Darcy’s law is represented by the sum of the inertial resistance
and the viscous resistance. In addition, the porosity should be set
and expressed as r in the following equation.
(11)
The porosity (r) is the ratio of the fluid volume to the total
volume. The effective heat transfer coefficient (keff) is
determined by the sum of kf, the heat transfer coefficient in the
fluid zone, and ks, the heat transfer coefficient in the solid zone.
On the other hand, saturated steam flows into the empty space in
the outer tube, and the condensation condition is determined by
the steam pressure and temperature. When the steam is induced,
the pressure is set as 64.16 bar and the saturation temperature is
set to 279.96 °C (553.11 K). When the endothermic reaction
takes place in the reaction zone, the heat absorption results in the
condensation of the steam. The vapor condensation is calculated
by the Eulerian Lee model [14]. The liquid–vapor mass transfer
(evaporation and condensation) is governed by the vapor
transport equation.
(12)
Here, and are the rates of mass transfer due to
evaporation and condensation, respectively. In the evaporation–
condensation problem, mass transfer from the liquid to vapor is a
positive mass transfer, and the units of Equation (11) are in
kg/s/m3. The mass transfer rate on the right hand side of
Equation (11) is defined as follows:

Advances in Energy Research: 2nd
Edition
10 www.videleaf.com
(13)
(14)
Here, and are the phase volume fraction and density,
respectively. coeff is a coefficient that must be tuned finely and
can be interpreted as a relaxation time. The volume fractions
represent the space occupied by each phase. The volume Vc of
phase q is defined as follows.
∫ (15)
. (16)
The effective density of q is expressed as follows.
. (17)
In the above expression, is the physical density of phase q. In
addition, the governing equation on q is as follows.
Continuity equation
( ) ( ) ( )
(18)
Here, vq is the velocity of phase q, characterizes the mass
transfer from the pth to qth phase, and characterizes the
mass transfer from phase q to phase p.
The momentum balance equation for phase q yields
( ) ( )
( ) . (19)
This is the momentum balance equation for phase q where is
the qth phase stress–strain tensor.

Advances in Energy Research: 2nd
Edition
11 www.videleaf.com
( )
(20)
Here, and are the shear and bulk viscosity of phase q; is
an external body force; is a lift force; is a virtual
mass force; is an interaction force between the phases, and p
is the pressure shared by all the phases.
Lift forces act on a particle mainly due to velocity gradients in
the primary phase flow field. The lift force will be more
significant for larger particles, but the ANSYS Fluent® model
assumes that the particle diameter is much smaller than the inter-
particle spacing [14]. Thus, the inclusion of lift forces is not
appropriate for closely packed particles or for very small
particles. The lift force acting on a secondary phase p in a
primary phase q can be calculated by the formula below.
(21)
The inertia of the primary-phase mass encountered by the
accelerating particles (or droplets or bubbles) exerts a ―virtual
mass force‖ on the particles. The virtual mass force is as follows.
(22)
depends on the fiction, pressure, cohesion, and other
effects. is the interphase velocity, which is defined as follow.
.
Likewise,
Computational Methods and Boundary Conditions
Meshes are shown in Figure 2. The solver is a pressure-based
solver, and a transient analysis was conducted. Additionally,
axisymmetric computation was used to facilitate the analysis.
Advances in Energy Research: 2nd
Edition
12 www.videleaf.com
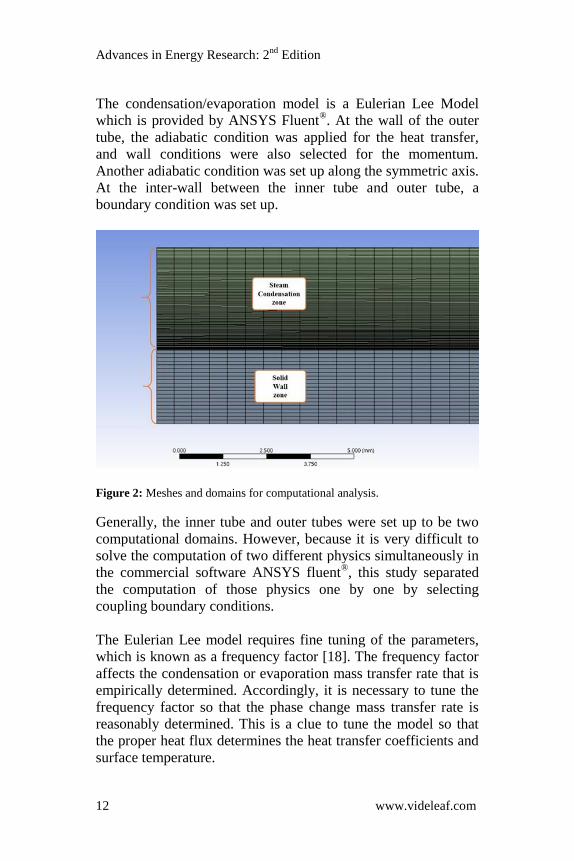
The condensation/evaporation model is a Eulerian Lee Model
which is provided by ANSYS Fluent®. At the wall of the outer
tube, the adiabatic condition was applied for the heat transfer,
and wall conditions were also selected for the momentum.
Another adiabatic condition was set up along the symmetric axis.
At the inter-wall between the inner tube and outer tube, a
boundary condition was set up.
Figure 2: Meshes and domains for computational analysis.
Generally, the inner tube and outer tubes were set up to be two
computational domains. However, because it is very difficult to
solve the computation of two different physics simultaneously in
the commercial software ANSYS fluent®, this study separated
the computation of those physics one by one by selecting
coupling boundary conditions.
The Eulerian Lee model requires fine tuning of the parameters,
which is known as a frequency factor [18]. The frequency factor
affects the condensation or evaporation mass transfer rate that is
empirically determined. Accordingly, it is necessary to tune the
frequency factor so that the phase change mass transfer rate is
reasonably determined. This is a clue to tune the model so that
the proper heat flux determines the heat transfer coefficients and
surface temperature.

Advances in Energy Research: 2nd
Edition
13 www.videleaf.com
At first, the constant heat flux conditions were the boundary
condition of the inner tube side of the inter-wall. The first
domain was the steam reforming zone, and the second domain
was the solid tube. When the methanol steam reforming reaction
progresses through the inner tube, it is assumed that a constant
heat flux is absorbed from the steam condensation zone.
When the constant heat flux is acting on the surface of the inner
wall, the inter-wall temperatures is Ts which is the surface
temperature of the phase change zone, and the inner wall
temperature is which is the surface temperature of the steam
reforming zone. Those notations are also found in Figure 1. The
constant heat flux boundary conditions were set up to be 1, 2.5,
and 5 kW. Equation 22 explains the heat transfer correlation with
the induction of the constant heat flux from the wall. Ts, Ti, and h
are unknowns, and h is a function of Ts. The methanol and steam
mixture temperature through the inner tube and steam
temperature through the outer tube were varied in the
longitudinal direction. The heat transfer rate should be calculated
by the log mean temperature difference (LMTD). It is assumed
that the steam is not fully condensed throughout the outer tube.
Then, the steam temperature of the outer tube should be
maintained. Then, the heat transfer rate is explained as follows:
(23)
(24)
(
) . (25)
The convection heat transfer coefficient on the wall of a circular
tube is calculated by the following equation [19].
(26)
where,

Advances in Energy Research: 2nd
Edition
14 www.videleaf.com
[
(
)
]
.
All liquid property should be obtained from the film temperature
Tf = (Tsat + Ts)/2, and hfg should be obtained from Tsat. Ts in
Equation (25) is calculated by the arithmetic average of Ts in
between the inlet and outlet. Since the average heat transfer
coefficient is calculated by Equations (22) and (25), a new
temperature Ts is updated by iteration.
The temperatures in Table 3 were used to determine the
frequency factors of each heat flux case. Then, the frequency
factor was fixed, and the phase change phenomena were
analyzed.
Table 3: Inner wall temperature and inter-wall temperature in terms of constant
heat flux conditions.
Heat Rate [kW] Ts [K] Ti [K]
1 545.17 542.54
2.5 534.79 527.96
5 514.39 500.73
Simulation Results and Discussion Phase Change Trends with Surface Heat Absorption
As the heat fluxes were increased, the steam temperature
decreased in the radial direction. Condensation was also
observed on the surface. Figure 3 shows the steam temperature
profile and liquid volume fraction profile in the outer tube. As
expected, the near-wall temperature is about 7 K lower for the 1
kW heat absorption. Then, the wall temperature further
decreased with a higher heat absorption rate. Near the inter-wall,
the steam temperature slope was dramatically decreased due to
heat absorption. Then, the steam temperature in the phase change
zone rose rapidly to 280 °C, which is the inlet temperature of the
steam. Another aspect was the temperature profile in the radial
direction. As shown in Figure 3, the near-wall temperature

Advances in Energy Research: 2nd
Edition
15 www.videleaf.com
gradient was quite large, and a very thin boundary layer was
observed regardless of the absorbed heat. This is because the
condensed liquid increases the thermal resistance of the heat
transfer. Accordingly, the outer zone from the temperature
boundary layer maintained its temperature at the phase change
condition.
As the heat absorption increased, the liquid volume fraction near
the wall is almost 1.0, which implies that the surface is covered
with a thin liquid film. The gravity force made the liquid volume
fraction boundary layer become thicker along the channel. As
steam flows into the outer tube, the liquid volume fraction
steeply increased. The more heat is absorbed, the earlier the
saturated water is observed through the tube. Then, the liquid
volume fraction grew near the inter-wall along the longitudinal
direction. It was also shown that most of the area in the outer
tube was occupied by saturated steam.
Figure 3: Vapor temperature and water volume fraction along flow direction
(three different heat fluxes as well boundary conditions).
The thermal boundary layer thickness was defined as 0.999 of
the free stream temperature, and the liquid volume fraction was
defined as 0.999 of the saturated vapor. The results are shown in
Figure 4. The thickness of the temperature boundary layer was
thinner than the thickness of the liquid volume fraction boundary
layer. It shows that the mixture of steam and liquid water stayed
on the liquid boundary layer. As observed, the concentration
boundary layer is thicker for all the heat absorption rates, and the
thickness increased linearly. The thickness difference between
the boundary layer is large for the 1 kW heat absorption

Advances in Energy Research: 2nd
Edition
16 www.videleaf.com
condition. As the heat absorption rate was increased, the
thickness difference between the two boundary layers changed
little.
Figure 4: Temperature and liquid volume fraction boundary layer thickness at
the exit of the outer tube for the three different heat absorption rates.
The radial temperature profile is shown in Figure 5. The linear
increase zone is the solid inter-wall, and a steep temperature
increase was observed from the surface of the inter-wall to the
steam zone. The overall steam temperature in the radial direction
was mainly constant at the saturated condition. Another
observation was the gradual temperature down along the
longitudinal direction. Even though the temperature of the steam
was maintained, the wall temperature decreased with a higher
heat flux. One interesting feature is the steam temperature. The
steam temperature was maintained over the various heat flux
conditions, while the wall temperature dramatically changed
with the higher heat flux.

Advances in Energy Research: 2nd
Edition
17 www.videleaf.com
Figure 5: Evolution of radial temperature profile in terms of the heat fluxes.
The water volume fraction of the outer tube rapidly increased
right after inducing the steam, and the water volume fraction was
then 1 at the exit. Figure 6 shows the water volume fraction at
the inlet and exit. As observed, the water volume fraction at the
inlet is steeper with a higher heat absorption rate, and the water
volume fraction at the exit is thicker with a higher amount of
heat flux.

Advances in Energy Research: 2nd
Edition
18 www.videleaf.com
Figure 6: Water volume fraction near the wall in terms of the heat flux.
The overall liquid fraction of the saturated steam along the outer
tube is determined by the integration of the liquid mass over the
space. Thermodynamically, the quality is the ratio of the steam
mass to the total mass and is calculated as follows.
(27)
(28)
Here, x is the quality; xf is the water mass ratio; mg is the mass of
them steam, and mf is the mass of the water. Figure 7 shows the
total mass ratio of condensed water in the outer tube. As shown,
the ratio of condensed water is proportional to the heat flux to
the steam reforming process. The ratios of the water mass to the
total mass for each heat flux condition were 26.38%, 33.95%,
and 40.10%. Accordingly, the volume of the liquid is relatively
small, and the mass of the steam is not negligible.

Advances in Energy Research: 2nd
Edition
19 www.videleaf.com
Figure 7: Ratio of water mass to total mass over three different heat fluxes.
The heat absorption from the phase changing steam results in a
temperature change on the inter-wall surface. The surface
temperature of the inner tube (Ti) is captured in Figure 8. As
shown, the surface temperature non-linearly decreased, and the
initial temperature was lower than the steam methanol inlet
temperature. One reason is from heat transfer through the solid
wall. The solid wall is acting as thermal resistance to the heat
transfer. Another reason is the condensation of the steam from
the inlet. As shown in Figure 4, a significant temperature drop is
observed at the near inlet of the phase change zone. The
temperature drop results in a lower temperature of the solid
surface (Ti) at the inlet of the methanol steam reforming zone.

Advances in Energy Research: 2nd
Edition
20 www.videleaf.com
Figure 8: Inner wall temperature profile along the channel with 2.5 kW heat
flux.
Physical Behavior in the Methanol Steam Reforming
Reaction
The temperature profile through the inner tube was determined
by the boundary conditions and reaction characteristics. The
temperature trends were observed at the 2.5 kW heat flux
boundary conditions. Due to the presence of the porous methanol
steam reforming catalyst, the temperature profile in the radial
direction is almost flat. The longitudinal temperature profile is
determined by the temperature profile in Figure 8 and the
symmetry condition. Figure 9 shows the temperature profile of
the chemical reaction zone. The gas inlet temperature was 553 K,
which was a higher temperature than the wall temperature. As
observed, the initial gas temperature rapidly dropped due to the
temperature difference between the gas temperature and the wall
temperature. After the first hill from the higher temperature to
the lower temperature, the temperature profiles can be seen in
Figure 8. Then, the methanol steam mixture temperature is
similar to the wall temperature. The mixture temperature was
553 K at maximum and 527 K at minimum.

Advances in Energy Research: 2nd
Edition
21 www.videleaf.com
Figure 9: Temperature of chemical reaction zone (2.5 kW heat flux).
Methanol steam reforming reaction consists of three reaction
mechanism: steam reforming reaction, water gas shift reaction,
and methanol decomposition reaction. Those three reactions are
traced in Figure 10. As observed, the order of the steam
reforming reaction is almost 103 times greater than the other two
reactions. Accordingly, the products of the reforming reaction
will be mainly H2, CO2, and H2O. Another aspect is that the
reaction rates decay along the channel. Initially, the reaction rate
of the steam reforming reaction was quite high and steeply
decreased along the channel. It was observed that the wall
temperature profile affects the decay of the methanol
decomposition rate. However, the methanol steam reforming
reaction rate looks less affected by the wall temperature profile.
Instead, the concentration of methanol has a more significant
effect on the methanol steam reforming reaction.
Figure 10: Contribution of elementary reaction kinetics along the tube.
MD: methanol decomposition, SR: methanol steam reforming reaction,
WGS: water gas shift.

Advances in Energy Research: 2nd
Edition
22 www.videleaf.com
Because the steam reforming reaction mechanism dominates the
overall reaction, the products are mostly H2, CO2, and H2O.
Figure 11 shows the mole fraction evolution of the product gases
and the decay of methanol. As observed, the concentrations of
H2 and CO2 gradually increase along the pipe. The maximum
mole fraction of H2 is 0.58, and CH3OH gradually decreases at
the rear end of the reaction zone, resulting in a mole fraction of
0.09. The mole fraction of the reactants CH3OH and H2O
decreases as the reaction proceeds in the Z direction. Another
aspect is the consumption rate of H2O. As observed, the H2O
concentration decreased over a short time in the frontal regime,
and the concentration gradually decreased. Because the hydrogen
production is dominated by steam reforming, it was observed
that the consumption of water corresponded to the hydrogen
concentration.
(a) Mole fraction of CH3OH
(b) Mole fraction of CO

Advances in Energy Research: 2nd
Edition
23 www.videleaf.com
(c) Mole fraction of CO2
(d) Mole fraction of H2
(e) Mole fraction of H2O
Figure 11: Species concentration of the methanol steam reforming
reaction zone.
Conclusions
In this study, computational analysis of high pressure methanol
steam reforming reaction with the phase change of steam at
saturation pressure are conducted.
1) High-pressure methanol reforming reaction and high-
pressure steam condensation phenomena are connected by

Advances in Energy Research: 2nd
Edition
24 www.videleaf.com
constant heat flux conditions. Therefore, two different
physical phenomena is explained by transferred heat flux.
2) As the heat absorption of methanol steam reforming process
results in vapor condensation, the inter-wall temperature
between reforming zone and phase change zone is
decreased.
3) Since the temperature boundary layer is thinner than the
liquid volume fraction boundary layer, the steam liquid
mixture stays on the liquid water layer.
4) The non-linear solid temperature of the inner wall affects
the kinetics of the methanol decomposition reaction, but the
kinetics of the steam reforming reaction and water gas shift
reaction are rarely affected by the non-linear temperature
profile of the inner wall.
5) Since the overall reaction takes place within narrow radius
porous media, the negligible concentration difference is
observed through the steam reforming zone.
References
1. Kim S, Yun SW, Lee B, Heo J, Kim K, et al. Steam
reforming of methanol for ultra‐ pure H2 production in a
membrane reactor: Techno-economic analysis. Int. J.
Hydrog. Energy. 2019; 44: 2330–2339.
2. Iulianelli A, Ribeirinha P, Mendes A, Basile A. Methanol
Steam Reforming for hydrogen generation via conventional
and membrane reactor: A review. Renew. Sustain. Energy
Rev. 2014; 29: 355–368.
3. Sahlin SL, Andreasen SJ, Kær SK. System model
development for a methanol reformed 5 kW high
temperature PEM fuel cell system. Int. J. Hydrog. Energy.
2015; 40: 13080–13089.
4. Krummrich S, Llabrés J. Methanol reformer—The next
milestone for fuel cell powered submarines. Int. J. Hydrog.
Energy. 2015; 40: 5482–5486.
5. Amphlett JC, Evans MJ, Mann RF, Weir RD. Hydrogen
production by the catalytic steam reforming of methanol Part
2: Kinetics of methanol decomposition using girdler G66B
catalyst. Can. J. Chem. Eng. 1985; 63: 605–611.

Advances in Energy Research: 2nd
Edition
25 www.videleaf.com
6. Chein R, Chen Y, Chung JN. Numerical study of methanol-
steam reforming and methanol-air catalytic combustion in
annulus reactors for hydrogen production. Appl. Energy.
2013; 102: 1022–1034.
7. Ataallah S, Javad S. Modeling and 3D-simulation of
hydrogen production via methanol steam reforming in
copper-coated channels of a mini reformer. J. Power
Sources. 2017; 352: 64–76.
8. Shuji F, Hirotaka K, Takuya K, Mitsuyoshi N, Hiroyuki W.
Steam reforming behavior of methanol using paper-
structured catalysts: Experimental and computational fluid
dynamic analysis. Int. J. Hydrog. Energy. 2008; 33: 1661–
1670.
9. Ji H, Lee J, Choi E, Seo I. Hydrogen Production from steam
reforming using an indirect heating method. Int. J. Hydrog.
Energy. 2018; 43: 3655–3663.
10. Ji H, Lee J, Choi E, Yang S. Methanol Steam Reforming
Using Multilayer Cup Structure for Catalyst Support. Trans.
Kor. Hydrog. New Energy Soc. 2020; 31: 202–209.
11. Ji H, Choi E, Lee J. Optimal Operating Condition of
Pressurized Methanol Fuel Processor for Underwater
Environment. Trans. Kor. Hydrog. New Energy Soc. 2016;
27: 485–493.
12. Park JE, Park JH, Yim SD, Kim CS, Park ED. A
comparative study of commercial catalysts for methanol
steam reforming. Kor. Chem. Eng. Res. 2005; 43: 344–351.
13. Seo BC, Kim MC, Kim GR. Methanol steam reforming
reaction, 192. Kor. Chem. Eng. Res. 2017; 10: 438–445.
14. Purnama H, Ressler T, Jentoft R, Soerijanto H, Schlögl R, et
al. CO formation/selectivity for steam reforming of methanol
with a commercial CuO/ZnO/Al2O3 catalyst. Appl. Catal.
2004; 259: 83–94.
15. Chiu YJ, Chiu HC, Hsieh RH, Jang JH, Jiang BY.
Simulation of Hydrogen Production by Methanol Steam
Reforming. Energy Proc. 2019; 156: 38–42.
16. Choi Y, Stenger HG. Kinetics, simulation and optimization
of methanol steam reformer for fuel cell applications. J.
Power Sources. 2005; 142: 81–91.
17. Ribeirinha P, Boaventura M, Lopes JCB, Sousa J, Mendes
A. Study of Different Designs of Methanol Steam

Advances in Energy Research: 2nd
Edition
26 www.videleaf.com
Reformers: Experiment and Modeling. Int. J. Hydrog.
Energy. 2014; 39: 19970–19981.
18. Lee WH. ANSYS Fluent® Theory Guide 2019R1. Available
online: www.ansys.com
19. Incropera FP, Lavine AS, Bergman TL, DeWitt DP.
Principles of Heat and Mass Transfer, 7th ed. Hoboken: John
Wiley & Sons, Inc. 2013.