a comprehensive tutorial on science dmz
TRANSCRIPT

IEEE COMMUNICATIONS SURVEYS & TUTORIALS, VOL. 21, NO. 2, SECOND QUARTER 2019 2041
A Comprehensive Tutorial on Science DMZJorge Crichigno , Elias Bou-Harb , and Nasir Ghani
Abstract—Science and engineering applications are nowgenerating data at an unprecedented rate. From large facilitiessuch as the Large Hadron Collider to portable DNA sequencingdevices, these instruments can produce hundreds of terabytes inshort periods of time. Researchers and other professionals rely onnetworks to transfer data between sensing locations, instruments,data storage devices, and computing systems. While general-purpose networks, also referred to as enterprise networks, arecapable of transporting basic data, such as e-mails and Web con-tent, they face numerous challenges when transferring terabyte-and petabyte-scale data. At best, transfers of science data onthese networks may last days or even weeks. In response to thischallenge, the Science Demilitarized Zone (Science DMZ) hasbeen proposed. The Science DMZ is a network or a portion ofa network designed to facilitate the transfer of big science data.The main elements of the Science DMZ include: 1) specializedend devices, referred to as data transfer nodes (DTNs), built forsending/receiving data at a high speed over wide area networks;2) high-throughput, friction-free paths connecting DTNs, instru-ments, storage devices, and computing systems; 3) performancemeasurement devices to monitor end-to-end paths over multipledomains; and 4) security policies and enforcement mechanismstailored for high-performance environments. Despite the increas-ingly important role of Science DMZs, the literature is stillmissing a guideline to provide researchers and other profes-sionals with the knowledge to broaden the understanding anddevelopment of Science DMZs. This paper addresses this gap bypresenting a comprehensive tutorial on Science DMZs. The tuto-rial reviews fundamental network concepts that have a largeimpact on Science DMZs, such as router architecture, TCPattributes, and operational security. Then, the tutorial delves intoprotocols and devices at different layers, from the physical cyber-infrastructure to application-layer tools and security appliances,that must be carefully considered for the optimal operation ofScience DMZs. This paper also contrasts Science DMZs withgeneral-purpose networks, and presents empirical results anduse cases applicable to current and future Science DMZs.
Index Terms—Science DMZ, network flows, friction-free paths,data transfer node, bandwidth-delay product, perfSONAR.
I. INTRODUCTION
WHEN the United States (U.S.) decided to build theinterstate highway system in the 1950s, the country
Manuscript received December 21, 2017; revised July 28, 2018; acceptedSeptember 11, 2018. Date of publication October 17, 2018; date of currentversion May 31, 2019. This work was supported by the Office of AdvancedCyberinfrastructure of the U.S. National Science Foundation under Award1541352 and Award 1829698. (Corresponding author: Jorge Crichigno.)
J. Crichigno is with the Department of Integrated Information Technology,College of Engineering and Computing, University of South Carolina,Columbia, SC 29208 USA (e-mail: [email protected]).
E. Bou-Harb is with the Department of Computer Science, Florida AtlanticUniversity, Boca Raton, FL 33431 USA (e-mail: [email protected]).
N. Ghani is with the Electrical Engineering Department, University of SouthFlorida, Tampa, FL 33620 USA, and also with the Cyber Florida Center,University of South Florida, Tampa, FL 33620 USA (email: [email protected]).
Digital Object Identifier 10.1109/COMST.2018.2876086
Fig. 1. Monthly average traffic volume through ESnet [3].
already had city streets and two-lane highways for daily-lifetransportation. While at first this system appeared to beredundant, the interstate highway system increased the ease oftravel for Americans and the ability to transport goods fromeast to west, without stoplights [1].
Tracing similarities with the current cyberinfrastructure,today’s general-purpose networks, also referred to as enter-prise networks, are capable of efficiently transporting basicdata. These networks support multiple missions, includingorganizations’ operational services such as email, procure-ment systems, and Web browsing. However, when transferringterabyte- and petabyte-scale science data, enterprise networksface many unsolved challenges [2]. Key issues preventing highthroughput include slow processing by CPU-intensive secu-rity appliances, inability of routers and switches to absorbtraffic bursts generated by large flows, end devices that areincapable of sending and receiving data at high rates, lack ofdata transfer applications that can exploit the available networkbandwidth, and the absence of end-to-end path monitoring todetect failures.
The need for a suitable cyberinfrastructure for large flowsis illustrated in Fig. 1, which shows the monthly average traf-fic volume through the Energy Science network (ESnet) [3].ESnet is a high-performance network that carries science traf-fic for the U.S. Department of Energy. As of 2018, thisnetwork is transporting tens of petabytes (PBs) per month, anincrease of several orders of magnitude from some years ago.
In response to this challenge of transmitting big sciencedata via a cyber-highway system without stoplights, ESnetdeveloped the concept of Science Demilitarized Zone (ScienceDMZ or SDMZ) [4]. The Science DMZ is a network or aportion of a network designed to facilitate the transfer of
1553-877X c© 2018 IEEE. Personal use is permitted, but republication/redistribution requires IEEE permission.See http://www.ieee.org/publications_standards/publications/rights/index.html for more information.

2042 IEEE COMMUNICATIONS SURVEYS & TUTORIALS, VOL. 21, NO. 2, SECOND QUARTER 2019
Fig. 2. Science DMZ data transfer applications. Top left: The Large Hadron Collider (LHC) produces approximately 30 PBs per year. Data is transmittedto multiple computing centers around the world. Photo courtesy of The European Organization for Nuclear Research [5]. Top center: The Very Large Array(VLA) is composed of 27 radio antennas of 25 meters in diameter each. Daily data collection comprises of several TBs, which are transmitted to researchlaboratories worldwide. Photo courtesy of the U.S. National Radio Astronomy Observatory [6]. Top right: Experimental Advanced Superconducting Tokamak.Data generated by the energy reactor is transmitted for analysis via a Science DMZ. Photo courtesy of ESnet [7]. Bottom left: magnetic resonance imagingscanner. Major brain imaging studies such as the Alzheimer’s disease neuroimaging requires storage and transmission of multiple PBs of data [8]. Medicaldata can now be transported via medical Science DMZs [9], [10]. Photo courtesy of General Electric Healthcare [11]. Bottom center: Atomic, Molecular, andOptical (AMO) instrument. The instrument is used for a variety of experiments, such as illumination of single molecules. A single experiment can produce150 to 200 TBs [12]. Photo courtesy of the U.S. SLAC National Accelerator Laboratory [13]. Bottom right: portable device for DNA and RNA sequencingwhich generates tens of GBs of data per experiment [14]. Photo courtesy of Nanopore Technologies [15].
big science data across wide area networks (WANs), typi-cally at rates of 10 Gbps and above. In order to operate atsuch rates, this setup integrates the following key elements:i) end devices, referred to as data transfer nodes (DTNs),that are built for sending/receiving data at a high rate overWANs; ii) high-throughput paths connecting DTNs, instru-ments, storage devices, and computing systems. These pathsare composed of highly-capable routers and switches and haveno devices that may induce packet losses. They are referred toas friction-free paths; iii) performance measurement devicesthat monitor end-to-end paths over multiple domains; andiv) security policies and enforcement mechanisms tailored forhigh-performance science environments.
The Science DMZ architecture is similar to building theinterstate highway system, whereas stoplights are removedto permit the high-speed movement of large flows. Theinterconnection of Science DMZs is also analogous to thedevelopment of the National Science Foundation network(NSFnet) in 1985, one of the predecessors of today’s Internet.NSF, the main government agency in the U.S. supportingresearch and education in science and engineering, establishedthe NSFnet to link together five supercomputer centers thatwere then deployed across the U.S. [16]. With Science DMZs,institutions are similarly linked together and have access to avirtual co-location of data that may rest anywhere in the worldthrough a high-speed data-sharing architecture. Along theselines, Fig. 2 highlights applications that currently exploit theScience DMZ architecture to transmit large flows from instru-ments to laboratories for data analysis. From very large to
portable devices, these instruments generate a large amount ofdata in short periods of time.
A. Contribution
At present, there is an increasing need to deploy ScienceDMZs in support of big science data transfers. However,efforts to prepare researchers and other professionals withthe right knowledge are limited to dispersed work by theacademia and the industry. Despite the importance of ScienceDMZs, currently there is no structured material in the formsof tutorials, surveys, or books.
This article addresses this gap in the literature by present-ing a comprehensive tutorial on Science DMZs. Followinga systematic approach through every layer of the protocolstack, the tutorial integrates information and tools for a bet-ter understanding of the issues, key challenges, best practices,and future research directions related to Science DMZs. Thepaper also presents empirical results and use cases obtainedfrom state-of-the-art facilities and across a continental back-bone. The results and use cases reinforce concepts and providefindings that are applicable to current and future ScienceDMZs. Since current researchers and practitioners are mostlytrained to design and operate enterprise networks, this arti-cle will familiarize readers with Science DMZs, resulting in abroadening of the development and deployment of ScienceDMZs. The article reflects the wide interest of academiaand industry in Science DMZs as an integrative systemto build a high-speed cyber-highway. Examples include the

CRICHIGNO et al.: COMPREHENSIVE TUTORIAL ON SCIENCE DMZ 2043
strong support of NSF and communities around the worldendorsing the upgrade of network connectivity for sciencedata transmissions [17], [18] and initiatives to improve WANdata transfers [19], [20]. Leading manufacturers of routers andswitches, such as Cisco [21], Brocade [22], Ciena [23], andothers, are now responding to the need for equipment suit-able for Science DMZs. Window-based congestion control(used since the 1990s at the transport layer) is now beingchallenged by new paradigms such as rate-based congestioncontrol [24], [25]. Application-layer tools targeted for ScienceDMZs are incorporating high-performance features to facili-tate the sharing of big data [26]. Industry security leaders [27]and U.S. national laboratories [28] are now designing appli-ances amenable for large flows while protecting the ScienceDMZ and increasing rates beyond 100 Gbps [29].
B. Paper Structure
The article follows a bottom-up approach, from the phys-ical cyberinfrastructure to the application layer and securityaspects. Section II presents the motivation for and architectureof Science DMZs. This section also describes the WAN cyber-infrastructure supporting Science DMZs. Section III discussesattributes related to routers and switches, which are at thecore of Science DMZs. Section IV describes key features thatmust be considered at the transport layer in Science DMZs.Section V presents application-layer tools used in ScienceDMZs and their features to support science data transfers.Section VI describes security challenges arising in ScienceDMZs and presents best practices. Section VII presents empiri-cal results and use cases. Section VIII describes key challengesand open research issues, and Section IX concludes this article.Each section describes Science DMZ features at a particularlayer in the protocol stack. As these features are describedand analyzed, they are also compared with those featuresused in enterprise networks. Contrasting Science DMZs withenterprise networks provides essential information for a betterunderstanding of the former. The abbreviations used in thisarticle are summarized in Table XI, at the end of the article.
C. Definition of a Flow
Central to the discussion of the Science DMZ is the conceptof a flow. This article follows the definition of a flow by theIP Flow Information Export (IPFIX) working group within theInternet Engineering Task Force (IETF) [30], [31]:
A flow is defined as a set of IP packets passing an obser-vation point in the network during a certain time interval. Allpackets belonging to a particular flow have a set of commonproperties.
The common properties adopted in this article are the sourceand destination IP addresses, source and destination transport-layer ports, and transport-layer protocol. Additionally, thereare two flow characteristics that are significant in this paper.The first characteristic is the duration of the flow, which is thetime interval elapsed between the first and last packets with thesame common properties. The second characteristic is the vol-ume or size of the flow, which is the aggregate number of bytescontained in the packets with the same common properties.
Fig. 3. A campus enterprise network.
II. SCIENCE DMZ ARCHITECTURE AND PHYSICAL
CYBERINFRASTRUCTURE
A. Limitations of Enterprise Networks and Motivation forScience DMZs
An enterprise network is composed of one or moreinterconnected local area networks (LANs). Common designgoals are:
• To serve a large number of users and platforms: desktops,laptops, mobile devices, supercomputers, tablets, etc.
• To support a variety of applications: email, browsing,voice, video, procurement systems, and others.
• To provide security against the multiple threats that resultfrom the large number of applications and platforms.
• To provide a level of Quality of Service (QoS) thatsatisfies user expectations.
To serve multiple applications and platforms, the network isdesigned for general purposes. To provide an adequate securitylevel, the network may use multiple CPU-intensive appliances.Besides a centrally-located firewall, internal firewalls are oftenused to add stringent filtering capability to sensitive subnet-works. The network may only provide a minimum level ofQoS, which is often sufficient. The level of QoS does notneed to be strict, as applications can improve on the ser-vice provided by the network. Moderate bandwidth, latency,and loss rates are most of the time acceptable, as flows havea small size (from few KBs to MBs) and a short duration.Rates of few Kbps to tens of Mbps can satisfy bandwidthrequirements. Furthermore, most applications are elastic andcan adapt to the bandwidth provided by the network. Similarly,packet losses can be repaired with retransmissions and jittercan be smoothed by buffering packets at the receiver.
Fig. 3 shows a typical campus enterprise network. Packetscoming from the WAN are inspected by multiple inlinesecurity appliances, including a firewall and an intrusionprevention system (IPS). Further processing is performedby a network address translator (NAT). Packets traversethrough the network, from core-layer routers to access-layerswitches. Important components of routers and switches, suchas switching fabric, forwarding mechanism, size of memorybuffers, etc. are adequate for small flows only. The devices

2044 IEEE COMMUNICATIONS SURVEYS & TUTORIALS, VOL. 21, NO. 2, SECOND QUARTER 2019
Fig. 4. Throughput vs round-trip time (RTT), for two devices connectedvia a 10 Gbps path. The performance of two TCP implementations are pro-vided: Reno [32] (blue) and Hamilton TCP [33] (HTCP) (red). The theoreticalperformance with packet losses (green) and the measured throughput withoutpacket losses (purple) are also shown [4].
also use processing techniques that yield poor performancewhen processing large flows, such as cut-through forward-ing [4]. Additional security inspection by internal firewallsand distribution- and access-layer switches is common. Theseswitches segregate LANs into virtual LANs (VLANs), requir-ing further frame processing and inter-VLAN routing. Further,end devices do not have the hardware nor software capabili-ties to send and receive data at high speeds. The bandwidthof the network interface card (NIC) and the input/output andstorage systems are often below 10 Gbps. Similarly, softwareapplications perform poorly on WAN data transfers becauseof limitations such as small buffer size, excessive process-ing overhead, and inadequate flow and congestion controlalgorithms.
Packet losses may occur at different locations in the enter-prise network, including routers, switches, firewalls, IPS, etc.As a result of a packet loss, TCP reacts by drasticallydecreasing the rate at which packets are sent. The followingexample [4] illustrates the impact of a small packet loss rate.Fig. 4 shows the TCP throughput of a data transfer across a10 Gbps path. The packet loss rate is 1/22,000, or 0.0046%.The purple curve is the throughput in a loss-free environ-ment; the green curve is the theoretical throughput computedaccording to the following equation [34]:
throughput =MSS
RTT · √L. (1)
Eq. (1) indicates that the throughput of a TCP connectionin steady state is directly proportional to the maximum seg-ment size (MSS) and inversely proportional to the round-triptime (RTT) and the square root of the packet loss rate (L).The red and blue curves are real measured throughput of twopopular implementations of TCP: Reno [32] and HamiltonTCP (HTCP) [33]. Because TCP interprets losses as networkcongestion, it reacts by decreasing the rate at which packetsare sent. This problem is exacerbated as the latency increasesbetween the communicating hosts. Beyond LAN transfers, thethroughput decreases rapidly to less than 1 Gbps. This isoften the case when research collaborators sharing data aregeographically distributed.
B. Science DMZ Architecture
The Science DMZ is designed to address the limitationsof enterprise networks and is typically deployed near themain enterprise network. It is important to highlight, however,that the two networks, the Science DMZ and the enterprisenetwork, are separated either physically or logically. Thereare important reasons for this choice. First, the path fromthe Science DMZ to the WAN must involve as few networkdevices as possible, to minimize the possibility of packet lossesat intermediate devices. Second, the Science DMZ can alsobe considered as a security architecture, because it limits theapplication types and corresponding flows supported by enddevices. While flows in enterprise networks are numerous anddiverse, those in Science DMZs are usually well-identified,enabling security policies to be tied to those flows.
A Science DMZ example is illustrated in Fig. 5(a). Themain characteristics of a Science DMZ are the deployment of afriction-free path between end devices across the WAN, the useof DTNs, the active performance measurement and monitoringof the paths between the Science DMZ and the collaboratornetworks, and the use of access-control lists (ACLs) and offlinesecurity appliances. Specifically:
• Friction-free network path: DTNs are connected toremote systems, such as collaborators’ networks, via theWAN. The high-latency path is composed of routers andswitches which have large buffer sizes to absorb tran-sitory packet bursts and prevent losses. The path has nodevices that may add excessive delays or cause the packetto be delivered out of order; e.g., firewall, IPS, NAT. Therationale for this design choice is to prevent any packetloss or retransmission which can trigger a decrease inTCP throughput.
• Dedicated, high-performance DTNs: These devices aretypically Linux devices built and configured for receivingWAN transfers at high speed. They use optimized datatransfer tools such as Globus’ gridFTP [26], [35], [36].General-purpose applications (e.g., email clients, docu-ment editors, media players) are not installed. Havinga narrow and specific set of applications simplifies thedesign and enforcement of security policies.
• Performance measurement and monitoring point:Typically, there is a primary high-capacity path connect-ing the Science DMZ with the WAN. An essential aspectis to maintain a healthy path. In particular, identifyingand eliminating soft failures in the network is criticalfor large data transfers [4]. When soft failures occur,basic connectivity continues to exist but high throughputcan no longer be achieved. Examples of soft failuresinclude failing components and routers forwardingpackets using the main CPU rather than the forwardingplane. Additionally, TCP was intentionally designed tohide transmission errors that may be caused by softfailures. As stated in RFC 793 [37], As long as the TCPscontinue to function properly and the Internet systemdoes not become completely partitioned, no transmissionerrors will affect the users. The performance mea-surement and monitoring point provides an automated

CRICHIGNO et al.: COMPREHENSIVE TUTORIAL ON SCIENCE DMZ 2045
Fig. 5. Science DMZ location and device features. (a) A Science DMZ co-located with an enterprise network. Notice the absence of firewall or any statefulinline security appliance in the friction-free path. (b) Features of Science DMZ’s devices.
mechanism to actively measure end-to-end metrics suchas throughput, latency, and packet loss. The most usedtool is perfSONAR [38], [39].
• ACLs and offline security appliances: The primarymethod to protect a Science DMZ is via router’s ACLs.Since ACLs are implemented in the forwarding plane ofa router, they do not compromise the end-to-end through-put. Additional offline appliances include payload-basedand flow-based intrusion detection systems (IDSs).
In Fig. 5(a), when data sets are transferred to a DTN fromthe WAN, they may be stored locally at the DTN or writteninto a storage device. DTNs can be dual-homed, with a sec-ond interface connected to the storage device. This approachallows the DTN to simultaneously receive data from the WANand transfer the data to the storage device, avoiding double-copying it. Users located in a laboratory inside the ScienceDMZ have friction-free access to the data in the storage device.On the other hand, users from a laboratory located in the enter-prise network are behind the security appliances protectingthat network. These users may achieve reasonable performanceaccessing the stored data/Science DMZ. The reason here isthat, because of the very low latency between the ScienceDMZ and enterprise users, the retransmissions caused by thesecurity appliances have much less performance impact. TCPrecovers from packet losses quickly at low latencies (discussedin Section IV), contrasting with the slow recovery observedwhen packet losses are experienced in high-latency WANs.The key is to provide the long-distance TCP connections witha friction-free service.
1) Addressing the Enterprise Network Limitations: TheScience DMZ addresses the limitations encountered in enter-prise networks by using the coordinated set of resourcesshown in Fig. 5(b). At the physical layer/cyberinfrastructure,the WAN must be capable of handling large traffic vol-umes, with a predictable performance. Bit-error rates shouldbe very low and congestion should not occur. The WANpath between end devices should include as few devices aspossible. These requirements contrast with typical services
delivered by commercial Internet Service Providers (ISPs),used in enterprise networks. ISPs often minimize operatingcosts at the expense of performance. For large data trans-fers and research purposes, many institutions are connectedto regional or national backbones dedicated to supportingresearch and education, such as Internet2 [40].
At the data-link and network layers, the switches and routersmust have a suitable architecture to forward frames/packetsat a high speed (10 Gbps and above). Important attributesare the fabric, queueing, and forwarding techniques. Thesedevices must also have large buffer sizes to absorb transientpacket bursts generated by large flows. These requirements areopposite to those implemented by devices used in enterprisenetworks, which are driven by datacenter needs. The pathsinterconnecting devices inside a datacenter are characterizedby a low latency. On the other hand, the paths interconnectingDTNs to remote networks are characterized by a high latency.
At the transport layer, the protocol must transfer a largeamount of data between end devices without errors. TCP is theprotocol used by most application-layer tools. A large amountof memory must be allocated to the TCP buffer, which per-mits the sender to continuously send segments to fill up theWAN capacity. Otherwise, the TCP flow control mechanismleads to a stop-and-wait behavior. The transport layer shouldalso permit the enabling or disabling of TCP extensions, theuse of large segment sizes, and the selection of the congestioncontrol algorithm. The segment size depends on the maximumtransmission unit (MTU), which is defined by the layer-2 pro-tocol. The congestion control algorithm must be suitable forhigh-throughput high-latency networks, as data transfers areoften conducted over WANs.
At the application layer, applications are limited to datatransfer tools at the DTN and perfSONAR at the measure-ment and monitoring point. The prevalent data transfer toolis Globus’ gridFTP [26], [35], [36]. Globus implements fea-tures such as parallel streams and re-startable data transfer.perfSONAR [38], [39] provides an automated mechanism toactively measure and report end-to-end performance metrics.

2046 IEEE COMMUNICATIONS SURVEYS & TUTORIALS, VOL. 21, NO. 2, SECOND QUARTER 2019
TABLE IDIFFERENCES BETWEEN INTERNET AND INTERNET2/REN
With respect to security, by avoiding general-purpose appli-cations and by separating the Science DMZ from the enterprisenetwork, specific policies can be applied to the science traf-fic. Also, data transfer tools are relatively simple to monitorand to secure. Security policies are implemented with ACLsand offline appliances, such as IDSs. Routers and switchesalso provide functionality for collecting flow information, suchas Netflow [41] and sFlow [42]. Netflow is a protocol usedfor collecting and exporting flow information that is increas-ingly used for monitoring big data transfers [43]. Similarly,sFlow uses sampling to decrease the amount of collectedinformation. At high rates, inline security appliances such asfirewalls and IPSs lead to packet losses and thus are not usedin Science DMZs.
C. WAN Cyberinfrastructure
The Science DMZ can be treated as the portion of thecyberinfrastructure where the end devices are located. The sec-ond piece of the cyberinfrastructure is the WAN. In the U.S.,there are multiple backbones and regional networks connect-ing institutions and corresponding Science DMZs. The primarybackbone for science and engineering is Internet2 [40]. Whilemost of this section focuses on the cyberinfrastructure needsfor large flows using Internet2 as an example, the discussionis still applicable to other Research and Education Networks(RENs). A REN is a service provider network dedicated tosupporting the needs of the research and education communi-ties within a region. A particular REN which is deployed bya country is referred to as a National Research and EducationNetwork (NREN). Examples of RENs include Internet2 inNorth America, GEANT [44] in Europe, UbuntuNet [45] inEast and Southern Africa, APAN [46] in the Asia-Pacificregion, and RedCLARA [47] in Latin America. Internet2 andRENs may contrast with commercial ISPs and Internet inseveral aspects, as summarized in Table I.
Internet2 has multiple point of presences (POPs) distributedacross the U.S., where institutions can connect to the network.While institutions located in the proximity of a POP can read-ily access a REN, others remotely located may only connectto a REN indirectly. The connection of a Science DMZ to a
REN can be accomplished in different ways, including a directconnection to the REN’s POP, via a regional network, or viaa commercial ISP.
1) Connecting a Science DMZ via an Internet2 POP:Many research institutions and universities connect directly toInternet2 via a direct link between the Science DMZ and anInternet2 POP. This connection type minimizes the number ofdevices or hops between the DTN and the WAN. Additionally,Internet2 is also optimized for throughput by avoiding theuse of appliances that may reduce performance. Sometimesthe POP is located in the institution campus, co-located withthe border router. Alternatively, the institution campus may belocated a few miles/kilometers away from the POP.
2) Connecting a Science DMZ via a Regional REN: Asecond option to access a major backbone/Internet2 is viaa regional research network, which in turn is connected toInternet2. A representative example is the Western RegionalNetwork (WRN) [48]. The WRN is a regional 100 Gbps RENin the western part of the U.S., as shown in Fig. 6. Theinterconnection with Internet2 is shown in blue. Connectionsto the Internet are achieved by peering with a tier-1 ISP,Level 3. The WRN is also connected to other researchnetworks such as the Corporation for Education NetworkInitiatives in California (CENIC) network [49] and ESnet [3].
Fig. 6 highlights the case of the University of Hawaii (UH),which has a link to the WRN. The WRN has access toInternet2 at several POPs. Although this alternative requiresthat flows traverse across two hierarchical levels (i.e., theWRN and Internet2), these research networks are typicallyoptimized for performance.
3) Connecting a Science DMZ via a Commercial ISP:Most ISPs may have policies/throttling mechanisms that donot favor performance. Bottlenecks and congestion are com-mon and clear performance expectations cannot be established,because of the lack of collaborative monitoring between ISPs.Furthermore, policy criteria tend to dominate routing decisionsrather than optimization criteria.
Fig. 7(a) shows a use case of a campus enterprise networkconnected to the WAN via an ISP service. The lower level ofthe Internet hierarchy is the access ISP, whereas a second levelprovides connectivity to access ISPs, namely the regional ISP.

CRICHIGNO et al.: COMPREHENSIVE TUTORIAL ON SCIENCE DMZ 2047
Fig. 6. A Science DMZ connected to a REN, the Western Regional Network(WRN) [48].
Fig. 7. Connecting a Science DMZ via an ISP. (a) A viewpoint of theconnection in the Internet hierarchy. (b) The path between two Science DMZs,one attached to an ISP (NNMC) and another attached to a REN (UNM). NM,TX, and CO stand for New Mexico, Texas, and Colorado.
Sometimes, the regional ISP can also provide connectivity tothe end customer, i.e., the campus network. Each regional ISPthen connects to a tier-1 ISP.
Fig. 7(b) illustrates the communication between two ScienceDMZs in the state of New Mexico, U.S., located at NorthernNew Mexico College (NNMC) and at the University of NewMexico (UNM). The geographic distance between the twoinstitutions is 90 miles (145 kilometers). NNMC is locatedin Espanola, where connectivity is provided by a commer-cial ISP. On the other hand, UNM is located in Albuquerqueand has a direct connection to a REN, namely the WRN.Note the long path between the two locations, which crossesa local/regional ISP (Windstreams), two tier-1 ISPs (NTTand Level 3), and a REN (WRN). The resulting RTT isapproximately 60 milliseconds.
The above example illustrates that existing routing policiesat ISPs can cause excessive delays. If instead NNMC wasdirectly connected to a REN or Internet2, or the traffic was
Fig. 8. Locations of institutions that have implemented cyberinfrastructureimprovements and/or have deployed Science DMZs with the support of theNSF Campus Cyberinfrastructure program, as of 2016 [50].
routed more efficiently when it entered Albuquerque, the delaywould only be a few milliseconds.
4) Connecting a Science DMZ via a Commercial ISPCircuit: Science DMZs can be connected to Internet2 or aREN via layer-1 or layer-2 services provided by an ISP. Alayer-1 service provides a dedicated wavelength on a fiberchannel from the campus location to a POP of Internet2 orregional REN. A layer-2 service includes pseudowire emu-lation, Virtual Private LAN service (VPLS), and others. Theadvantage of this approach is that the terms of the servicecan be negotiated between the ISP and the institution, includ-ing a deterministic path to be followed by packets from theborder router to the POP. Table II summarizes the four alter-natives discussed in this section to connect Science DMZs toInternet2.
D. Current State: Science DMZ Deployment in the U.S.
The NSF recognizes the Science DMZ model as a provenoperational best practice for university campuses support-ing data-intensive science. This model has also been iden-tified as eligible for funding through the NSF CampusCyberinfrastructure program (CC*) [17]. Established in 2012,this program has funded more than 200 projects for networkinfrastructure deployment/Science DMZs. The locations ofthese institutions are shown in Fig. 8. Since a design goalof the Science DMZ is the establishment of a high-speed pathacross a WAN, the impact on improving the exchange of largedata sets is significant. In essence, because of the data-sharingarchitecture of the Science DMZ, institutions implementing ithave fast access to virtual co-location of large data that couldreside anywhere in the world.
III. DATA-LINK AND NETWORK-LAYER DEVICES
Two essential functions performed by routers are routingand forwarding. Routing refers to the determination of theroute taken by packets. Forwarding refers to the switching ofa packet from the input port to the appropriate output port. Theterm switching is also used interchangeably with forwarding.
Traditional routing approaches such as static and dynamicrouting (e.g., Open Shortest Path First (OSPF) [51], BGP [52])are used in the implementation of Science DMZs. Routing

2048 IEEE COMMUNICATIONS SURVEYS & TUTORIALS, VOL. 21, NO. 2, SECOND QUARTER 2019
TABLE IIALTERNATIVE APPROACHES TO CONNECT A SCIENCE DMZ TO INTERNET2
Fig. 9. Switching attributes requiring consideration in a Science DMZ.
events, such as routing table updates, occur at the millisecond,second, or minute timescale, and best practices used in regularenterprise networks are applicable to Science DMZs. On theother hand, with transmission rates of 10 Gbps and above,the forwarding operation occurs at the nanosecond timescale.Since forwarding functionality is common in both routers andswitches, this section reviews the architecture and forwarding-related attributes of switches. These attributes are applicableto routers as well; thus, for the remainder of this section, theterms switch and router are used interchangeably. Switchingattributes discussed in this section are illustrated in Fig. 9.
A. Switching Review
A generic router architecture is shown in Fig. 10. Modernrouters may have a network processor (NP) and a table derivedfrom the routing table in each port, which is referred to as theforwarding table (FT) or forwarding information base (FIB).The router in Fig. 10 has two input ports, iP1 and iP2, withtheir respective queues. iP1 has three packets in its queue,which will be forwarded to output ports oP1 (green packets)and oP2 (blue packet) by the fabric.
Router queues/buffers absorb traffic fluctuations. Even inthe absence of congestion, fluctuations are present, result-ing mostly from coincident traffic bursts [24]. Consider aninput buffer implemented as a first-in first-out in the routerof Fig. 10. As iP1 and iP2 both have one packet to be for-warded to oP1 at the front of the buffer, only one of them, say
the packet at iP2, will be forwarded to oP1. The consequenceof this is that not only the first packet at iP1 must wait, sotoo must the second packet that is queued at iP1 wait, eventhough there is no contention for oP2. This phenomenon isknown as head-of-line (HOL) blocking [53]. To avoid HOLblocking, many switches use output buffering, a mixture ofinternal and output buffering, or techniques emulating outputbuffering such as Virtual Output Queueing (VOQ).
B. Switching Considerations for Science DMZs
There are critical switching attributes that must be consid-ered for a well-designed Science DMZ. These attributes arerelated to the characteristics of the science traffic and the roleof switches in mitigating packet losses. Key considerations arenow presented.
1) Traffic Profile: At a switch, buffer size, forwarding orswitching rate, and queues should be selected based on thetraffic profile to be supported by the network. Enterprisenetworks and Science DMZs are subject to different trafficprofiles, as listed in Table III. In a typical enterprise network,a very large number of flows consume a relatively smallamount of bandwidth each. Fig. 11 shows an example of atraffic profile at a small campus enterprise network servingapproximately 1,000 hosts. The number of flows observed in aweek-long period is approximately 33 million, 81% TCP, 18%UDP, and 1% other protocols. According to the cumulativedistribution function (CDF) of the flow duration, more than

CRICHIGNO et al.: COMPREHENSIVE TUTORIAL ON SCIENCE DMZ 2049
Fig. 10. A generic router architecture.
TABLE IIICOMPARISON BETWEEN ENTERPRISE NETWORK
AND SCIENCE DMZ FLOWS
90% of these flows have a duration of less than 200 seconds.Similarly, approximately 90% of the flows have a size of 10KBs or less. This traffic profile is very different from that ofa science flow, which may last several hours and consume thetotal available bandwidth. For example, transferring 100 TBsat 10 Gbps takes over 24 hours. In this type of flow, burstsoccur occasionally but are not the norm. When both small andlarge flows are transported across the same network, smallerflows do not saturate ports. However, when bursts associatedwith a science flow occur, then these events can cause thestarvation of the small flows [54].
Enterprise flows are less sensitive than Science DMZ flowsto packet loss and throughput requirements. Typically, the sizeof files in enterprise applications is small. Even though packetlosses reduce the TCP throughput, from a user perspective thisreduction results in a modest increase of the data transfer time.On the other hand, Science DMZ applications typically trans-fer terabyte-scale files. Hence, even a very small packet lossrate can cause the TCP throughput to collapse below 1 Gbps,as illustrated in Fig. 4. As a result, a terabyte-scale datatransfer requires many additional hours or days to complete.
A well-designed Science DMZ is minimally sensitive tolatency. One of the goals of the Science DMZ is to preventpacket loss and thus to sustain high throughput over high-latency WANs. Hence, the Science DMZ uses dedicated DTNsand switches capable of absorbing transient bursts. It also
Fig. 11. A week-long (Apr. 16-22, 2018) measurement data for a smallcampus enterprise network. The total number of observed flows is approxi-mately 33 million; 81% of flows are TCP, 18% UDP, and 1% other protocols.(a) Cumulative distribution function (CDF) of the flow duration and (b) theflow size. The flow duration is the time interval between the first and lastpackets of the flow observed in the network, whereas the flow size is theaggregate number of bytes contained in the packets of that flow.
avoids inline security appliances that may cause packets tobe dropped or delivered out of order. By fulfilling theserequirements, the achievable throughput can approach the fullnetwork capacity. For example, with no packet losses, thethroughput illustrated in Fig. 4 approaches 10 Gbps (purplecurve). Note that the throughput is only slightly sensitive tolatency.
2) Maximum Transmission Unit: The MTU has a promi-nent impact on TCP throughput. As observed in Eq. (1), thethroughput is directly proportional to the MSS. Congestioncontrol algorithms perform multiple probes to see how muchthe network can handle. With high-speed networks, using halfa dozen or so small probes to see how the network respondswastes a huge amount of bandwidth. Similarly, when a packetloss is detected, the rate is decreased by a factor of two.TCP can only recover slowly from this rate reduction. Thespeed at which the recovery occurs is proportional to theMTU (discussed in Section IV). Thus, for Science DMZs, itis recommended to use large frames.
3) Buffer Size of Output or Transmission Ports: The buffersize of a router’s output port must be large enough, since pack-ets from coincident arrivals from different input ports maybe forwarded to the same output port. Additionally, buffersprevent packet losses when traffic bursts occur. A key ques-tion is how large should buffers be to absorb the fluctuationsgenerated by large flows. The rule of thumb has been that theamount of buffering (in bits) in a router’s port should equalthe RTT (in seconds) multiplied by the capacity C (in bits perseconds) of the port [55], [56]:
buffer size = C · RTT . (2)
The above quantity is also known as the bandwidth-delayproduct (BDP). The rationale behind this quantity is explainedin Fig. 12 [57]. In a TCP connection, a sender can have at mostWmax in-flight or outstanding bits (or the equivalent in seg-ments), where Wmax is the TCP buffer size dictated by thereceiver. Assume that the output port of the router is the bot-tleneck link of the end-to-end connection. Due to the additiveincrease behavior of TCP, the sender will keep increasing therate. The number of queued packets at the router will also

2050 IEEE COMMUNICATIONS SURVEYS & TUTORIALS, VOL. 21, NO. 2, SECOND QUARTER 2019
Fig. 12. TCP viewpoint of a connection and its behavior. (a) A simplifiedTCP interpretation of the connection. (b) The congestion control behaviorcharacterized by the additive increase and multiplicative decrease.
increase, until it becomes full and a packet is dropped. Atthat point, TCP decreases the congestion window to Wmax
2 . Inorder to maximize the throughput of the connection, the bottle-neck link should always be utilized. With sufficient buffering,the window size is always above the critical threshold Wmax
2 .Since the buffer size is equal to the height of the TCP saw-tooth [58], then the size needs to be equal to BDP as well.Notice that the buffer absorbs the changes observed in the TCPwindow size.
Appenzeller et al. [57] demonstrated that when there is alarge number of TCP flows passing through a link, say N, theamount of buffering can be reduced to:
buffer size =C · RTT√
N. (3)
This result is observed when there is no dominant flow andthe router aggregates thousands of flows.
Empirical results [59], [60] suggest that the buffer size ofa router in a Science DMZ should equal the bandwidth-delayproduct. However, a formal proof remains an open researchproblem. The main challenge in finding an analytical solu-tion is the mathematical complexity of queueing systems withcomplex packet inter-arrival times. Specifically, the networktraffic exhibits high levels of burstiness and self-similarity. Acritical characteristic of self-similar traffic is that there is nonatural length of a burst; at every time scale ranging from afew milliseconds to minutes and hours, similar-looking trafficbursts are present. Thus, the results predicted by the M/M/1model from queueing theory (which models packet arrivals asa Poisson process) deviate from the actual performance [61].
In this context, consider again Fig. 12(a). Assume that therouter behaves like an M/M/1 queue, and X is the number ofpackets in the system. The utilization factor is defined as:
ρ =packet arrival rate at the input port/s
packet departure rate at the output port. (4)
Fig. 13. Hierarchical network.
Note that ρ can be interpreted as the utilization of the bot-tleneck link. According to the M/M/1 model, the expectednumber of packets in the system is E(X ) = ρ
1−ρ , and theprobability that at least B packets are in the system is givenby ρB . For a link utilization of ρ = 0.8, the expected numberof packets in the system is small, namely, E(X ) = 4. Thus,with a modest buffer size, say 60 packets, the packet droprate would be less than ρ60 = 0.0000015. By contrast, thebuffer size of a modern 10 Gbps router interface can be over1,000,000 packets.
Modeling packet arrivals as a Poisson process severelyunderestimates the traffic burstiness. Traditional TCP conges-tion control algorithms typically send as many packets aspossible at once. Hence, a potential approach to reduce thetraffic burstiness (which would permit to reduce the buffersize of a router as predicted by the M/M/1 model) is to spaceout or pace packets at sender nodes. The pacing technique canbe accomplished by requiring sender nodes to send packets ata fixed rate, so that they are spread over an RTT interval.Results by Beheshti et al. [62] indicate that high through-put can be achieved with small buffer sizes provided thatshort-term bursts are minimized. Notably, the first TCP con-gestion control algorithm based upon pacing has been recentlyproposed, namely, the Bottleneck Bandwidth and Round-TripTime (BBR) algorithm [24]. Thus, studying the impact of BBRon routers’ buffer size is a promising open research direction.
4) Bufferbloat: While allocating sufficient memory forbuffering is desirable, it is also important to note that the termRTT in Eq. (2) depends upon the use case at hand. Hence,allocating additional unneeded buffer space may result inmore latency. This undesirable latency phenomenon is knownas bufferbloat [63], [64] and can be mitigated by avoidingthe over-allocation of buffers. Controlling excess delay is anactive research area. For example, new active-queue manage-ment techniques based on control theory have been recentlyproposed in [65].
5) Routers and Switches in a Hierarchical Network: Fig. 13illustrates a typical hierarchical network. The access layer rep-resents the network edge, where traffic enters or exits the

CRICHIGNO et al.: COMPREHENSIVE TUTORIAL ON SCIENCE DMZ 2051
TABLE IVCOMPARISON BETWEEN ENTERPRISE NETWORK AND SCIENCE DMZ SWITCHES
network. In Science DMZs, usually DTNs, supercomputer, andresearch labs have access to the network through access-layerswitches. The distribution layer interfaces between the accesslayer and the core layer, aggregating traffic from the accesslayer. The core layer is the network backbone. Core routersforward traffic at very high speeds. In this simplified topology,the core is also the border router, connecting the network tothe WAN.
Access-layer switches must support a range of traffic capac-ity needs, sometimes starting as low as 10 Mbps and reachingto as much as 100 Gbps. This wide mix can strain the choiceof buffers required, particularly on output switch ports con-necting to the distribution layer [66]. Specifically, buffer sizesmust be large enough to absorb bursts from the end devices(DTNs, supercomputer, lab devices).
Distribution- and core-layer switches must have as muchbuffer space as possible to handle the bursts coming from theaccess-layer switches and from the WAN. Hence, attentionmust be paid to bandwidth capacity changes (e.g., aggregationof multiple smaller input ports into a larger output port).
Switches manufactured for datacenters may not be a goodchoice for Science DMZs. They often use fabrics basedupon shared memory designs. In these designs, the size ofthe output buffers may not be tunable, which may becomea key performance limitation during the transfer of largeflows.
C. Switches in Enterprise Networks and Science DMZs
Table IV compares switches for enterprise networks andScience DMZs. In general, the crossbar switch fabric is sug-gested for Science DMZs, because of its high bandwidth.A crossbar switch is also non-blocking; a packet being for-warded to an output port will not be blocked from reachingthe output port as long as no other packet is currently beingforwarded to that output port. The shared memory technol-ogy usually does not allow the allocation of per-port memoryfor buffering. In Science DMZs, ideally output ports will be
statically allocated enough memory for buffering, as suggestedby Eq. (2). Although the bus technology still provides suffi-cient bandwidth for enterprise networks, e.g., Cisco Catalysts6500 switches [67], its underlying time-sharing operation isnot appropriate for Science DMZs. Consider now buffer-ing; HOL blocking limits the throughput of an input-bufferedswitch to 59% of the theoretical maximum (which is the sumof the link bandwidths for the switch) [68]. While this tech-nology may be acceptable for small enterprise networks, itshould not be used in high-throughput high-latency environ-ments. Science DMZs should use switches that implementoutput buffering, a mixture of input and output buffering, ortechniques emulating output buffering such as VOQ [68].
Forwarding techniques include cut-through and store-and-forward. Cut-through switches start forwarding a packet beforethe entire packet has been received, normally, as soon as thedestination address is processed. They are designed to avoidbuffering packets and to minimize latency. Store-and-forwardswitches buffer the entire packet before it is forwarded to theoutput port.
Store-and-forward switches provide flexibility to supportany mix of speeds. Consider an incoming packet traveling at10 Gbps that must be forwarded to a 100 Gbps output port.The bit time at the input port is 10 times longer than that atthe output port. In a cut-through switch, as incoming bits areprocessed, they are transmitted to the output port. As soonas a bit is sent out, the 100 Gbps output port is idle waitingfor the next bit, which is still being received by the 10 Gbpsinput port. Hence, much of the 100 Gbps bandwidth wouldbe wasted. Thus, in order to optimize the use of the availablebandwidth, the cut-through switch would have to change itsoperation mode to store-and-forward. However, a significantthroughput degradation has been observed when a cut-throughswitch operates as a store-and-forward switch [4]. This degra-dation is partially attributed to the small buffer size of a typicalcut-through switch. On the other hand, a store-and-forwardswitch provides automatic buffering of all incoming packets.The forwarding process from a slower interface to a faster

2052 IEEE COMMUNICATIONS SURVEYS & TUTORIALS, VOL. 21, NO. 2, SECOND QUARTER 2019
Fig. 14. TCP connection and header. (a) End points of the TCP connection.(b) TCP header. Ctrl, R, and DO fields stand for control, reserved, and dataoffset.
interface is made easier, as the reception process at the inputport and transmission process at the output port are decoupled.
For Science DMZs, port-based buffer allocation is highlyrecommended. To absorb transient bursts formed by largeflows, or when traffic streams are merged and multiplexed tothe same output port, the amount of memory allocated to thatport is recommended to be equal to the bandwidth-delay prod-uct. Many enterprise networks use switches based on dynamicshared memory. These switches deposit packets into a com-mon memory that is shared by all ports. With dynamic sharedmemory, there is no guarantee that a port will be allocatedan appropriate amount of memory, as this is dynamicallyallocated.
IV. TRANSPORT-LAYER ISSUES
Applications transmit a large amount of data between enddevices. Data must be correctly delivered from one device toanother (e.g., from an instrument to a DTN). This is one ofthe services provided by TCP and a reason why TCP is theprotocol used by data transfer tools. There are several TCPattributes that should be considered for their use in ScienceDMZs, including segment size, flow control and buffer size,selective acknowledgement, parallel connections, pacing, andcongestion control. After a brief review of TCP, this sectiondiscusses these attributes.
A. TCP Review
TCP receives data from the application layer and places it inthe TCP send buffer, as shown in Fig. 14(a). Data is typicallybroken into MSS units. The MSS is simply the MTU minusthe combined lengths of the TCP and IP headers (typically40 bytes). Ethernet’s normal MTU is 1,500 bytes. Thus, theMSS’s typical value is 1,460. The TCP header is shown inFig. 14(b).
TCP implements flow control by requiring the receiver indi-cate how much spare room is available in the TCP receivebuffer. For a full utilization of the path, the TCP sendand receive buffers must be greater than or equal to thebandwidth-delay product. This buffer size value is the maxi-mum number of bits that can be outstanding (in-flight) if thesender continuously sends segments.
For reliability, TCP uses two fields of the TCP header:sequence number and acknowledgement (ACK) number. Thesequence number is the byte-stream number of the first byte inthe segment. The acknowledgement number that the receiver
Fig. 15. TCP operation. (a) Exchange of segments between end devices.(b) Evolution of the congestion window.
puts in its segment is the sequence number of the next bytethe receiver is expecting from the sender. Fig. 15(a) shows anexample of the use of these two fields. If an acknowledgementfor an outstanding segment is not received, TCP retransmitsthat segment. Alternatively, the sender can also detect a packetloss by detecting a triple duplicate ACK.
TCP maintains a congestion window whose size is the num-ber of bytes the sender may have in the network at anytime. The connection throughput is the minimum between theflow control and the congestion window, divided by the RTT.Assuming a large TCP receive buffer, the congestion windowis used to adjust the rate at which the sender sends data.
B. TCP Considerations for Science DMZs
Features such as TCP buffer size and parallel streams areusually overlooked in enterprise networks, where a slightthroughput degradation is often acceptable for small flows.However, inadequate transport-layer settings may have a highnegative impact for large flows. These features are discussednext.
1) Maximum Segment Size: One obvious advantage ofusing large segments is efficiency in processing, because a20-byte header overhead can be amortized over more data.Moreover, the recovery after a packet loss is proportional tothe MSS. During the additive increase phase of the conges-tion control algorithm, TCP increases the congestion windowby approximately one MSS every RTT. This means that byusing a 9,000-byte MSS instead of a 1,500-byte MSS, thethroughput increases six times faster. Even when losses areoccasional, the performance improvement can be significant.
2) Flow Control and TCP Receive Buffer: TCP flow con-trol imposes a limit in the utilization of the channel from thesource to the destination. In order to maximize the utiliza-tion of the channel and increase throughput, the TCP buffermust be at least as large as the BDP, and preferably larger. Byhaving a large TCP buffer, the sender can keep transmitting

CRICHIGNO et al.: COMPREHENSIVE TUTORIAL ON SCIENCE DMZ 2053
at full speed until the first acknowledgement comes back.Increasing the TCP buffer above BDP, for example to a valuethat equals 2BDP, also adds robustness. Thus, if a sporadicloss occurs, TCP would decrease the window size to BDP.Therefore, after the sporadic loss, the sender would still fullyutilize the channel.
For applications that use parallel collaborating TCP connec-tions or streams in the transmission of a dataset, the TCP buffercan be reduced. This requires an application-layer software,such as gridFTP [26], [35], [69] (discussed in Section V) toorchestrate the transmission over multiple connections. Sincethe full bandwidth is shared by the parallel connections, theTCP buffer needs not to be equal to the BDP. Instead, it can bereduced in proportion to the number of parallel connections.
3) Selective Acknowledgment: Much of the complexity ofTCP is related to inferring which packets have arrived andwhich packets have been lost. The cumulative acknowledge-ment number does not provide this information. A selectiveacknowledgement (SACK) lists up to three ranges of bytesthat have been received. With this information, the sender canmore directly decide what segments to retransmit.
The impact of using SACK on large data transfers at10 Gbps is not conclusive. In paths with small to mediumRTT, the use of SACK is encouraged in [70]. However, inpaths with large RTT and bandwidth, using SACK may reduceperformance. For very large BDP paths where the TCP buffersize is in the order of tens of MBs, there is a large numberof in-flight segments. For example, for a TCP receive bufferof 64 MBs and a MSS of 1,500 bytes, there could be almost45,000 outstanding segments. When a SACK event occurs, theTCP performance may be degraded by the process of locatingand resending the packets listed in the SACK lists. This in turncauses TCP to trigger a timeout and to reduce the congestionwindow. If such issues are observed, a solution is to disableSACK.
4) Parallel TCP Connections: The advent of ScienceDMZs and the need to combat random packet losses haverecently initiated new research in the use of parallel TCP con-nections for large flows [19], [71], [72]. Assuming that losses,RTT, and MSS are the same in each connection, the totalthroughput is essentially the aggregation of the K single TCPconnection throughputs [73]. Since the throughput of a singleTCP connection is given by Eq. (1), the aggregate throughputof K connections is given by the following equation:
aggregate throughput =K∑
i=1
MSSRTT
√L
= KMSS
RTT√
L.
(5)
Thus, an application opening K parallel TCP connectionsessentially creates a large virtual MSS on the aggregate con-nection that is K times the MSS of a single connection. Alarger MSS increases the rate of recovery from a loss eventfrom one MSS per successful segment transmission to K MSSsper successful segment transmission. When the aggregate TCPconnection begins to create congestion, any router or switchalong the path begins dropping packets and Eq. (5) is no longervalid. Parallel TCP connections must be implemented and
managed by the application layer. Its use is further discussedin Section V.
5) TCP Fair Queue Pacing: Data transmissions can bebursty, resulting in packets being buffered at routers andswitches and dropped at times. End devices can contribute tothe problem by sending a large number of packets in a shortperiod of time. If those packets were transmitted at a steadypace, the formation of queues could be reduced.
TCP pacing is a technique by which a transmitter evenlyspaces or paces packets at a pre-configured rate. TCP pacinghas been applied for years in enterprise networks [74], withmixed results. However, its recent application to data transfersin Science DMZs suggests that its use has several advan-tages [75]. TCP pacing has also been applied to datacenterenvironments [76].
The existing TCP congestion control algorithms, with theexception of BBR [24], indicate how much data is allowedfor transmission. Those algorithms do not provide a timeperiod over which that data should be transmitted and howthe data should be spread to mitigate potential bursts. Therate, however, can be enforced by a packet scheduler such asa fair queue (FQ). The packet scheduler organizes the flowof packets of each TCP connection through the network stackto meet policy objectives. Some Linux distributions such asCentOS [77] implement FQ scheduling in conjunction withTCP pacing [24], [78].
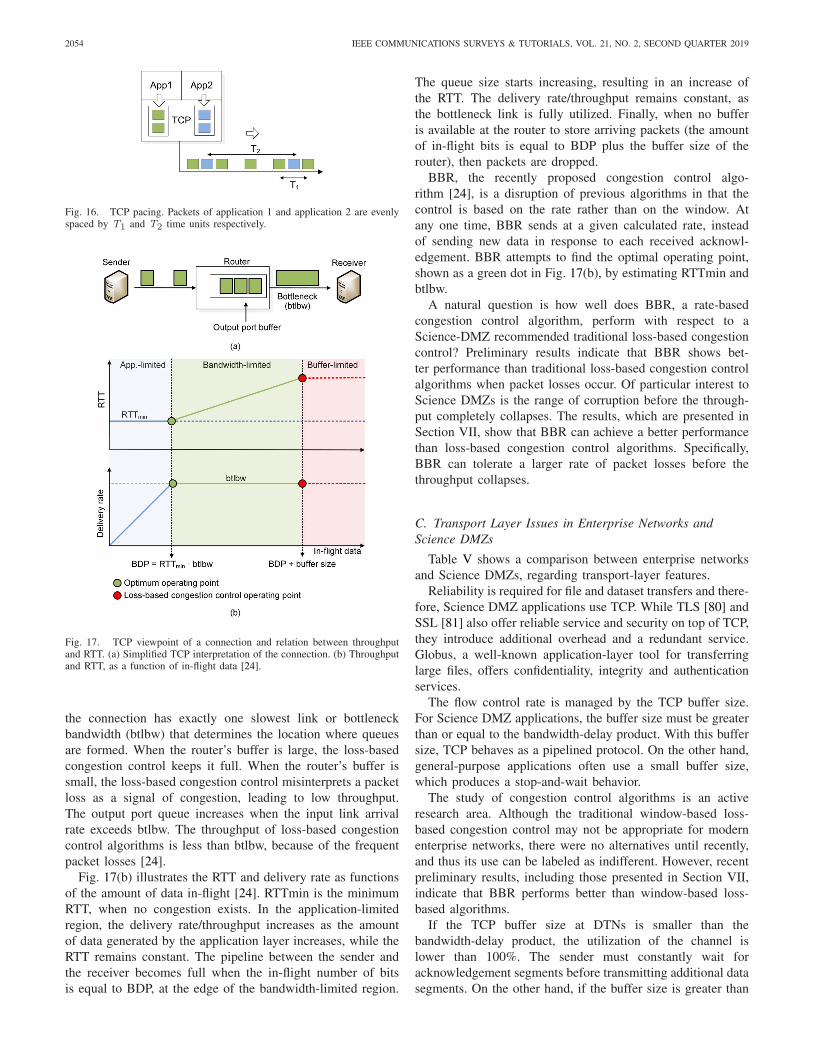
FQ is intended for locally generated traffic (e.g., a senderDTN). Fig. 16 illustrates the operation of FQ pacing.Application 1 generates green packets, and application 2 gen-erates blue packets. Each application opens a TCP connection.FQ paces each connection according to the desired rate, evenlyspacing out packets within an application based on the desiredrate. The periods T1 and T2 represent the time-space used forconnections 1 and 2 respectively.
TCP pacing reduces the typical TCP sawtooth behavior [60]and is effective when there are rate mismatches along thepath between the sender and the receiver. This is the case,for example, when the ingress port of a router has a capacityof 100 Gbps, and the egress port has a capacity of 10 Gbps.Because of the TCP congestion control mechanism, the saw-tooth behavior always emerges. As TCP continues to increasethe size of the congestion window, eventually the bottlenecklink becomes full while the rest of the links become under-utilized. These mismatches produce a continuous circle ofadditive increases and multiplicative decreases [60].
6) TCP Congestion Control Algorithms: A loss-based sig-nal is still the main mechanism used to adjust the congestionwindow and thus the throughput. The key difference amongloss-based congestion control algorithms is the strategy aftera packet loss is detected. The rate at which the congestionwindow grows after the loss may follow different mathemat-ical functions. Examples include Reno [32], Cubic [79], andHTCP [33]. Reno uses a linear rate increase while Cubic andHTCP use cubic and quadratic functions.
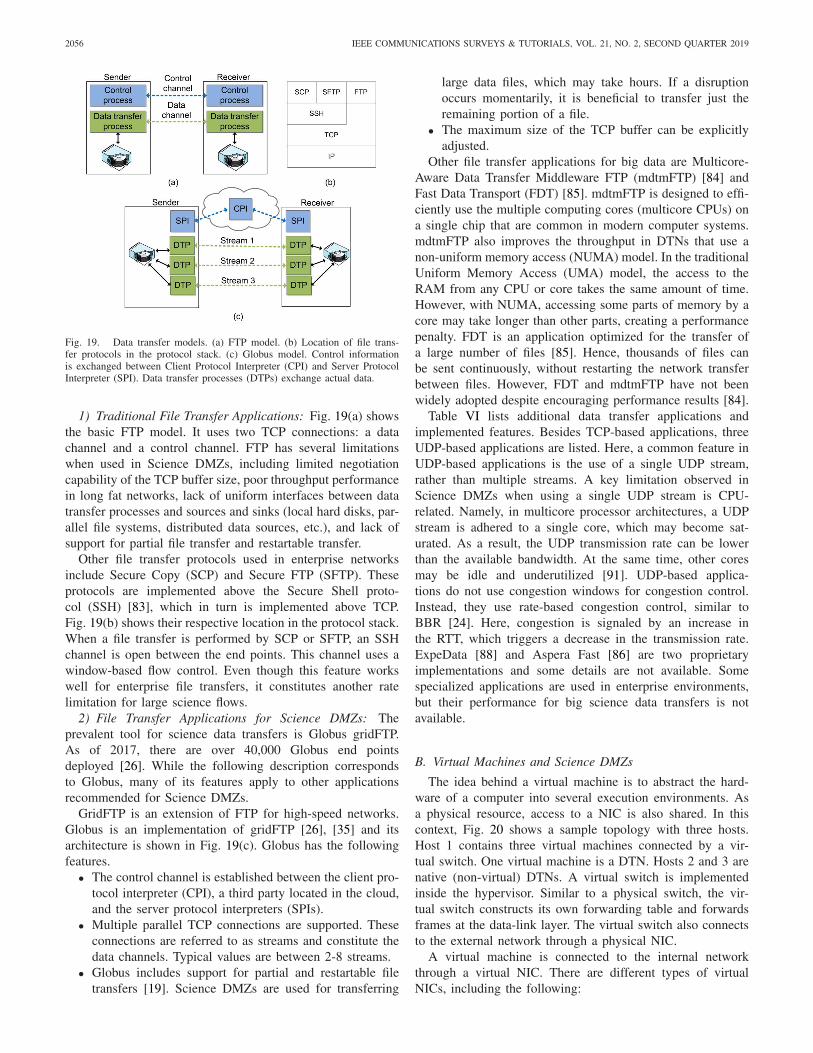
Essentially, the main issue observed in high-speed networksand Science DMZs is that, after a packet loss, the additiveincrease is too slow to reach full speed. Consider Fig. 17(a),which shows a TCP’s viewpoint of a connection. At any time,
2054 IEEE COMMUNICATIONS SURVEYS & TUTORIALS, VOL. 21, NO. 2, SECOND QUARTER 2019
Fig. 16. TCP pacing. Packets of application 1 and application 2 are evenlyspaced by T1 and T2 time units respectively.
Fig. 17. TCP viewpoint of a connection and relation between throughputand RTT. (a) Simplified TCP interpretation of the connection. (b) Throughputand RTT, as a function of in-flight data [24].
the connection has exactly one slowest link or bottleneckbandwidth (btlbw) that determines the location where queuesare formed. When the router’s buffer is large, the loss-basedcongestion control keeps it full. When the router’s buffer issmall, the loss-based congestion control misinterprets a packetloss as a signal of congestion, leading to low throughput.The output port queue increases when the input link arrivalrate exceeds btlbw. The throughput of loss-based congestioncontrol algorithms is less than btlbw, because of the frequentpacket losses [24].
Fig. 17(b) illustrates the RTT and delivery rate as functionsof the amount of data in-flight [24]. RTTmin is the minimumRTT, when no congestion exists. In the application-limitedregion, the delivery rate/throughput increases as the amountof data generated by the application layer increases, while theRTT remains constant. The pipeline between the sender andthe receiver becomes full when the in-flight number of bitsis equal to BDP, at the edge of the bandwidth-limited region.
The queue size starts increasing, resulting in an increase ofthe RTT. The delivery rate/throughput remains constant, asthe bottleneck link is fully utilized. Finally, when no bufferis available at the router to store arriving packets (the amountof in-flight bits is equal to BDP plus the buffer size of therouter), then packets are dropped.
BBR, the recently proposed congestion control algo-rithm [24], is a disruption of previous algorithms in that thecontrol is based on the rate rather than on the window. Atany one time, BBR sends at a given calculated rate, insteadof sending new data in response to each received acknowl-edgement. BBR attempts to find the optimal operating point,shown as a green dot in Fig. 17(b), by estimating RTTmin andbtlbw.
A natural question is how well does BBR, a rate-basedcongestion control algorithm, perform with respect to aScience-DMZ recommended traditional loss-based congestioncontrol? Preliminary results indicate that BBR shows bet-ter performance than traditional loss-based congestion controlalgorithms when packet losses occur. Of particular interest toScience DMZs is the range of corruption before the through-put completely collapses. The results, which are presented inSection VII, show that BBR can achieve a better performancethan loss-based congestion control algorithms. Specifically,BBR can tolerate a larger rate of packet losses before thethroughput collapses.
C. Transport Layer Issues in Enterprise Networks andScience DMZs
Table V shows a comparison between enterprise networksand Science DMZs, regarding transport-layer features.
Reliability is required for file and dataset transfers and there-fore, Science DMZ applications use TCP. While TLS [80] andSSL [81] also offer reliable service and security on top of TCP,they introduce additional overhead and a redundant service.Globus, a well-known application-layer tool for transferringlarge files, offers confidentiality, integrity and authenticationservices.
The flow control rate is managed by the TCP buffer size.For Science DMZ applications, the buffer size must be greaterthan or equal to the bandwidth-delay product. With this buffersize, TCP behaves as a pipelined protocol. On the other hand,general-purpose applications often use a small buffer size,which produces a stop-and-wait behavior.
The study of congestion control algorithms is an activeresearch area. Although the traditional window-based loss-based congestion control may not be appropriate for modernenterprise networks, there were no alternatives until recently,and thus its use can be labeled as indifferent. However, recentpreliminary results, including those presented in Section VII,indicate that BBR performs better than window-based loss-based algorithms.
If the TCP buffer size at DTNs is smaller than thebandwidth-delay product, the utilization of the channel islower than 100%. The sender must constantly wait foracknowledgement segments before transmitting additional datasegments. On the other hand, if the buffer size is greater than

CRICHIGNO et al.: COMPREHENSIVE TUTORIAL ON SCIENCE DMZ 2055
TABLE VCOMPARISON OF TRANSPORT-LAYER FEATURES IN ENTERPRISE NETWORKS AND SCIENCE DMZS
Fig. 18. Taxonomy for data transfer applications.
or equal to the bandwidth-delay product, the path utilizationapproaches the maximum capacity and many data segments areallowed to be in transit while acknowledgement segments aresimultaneously received. For small and short-duration flows,this may not be essential. However, for large science flows, toachieve full performance, the buffer size must be at least equalto the bandwidth-delay product. The MSS is perhaps one ofthe most important features in high-throughput high-latencynetworks with packet losses. TCP pacing is a promising fea-ture. The challenge for its wide adoption is the complexity ofdeveloping a mechanism to discover the bottleneck link andits capacity.
V. APPLICATION-LAYER TOOLS
The essential end devices inside a Science DMZ are theDTNs and the performance monitoring stations. DTNs run adata transfer tool while monitoring stations run a performancemonitoring application, typically perfSONAR. Other usefultools at deployment and evaluation times are WAN emulation
and throughput measurement applications. These tools are con-venient because they facilitate early performance evaluationwithout a need of connecting the Science DMZ to a real WAN.Additionally, in contrast to enterprise networks, virtualizationtechnologies have not been adopted in Science DMZs, becauseof performance limitations.
This section provides an overview of application-layertools used in Science DMZs. The section also discussesthe performance limitations of virtualization technologiespreventing their adoption in Science DMZs.
A. File Transfer Applications
File transfer applications are used by researchers and prac-titioners to share data. Historically, applications were builtaround the File Transport Protocol (FTP) [82]. While FTP-based applications work well in enterprise networks, theirperformance in high-throughput, high-latency environmentsis often poor. Fig. 18 presents a taxonomy for file transferapplications.
2056 IEEE COMMUNICATIONS SURVEYS & TUTORIALS, VOL. 21, NO. 2, SECOND QUARTER 2019
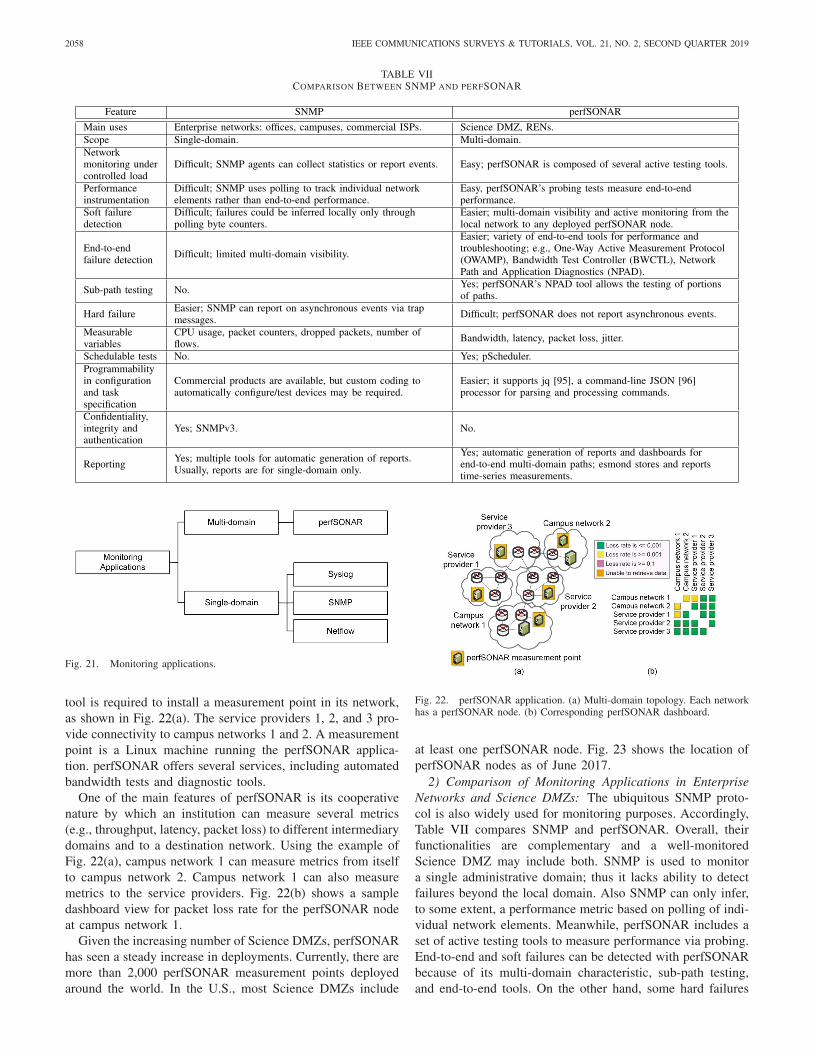
Fig. 19. Data transfer models. (a) FTP model. (b) Location of file trans-fer protocols in the protocol stack. (c) Globus model. Control informationis exchanged between Client Protocol Interpreter (CPI) and Server ProtocolInterpreter (SPI). Data transfer processes (DTPs) exchange actual data.
1) Traditional File Transfer Applications: Fig. 19(a) showsthe basic FTP model. It uses two TCP connections: a datachannel and a control channel. FTP has several limitationswhen used in Science DMZs, including limited negotiationcapability of the TCP buffer size, poor throughput performancein long fat networks, lack of uniform interfaces between datatransfer processes and sources and sinks (local hard disks, par-allel file systems, distributed data sources, etc.), and lack ofsupport for partial file transfer and restartable transfer.
Other file transfer protocols used in enterprise networksinclude Secure Copy (SCP) and Secure FTP (SFTP). Theseprotocols are implemented above the Secure Shell proto-col (SSH) [83], which in turn is implemented above TCP.Fig. 19(b) shows their respective location in the protocol stack.When a file transfer is performed by SCP or SFTP, an SSHchannel is open between the end points. This channel uses awindow-based flow control. Even though this feature workswell for enterprise file transfers, it constitutes another ratelimitation for large science flows.
2) File Transfer Applications for Science DMZs: Theprevalent tool for science data transfers is Globus gridFTP.As of 2017, there are over 40,000 Globus end pointsdeployed [26]. While the following description correspondsto Globus, many of its features apply to other applicationsrecommended for Science DMZs.
GridFTP is an extension of FTP for high-speed networks.Globus is an implementation of gridFTP [26], [35] and itsarchitecture is shown in Fig. 19(c). Globus has the followingfeatures.
• The control channel is established between the client pro-tocol interpreter (CPI), a third party located in the cloud,and the server protocol interpreters (SPIs).
• Multiple parallel TCP connections are supported. Theseconnections are referred to as streams and constitute thedata channels. Typical values are between 2-8 streams.
• Globus includes support for partial and restartable filetransfers [19]. Science DMZs are used for transferring
large data files, which may take hours. If a disruptionoccurs momentarily, it is beneficial to transfer just theremaining portion of a file.
• The maximum size of the TCP buffer can be explicitlyadjusted.
Other file transfer applications for big data are Multicore-Aware Data Transfer Middleware FTP (mdtmFTP) [84] andFast Data Transport (FDT) [85]. mdtmFTP is designed to effi-ciently use the multiple computing cores (multicore CPUs) ona single chip that are common in modern computer systems.mdtmFTP also improves the throughput in DTNs that use anon-uniform memory access (NUMA) model. In the traditionalUniform Memory Access (UMA) model, the access to theRAM from any CPU or core takes the same amount of time.However, with NUMA, accessing some parts of memory by acore may take longer than other parts, creating a performancepenalty. FDT is an application optimized for the transfer ofa large number of files [85]. Hence, thousands of files canbe sent continuously, without restarting the network transferbetween files. However, FDT and mdtmFTP have not beenwidely adopted despite encouraging performance results [84].
Table VI lists additional data transfer applications andimplemented features. Besides TCP-based applications, threeUDP-based applications are listed. Here, a common feature inUDP-based applications is the use of a single UDP stream,rather than multiple streams. A key limitation observed inScience DMZs when using a single UDP stream is CPU-related. Namely, in multicore processor architectures, a UDPstream is adhered to a single core, which may become sat-urated. As a result, the UDP transmission rate can be lowerthan the available bandwidth. At the same time, other coresmay be idle and underutilized [91]. UDP-based applica-tions do not use congestion windows for congestion control.Instead, they use rate-based congestion control, similar toBBR [24]. Here, congestion is signaled by an increase inthe RTT, which triggers a decrease in the transmission rate.ExpeData [88] and Aspera Fast [86] are two proprietaryimplementations and some details are not available. Somespecialized applications are used in enterprise environments,but their performance for big science data transfers is notavailable.
B. Virtual Machines and Science DMZs
The idea behind a virtual machine is to abstract the hard-ware of a computer into several execution environments. Asa physical resource, access to a NIC is also shared. In thiscontext, Fig. 20 shows a sample topology with three hosts.Host 1 contains three virtual machines connected by a vir-tual switch. One virtual machine is a DTN. Hosts 2 and 3 arenative (non-virtual) DTNs. A virtual switch is implementedinside the hypervisor. Similar to a physical switch, the vir-tual switch constructs its own forwarding table and forwardsframes at the data-link layer. The virtual switch also connectsto the external network through a physical NIC.
A virtual machine is connected to the internal networkthrough a virtual NIC. There are different types of virtualNICs, including the following:

CRICHIGNO et al.: COMPREHENSIVE TUTORIAL ON SCIENCE DMZ 2057
TABLE VIFEATURES OF VARIOUS DATA TRANSFER APPLICATIONS. U INDICATES UNKNOWN
Fig. 20. Network topology including a virtual DTN contained in host 1 andtwo native (non-virtual) DTNs, host 2 and host 3.
• E1000: an emulated version of the Intel 82545EM GigabitEthernet NIC. Older (Linux and Windows) guest operat-ing systems use this virtual NIC.
• E1000e: this virtual NIC emulates newer models of IntelGigabit NICs. It is the default virtual NIC for newer(Windows) guest operating systems.
• VMXNET: this virtual NIC has no physical counter-part. There are two enhanced versions, VMXNET2 andVMXNET3. The latter is recommended for high-speeddata transfers [92].
While virtual technologies have been widely adoptedin enterprise networks, their use in Science DMZs hasbeen discouraged for several reasons. First, the hypervisor
represents a software layer that adds processing overhead.Second, the physical NIC is potentially shared among multiplevirtual machines. Third, even if the virtual DTN is the onlyvirtual machine running on a physical server, the CPU must beshared with the hypervisor and the virtual switch. Moreover,commercial vendors may not disclose important attributesof the virtual switch, such as buffer size and switchingarchitecture.
Based on the above limitations, virtualization is not recom-mended for Science DMZs operating at speeds above 10 Gbps.For Science DMZs operating at 10 Gbps, preliminary results inSection VII suggest that virtual DTNs may achieve an accept-able performance, provided the physical server they run onhas a high CPU capacity and the workload is controlled.
C. Monitoring and Performance Applications for ScienceDMZs
One of the essential elements of a Science DMZ is theperformance measurement and monitoring point. The mon-itoring process in Science DMZs focuses on multi-domainend-to-end performance metrics. On the other hand, themonitoring process in enterprise networks focuses on single-domain performance metrics. Accordingly, Fig. 21 presentsmonitoring applications: perfSONAR [38], [39], SimpleNetwork Management Protocol (SNMP) [93], Syslog [94], andNetflow [41]. The latter is also used for security purposes andis discussed in Section VI.
1) PerfSONAR: perfSONAR [38], [39] is an applicationthat helps locate network failures and maintain optimal end-to-end usage expectations. Each organization deciding to use this
2058 IEEE COMMUNICATIONS SURVEYS & TUTORIALS, VOL. 21, NO. 2, SECOND QUARTER 2019
TABLE VIICOMPARISON BETWEEN SNMP AND PERFSONAR
Fig. 21. Monitoring applications.
tool is required to install a measurement point in its network,as shown in Fig. 22(a). The service providers 1, 2, and 3 pro-vide connectivity to campus networks 1 and 2. A measurementpoint is a Linux machine running the perfSONAR applica-tion. perfSONAR offers several services, including automatedbandwidth tests and diagnostic tools.
One of the main features of perfSONAR is its cooperativenature by which an institution can measure several metrics(e.g., throughput, latency, packet loss) to different intermediarydomains and to a destination network. Using the example ofFig. 22(a), campus network 1 can measure metrics from itselfto campus network 2. Campus network 1 can also measuremetrics to the service providers. Fig. 22(b) shows a sampledashboard view for packet loss rate for the perfSONAR nodeat campus network 1.
Given the increasing number of Science DMZs, perfSONARhas seen a steady increase in deployments. Currently, there aremore than 2,000 perfSONAR measurement points deployedaround the world. In the U.S., most Science DMZs include
Fig. 22. perfSONAR application. (a) Multi-domain topology. Each networkhas a perfSONAR node. (b) Corresponding perfSONAR dashboard.
at least one perfSONAR node. Fig. 23 shows the location ofperfSONAR nodes as of June 2017.
2) Comparison of Monitoring Applications in EnterpriseNetworks and Science DMZs: The ubiquitous SNMP proto-col is also widely used for monitoring purposes. Accordingly,Table VII compares SNMP and perfSONAR. Overall, theirfunctionalities are complementary and a well-monitoredScience DMZ may include both. SNMP is used to monitora single administrative domain; thus it lacks ability to detectfailures beyond the local domain. Also SNMP can only infer,to some extent, a performance metric based on polling of indi-vidual network elements. Meanwhile, perfSONAR includes aset of active testing tools to measure performance via probing.End-to-end and soft failures can be detected with perfSONARbecause of its multi-domain characteristic, sub-path testing,and end-to-end tools. On the other hand, some hard failures

CRICHIGNO et al.: COMPREHENSIVE TUTORIAL ON SCIENCE DMZ 2059
TABLE VIIICOMPARISON OF DATA TRANSFER AND MONITORING APPLICATIONS, AND VIRTUALIZATION USE IN ENTERPRISE NETWORKS AND SCIENCE DMZ
are easily detected by SNMP while they may not be detectedquickly by perfSONAR. While reporting applications areavailable for both, perfSONAR’s reports include multi-domainresults. Regarding security, SNMPv3 includes confidentiality,integrity and authentication.
D. WAN Emulation and Other Performance Applications
When deploying a Science DMZ, routers, switches, andDTNs should be tested. Problems associated with routers andswitches may not be observed in a testing environment unlessWAN conditions, such as delay and jitter, are introduced. Thus,inadequate buffer sizes can easily be overlooked. Hence fortesting purposes, in the absence of a WAN, a useful alter-native is a network emulator. With such a tool, applicationsand devices can be tested over a virtual network. Now, twoapplications widely used to emulate a WAN are netem [97]and iPerf [98]. netem is a Linux application that emulatesthe properties of a WAN and permits to vary parameters suchas delay, jitter, packet loss, and duplication and re-orderingof packets. Meanwhile, iPerf measures memory-to-memorythroughput from a client (sender) to a server (receiver).The client generates dummy application-layer data in main
Fig. 23. perfSONAR nodes deployed as of June 2017.
memory, which is then moved down through the protocol stackand over the network media. The server receives the data andmoves it up through the protocol stack. The two applications,netem and iPerf, can be used together to emulate data transfersbetween DTNs and test TCP parameters (congestion controlalgorithms, buffer size, TCP extensions), routers, and switches.
E. Applications in Enterprise Networks and Science DMZs
Table VIII compares data transfer and monitoring applica-tions used in enterprise networks and Science DMZs. The use
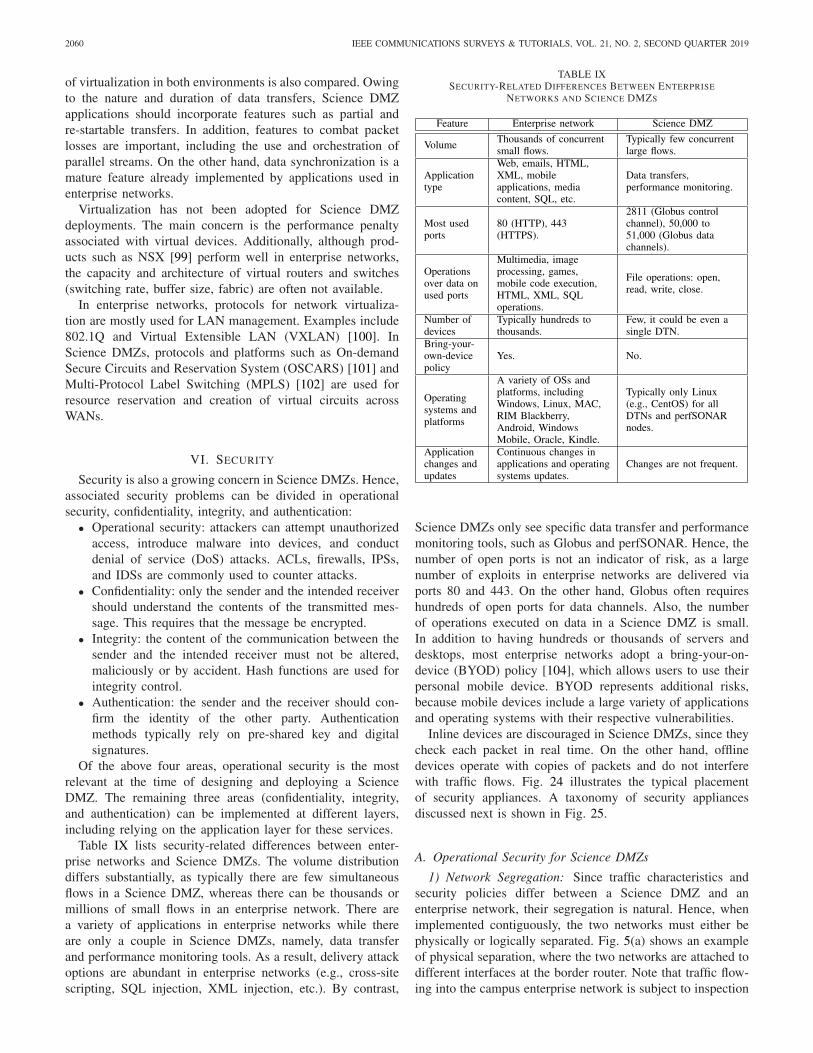
2060 IEEE COMMUNICATIONS SURVEYS & TUTORIALS, VOL. 21, NO. 2, SECOND QUARTER 2019
of virtualization in both environments is also compared. Owingto the nature and duration of data transfers, Science DMZapplications should incorporate features such as partial andre-startable transfers. In addition, features to combat packetlosses are important, including the use and orchestration ofparallel streams. On the other hand, data synchronization is amature feature already implemented by applications used inenterprise networks.
Virtualization has not been adopted for Science DMZdeployments. The main concern is the performance penaltyassociated with virtual devices. Additionally, although prod-ucts such as NSX [99] perform well in enterprise networks,the capacity and architecture of virtual routers and switches(switching rate, buffer size, fabric) are often not available.
In enterprise networks, protocols for network virtualiza-tion are mostly used for LAN management. Examples include802.1Q and Virtual Extensible LAN (VXLAN) [100]. InScience DMZs, protocols and platforms such as On-demandSecure Circuits and Reservation System (OSCARS) [101] andMulti-Protocol Label Switching (MPLS) [102] are used forresource reservation and creation of virtual circuits acrossWANs.
VI. SECURITY
Security is also a growing concern in Science DMZs. Hence,associated security problems can be divided in operationalsecurity, confidentiality, integrity, and authentication:
• Operational security: attackers can attempt unauthorizedaccess, introduce malware into devices, and conductdenial of service (DoS) attacks. ACLs, firewalls, IPSs,and IDSs are commonly used to counter attacks.
• Confidentiality: only the sender and the intended receivershould understand the contents of the transmitted mes-sage. This requires that the message be encrypted.
• Integrity: the content of the communication between thesender and the intended receiver must not be altered,maliciously or by accident. Hash functions are used forintegrity control.
• Authentication: the sender and the receiver should con-firm the identity of the other party. Authenticationmethods typically rely on pre-shared key and digitalsignatures.
Of the above four areas, operational security is the mostrelevant at the time of designing and deploying a ScienceDMZ. The remaining three areas (confidentiality, integrity,and authentication) can be implemented at different layers,including relying on the application layer for these services.
Table IX lists security-related differences between enter-prise networks and Science DMZs. The volume distributiondiffers substantially, as typically there are few simultaneousflows in a Science DMZ, whereas there can be thousands ormillions of small flows in an enterprise network. There area variety of applications in enterprise networks while thereare only a couple in Science DMZs, namely, data transferand performance monitoring tools. As a result, delivery attackoptions are abundant in enterprise networks (e.g., cross-sitescripting, SQL injection, XML injection, etc.). By contrast,
TABLE IXSECURITY-RELATED DIFFERENCES BETWEEN ENTERPRISE
NETWORKS AND SCIENCE DMZS
Science DMZs only see specific data transfer and performancemonitoring tools, such as Globus and perfSONAR. Hence, thenumber of open ports is not an indicator of risk, as a largenumber of exploits in enterprise networks are delivered viaports 80 and 443. On the other hand, Globus often requireshundreds of open ports for data channels. Also, the numberof operations executed on data in a Science DMZ is small.In addition to having hundreds or thousands of servers anddesktops, most enterprise networks adopt a bring-your-on-device (BYOD) policy [104], which allows users to use theirpersonal mobile device. BYOD represents additional risks,because mobile devices include a large variety of applicationsand operating systems with their respective vulnerabilities.
Inline devices are discouraged in Science DMZs, since theycheck each packet in real time. On the other hand, offlinedevices operate with copies of packets and do not interferewith traffic flows. Fig. 24 illustrates the typical placementof security appliances. A taxonomy of security appliancesdiscussed next is shown in Fig. 25.
A. Operational Security for Science DMZs
1) Network Segregation: Since traffic characteristics andsecurity policies differ between a Science DMZ and anenterprise network, their segregation is natural. Hence, whenimplemented contiguously, the two networks must either bephysically or logically separated. Fig. 5(a) shows an exampleof physical separation, where the two networks are attached todifferent interfaces at the border router. Note that traffic flow-ing into the campus enterprise network is subject to inspection

CRICHIGNO et al.: COMPREHENSIVE TUTORIAL ON SCIENCE DMZ 2061
Fig. 24. Physical and logical locations of security appliances. (a) Securityappliance (ACL, IPS, IDS, and/or firewall) co-located with the border router.(b) Security appliances in the OSI model.
by a firewall and other security appliances, while traffic flow-ing into the Science DMZ is subject to a minimal inspectionby the border router only.
An alternative to physical segregation is logical segregationby using VLAN technology. A VLAN is a logical subgroupwithin the LAN that is created at the switch via software ratherthan physical hardware. The Science DMZ can be isolatedfrom the campus enterprise network by establishing one ormore VLANs assigned to the Science DMZ. Since a VLANcan have its own IP address scheme, different access and secu-rity policies can be implemented based on IP. However, adisadvantage of a VLAN-based segregation is that the band-width of the interface to which both the Science DMZ andenterprise network are attached must be shared. Hence, ifthere is no mechanism to control the bandwidth allocation toeach network, the enterprise network may starve when DTNsare actively transferring data. Additionally, switches must bedimensioned based on Science DMZ requirements.
2) Access-Control List: ACLs are used to control the accessto a Science DMZ. Since ACLs are implemented in the for-warding plane of routers and switches, they do not compromiseperformance. Additionally, as collaborators’ IP addresses maybe known in advance, a targeted security policy can be used.Fig. 26 shows an example of an ACL implementation [105].Fig. 26(a) shows the input pipeline, where a packet arrives atthe input port and the termination line performs physical-layerfunctions. The parser engine parses the incoming packets andextracts the fields required for lookup. The lookup processresults in an output port the packet will be forwarded to. Atthis moment, the inbound ACL is applied to the packet. Thepacket is then switched through the fabric and buffered. Theoutput pipeline, shown in Fig. 26(b), follows a similar scheme.
Fig. 26(c) shows an ACL used to protect a Science DMZ.The DTN with IP address 37.96.87.13 is located in the pro-tected Science DMZ. The IP addresses of other DTNs fromcollaborators’ networks are 143.10.21.2 and 98.103.6.12. TheACL is applied in the inbound direction at the interface facingthe WAN. The ACL has three rules; the first two rules permitany TCP segment coming from the collaborators’ addressesand going to the local DTN. The last rule denies any otherpackets from entering the Science DMZ. Note that stricterrules can also be applied, even incorporating port informa-tion (e.g., an ACL may only permit TCP segments fromcollaborators at the ports used by Globus).
3) Firewalls: These devices are capable of processing alarge number of small flows characterized by short durationsand low transfer rates. Additionally, firewalls typically havesmall buffers [4]. Clearly, Science DMZ flows do not matchthis traffic profile. As a result, when a large flow crosses afirewall, the throughput of the flow deteriorates rapidly.
Consider Fig. 27, which shows the throughput for datatransfers between a DTN located at Brown University inProvidence, Road Island, and a DTN located at the Universityof Colorado in Boulder, Colorado [106]. These two DTNs areconnected by a 1 Gbps path. Fig. 27(a) shows the through-put achieved when there is one firewall located at BrownUniversity. The blue curve is the throughput from the DTN atBrown University to the DTN at the University of Colorado.This traffic is referred to as outbound, and the firewall is notintended to inspect this flow. The green curve is the through-put from the DTN at the University of Colorado to the DTNat Brown University. This traffic is referred to as inbound, andthe firewall inspects each packet of this flow.
While both curves show that throughput is affected, theinspection impact on the inbound traffic is critical. For exam-ple, the inbound throughput does not even reach 50 Mbps,or 5% of the 1 Gbps path capacity. Fig 27(b) shows theperformance between the same two DTNs, but for the casewhere the firewall is removed from the path. In this instance,the throughput is approximately 900 Mbps, or 90% of thecapacity. The reason of this performance difference is relatedto TCP retransmissions. Namely, every time that TCP receivesa triple duplicate ACK for a packet that is lost, a fast retrans-mission is triggered and the congestion window is reduced byhalf, thus reducing throughput.
Fig. 27(c) illustrates a generic architecture of a 10 Gbpsenterprise firewall. Internally, load balancing among 20 fire-wall processors is achieved on a per-flow basis (each firewallprocessor has a capacity of 0.5 Gbps). Note that the maximumthroughput is not determined by a single large flow; instead,the maximum throughput is the aggregate throughput of thou-sands of small flows. When a flow with a rate above 0.5 Gbpsarrives at the input interface, all packets of the flow are pro-cessed by the same firewall processor. Eventually, incomingpackets are dropped as a consequence of the low capacity ofthe individual firewall processor.
Note that data transfers in LANs may still achieve reason-able performance in the presence of firewalls. Namely, sincethe latency is small, the TCP throughput can increase quicklyafter a packet loss. Specifically, after reducing the congestion

2062 IEEE COMMUNICATIONS SURVEYS & TUTORIALS, VOL. 21, NO. 2, SECOND QUARTER 2019
Fig. 25. Operational security appliances and techniques.
Fig. 26. Implementation and use of ACLs. (a) Diagram of the input and (b) output ports of a router, and the placement of inbound and outbound ACLs.(c) A Science DMZ protected by an inbound ACL. Notice the targeted security by which only specific collaborators’ DTNs at 143.10.21.2 and 98.103.6.12are permitted to connect to the DTN 37.96.87.13.
Fig. 27. Impact of a firewall on a data transfer. Throughput performance between a DTN at the University of Colorado in Boulder, Colorado, and a DTN atBrown University in Providence, Rhode Island. The blue curve is the throughput from the DTN at Brown University to the DTN at University of Colorado.The green curve is the throughput from the DTN at the University of Colorado to the DTN at Brown University. (a) Data transfer when a firewall is located inthe path of the two hosts. (b) Data transfer when the firewall is removed from the path. The results of (a) and (b) are reproduced from [106]. (c) Conceptual10 Gbps firewall architecture.
window by half, TCP increases the congestion window againin a time that is proportional to the RTT.
4) Intrusion Prevention System: One of the main fea-tures of an IPS is the database containing attack signatures.However, the process of matching a signature with the con-tent of the packet in real time is time consuming. Even newIPS devices such as the Next Generation IPS (NGIPS) [107],which advertise throughputs of tens to hundreds of Gbps, arenot suitable for processing large flows. Akin to firewalls, they
are designed for processing thousands of small flows simulta-neously. For example, the underlying technology of the NGIPSis Snort [108], an open source IPS engine. For an NGIPSappliance rated at 10 Gbps with 20 internal processors, itsmaximum throughput is only achieved by aggregating the indi-vidual throughput of these 20 internal Snort instances. Sinceeach instance has a capacity of 0.5 Gbps and packets belongingto the same flow are processed by the same Snort instance,inspecting a 10 Gbps science flow is not feasible here [27].

CRICHIGNO et al.: COMPREHENSIVE TUTORIAL ON SCIENCE DMZ 2063
Fig. 28. IDS implementations. (a) Payload-based IDS model. (b) Flow-basedIDS model.
5) Intrusion Detection System: For Science DMZs, IDSsrepresent a better option than IPSs. These systems can beclassified based on the information used to detect attacks:payload-based IDS and flow-based IDS [109], [110]. Payload-based IDSs inspect the content of every packet. For high-speednetworks, the main challenge of this approach is the pro-cessing capability. Meanwhile, flow-based IDSs analyze thecommunication patterns within the network rather than thecontents of individual packets. These devices are attractivefor Science DMZs, because of the substantial processingreduction.
Fig. 28(a) illustrates the deployment of a payload-basedIDS. The border router forwards traffic to a switch. Packetsaddressed to the protected network are copied and sent to theIDS. The copy is typically done by a switch with a featurecalled Switched Port Analyzer (SPAN). SPAN copies networktraffic from a selected source port in the switch to a selecteddestination port. The latter is connected to the IDS.
A popular payload-based IDS is Bro [111]. Bro is well-suited for use in a Science DMZ for several reasons:1) flexibility in defining security policies, which can be granu-larly customized by using a domain-specific scripting languageinterpreted by a policy script interpreter layer; 2) incorpora-tion of hundreds of protocol analyzers in the event engine,allowing the IDS to detect anomalies carried in practicallyall existent protocols; and 3) scalability. As science flows arecharacterized at rates of tens of Gbps or more, the potentialtraffic volumes surpass the capacity of a single-instance IDS.Hence, Bro nodes can be organized in clusters, where clustersof nodes cooperate seamlessly [28]. However, at very highrates, the amount of processing may become excessive, evenfor a clustered IDS [18].
Flow-based IDSs track the lifetime of a flow and char-acterize its behavior [109], [110]. This characterization mayincorporate several attributes such as the time the exchangeof data started, the time it ended, the number of transferredbytes, etc. Fig. 28(b) shows a Netflow-based IDS protecting aScience DMZ. The Netflow-enabled router collects statisticalinformation of all incoming flows passing through the interfacefacing the WAN. These statistics are collected in hardwareby an interface’ network processor. The router then extractsthe packet header from each packet seen on the monitoredinterface, and marks the header with a timestamp. It then pro-ceeds to update a flow entry in the flow cache of the router.Once a flow record expires (typically seconds or few minutes),it is sent to a flow collector. Note that the volume of informa-tion sent to and stored by the flow collector is several ordersof magnitude lower than the actual traffic.
For campuses operating at 100 Gbps, the sampling flow(sFlow) technique [42] is a more scalable solution thanNetflow. Here, for a given flow, instead of processing eachpacket, sFlow can process 1 out of a packets, where a is aconfigurable parameter. It should be noted, however, that sam-pling not only lowers the demands put on the flow exporter,but also could make the detection of intrusions harder [109].
6) Response Plan: In general, at least two actions that canbe taken once an anomaly is detected are black hole routingand ACL blocking. The black hole routing approach dropspackets coming from a suspicious source IP address (e.g., anattacker identified by an IDS) by installing a particular entryin the routing table. The mechanism used is called UnicastReverse Path Forwarding (uRPF) [112]. This information canbe disseminated to other routers via BGP [52]. The ACLblocking technique creates and installs an ACL in the borderrouter when an offender is identified.
Black hole routing is more effective if the information isdisseminated to other routers, thus the attack is preventedbefore packets reach the Science DMZ. On the other hand,ACL blocking is simpler and effective, but the router muststill process each offender packet.
B. Confidentiality, Integrity, and Authentication
Confidentiality, integrity, and authentication services aretypically provided by the application layer, specifically, bythe data transfer tool. These security aspects are requiredfor certain applications. For example, medical ScienceDMZs [10], [113] transport medical information that mustadhere to security and privacy laws and regulations.
Globus [26], [35] provides authentication on the controlchannel by default. Confidentiality and integrity are both sup-ported on the data channel but are not enabled by default.Vardoyan et al. [69] showed that by using Globus withmultiple threads, the encryption of the data channel has a mini-mal performance impact. Globus also includes a feature calledstriped configuration, which is illustrated in Fig. 29(a). In thisconfiguration, multiple cooperating DTNs can exchange datawith remote DTNs [35]. The DTNs are coordinated by a serverprotocol interpreter (SPI), which implements the control chan-nel. Transfers are then divided over all available DTNs, thus

2064 IEEE COMMUNICATIONS SURVEYS & TUTORIALS, VOL. 21, NO. 2, SECOND QUARTER 2019
TABLE XSECURITY CONSIDERATIONS IN SCIENCE DMZS
allowing the combined bandwidth of all DTNs to be used.An advantage of this configuration when implementing fullencryption is the distribution of processing load.
Modern symmetric-key algorithms can also efficientlyencrypt and decrypt data. Some manufacturers, such as Inteland AMD, now offer hardware-based instructions to improvethe encryption and decryption throughput of some algorithms,such as the Advanced Encryption Standard (AES). Also,block ciphers provide abundant parallelism’s opportunities. Forexample, when operating in counter mode, AES can encryptand decrypt blocks in parallel, and the throughput can beincreased according to the amount of parallelism provided bymultiple cores. Current encryption technology is suitable for10 Gbps rates.
On the other side of encryption is the file integrity check(FIC). To verify the integrity of a file, the entire file mustbe received first. Only then can the destination DTN run acryptographic hash function on the received file. Thus, FICmay represent a larger performance penalty than encryptionand decryption.
For authentication purposes, an industry standard that isincreasingly being adopted is OAuth 2.0 [114]. Consider aclient DTN attempting to download a large file from a serverDTN. Here the client DTN is provided with a delegatedaccess to the file resting at the server DTN without sharingcredentials.
Confidentiality, integrity, and authentication can also beimplemented via a site-to-site virtual private network (VPN).Here, the sender router encrypts the traffic before it entersthe WAN. The receiver router then decrypts the traffic uponarrival to the destination Science DMZ. Fig. 29(b) illustratesthis alternative. Now, most routers implement VPNs based onthe IP security (IPsec) architecture [115]. While IPsec is awell-proven technology, its main disadvantage is the additionalprocessing overhead at the router.
C. Security Summary
Table X summarizes the various security techniques.Clearly, securing a Science DMZ cannot be done with a sin-gle device or technique. ACLs are strongly recommended for
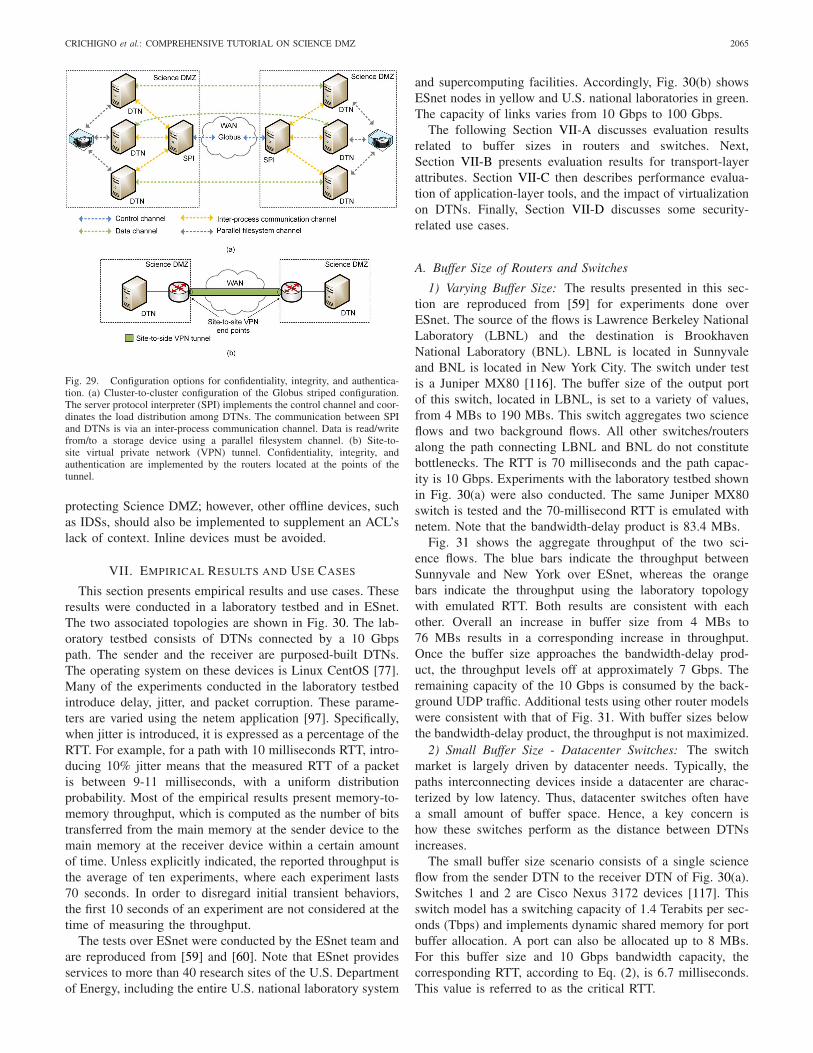
CRICHIGNO et al.: COMPREHENSIVE TUTORIAL ON SCIENCE DMZ 2065
Fig. 29. Configuration options for confidentiality, integrity, and authentica-tion. (a) Cluster-to-cluster configuration of the Globus striped configuration.The server protocol interpreter (SPI) implements the control channel and coor-dinates the load distribution among DTNs. The communication between SPIand DTNs is via an inter-process communication channel. Data is read/writefrom/to a storage device using a parallel filesystem channel. (b) Site-to-site virtual private network (VPN) tunnel. Confidentiality, integrity, andauthentication are implemented by the routers located at the points of thetunnel.
protecting Science DMZ; however, other offline devices, suchas IDSs, should also be implemented to supplement an ACL’slack of context. Inline devices must be avoided.
VII. EMPIRICAL RESULTS AND USE CASES
This section presents empirical results and use cases. Theseresults were conducted in a laboratory testbed and in ESnet.The two associated topologies are shown in Fig. 30. The lab-oratory testbed consists of DTNs connected by a 10 Gbpspath. The sender and the receiver are purposed-built DTNs.The operating system on these devices is Linux CentOS [77].Many of the experiments conducted in the laboratory testbedintroduce delay, jitter, and packet corruption. These parame-ters are varied using the netem application [97]. Specifically,when jitter is introduced, it is expressed as a percentage of theRTT. For example, for a path with 10 milliseconds RTT, intro-ducing 10% jitter means that the measured RTT of a packetis between 9-11 milliseconds, with a uniform distributionprobability. Most of the empirical results present memory-to-memory throughput, which is computed as the number of bitstransferred from the main memory at the sender device to themain memory at the receiver device within a certain amountof time. Unless explicitly indicated, the reported throughput isthe average of ten experiments, where each experiment lasts70 seconds. In order to disregard initial transient behaviors,the first 10 seconds of an experiment are not considered at thetime of measuring the throughput.
The tests over ESnet were conducted by the ESnet team andare reproduced from [59] and [60]. Note that ESnet providesservices to more than 40 research sites of the U.S. Departmentof Energy, including the entire U.S. national laboratory system
and supercomputing facilities. Accordingly, Fig. 30(b) showsESnet nodes in yellow and U.S. national laboratories in green.The capacity of links varies from 10 Gbps to 100 Gbps.
The following Section VII-A discusses evaluation resultsrelated to buffer sizes in routers and switches. Next,Section VII-B presents evaluation results for transport-layerattributes. Section VII-C then describes performance evalua-tion of application-layer tools, and the impact of virtualizationon DTNs. Finally, Section VII-D discusses some security-related use cases.
A. Buffer Size of Routers and Switches
1) Varying Buffer Size: The results presented in this sec-tion are reproduced from [59] for experiments done overESnet. The source of the flows is Lawrence Berkeley NationalLaboratory (LBNL) and the destination is BrookhavenNational Laboratory (BNL). LBNL is located in Sunnyvaleand BNL is located in New York City. The switch under testis a Juniper MX80 [116]. The buffer size of the output portof this switch, located in LBNL, is set to a variety of values,from 4 MBs to 190 MBs. This switch aggregates two scienceflows and two background flows. All other switches/routersalong the path connecting LBNL and BNL do not constitutebottlenecks. The RTT is 70 milliseconds and the path capac-ity is 10 Gbps. Experiments with the laboratory testbed shownin Fig. 30(a) were also conducted. The same Juniper MX80switch is tested and the 70-millisecond RTT is emulated withnetem. Note that the bandwidth-delay product is 83.4 MBs.
Fig. 31 shows the aggregate throughput of the two sci-ence flows. The blue bars indicate the throughput betweenSunnyvale and New York over ESnet, whereas the orangebars indicate the throughput using the laboratory topologywith emulated RTT. Both results are consistent with eachother. Overall an increase in buffer size from 4 MBs to76 MBs results in a corresponding increase in throughput.Once the buffer size approaches the bandwidth-delay prod-uct, the throughput levels off at approximately 7 Gbps. Theremaining capacity of the 10 Gbps is consumed by the back-ground UDP traffic. Additional tests using other router modelswere consistent with that of Fig. 31. With buffer sizes belowthe bandwidth-delay product, the throughput is not maximized.
2) Small Buffer Size - Datacenter Switches: The switchmarket is largely driven by datacenter needs. Typically, thepaths interconnecting devices inside a datacenter are charac-terized by low latency. Thus, datacenter switches often havea small amount of buffer space. Hence, a key concern ishow these switches perform as the distance between DTNsincreases.
The small buffer size scenario consists of a single scienceflow from the sender DTN to the receiver DTN of Fig. 30(a).Switches 1 and 2 are Cisco Nexus 3172 devices [117]. Thisswitch model has a switching capacity of 1.4 Terabits per sec-onds (Tbps) and implements dynamic shared memory for portbuffer allocation. A port can also be allocated up to 8 MBs.For this buffer size and 10 Gbps bandwidth capacity, thecorresponding RTT, according to Eq. (2), is 6.7 milliseconds.This value is referred to as the critical RTT.

2066 IEEE COMMUNICATIONS SURVEYS & TUTORIALS, VOL. 21, NO. 2, SECOND QUARTER 2019
Fig. 30. Network topologies used for testing network performance. (a) Laboratory testbed. All links operate at 10 Gbps. (b) ESnet topology [3]. Linksoperate at 10 and 100 Gbps.
Fig. 31. Aggregate throughput of the two TCP flows described inSection VII-A.1. The switch used for testing performance is a JuniperMX80 [116]. RTT: 70 milliseconds; link bandwidth: 10 Gbps for all links;bandwidth-delay product: 83.4 MBs. The results are reproduced from [59].
Fig. 32 shows the throughput as a function of the RTT. Thegreen curves represent the throughput and the throughput vari-ation obtained when no artificial jitter is added into the system.Note that the throughput variation is simply the coefficient ofvariation of the throughput, which is the ratio of the standarddeviation to the average throughput. Meanwhile, the red curvesrepresent the throughput and the throughput variation obtainedwhen additional jitter is added. By introducing variance intothe RTT of a packet, the emulated WAN produces bursts andpacket reordering. The MTU is 1,500 bytes.
Consider the throughput curves. For RTT values of 1, 2,and 4 milliseconds, the green and red curves are similar andthe throughput is above 9 Gbps. However, when the RTTincreases to 8 milliseconds, the difference between the twocurves becomes substantial. At that point, the throughput withminimal jitter is still above 9 Gbps whereas the throughputwith 10% RTT jitter is drastically reduced to approximately2.6 Gbps. This reduction is produced by the buffer limitationand the reception of out-of-order packets. According to Eq. (2),in order to sustain the throughput when the RTT is 8 millisec-onds, the amount of buffer space must be almost 10 MBs.Instead, switches 1 and 2 can only allocate 8 MBs per port.However, notice that when the jitter is minimal, the through-put is still 8 Gbps, even when the RTT is 32 milliseconds.
Fig. 32. Throughput and throughput variation as a function of the RTT. Fortests presented in this section, switches 1 and 2 in Fig. 30(a) have 8 MBs ofmemory to allocate per port. The critical RTT is 6.7 milliseconds.
This result suggests that throughput can be improved by min-imizing jitter and increasing inter-packet spacing. While jittermay not be removed completely, the inter-packet spacing canbe increased with TCP pacing.
Consider now the throughput variation results. When theRTT is less than 4 milliseconds, the variation is less than5%. For the red curve, note that the maximum value occurswhen the RTT is 8 milliseconds (i.e., the RTT is approximatelyequal to the critical RTT). At that point, the variation is above25% and throughput degradation is accentuated. As a result,predictability, an important feature for Science DMZs, is nolonger attained.
B. Transport-Layer Attributes
1) Maximum Segment Size: The MSS value has an impor-tant impact on throughput, in particular when packet losses andcorruption occur. Hence, Fig. 33 illustrates the results of a datatransfer between the two DTNs in Fig. 30(a), with 20 millisec-onds RTT. The bandwidth-delay product is 11.92 MBs. Usingnetem, the system introduces on average 10 single-bit errorsduring a 60-second period, or its equivalent of 0.1667 errorsper second. These errors are uniformly distributed over thetest period and force TCP to retransmit segments and decreasethroughput when a triple duplicate ACK is received. Now, con-sider the red curve of Fig. 33. When the MSS is 1,000 bytes,

CRICHIGNO et al.: COMPREHENSIVE TUTORIAL ON SCIENCE DMZ 2067
Fig. 33. Red curve: throughput as a function of the MSS, for data transfersbetween two DTNs connected by a 10 Gbps, 20 milliseconds path. The pathintroduces 0.1667 single-bit errors per second. Green curve: correspondingthroughput variation.
Fig. 34. Experimental results of a data transfer between to DTNs connectedby a 10 Gbps path with approximately 0.1667 single-bit errors per second.
even this modest corruption rate reduces the throughput to4.85 Gbps. As the MSS increases to 9,000 bytes, the through-put also increases to 8.65 Gbps. Clearly, a large MSS valuemakes TCP more tolerant to corruption.
A large MSS value also enhances the performance pre-dictability of TCP. The green curve of Fig. 33 shows thethroughput variation for the same scenario. For small 1,000-and 2,000-byte MSSs, the throughput variability is above25%. This result indicates a high level of performance uncer-tainty, which goes against the operational principles of ScienceDMZs. As the MSS increases, however, the throughput vari-ation decreases significantly. For example, when the MSS is9,000 bytes, the throughput variation is slightly above 5%.
2) Selective Acknowledgment: This section studies theimpact of TCP SACK on large flows. Namely, Fig. 34 showsthe performance of TCP with and without SACK, for datatransfers between the two DTNs in Fig. 30(a). Switches 1 and2 have 8 MBs of buffer memory. Thus, the critical RTT basedon Eq. (2) is 6.7 milliseconds. The system introduces single-bit errors (which trigger selective acknowledgements) at a rateof 0.1667 errors per second.
When the RTT is small, enabling SACK improvesperformance, in particular for 1,500-byte MSS. However,when the RTT is 8 milliseconds or above, the throughput ishighly degraded for 1,500-byte MSS, independent of the use ofSACK. On the other hand, when MSS is 9,000 bytes and RTTis above 4 milliseconds, the throughput is increased by not
enabling SACK. For example, when the RTT is 16 millisec-onds, disabling SACK allows DTNs to obtain a throughputof approximately 9.5 Gbps, while enabling it results in athroughput of approximately 6.5 Gbps.
The impact of SACK on large data transfers at 10 Gbps isnot conclusive. In paths with small to medium RTT, the use ofSACK is encouraged in [70] and confirmed in the above exper-iments. However, in high-bandwidth high-latency paths with asmall MSS, using SACK may end up degrading performance.
3) TCP Pacing: The results of this section are reproducedfrom [60]. TCP pacing has been described as a poten-tial scheme to mitigate traffic bursts generated by smallflows [62]. With the increase in science traffic across networks,researchers have recently explored the impact of pacing onlarge flows [60].
Fig. 35(a) shows the results of data transfers in ESnet. Thepath capacity and RTT between DTNs are 100 Gbps and92 milliseconds respectively. Transfers use TCP Cubic [79]without FQ pacing and a MSS of 1,500 bytes. Four concur-rent TCP connections are generated from a single source DTNto a single destination DTN. These four connections exhibitthe typical sawtooth behavior [58], which in part is attributedto the inability of switches to absorb traffic bursts. Notice thataccording to Eq. (2), a large amount of buffer space is neededto absorb bursts for this setup, namely 1,097 MBs. Fig. 35(b)shows the behavior of TCP Cubic with FQ pacing. The pacingrate for the four TCP connections is approximately 20 Gbps(curves are overlapped at nearly 20 Gbps). The throughput isslightly lower than 20 Gbps per connection. However, noticehow the sawtooth behavior is reduced and stable rates areobtained.
In general, TCP FQ pacing is also effective when there arerate mismatches along the path between the sender and thereceiver. This is the case, for example, when the ingress portof a router has a capacity of 100 Gbps and the egress porthas a capacity of 10 Gbps. As TCP increases the congestionwindow during the additive increase phase, eventually the bot-tleneck link becomes full while the rest of the links becomeunderutilized. The mismatches produce a continuous circle ofadditive increases and multiplicative decreases, thus generatingthe sawtooth behavior.
Fig. 35(c) shows the data transfer between two DTNs overESnet. One DTN is located in Amarillo, Texas, and the otherDTN is located in New York City. Although the WAN con-necting the two sites has 100 Gbps capacity, one of the DTNsis attached to the network via a 1 Gbps network interface card.Thus, the entirety of the path includes multiple 100 Gbps linksand one bottleneck link of 1 Gbps. The figure shows threecurves: the throughput when both DTNs are based on LinuxCentOS [77] Version 6 (violet), the throughput when DTNs arebased on Linux CentOS Version 7 (green), and the through-put when DTNs are based on Linux CentOS Version 7 andpackets are paced at 800 Mbps (blue). Note that pacing alsoleads to much more stable behaviors, almost removing theTCP sawtooth behavior.
4) Congestion Control: TCP BBR is an example of a con-gestion control algorithm that uses pacing to adjust the ratenear the estimated bottleneck bandwidth [24]. Hence, this

2068 IEEE COMMUNICATIONS SURVEYS & TUTORIALS, VOL. 21, NO. 2, SECOND QUARTER 2019
Fig. 35. Impact of TCP pacing on throughput. (a) Data transfers of four parallel TCP connections across a 100 Gbps, 92 milliseconds RTT path. (b) Thesame data transfer as in (a), but using TCP pacing. (c) Data transfers between two DTNs connected by a path with a bottleneck link of 1 Gbps. The curvesshow the performance when the DTNs use different Linux operating systems (violet: CentOS 6; green: CentOS 7, and blue: CentOS7 with pacing). Theresults are reproduced from [60].
Fig. 36. Throughput as a function of the packet corruption rate, for data transfers between two DTNs connected by a 10 Gbps, 10 milliseconds path. Thecongestion control algorithms are BBR and HTCP. (a) Results for 1,500-byte MSS. (b) Result for 9,000-byte MSS. (c) BBR’s gain given by Eq. (6). (d) BBR’sgain focusing on low corruption rates.
section compares the performance of HTCP and BBR. HTCPis a representative loss-based congestion control algorithmused in high-speed networks [33], [118].
Fig. 36 shows the performance of BBR and HTCP for datatransfers between the two DTNs in Fig. 30(a). Switches 1and 2 have 8 MBs of memory for output-port buffers. Packetcorruption is introduced at rates ranging from 10−5 to 1%.Figs. 36(a) and 36(b) show the throughput obtained with1,500-byte and 9,000-byte MSSs respectively. Fig. 36(c) showsthe BBR’s gain with respect to HTCP, computed as
BBR’s gain = 100 · BBRT − HTCPT
HTCPT, (6)
where BBRT and HTCPT are the throughput of BBR andHTCP. Fig. 36(d) shows the same results as Fig. 36(c), butfocusing on the corruption range from 10−5 to 10−2. Thisinterval is relevant as HTCP’s throughput starts collapsing at acorruption rate of 10−4, and BBR’s throughput at a corruptionrate of 10−3.
Consider the case for 1,500-byte MSS, Fig. 36(a). At verylow corruption rates, BBR’s throughput is 2 to 3% lower thanthat of HTCP. As the corruption increases from 10−4 to 10−3,BBR’s gain increases up to 342% (see Fig. 36(d), red curve).Between corruption rates of 10−4 to 10−3, the throughputdecays rapidly for HTCP while BBR also experiences a less-severe decrease. Between corruption rates of 2 ·10−3 to 10−2,

CRICHIGNO et al.: COMPREHENSIVE TUTORIAL ON SCIENCE DMZ 2069
Fig. 37. Throughput comparison between Globus and SCP. The RTT is0.1 milliseconds in the LAN environment and 53 milliseconds in the WANenvironment.
the throughput is similar for both algorithms. At very highcorruption rates, the throughput collapses, independently ofthe congestion control algorithm. When the corruption rate isabove 10−3, rates are clearly not suitable for Science DMZs.
Consider now the case for 9,000-byte MSS, Fig. 36(b).Between corruption rates of 10−5 to 10−2, BBR and HTCPhave similar performance. However, when the corruption rateis 10−2, BBR’s gain suddenly increases by more than 2,000%(see Fig. 36(c)). Nevertheless, despite the better performanceof BBR, the throughput is low and inadequate for big datatransfers.
The above preliminary results indicate that BBR shows bet-ter performance than HTCP when packet losses occur. Inparticular, BBR is able to extend the range of corruption ratethat can be tolerated before the throughput collapses, as seenin Fig. 36(a).
C. Application-Layer Tools
1) Data-Transfer Tools: This section compares the disk-to-disk throughput of two data transfer tools: Globus andSCP. Globus is used in Science DMZ environments, whileSCP is used in enterprise environments. Globus uses the ser-vices of TCP, whereas SCP uses the services of SSH, whichimplements its own flow control process. Data transfers areperformed between the two DTNs shown in Fig. 30(a). TheMSS is 1,500 bytes.
Fig. 37 shows the evaluation results. The first scenario islabeled as LAN and the RTT is 0.1 milliseconds. The secondscenario is labeled as WAN and the RTT is 53 milliseconds.For SCP, the buffer size is 1 MB. Notice that this buffer sizeis greater than the bandwidth-delay product for the LAN sce-nario. Thus, the buffer size is not a limitation. However, thethroughput of Globus here is more than three times that ofSCP: 8.515 Gbps versus 2.532 Gbps. When the RTT increasesto 53 milliseconds, the throughput gap is further increased.Specifically, the throughput of Globus is now 8 Gbps (6%reduction) while that of SCP is 0.33 Gbps (87% reduction).These results reflect the negative impact on SCP’s through-put of adding an addition layer (SSH) with its correspondingoverhead and flow control, and the positive impact on Globus’throughput of incorporating features for big data transfers,such as parallel streams and large TCP buffers.
2) Parallel Streams: This section illustrates the impact ofparallel streams on data transfers conducted in the testbed of
Fig. 30(a). The RTT is 20 milliseconds and switches 1 and 2have 8 MBs of memory for output-port buffers.
Fig. 38 shows the throughput as a function of the corrup-tion rate. Consider Fig. 38(a) which shows the results when theMSS is 1,500 bytes. For small corruption rates, between 10−6
to 10−4, single-stream rates are between 6.4 and 4.8 Gbps.Adding parallel streams increases throughput substantially;with 13 streams, the throughput increases by almost 100%with respect to single-stream transfers, and attainable rates areup to 9.5 Gbps. The throughput obtained with 5 and 9 streamsis similar to that obtained with 13 streams. However, thethroughput degradation is accentuated as the corruption rateincreases above 10−4, independently of the number of streams.Still, notice that when parallel streams are used, the rates aresignificantly higher, until the corruption rate reaches 10−2.
Consider now Fig. 38(b) which shows the results for aMSS value of 9,000 bytes. Here, at low corruption rates, theperformance of single-stream and parallel-stream transfers aresimilar. Using jumbo frames helps attain faster recovery aftera packet loss, which adds robustness to single-stream trans-fers. However, as the corruption rate increases above 10−4,parallel-stream transfers outperform single-stream transfers.
3) Performance of Virtual DTNs: The use of virtualizationin Science DMZs has been low. However, as virtual com-ponents (e.g., virtual NICs, virtual switches) become morecapable of processing frames at 10 Gbps rates, the deploy-ment of virtual DTNs may be a viable alternative. Hence, thissection evaluates the performance of virtual DTNs.
Using the topology of Fig. 20, two scenarios are consid-ered: a) from the host 2 DTN to the virtual DTN located inhost 1 (virtual environment using VMware ESXi Hypervisor6.0 [119]), and b) from the host 2 DTN to the host 3 DTN(native environment). The physical switch has 8 MBs ofmemory for output-port buffering. The throughput betweenthe two native DTNs is labeled as native-native, while thatbetween a native DTN and the virtual DTN is labeled asnative-virtual. The path capacity is 10 Gbps and the virtualDTN uses a VMXNET3 virtual NIC [92].
The performance evaluation results capture the impact ofjitter, RTT, and MSS. Consider Fig. 39(a), which shows theresults when the MSS is 1,500 bytes. When jitter is addedinto the system, the penalty of using a virtual DTN is morepronounced. At 4 milliseconds RTT, the use of virtualiza-tion leads to a decrease in throughput of 26%, i.e., from9.25 Gbps (1 millisecond RTT) to 6.82 Gbps (4 millisecondsRTT). Meanwhile, the throughput using native DTNs is onlyreduced by 2.87% for the same RTT interval, from 9.41 Gbpsto 9.14 Gbps. The performance degradation is even larger at16 and 32 milliseconds RTT, since the processing overheadat the virtual DTN adds inefficiencies and consumes virtualCPU resources. For 32 milliseconds RTT, the number of in-flight packets is more than 26,000. Note that in the abovescenario, when jitter is present, some packets arrive out oforder, further decreasing throughput. When the sender receivesa triple duplicate ACK, a fast retransmission is triggered andthe congestion window is reduced by half. The estimated RTTmust also be recomputed and the TCP timers must be updatedaccordingly. A timer is associated with each unacknowledged
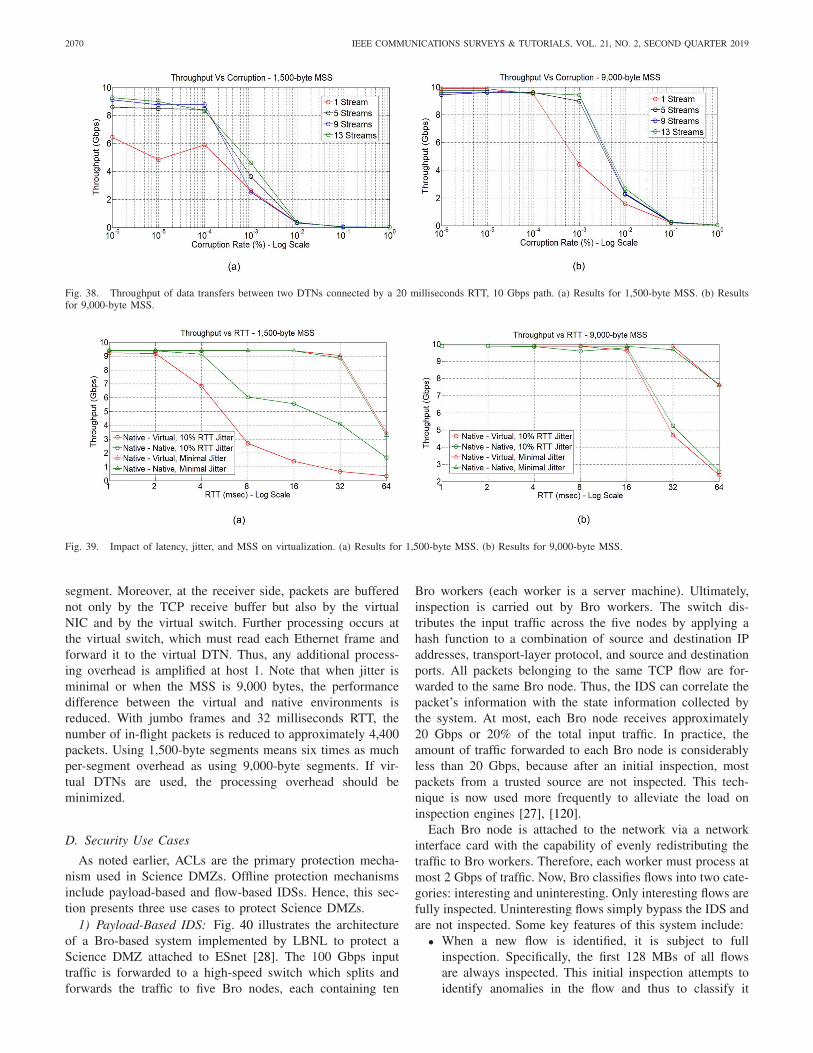
2070 IEEE COMMUNICATIONS SURVEYS & TUTORIALS, VOL. 21, NO. 2, SECOND QUARTER 2019
Fig. 38. Throughput of data transfers between two DTNs connected by a 20 milliseconds RTT, 10 Gbps path. (a) Results for 1,500-byte MSS. (b) Resultsfor 9,000-byte MSS.
Fig. 39. Impact of latency, jitter, and MSS on virtualization. (a) Results for 1,500-byte MSS. (b) Results for 9,000-byte MSS.
segment. Moreover, at the receiver side, packets are bufferednot only by the TCP receive buffer but also by the virtualNIC and by the virtual switch. Further processing occurs atthe virtual switch, which must read each Ethernet frame andforward it to the virtual DTN. Thus, any additional process-ing overhead is amplified at host 1. Note that when jitter isminimal or when the MSS is 9,000 bytes, the performancedifference between the virtual and native environments isreduced. With jumbo frames and 32 milliseconds RTT, thenumber of in-flight packets is reduced to approximately 4,400packets. Using 1,500-byte segments means six times as muchper-segment overhead as using 9,000-byte segments. If vir-tual DTNs are used, the processing overhead should beminimized.
D. Security Use Cases
As noted earlier, ACLs are the primary protection mecha-nism used in Science DMZs. Offline protection mechanismsinclude payload-based and flow-based IDSs. Hence, this sec-tion presents three use cases to protect Science DMZs.
1) Payload-Based IDS: Fig. 40 illustrates the architectureof a Bro-based system implemented by LBNL to protect aScience DMZ attached to ESnet [28]. The 100 Gbps inputtraffic is forwarded to a high-speed switch which splits andforwards the traffic to five Bro nodes, each containing ten
Bro workers (each worker is a server machine). Ultimately,inspection is carried out by Bro workers. The switch dis-tributes the input traffic across the five nodes by applying ahash function to a combination of source and destination IPaddresses, transport-layer protocol, and source and destinationports. All packets belonging to the same TCP flow are for-warded to the same Bro node. Thus, the IDS can correlate thepacket’s information with the state information collected bythe system. At most, each Bro node receives approximately20 Gbps or 20% of the total input traffic. In practice, theamount of traffic forwarded to each Bro node is considerablyless than 20 Gbps, because after an initial inspection, mostpackets from a trusted source are not inspected. This tech-nique is now used more frequently to alleviate the load oninspection engines [27], [120].
Each Bro node is attached to the network via a networkinterface card with the capability of evenly redistributing thetraffic to Bro workers. Therefore, each worker must process atmost 2 Gbps of traffic. Now, Bro classifies flows into two cate-gories: interesting and uninteresting. Only interesting flows arefully inspected. Uninteresting flows simply bypass the IDS andare not inspected. Some key features of this system include:
• When a new flow is identified, it is subject to fullinspection. Specifically, the first 128 MBs of all flowsare always inspected. This initial inspection attempts toidentify anomalies in the flow and thus to classify it

CRICHIGNO et al.: COMPREHENSIVE TUTORIAL ON SCIENCE DMZ 2071
Fig. 40. A Bro-based IDS [28].
Fig. 41. Data collected by a flow-based IDS at a small campus network.(a) Number of flows per five-minute unit. (b) Data collected per flow.(c) Remote devices connecting to the enterprise network sorted by the numberof flows.
as interesting. If no anomalies are detected, the flow isclassified as uninteresting.
• All TCP segments with their flag bits enabled (con-trol segments) are forwarded to the Bro cluster. Thesesegments may indicate a change in the state of the flow.
• A control channel is used to dynamically update the sta-tus of the flows. Once a flow is classified as uninteresting,Bro installs an ACL in the switch so that packets belong-ing to that flow are no longer forwarded to the Bro cluster(with the exception of the control segments).
According to [28], typically only 2-4 Gbps of traffic isinspected from the 100 Gbps input traffic, with occasionalpeaks of up to 25 Gbps.
2) Flow-Based IDS: A flow-based IDS is a more scalableoption than a payload-based IDS. A generic flow-based IDSis shown in Fig. 28(b). Fig. 41 shows typical information
Fig. 42. SciPass architecture. (a) Default behavior; packets are forwardedthrough the firewall. (b) Science flow being re-routed by the SDN controller.
collected by a flow-based IDS. Specifically, this example cor-responds to an IDS deployed to protect both the enterprisenetwork and Science DMZ at a small institution. Each pointin Fig. 41(a) is computed by aggregating five minutes of data.At any time except between 7:45-10:30, the number of flowsis less than 200. Fig. 41(b) shows the information collectedper flow, for the five-minute period between 8:30-8:35. Thecolumns pps and Bpp indicate the packets per second and thebytes per packet. The Src IP Addr and Src Pt are the IP addressand the port number of the device attempting to connect to thenetwork respectively. The column Flags indicates whether atleast one segment of the flow has already included a TCP seg-ment with the bit ACK (A), PUSH (P), RESET (R), SYN (S),and FIN (F) set. This column is important because it providesinformation about the state of the TCP connection. Finally,Fig. 40(c) shows external IP addresses generating flows, sortedby the number of flows (i.e., flows are aggregated based uponthe source IP address). The first entry is an example of adictionary attack from IP address 75.161.37.158 (3,385 flowscoming from this IP during a five-minute period). Aggregatingflows can certainly help identify cyberattacks. For example,during a data transfer operation, a collaborator’s DTN wouldonly have a few connections open to a DTN located inside theScience DMZ. Anomalies such as dictionary attacks, on thehand, open tens or hundreds of parallel connections, as seen inFig. 41(a). As a highly scalable technique, it is expected thatflow-based IDS will become a prevalent method for protectingScience DMZs.
3) SDN-Based Security: Software Defined Networking(SDN) [121] is increasingly being used to protect ScienceDMZs. An example of an SDN-based architecture isSciPass [122], which is illustrated in Fig. 42. SciPass con-sists of an SDN switch, an IDS, a controller, and a firewall.By default, all traffic is forwarded to the firewall, as shown inFig. 42(a). At the same time, a copy of the data traffic is sentto the IDS. Based on the security policy, the IDS determineswhether a flow is trusted to bypass the firewall. The IDS thensignals the SciPass controller, which generates new forwardingrules and downloads the new rules into the switch, as illus-trated in Fig 42(b). The new forwarding rules contain an idletimeout so that once the flow completes, the rules are purgedfrom the switch. By avoiding the firewall, the throughput ofthe science flows are dramatically improved.

2072 IEEE COMMUNICATIONS SURVEYS & TUTORIALS, VOL. 21, NO. 2, SECOND QUARTER 2019
The technique of allowing trusted flows to bypass secu-rity appliances is also increasingly being used in enterprisenetworks [120], [123]. This technique may use authentica-tion information. For example, a client DTN is typicallyrequired to authenticate against a server DTN prior to thedata transfer. Flows from an authenticated party could there-fore be considered as low-risk flows and bypass the securityappliances.
VIII. CHALLENGES AND OPEN RESEARCH ISSUES
Owing to its proven efficiency to move large data sets,the number of deployed Science DMZs has been rapidlyincreasing in the last few years. However, there are still manychallenges and open research issues that must be addressed.
A. Connectivity to the WAN
1) Cyberinfrastructure: The deployment cost of high-speedconnections is still an unresolved problem in developing coun-tries and many areas of developed countries. In the U.S.,this is observed in areas such as remote Native lands, wherethere is a lack of cyberinfrastructure for WAN connectivityat Gbps rates. The deployment of fiber connections and accessto POPs from such remote locations have prohibitive costs.As an example, in 2010, the U.S. Federal CommunicationsCommission (FCC) released the National Broadband Plan, aneffort to narrow the digital divide between urban and ruralareas. Some key problems that must be addressed include:
• Terrain. Historically, service providers have dismissed theprospect of installing cables in areas located in remote,mountainous regions with extreme variations in elevation.The process of digging and laying underground fiber inthese terrains is arduous, time-consuming, and expensive.Typically these areas are also far away from regionalnetworks, exchange points, RENs and Internet2.
• Regulations pose a unique set of challenges. Many devel-oping countries have only recently opened up to marketforces, from a totally centralized scheme. Similarly,sovereign tribal nations in the U.S. require telecommuni-cations providers to meet certain criteria to protect theland and culture, and most carriers are not interestedin complying with additional rules on top of the reg-ular bureaucracy. In developing countries and tribalnations, if a service provider is interested in laying fiber,it could see significant hurdles and consultations withlocal government. The provider would also have to per-form environmental protection and historic preservationstudies [124], [125].
• Cost. In rural areas with a limited potential subscriberbase, RENs and service providers in particular see nopossibility for any return on investment.
2) Connection-Oriented Networks: Since the early daysof the Internet, there have been two camps regarding theservice provided by the network layer: connectionless andconnection-oriented. The first one has adopted the end-to-endargument [126] that shaped the Internet. However, many partsof the Internet and RENs are evolving to connection-orientedservices as QoS becomes more important. For large data
transfers and as a means to connect Science DMZs, aconnection-oriented service provides bandwidth guarantee, akey advantage. An example of a connection-oriented serviceis the On-demand Secure Circuits and Reservation System(OSCARS) [127], [128], which connects WAN layer-2 cir-cuits directly to the DTNs and provides bandwidth reservationand traffic engineering capabilities. Similarly, MPLS is usedby large service providers, RENs, and Internet2 to provideQoS and establish long-term connections. Other connection-oriented schemes for bandwidth and delay guarantees havebeen also proposed [101], [129]. The adoption of connection-oriented technology to connect Science DMZs is expected tocontinue. Moreover, the wider adoption of this paradigm mayencourage further development of upper-layer protocols. Forexample, given a guaranteed bandwidth, congestion controlschemes based on pacing would be simpler to implement thancurrent TCP congestion control schemes.
B. Data-Link and Network-Layer Devices
1) Features for Large Flows: Typically, datacenter devicesare designed for low-latency networks. These devices have asmall amount of memory for buffering and use cut-throughand fabric designs that are only suitable for small flows.Additionally, even when a device has sufficient memory toaccommodate large flows, default configurations result inbuffer underutilization. Since the technical expertise of cyber-infrastructure engineers mostly focuses on enterprise networks,suboptimal configurations are not uncommon. Fortunately, themarket has recently noticed the need for Science DMZ-capabledevices. Hence, many manufacturers such as Cisco [21],Brocade [22], and Ciena [23] are now providing featuresamenable for large flows, such as adequate buffer allocationand application-programming interfaces to automate processesand enforce preset policies (e.g., bypassing a firewall accord-ing to traffic type or trust level).
2) Maximum Transmission Unit: The maximum segmentsize has notable performance impact in high-throughput, high-latency networks, in particular under random-loss regimes.Unfortunately, supporting end-to-end jumbo frames is stillan open challenge. Foremost, all hosts in a single broadcastdomain must use the same MTU, and this can be difficultand error-prone. Additionally, Ethernet has no mechanism ofdetecting an MTU mismatch. A device that receives a framelarger than its MTU simply drops it silently. Secondly, sincedifferent administrative domains (ISPs, RENs) are indepen-dently operated, packets are routed through devices that eitherdo not support jumbo frames or at best have different MTUs.Hence, there is a need to establish a standard for jumbo frames,so there is a reasonable guarantee that if vendors complywith the specifications, then there would be no interoperabilityproblems.
C. TCP Optimization
1) Congestion Control: Most TCP algorithms for con-gestion control use packet loss as a signal of congestion.According to Eq. (2), in order to achieve a throughput of10 Gbps, TCP can only tolerate one segment loss for every

CRICHIGNO et al.: COMPREHENSIVE TUTORIAL ON SCIENCE DMZ 2073
6,944,000,000 segments, which is incredibly small. The useof alternative congestion control mechanisms where packetloss is not a signal of congestion is a promising direction.The recently proposed BBR algorithm [24] has shown pre-liminary throughput improvement in medium- and high-losspacket regimes. Note that using TCP pacing to adjust thebit rate at an estimated bottleneck bandwidth is a departurefrom the traditional window-based congestion control mech-anism. Additionally, since rate-based congestion control doesnot require constant congestion window updates, this approachavoids the long delays inherent in the receiver sending thecongestion window. Moreover, the promising performanceresults of BBR may lead to the development of other conges-tion control algorithms. The use of parameters for detectingcongestion and random losses that have stronger correlationto congestion than packet losses also needs to be explored.
2) Pacing: TCP FQ pacing has shown promising results inlong fat networks. However, the main concern with this tech-nique is finding the bottleneck link along the path betweenthe end devices. Once the bottleneck link is identified, pac-ing packets at the bottleneck link’s capacity mitigates the TCPsawtooth behavior and produces stable throughput. Pacing canalso be easier in connection-oriented networks, as packetscan be paced at the guaranteed bandwidth allocated to theconnection.
3) TCP Extensions: Many TCP extensions have beenproposed over the years, including selective acknowledge-ment, timestamp, window scale, and RTT measurement [70].As most of these extensions were targeted to mitigate issuesobserved in the Internet’s best-effort service model, they maynot be suitable for large data transfers over well-conditionednetworks such as Internet2 and other RENs. Hence, investigat-ing the use of TCP extensions in Science DMZ environmentsis required.
D. Optimization in the Protocol Stack
As routers and switches are optimized for ScienceDMZs [21]–[23], the protocol stack at DTNs may becomethe bottleneck for many implementations. Reducing DTNprocessing overheads is desirable to increase throughput.
Software techniques can help optimize the TCPperformance on 10 Gbps WANs and above. However,optimizing a DTN to operate at 100 Gbps is currentlya persistent challenge. Most TCP implementations havea considerable overhead and produce a very high CPUutilization, which raises questions about the viability of TCPas the network bandwidth continues to grow [20]. UDP-basedtools such as Aspera FAST [86] and UDT [89] may suffer aperformance penalty due to context switching and the processof copying data to user-space buffers. Kissel et al. [20]have recently proposed a new protocol called wide-areaRemote Direct Memory Access (RDMA). RDMA decreasesTCP processing overheads by using optimization techniquessuch as zero-copy and splice. Zero-copy is a procedure thatrelieves the CPU of copying data from one memory area toanother (e.g., from lower-level layers to the TCP buffer). Thistechnique saves CPU cycles and memory bandwidth whentransmitting a file over a WAN. Similarly, splice is a system
call used to move data between two file descriptors. Spliceminimizes the movement of data between kernel space anduser space.
Overall, zero-copy and splice are two techniques that canminimize the movement of data within a DTN. Similar cross-layer optimization techniques can further reduce processingoverheads. For example, TCP and IP are usually implementedtogether, so that there is no need to copy the layer-3 payloadwhen moving it from the network process to the transportprocess. This idea can be extended to the upper layers, i.e.,from transport to application.
E. Applications
1) Data Transfer Tools: As the main applications used inScience DMZs, data transfer tools must be designed for high-throughput, high-latency networks. Namely, these tools shouldimplement features such as parallel streams, large buffer sizes,and partial and restartable file transfers. At present, engineersrely on rule of thumbs to configure many of these features.For example, there is no formal solution to the problem ofselecting the number of parallel TCP streams that shouldbe open for a data transfer. Globus suggests that the num-ber of streams should be between 2-8. Moreover, the optimalvalue may depend on the RTT, bandwidth, congestion controlalgorithm, etc.
Data transfer tools should minimize the time spent ininput/output operations (which are expensive) and exploit themulti-core capability of modern DTNs. For example, FDT [85]uses independent threads to read and write on physical devicesin parallel. Data transfer tools should also avoid copying datamultiple times within the DTN. Improvements may involveseveral layers, including transport and application.
The adoption of UDP-based data transfer applications hasbeen minimal. Tests conducted in 10 Gbps networks indicatethat the throughput is limited by the high CPU-utilization [91].Also, current UDP-based applications do not use parallelstreams. Instead, they only open one stream per data transfer.Typically, the stream’s process is tied to one core while othercores are idle. With this approach, UDP-based applicationsmay only achieve higher rates by increasing the CPU’s clockrate. However, increasing the CPU rate is a challenge. Instead,during the last decade, the throughput has been increased byusing multicore CPUs. Thus, an open research issue includesthe use of UDP-based applications using multiple streams, inparticular when parallelism opportunities exist [101], [127].
2) Monitoring Applications: The effectiveness of perf-SONAR in measuring end-to-end metrics and in detecting softfailures relies on its deployment across multiple domains [38].While perfSONAR has been extensively deployed on RENs(e.g., ESnet [3], Internet2 [40], GEANT [44], CESNET [130],etc.), its deployment by ISPs is still lacking. A contributingfactor here is the lack of familiarity of engineers who are morefamiliar with single-domain tools used in enterprise networks,such as SNMP, Syslog, and Netflow. Thus, there is a need tooutreach to the networking community to widen the adoptionof collaborative multi-domain tools without compromising theprivacy and commercial interests of ISPs.

2074 IEEE COMMUNICATIONS SURVEYS & TUTORIALS, VOL. 21, NO. 2, SECOND QUARTER 2019
Integrating and correlating data collected from differentapplications is an immediate research direction. For example,SNMP and perfSONAR complement each other. The formercan detect intra-domain hard failures while the latter can detectinter-domain soft failures. In this context, Gonzalez et al. [18]describe a monitoring application integrating perfSONAR,SNMP, and other tools. The proposed platform also integratesdata visualization and analytics modules. With the advent ofSDN, this type of integration and the addition of networkprogrammability are expected to continue.
3) Virtualization: The research community has been reluc-tant to adopt virtual components into Science DMZs, mainlybecause of the performance degradation of virtual DTNs.However, in small institutions where resources are oftenlimited, using virtual DTNs is a cost-efficient alternative.Preliminary results suggest that virtual DTNs may be ade-quate for 10 Gbps Science DMZs, provided the physical serverthey run on has sufficient CPU capacity and the workloadis minimal. However, when packet losses occur and DTNsrequire more processing capability for handling retransmis-sions, the performance degradation can be significant (seeFig. 39(a)). Additionally, virtual components are unable toperform at 40/100 Gbps. Thus, research on minimizing pro-cessing overheads on virtual devices (virtual switch, virtualNIC, hypervisor) is still required.
F. Security
In general, not having Web, email, and other general-purpose applications running on DTNs mitigates the deliveryof malicious payloads via XML, SQL, cross-site injection, andother methods. However, since transfer rates are high, the datainspection in Science DMZs may be minimal. For example,the typical inspection rate of a payload-based IDS protect-ing a 100 Gbps Science DMZ connected to ESnet is between2-4 Gbps [28], which is less than 5% of the total networkinput. While the reported number of malware attacks in currentScience DMZs has been minimal, there is a trade-off betweenperformance and security that should be carefully analyzedwhen deploying this type of IDS, in particular for 40/100 GbpsScience DMZs. A specific approach that can be explored forhigh rates may combine both flow-based and payload-basedIDSs. A first layer of detection may preselect suspicious flowsusing a flow-based IDS, while a second layer may scan packetsof the preselected flows using a payload-based IDS.
Confidentiality, integrity, and authentication are usuallyimplemented at the application layer. Although current encryp-tion algorithms are capable of performing at or near 10 Gbps,Globus’ file integrity checks may introduce a penalty of up to10%. Encryption rates of 40 and 100 Gbps are still uncom-mon in DTN deployments. However, recent development ofspecialized hardware indicates that a rate of 100 Gbps isachievable for in-transit encryption [131]. The use of med-ical Science DMZs [9], [10] and the need to comply withregulations [132], [133] are expected to accelerate these devel-opments. Finally, preventing DoS and scanning attacks isalso an ongoing research direction, as these attack types arecontinuously evolving.
IX. CONCLUSION
This article presents a comprehensive tutorial on ScienceDMZ. Motivated by the ever increasing science data produc-tion and by the need to transfer and manipulate it acrossWANs, the tutorial delves into every layer in the protocolstack, reviewing protocols and devices of a well-designedScience DMZ. At the cyberinfrastructure level, the need forhigh-speed connectivity and the alternatives for connecting toRENs and Internet2 are discussed. Transferring large flowsrequires routers and switches with appropriate buffer space.Important features of these devices are discussed, includingfabrics, rates, queues, and forwarding methods, which mustbe considered for successful deployments. Performance evalu-ations conducted in ESnet and in a laboratory testbed reinforcethe importance of having well-conditioned equipment whentransferring large flows.
At the transport layer, as data must be correctly deliveredfrom one device to another, the article examines TCP andits attributes including segment size, pacing, TCP extensions,flow control, and congestion control. These attributes playan important role in Science DMZs, as the end-to-end pathutilization and the throughput depend on them. At the appli-cation layer, Science DMZs are often limited to data transfertools and performance and security monitoring applications.Data transfer tools differ substantially from those used inenterprise networks. Important features such as partial trans-fer capability, parallel streams, and application buffer size canhave significant performance impact, in particular in scenarioswith random losses. Hence, these features should be incorpo-rated. Similarly, a performance measurement application suchas perfSONAR is necessary to monitor end-to-end paths overmultiple domains and to detect soft failures.
The article also describes advantages and disadvantages ofsecurity appliances and techniques, such as ACL, IPS, IDS,and related best practices to secure Science DMZs whileavoiding performance degradation. Finally, this article con-cludes by discussing open research issues that need furtherinvestigation.
ACKNOWLEDGMENT
The authors would like to acknowledge the ESnet teammembers for their contribution to this work. Namely,Jason Zurawski and Eli Dart suggested key changes andcorrections and provided material that is included in some sec-tions of this manuscript. Brian Tierney and Michael Smitasinare the authors of the results shown in Figs. 31 and 35 andgave valuable information related to these results. AashishSharma is a member of the team that developed the Bro-basedIDS shown in Fig. 40. He provided information included inSection VII-D1. The authors also would like to thank JohnGerdes from the University of South Carolina and John Hicksfrom Internet2 for their helpful advice on various technicalissues examined in this paper.
The authors are very grateful for the comprehensivereview conducted by the anonymous reviewers. Their sug-gestions and corrections helped improve the quality of thismanuscript.

CRICHIGNO et al.: COMPREHENSIVE TUTORIAL ON SCIENCE DMZ 2075
TABLE XIABBREVIATIONS USED IN THIS ARTICLE
REFERENCES
[1] D. McNichol, The Roads That Built America: The Incredible Story ofthe U.S. Interstate System. New York, NY, USA: Sterling, 2003.
[2] L. Farrell, “Science DMZ: The fast path for science data,” Sci. Node,May 2016. [Online]. Available: https://sciencenode.org/feature/science-dmz-a-data-highway-system.php
[3] The Energy Science Network. Accessed: Oct. 30, 2018. [Online].Available: https://www.es.net
[4] E. Dart, L. Rotman, B. Tierney, M. Hester, and J. Zurawski, “Thescience DMZ: A network design pattern for data-intensive science,” inProc. Int. Conf. High Perform. Comput. Netw. Stor. Anal., Denver, CO,USA, Nov. 2013, pp. 1–10.
[5] European Organization for Nuclear Research. Accessed: Oct. 30, 2018.[Online]. Available: https://home.cern/about/computing
[6] National Radio Astronomy Observatory. Accessed: Oct. 30, 2018.[Online]. Available: http://www.vla.nrao.edu/
[7] J. Bashor, General Atomics Remote Controls Fusion Experiments,Bridges Collaborators Using ESnet-Championed Technology,Lawrence Berkeley Nat. Lab., Energy Sci. Netw., Berkeley, CA,USA, Sep. 2015. [Online]. Available: https://es.net/news-and-publications/esnet-news/2015/science-dmz-fuels-fusion-research/
[8] J. Van Horn and A. W. Toga, “Human neuroimaging as a ‘big data’science,” J. Brain Imag. Behav., vol. 8, no. 2, pp. 323–331, Jun. 2014.
[9] S. Peisert et al., “The medical science DMZ: A network designpattern for data-intensive medical science,” J. Amer. Med. Inf. Assoc.,vol. 25, no. 3, pp. 267–274, Mar. 2018. [Online]. Available: https://academic.oup.com/jamia/article/doi/10.1093/jamia/ocx104/4367749/The-medical-science-DMZ-a-network-design-pattern

2076 IEEE COMMUNICATIONS SURVEYS & TUTORIALS, VOL. 21, NO. 2, SECOND QUARTER 2019
[10] S. Peisert et al., “The medical science DMZ,” J. Amer. Med. Inf. Assoc.,vol. 23, no. 6, pp. 1199–1201, May 2016.
[11] General Electric Health Care. Accessed: Oct. 30, 2018. [Online].Available: http://www3.gehealthcare.com/en/global_gateway
[12] G. Roberts, Big Data and the X-Ray Laser, SLAC Nat. AcceleratorLab., Symmetry Mag., Menlo Park, CA, USA, Jun. 2013.[Online]. Available: https://www.symmetrymagazine.org/article/june-2013/big-data-and-the-x-ray-laser
[13] SLAC National Accelerator Laboratory. Accessed: Oct. 30, 2018.[Online]. Available: https://www6.slac.stanford.edu/
[14] E. Waltz, “Portable DNA sequencer minion helps build the Internet ofLiving Things,” IEEE Spectr. Mag., Mar. 2016. [Online]. Available:https://spectrum.ieee.org/the-human-os/biomedical/devices/portable-dna-sequencer-minion-help-build-the-internet-of-living-things
[15] Nanopore Technologies. [Online]. Available: https://nanoporetech.com/[16] “A brief history of NSF and the Internet,” Nat. Sci. Found., Alexandria,
VA, USA, Fact Sheet, Aug. 2003. Accessed: Oct. 30, 2018. [Online].Available: https://www.nsf.gov/news/news_summ.jsp?cntn_id=103050
[17] National Science Foundation (NSF) Campus CyberinfrastructureProgram. Accessed: Oct. 30, 2018. [Online]. Available:https://www.nsf.gov/funding/pgm_summ.jsp?pims_id=504748
[18] A. Gonzalez et al., “Monitoring big data transfers over internationalresearch network connections,” in Proc. IEEE Int. Congr. Big Data,Jun. 2017, pp. 334–351.
[19] Z. Liu, P. Balaprakash, R. Kettimuthu, and I. Foster, “Explaining widearea data transfer performance,” in Proc. IEEE/ACM Int. Symp. HighPerform. Distrib. Comput. (HPDC), Jun. 2017, pp. 167–178.
[20] E. Kissel, M. Swany, B. Tierney, and E. Pouyoul, “Efficient wide areadata transfer protocols for 100 Gbps networks and beyond,” in Proc. 3rdInt. Workshop Netw. Aware Data Manag., Nov. 2013, Art. no. 3.
[21] “Event-based software-defined networking: Build a secure sci-ence DMZ,” Cisco Syst., San Jose, CA, USA, White Paper,2015. [Online]. Available: https://www.cisco.com/c/en/us/products/collateral/cloud-systems-management/open-sdn-controller/white-paper-c11-735868.html
[22] “Software-driven science DMZ networks,” Brocade, San Jose, CA,USA, White Paper, 2016. [Online]. Available: https://www.brocade.com/content/dam/common/documents/content-types/solution-brief/brocade-software-driven-science-dmz-networks-sb.pdf
[23] “Transform large-scale science collaboration,” Ciena, Hanover, MD,USA, White Paper. Accessed: Oct. 30, 2018. [Online]. Available:http://media.ciena.com/documents/Science+DMZ+AN.pdf
[24] N. Cardwell, Y. Cheng, C. S. Gunn, S. H. Yeganeh, and V. Jacobson,“BBR: Congestion-based congestion control,” Commun. ACM, vol. 60,no. 2, pp. 58–66, Feb. 2017.
[25] J. Crichigno, Z. Csibi, E. Bou-Harb, and N. Ghani, “Impact of seg-ment size and parallel streams on TCP BBR,” in Proc. IEEE Int. Conf.Telecommun. Signal Process., Athens, Greece, Jul. 2018, pp. 1–5.
[26] K. Chard, S. Tuecke, and I. Foster, “Globus: Recent enhancements andfuture plans,” in Proc. XSEDE16 Conf. Diversity Big Data Sci. Scale,Miami, FL, USA, Jul. 2016, Art. no. 27.
[27] “Processing of single stream large session (elephant flow) by thefirepower services,” Cisco Syst., San Jose, CA, USA, White Paper,Jan. 2017. [Online]. Available: https://www.cisco.com/c/en/us/support/docs/security/firepower-management-center/200420-Processing-of-Single-Stream-Large-Sessio.pdf
[28] V. Stoffer, A. Sharma, and J. Krous, “100G intrusion detection,”Lawrence Berkeley Nat. Lab., Berkeley, CA, USA, Rep., Aug. 2015.Accessed: Oct. 30, 2018. [Online]. Available: https://www.cspi.com/wp-content/uploads/2016/09/Berkeley-100GIntrusionDetection.pdf
[29] K. Roberts, Q. Zhuge, I. Monga, S. Gareau, and C. Laperle, “Beyond100 Gb/s: Capacity, flexibility, and network optimization,” J. Opt.Commun. Netw., vol. 9, no. 4, pp. C12–C23, Apr. 2017.
[30] J. Quittek, T. Zseby, B. Claise, and S. Zander, “Requirements forIP flow information export (IPFIX),” Internet Eng. Task Force,Fremont, CA, USA, RFC 3917, Jul. 2008. [Online]. Available:http://www.ietf.org/rfc/rfc3917.txt
[31] B. Claise, “Specification of the IP flow information export (IPFIX) pro-tocol for the exchange of IP traffic flow information,” Internet Eng. TaskForce, Fremont, CA, USA, RFC 5101, Jul. 2008. [Online]. Available:http://www.ietf.org/rfc/rfc5101.txt
[32] K. Fall and S. Floyd, “Simulation-based comparisons of Tahoe, Reno,and Sack TCP,” ACM SIGCOMM Comput. Commun. Rev., vol. 26,no. 3, pp. 5–21, Jul. 1996.
[33] D. J. Leith, R. N. Shorten, and Y. Lee, “H-TCP: A framework for con-gestion control in high-speed and long-distance networks,” HamiltonInst., Maynooth, Ireland, Rep., Aug. 2005. [Online]. Available:http://www.hamilton.ie/net/htcp2005.pdf
[34] M. Mathis, J. Semke, J. Mahdavi, and T. Ott, “The macroscopic behav-ior of the TCP congestion avoidance algorithm,” ACM SIGCOMMComput. Commun. Rev., vol. 27, no. 3, pp. 67–82, Jul. 1997.
[35] W. Allcock, J. Bresnahan, R. Kettimuthu, and M. Link, “The globusstriped gridFTP framework and server,” in Proc. ACM/IEEE Conf.Supercomput., Seattle, WA, USA, Nov. 2005, p. 54.
[36] B. Radic, V. Kajic, and E. Imamagic, “Optimization of data transferfor grid using gridFTP,” in Proc. Int. Conf. Inf. Technol. Interfaces,Cavtat, Croatia, Jun. 2008, pp. 709–715.
[37] J. Postel, “Transmission control protocol (TCP),” Internet Eng. TaskForce, Fremont, CA, USA, RFC 793, Sep. 1981. [Online]. Available:https://tools.ietf.org/html/rfc793
[38] J. Zurawski et al., “perfSONAR: On-board diagnostics for big data,” inProc. Workshop Big Data Sci. Infrastruct. Services, Oct. 2013, pp. 1–6.
[39] A. Hanemann et al., “perfSONAR: A service oriented architecture formulti-domain network monitoring,” in Proc. 3rd Int. Conf. ServiceOrient. Comput., Dec. 2005, pp. 241–254.
[40] Internet2. Accessed: Oct. 30, 2018. [Online]. Available:https://www.internet2.edu/
[41] B. Claise, “Cisco systems netflow services export version 9,” InternetEng. Task Force, Fremont, CA, USA, RFC 3954, Oct. 2004. [Online].Available: https://www.ietf.org/rfc/rfc3954.txt
[42] K. Miller. DDOS Mitigation With sFlow. Accessed: Oct. 30, 2018.[Online]. Available: http://www.rn.psu.edu/2014/07/25/ddos-mitigation-with-sflow/
[43] R. Hofstede, A. Pras, A. Sperotto, and G. D. Rodosek, “Flow-based compromise detection: Lessons learned,” IEEE Security Privacy,vol. 16, no. 1, pp. 82–89, Jan./Feb. 2018.
[44] F. Farina, P. Szegedi, and J. Sobieski, “GÉANT world testbed facility:Federated and distributed testbeds as a service facility of GÉANT,” inProc. Int. Tele Traffic Congr., Karlskrona, Sweden, Sep. 2014, pp. 1–6.
[45] Ubuntunet. Accessed: Oct. 30, 2018. [Online]. Available:https://ubuntunet.net/
[46] Asia Pacific Advanced Network. Accessed: Oct. 30, 2018. [Online].Available: https://apan.net/
[47] Red Clara Network. Accessed: Oct. 30, 2018. [Online]. Available:https://www.redclara.net/index.php/en/
[48] The Western Regional Network. Accessed: Oct. 30, 2018.[Online]. Available: http://nets.ucar.edu/nets/ongoing-activities/wrn/wrnroot/
[49] The Corporation for Education Network Initiatives in California.Accessed: Oct. 30, 2018. [Online]. Available: http://cenic.org
[50] K. Thompson, “Campus cyberinfrastructure,” in Proc. PrincipalInvestigators Workshop NSF Campus Cyberinfrastructure Program,Oct. 2016. [Online]. Available: https://www.thequilt.net/wp-content/uploads/CC_PIMeeting2016_KLT.pdf
[51] J. Moy, “Open shortest path first (OSPF) version 2,” Internet Eng. TaskForce, Fremont, CA, USA, RFC 2328, Apr. 1998. [Online]. Available:https://www.ietf.org/rfc/rfc2328.txt
[52] Y. Rekhter, T. Li, and S. Hares, “Border gateway protocol 4,” InternetEng. Task Force, Fremont, CA, USA, RFC 4271, Jan. 2006. [Online].Available: https://tools.ietf.org/html/rfc4271
[53] J. F. Kurose and K. W. Ross, Computer Networking: A Top-DownApproach, 7th ed. Boston, MA, USA: Pearson, 2017.
[54] Router/Switch Buffer Size Issues. Accessed: Oct. 30, 2018.[Online]. Available: https://fasterdata.es.net/network-tuning/router-switch-buffer-size-issues/
[55] C. Villamizar and C. Song, “High performance TCP in ANSNET,”ACM SIGCOMM Comput. Commun. Rev., vol. 24, no. 5, pp. 45–60,Oct. 1994.
[56] R. Bush and D. Meyer, “Some Internet architectural guidelines andphilosophy,” Internet Eng. Task Force, Fremont, CA, USA, RFC 3439,Dec. 2003. [Online]. Available: https://www.ietf.org/rfc/rfc3439.txt
[57] G. Appenzeller, I. Keslassy, and N. McKeown, “Sizing router buffers,”in Proc. Conf. Appl. Technol. Archit. Protocols Comput. Commun.,Portland, OR, USA, Oct. 2004, pp. 281–292.
[58] J. Padhye, V. Firoiu, D. Towsley, and J. Kurose, “Modeling TCPthroughput: A simple model and its empirical validation,” in Proc. ACMSIGCOMM Conf. Appl. Technol. Archit. Protocols Comput. Commun.,Vancouver, BC, Canada, Sep. 1998, pp. 303–314.
[59] M. Smitasin and B. Tierney, “Evaluating network buffersize requirements,” in Proc. Technol. Exchange Workshop,Oct. 2015. [Online]. Available: https://meetings.internet2.edu/media/medialibrary/2015/10/05/20151005-smitasin-buffersize.pdf
[60] B. Tierney, “Improving performance of 40G/100G data trans-fer nodes,” in Proc. Technol. Exchange Workshop, Sep. 2016.[Online]. Available: https://meetings.internet2.edu/2016-technology-exchange/detail/10004333/

CRICHIGNO et al.: COMPREHENSIVE TUTORIAL ON SCIENCE DMZ 2077
[61] V. Paxson and S. Floyd, “Wide area traffic: The failure of Poissonmodeling,” IEEE/ACM Trans. Netw., vol. 3, no. 3, pp. 226–244,Jun. 1995.
[62] N. Beheshti et al., “Optical packet buffers for backbone Internetrouters,” IEEE/ACM Trans. Netw., vol. 18, no. 5, pp. 1599–1609,Oct. 2010.
[63] V. G. Cerf, “Bufferbloat and other Internet challenges,” IEEE InternetComput., vol. 18, no. 5, p. 80, Sep./Oct. 2014.
[64] H. Im, C. Joo, T. Lee, and S. Bahk, “Receiver-side TCP countermea-sure to bufferbloat in wireless access networks,” IEEE Trans. MobileComput., vol. 15, no. 8, pp. 2080–2093, Aug. 2016.
[65] K. Nichols, V. Jacobson, A. McGregor, and J. Iyengar, “Controlleddelay active queue management,” Internet Eng. Task Force, Fremont,CA, USA, Internet Draft draft-ietf-aqm-codel-10, Oct. 2017. [Online].Available: https://tools.ietf.org/html/draft-ietf-aqm-codel-10
[66] Linux Tuning. Accessed: Oct. 30, 2018. [Online]. Available:https://fasterdata.es.net/host-tuning/linux/
[67] “Cisco catalyst 6500 supervisor 2T architecture white paper,” CiscoSyst., San Jose, CA, USA, White Paper, Jan. 2017. [Online]. Available:https://www.cisco.com/c/en/us/products/collateral/switches/catalyst-6500-series-switches/white_paper_c11-676346.html#_Toc390815326
[68] N. McKeown, A. Mekkittikul, V. Anantharam, and J. Walrand,“Achieving 100% throughput in an input-queued switch,” IEEE Trans.Commun., vol. 47, no. 8, pp. 1260–1267, Aug. 1999.
[69] G. Vardoyan, R. Kettimuthu, M. Link, and S. Tuecke, “Characterizingthroughput bottlenecks for secure gridFTP transfers,” in Proc. IEEEInt. Conf. Comput. Netw. Commun. (ICNC), San Diego, CA, USA,Jan. 2013, pp. 861–866.
[70] D. Borman, B. Braden, V. Jacobson, and R. Scheffenegger,“TCP extensions for high performance,” Internet Eng. Task Force,Fremont, CA, USA, RFC 7323, Sep. 2014. [Online]. Available:https://tools.ietf.org/html/rfc7323#section-4.2
[71] N. Mills, F. A. Feltus, and W. B. Ligon, III, “Maximizing theperformance of scientific data transfer by optimizing the interfacebetween parallel file systems and advanced research networks,” J.Future Gener. Comput. Syst., vol. 79, pp. 190–198, Feb. 2018. [Online].Available: https://doi.org/10.1016/j.future.2017.04.030
[72] F. A. Feltus et al., “The widening gulf between genomics datageneration and consumption: A practical guide to big data transfertechnology,” J. Bioinformat. Biol. Insights, vol. 9, no. 1, pp. 9–19,Sep. 2015.
[73] T. J. Hacker, B. D. Athey, and B. Noble, “The end-to-end performanceeffects of parallel TCP sockets on a lossy wide-area network,” in Proc.Parallel Distrib. Process. Symp., Apr. 2001, p. 10.
[74] A. Aggarwal, S. Savage, and T. Anderson, “Understanding theperformance of TCP pacing,” in Proc. Int. Conf. Comput. Commun.(INFOCOM), Mar. 2000, pp. 1157–1165.
[75] N. Hanford, B. Tierney, and D. Ghosal, “Optimizing data transfer nodesusing packet pacing,” in Proc. Workshop Innov. Netw. Data-IntensiveSci., Nov. 2015, pp. 1–8.
[76] M. Ghobadi and Y. Ganjali, “TCP pacing in data center networks,”in Proc. IEEE Ann. Symp. High Perform. Interconnects (HOTI),Aug. 2013, pp. 25–32.
[77] The Centos Project. Accessed: Oct. 30, 2018. [Online]. Available:https://www.centos.org/
[78] TSO Sizing and the FQ Scheduler. Accessed: Oct. 30, 2018. [Online].Available: https://lwn.net/Articles/564978/
[79] I. Rhee and L. Xu, “CUBIC: A new TCP-friendly high-speed TCPvariant,” ACM SIGOPS Oper. Syst. Rev., vol. 42, no. 5, pp. 64–74,Jul. 2008.
[80] T. Dierks and E. Rescorla, “The transport layer security (TLS) protocolversion 1.2,” Internet Eng. Task Force, Fremont, CA, USA, RFC 5246,Aug. 2008. [Online]. Available: https://tools.ietf.org/html/rfc5246
[81] A. Freier, P. Karlton, and P. Kocher, “The secure sockets layer protocolversion 3.0,” Internet Eng. Task Force, Fremont, CA, USA, RFC 6101,Aug. 2011. [Online]. Available: https://tools.ietf.org/html/rfc6101
[82] J. Postel and J. Reynolds, “File transfer protocol,” Internet Eng. TaskForce, Fremont, CA, USA, RFC 959, Oct. 1985. [Online]. Available:https://tools.ietf.org/html/rfc959
[83] T. Ylonen and C. Lonvick, “The secure shell (SSH) connection pro-tocol,” Internet Eng. Task Force, Fremont, CA, USA, RFC 4254,Jan. 2006. [Online]. Available: https://tools.ietf.org/html/rfc4254
[84] L. Zhang, W. Wu, P. DeMar, and E. Pouyoul, “mdtmFTP andits evaluation on ESNET SDN testbed,” Future Gener. Comput.Syst., vol. 79, pp. 199–204, Feb. 2018. [Online]. Available:https://doi.org/10.1016/j.future.2017.04.024
[85] Fast Data Transfer (FDT). Accessed: Oct. 30, 2018. [Online].Available: http://monalisa.cern.ch/FDT
[86] “Ultra high-speed transport technology,” Emeryville, CA, USA,Aspera, White Paper. Accessed: Oct. 30, 2018. [Online]. Available:http://asperasoft.com/resources/white-papers/ultra-high-speed-transport-technology/
[87] High-End Computing Capability Using BBFTP for Remote FileTransfers. Accessed: Oct. 30, 2018. [Online]. Available: https://www.nas.nasa.gov/hecc/support/kb/using-bbftp-for-remote-file-transfers_147.html
[88] “Expedata, a multipurpose transaction protocol,” Norman, OK,USA, Expedat, White Paper, Jan. 2017. [Online]. Available:http://www.dataexpedition.com/expedat/Docs/
[89] Y. Gu and R. L. Grossman, “UDT: UDP-based data transfer forhigh-speed wide area networks,” Comput. Netw., vol. 51, no. 7,pp. 1777–1799, May 2007.
[90] D. V. Bernardo and D. B. Hoang, “Empirical survey: Experimentationand implementations of high speed protocol data transfer for grid,” inProc. IEEE Int. Conf. Adv. Inf. Netw. Appl. Workshops, Mar. 2011,pp. 335–340.
[91] UDP Tuning in Science DMZs. Accessed: Oct. 30, 2018. [Online].Available: https://fasterdata.es.net/network-tuning/udp-tuning/#toc-anchor-1
[92] “Performance evaluation of VMXNET3 virtual network device,”VMware, Palo Alto, CA, USA, Rep. Accessed: Oct. 30, 2018. [Online].Available: https://www.vmware.com/pdf/vsp_4_vmxnet3_perf.pdf
[93] D. Levi, P. Meyer, and B. Stewart, “Simple network manage-ment protocol (SNMP) applications,” Internet Eng. Task Force,Fremont, CA, USA, RFC 3413, Dec. 2002. [Online]. Available:https://tools.ietf.org/html/rfc3413
[94] C. Lonvick, “The BSD Syslog protocol,” Internet Eng. Task Force,Fremont, CA, USA, RFC 3164, Aug. 2001. [Online]. Available:https://www.ietf.org/rfc/rfc3164.txt
[95] jq Command-Line JSON Processor. Accessed: Oct. 30, 2018. [Online].Available https://stedolan.github.io/jq/
[96] T. Bray, “The JavaScript object notation (JSON) data interchangeformat,” Internet Eng. Task Force, Fremont, CA, USA, RFC 7159,Mar. 2014. [Online]. Available: https://tools.ietf.org/html/rfc7159
[97] S. Hemminger, “Network emulation with NetEm,” in Proc. Australia’sNat. Linux Conf., Apr. 2005, pp. 18–93.
[98] iPerf3. Accessed: Oct. 30, 2018. [Online]. Available:http://software.es.net/iperf/
[99] R. Mijumbi et al., “Network function virtualization: State-of-the-artand research challenges,” IEEE Commun. Surveys Tuts., vol. 18, no. 1,pp. 236–262, 1st Quart., 2016.
[100] M. Mahalingam et al., “Virtual extensible local area network(VXLAN): A framework for overlaying virtualized layer 2 networksover layer 3 networks,” Internet Eng. Task Force, Fremont, CA, USA,RFC 7348, Aug. 2014.
[101] T. Orawiwattanakul, H. Otsuki, E. Kawai, and S. Shimojo, “Multipleclasses of service provisioning with bandwidth and delay guaranteesin dynamic circuit network,” in Proc. IEEE Int. Symp. Integr. Netw.Manag., May 2015, pp. 475–483.
[102] E. Rosen, A. Viswanathan, and R. Callon, “Multiprotocollabel switching architecture,” Internet Eng. Task Force,Fremont, CA, USA, RFC 3031, Jan. 2001. [Online]. Available:https://tools.ietf.org/html/rfc3031.txt
[103] “Building scalable Syslog management solutions,” San Jose, CA, USA,Cisco, White Paper, 2009. [Online]. Available: https://www.cisco.com/c/en/us/products/collateral/services/high-availability/white_paper_c11-557812.html#wp9000392
[104] K. Johnson and T. DeLaGrange, “SANS survey on mobility/BYODsecurity policies and practices,” North Bethesda, MD, USA, SANS,White Paper, Oct. 2012. [Online]. Available: https://www.sans.org/reading-room/whitepapers/analyst/survey-mobility-byod-security-policies-practices-35175
[105] “Cisco Nexus 3100 platform switch architecture,” San Jose, CA,USA, Cisco Systems, White Paper, Oct. 2013. [Online]. Available:https://people.ucsc.edu/∼warner/Bufs/cisco-3100-arch.pdf
[106] Brown University (Firewall) Example. Accessed: Oct. 30, 2018.[Online]. Available: https://fasterdata.es.net/performance-testing/perfsonar/perfsonar-success-stories/brown-university-example/
[107] “Cisco firepower NGIPS,” Data Sheet, Cisco Syst., San Jose,CA, USA, 2017. [Online]. Available: https://www.cisco.com/c/en/us/products/collateral/security/ngips/datasheet-c78-738196.html
[108] Snort Open Source Intrusion Prevention System. Accessed:Oct. 30, 2018. [Online]. Available: https://www.snort.org/

2078 IEEE COMMUNICATIONS SURVEYS & TUTORIALS, VOL. 21, NO. 2, SECOND QUARTER 2019
[109] A. Sperotto et al., “An overview of IP flow-based intrusion detection,”IEEE Commun. Surveys Tuts., vol. 12, no. 3, pp. 343–356, 3rd Quart.,2010.
[110] R. Hofstede et al., “Flow monitoring explained: From packet captureto data analysis with NetFlow and IPFIX,” IEEE Commun. SurveysTuts., vol. 16, no. 4, pp. 2037–2064, 4th Quart., 2014.
[111] The Bro Network Security Monitor. Accessed: Oct. 30, 2018. [Online].Available: http://www.broids.org
[112] W. Kumari and D. McPherson, “Remote triggered black hole filter-ing with unicast reverse path forwarding (uRPF),” Internet Eng. TaskForce, Fremont, CA, USA, RFC 5635, Aug. 2009. [Online]. Available:https://tools.ietf.org/html/rfc5635
[113] N. Pho et al., “Data transfer in a science DMZ using SDN withapplications for precision medicine in cloud and high-performancecomputing,” in Proc. Int. Conf. High Perform. Comput. Netw. StorageAnal. (SC15), Nov. 2015, pp. 1–4.
[114] D. Hardt, “The OAuth 2.0 authorization framework,” Internet Eng. TaskForce, Fremont, CA, USA, RFC 6749, Oct. 2012. [Online]. Available:https://tools.ietf.org/html/rfc6749
[115] S. Kent and S. Seo, “Security architecture for the Internet protocol,”Internet Eng. Task Force, Fremont, CA, USA, RFC 4301, Dec. 2005.[Online]. Available: https://tools.ietf.org/html/rfc4301
[116] “MX960, MX480, MX240, MX104 and MX80 3D univer-sal edge routers,” Data Sheet, Juniper Netw., Sunnyvale, CA,USA, 2018. [Online]. Available: http://www.juniper.net/assets/us/en/local/pdf/datasheets/1000597-en.pdf
[117] “Cisco Nexus 3172PQ, 3172TQ, 3172TQ-32T, 3172PQ-XL, and3172TQ-XL switches,” Data Sheets, Cisco Syst., San Jose, CA,USA, Jan. 2017. [Online]. Available: https://www.cisco.com/c/en/us/products/collateral/switches/nexus-3000-series-switches/data_sheet_c78-729483.html
[118] Y.-T. Li, D. Leith, and R. Shorten, “Experimental evaluation of TCPprotocols for high-speed networks,” IEEE/ACM Trans. Netw., vol. 15,no. 5, pp. 1109–1122, Oct. 2007.
[119] VMware ESXI. Accessed: Oct. 30, 2018. [Online]. Available:https://www.vmware.com/products/esxi-and-esx.html
[120] J. Crichigno et al., “Optimal traffic scheduling for intrusion preventionsystems,” Int. J. Adv. Telecommun. Electrotechn. Signals Syst., vol. 6,no. 2, pp. 1–4, 2017.
[121] D. Kreutz et al., “Software-defined networking: A comprehensivesurvey,” Proc. IEEE, vol. 103, no. 1, pp. 14–76, Jan. 2015.
[122] E. Balas and A. Ragusa, “SciPass: A 100Gbps capable secure scienceDMZ using OpenFlow and Bro,” in Proc. Technol. Exchange Conf.,Oct. 2014, pp. 73–79.
[123] J. Crichigno and N. Ghani, “A linear programming scheme for IPS traf-fic scheduling,” in Proc. IEEE Int. Conf. Telecommun. Signal Process.(TSP), Jul. 2015, pp. 16–20.
[124] J. Tveten, On American Indian Reservations, Challenges Perpetuatethe Digital Divide, ARS Technica, Jan. 2016. [Online]. Available:https://arstechnica.com
[125] N. Sambuli, “Challenges and opportunities for advancing Internetaccess in developing countries while upholding net neutrality,” J. CyberPolicy, vol. 1, no. 1, pp. 61–74, May 2016.
[126] J. Saltzer, D. Reed, and D. Clark, “End-to-end argument in systemdesign,” ACM Trans. Comput. Syst., vol. 2, no. 4, pp. 277–288,Nov. 1984.
[127] J. M. Plante, D. A. P. Davis, and V. M. Vokkarane, “Parallel circuitprovisioning in ESnet’s OSCARS,” in Proc. IEEE Int. Conf. Adv. Netw.Telecommun. Syst. (ANTS), Dec. 2014, pp. 1–6.
[128] I. Monga, C. Guok, W. E. Johnston, and B. Tierney, “Hybrid networks:Lessons learned and future challenges based on ESnet4 experience,”IEEE Commun. Mag., vol. 49, no. 5, pp. 114–121, May 2011.
[129] A. Gumaste, T. Das, K. Khandwala, and I. Monga, “Network hard-ware virtualization for application provisioning in core networks,” IEEECommun. Mag., vol. 55, no. 2, pp. 152–159, Feb. 2017.
[130] K. Slavicek, V. Novak, and J. Ledvinka, “CESNET fiber optics trans-port network,” in Proc. IEEE Int. Conf. Netw., Mar. 2009, pp. 403–408.
[131] Transpacific Encryption Success at 100Gbps, Ericsson, Stockholm,Sweden, Sep. 2017. [Online]. Available: https://www.ericsson.com/en/press-releases/2017/9/transpacific-encryption-success-at-100gbps
[132] W.-B. Lee and C.-D. Lee, “A cryptographic key management solu-tion for HIPAA privacy/security regulations,” IEEE Trans. Inf. Technol.Biomed., vol. 12, no. 1, pp. 34–41, Jan. 2008
[133] M. A. Alyami and Y.-T. Song, “Removing barriers in using personalhealth record systems,” in Proc. IEEE Int. Conf. Comput. Inf. Sci.(ICIS), Jun. 2016, pp. 1–8.
Jorge Crichigno received the Ph.D. degree incomputer engineering from the University ofNew Mexico, Albuquerque, USA. He is anAssociate Professor with the Integrated InformationTechnology Department, College of Engineeringand Computing, University of South Carolina. Hehas also been a Research Associate with theElectrical Engineering Department, University ofSouth Florida since 2016. His current researchinterests are in the areas of network and proto-col optimization for high-throughput high-latency
systems, and Internet measurements for cyber security. He has served asa Reviewer and a TPC Member of journals and conferences, such as theIEEE TRANSACTIONS ON MOBILE COMPUTING and IEEE Globecom, andas a panelist for the National Science Foundation. He is an ABET Evaluatorrepresenting the IEEE.
Elias Bou-Harb received the Ph.D. degree in com-puter science from Concordia University, Montreal,Canada. He was a Visiting Research Scientist withCarnegie Mellon University, Pittsburgh, PA, USA,in 2015 and 2016. He is currently an AssistantProfessor with the Computer Science Department,Florida Atlantic University. He is also a ResearchScientist with National Cyber Forensic and TrainingAlliance, Canada. His current research interests arein the areas of cyber security, big data analytics,data-driven digital forensics, Internet measurements
for cyber security, and cyber security for critical infrastructure.
Nasir Ghani received the Ph.D. degree in electri-cal engineering from the University of Waterloo,Canada. He was the Associate Chair of the Electricaland Computer Engineering Department, Universityof New Mexico from 2007 to 2013, and aFaculty Member with Tennessee Tech Universityfrom 2003 to 2007. He is a Professor with theElectrical Engineering Department, University ofSouth Florida and a Research Liaison for CyberFlorida, a state-funded center focusing on cyber-security research, education, and outreach. He has
also spent several years working in industry at large blue chip organiza-tions (IBM, Motorola, and Nokia) and several hi-tech startups. His researchinterests include cyberinfrastructure networks, cybersecurity, cloud computing,disaster recovery, and IoT/cyberphysical systems. He has published over 230peer-reviewed articles and has several highly cited U.S. patents. He has alsoserved as an Associate Editor for various journals, including the IEEE/OSAJOURNAL OF OPTICAL AND COMMUNICATIONS AND NETWORKING, IEEESYSTEMS, and IEEE COMMUNICATIONS LETTERS. He has also guest-editedspecial issues of IEEE NETWORK and IEEE Communications Magazine andhas organized and chaired symposia and workshops for numerous flagshipIEEE conferences, such as IEEE Globecom, IEEE ICC, IEEE Infocom, andIEEE ICCCN. He was also the Chair of the IEEE Technical Committee onHigh Speed Networking from 2007 to 2010.