a comprehensive review of the waste sector in mozambique
TRANSCRIPT

A Comprehensive Review of the Municipal Solid Waste Sector in Mozambique Background Documentation for the Formulation of Nationally Appropriate Mitigation Actions in the Waste Sector in Mozambique
Maputo, Nairobi, June 2014

2
Prepared by: Carbon Africa Limited Limited P.O. Box 14938 Nairobi, Kenya Tel: Email: [email protected] Website: www.carbonafrica.co.ke
Associação Moçambicana de Reciclagem Av. Julius Nyerere 6865, Hulene Maputo, Mozambique Tel: +258 82 28 090 44 Email: info.amor.co.mz Website: www.amor.co.mz
Authors Adriaan Tas, Antoine Belon Photo credit Associação Moçambicana de Reciclagem © Carbon Africa Limited
Disclaimer
This report has been prepared in the context of an assignment by the Climate Change Service of the Belgium Federal Government in consultation with the government of Mozambique. The findings are the result of fieldwork and literature research by the authors and are meant to serve as a basis for further discussion with the different stakeholders in the municipal waste sector.
The views and opinions expressed in this publication are those of the authors and do not reflect the opinion or views of any other party.
Results and facts have been gathered and cross-checked at the best of our ability. This document will not be updated to address changes in Mozambique such as applicable laws and regulations. Each user of this document is solely responsible for using the contents of this document and verifying its status and applicability.
3
Abbreviations
AFD – Agence Française de Développement - French Development Agency
AGRESU – Apoio a Gestão de Resíduos Sólidos Urbanos na Área de Grande Maputo - Assistance
in Solid Waste Management in the Greater Maputo Area
ALMA – Associação de Limpeza e Meio-Ambiente – Cleaning and Environment Association
AMOR – Associação Moçambicana de Reciclagem – Mozambican Association for Recycling
CCS – Centro Cooperazione Sviluppo
CDM – Clean Development Mechanism
COMSOL – Cooperativa de Maputo para Soluções Ambientais – Cooperative of Maputo for
Environmental Solutions
COP – Conference of the Parties to the UNFCCC
FRELIMO – Frente de Libertação de Moçambique
GHG – Greenhouse gas
GiZ – Gesellschaft für Internationale Zusammenarbeit – German Agency for International
Cooperation
HDP – High Density Polyethylene
INE – Instituto Nacional de Estádisticas – National Institute for Statistics
JICA – Japan International Cooperation Agency
MDM – Movimento Democrático de Moçambique – Democratic Movement of Mozambique
MICOA – Ministerio para a Coordenação da Acção Ambiental – Ministry for the Coordination of
Environmental Action
MISAU – Ministerio da Saúde - Ministry of Health
MRV – Monitoring, Reporting and Verification
MSW – Municipal Solid Waste
NAMA – Nationally Appropriate Mitigation Action
NGO – Non-Governmental Organization
NSCCAM – National Strategy for Climate Change Adaptation and Mitigation
PARPA – Plano para Acção a Redução da Pobreza Absoluta – Poverty Reduction Action Plan
PDA – Programa de Desenvolvimento Autarquico – Local Authorities Development Program
PET – Polyethylene terephthalate
PNA – Politica Nacional do Ambiente – National Environment Policy
POA- Programme of Activities
REDD – Reducing Emissions from Deforestation and Forest Degradation
SWDS – Solid Waste Disposal Site
4
SWM – Solid Waste Management
UNFCCC – United Nations Framework Convention on Climate Change
USW – Urban Solid Waste
WWF – World Wide Fund for Nature

5
Acknowledgments
The preparation of the report was the result of a collaborative effort by many individuals and institutions. The project was co-funded by the Climate Change Service of the Belgium Federal Government and Carbon Africa Limited. The Mozambican Association for Recycling (AMOR) also provided important support to the realization of this report.
The authors would like to thank the following people for their helpful inputs and comments: Barbara Bale, Camille Laude (Consultant), Clive Best (Director of Pagalata Limitada), Elijah Isabu (Carbon Africa Limited), Elizabeth Mwangi (Carbon Africa Limited), João Mucavele (Director da Salubridade, Municipality of Maputo), Mr. Manhanga (Director da Salubridade, Municipality of Beira), Max Armbrust (Carbon Africa (M) Limitada), Flore Roura (Director Terra Nova Limitada) Stéphane Temperman (President of AMOR), Tiffany Haye and the entire ESSOR-DAUPU team.

6
Table of Contents
Abbreviations ............................................................................................................. 3
Acknowledgments ...................................................................................................... 5
Table of Contents ....................................................................................................... 6
Executive Summary .................................................................................................... 9
Map of Mozambique ................................................................................................ 11
Introduction ............................................................................................................. 12
1 The Waste Sector ............................................................................................... 13 1.1 General Overview ................................................................................................... 13 1.2 Waste Production ................................................................................................... 14 1.3 Waste Collection..................................................................................................... 16 1.4 Waste Treatment and Final Disposal ....................................................................... 17 1.5 Current Situation of Sanitary Landfills in the Mozambican Waste Sector .................. 18 1.6 Cost Recuperation and Economic Instruments ......................................................... 20
2 Recycling and the Waste Value Chain in Mozambique ......................................... 21 2.1 Recycling Chain and Focus ....................................................................................... 21 2.2 Re-use and Recycling in Mozambique ...................................................................... 22
2.2.1 Re-use Culture in Mozambique ................................................................................. 22 2.2.2 Recycling in Mozambique - General Overview .......................................................... 23 2.2.3 Recycling Actors - Processing Actors ......................................................................... 23 2.2.4 Organizations Promoting Recycling in Mozambique ................................................. 24
3 Legal Framework and Policies ............................................................................. 26 3.1 International Framework ........................................................................................ 26 3.2 National Framework ............................................................................................... 26
3.2.1 Constitution of Mozambique (2004) ......................................................................... 26 3.2.2 National Environment Policy (Política Nacional do Ambiente - PNA) ....................... 26 3.2.3 The Environment Act (Lei do Ambiente) - Law 20/97 of October 1st ......................... 26 3.2.4 Solid Waste Management Regulations (Decree 13/2006 of June 15th) .................... 27
3.3 Local Level .............................................................................................................. 27 3.3.1 Law of Local Government (Lei das Autarquias Locais known as LAL) - Law 2/97 of February 18th .......................................................................................................................... 27 3.3.2 Finance Act and Municipal Heritage - Law 11/97 of May 31..................................... 28
3.4 National Priorities, Policies, Strategies and Technical Assistance .............................. 29 3.4.1 Strategy for Integrated Municipal Solid Waste Management in Mozambique ........ 29 3.4.2 Poverty Reduction Action Plan - PARPA .................................................................... 31 3.4.3 International Cooperation and Technical Assistance ................................................ 31 3.4.4 National Strategy for Climate Change Adaptation and Mitigation (NSCCAM) 2013-2025 32
3.5 Summary of the main legislation ............................................................................. 33
4 Case Studies ....................................................................................................... 34 4.1 Maputo .................................................................................................................. 34
4.1.1 Overview .................................................................................................................... 34 4.1.2 Collection ................................................................................................................... 34 4.1.3 Technical Assistance .................................................................................................. 35 4.1.4 Waste Composition ................................................................................................... 35

7
4.1.5 Re-use and Recycling ................................................................................................. 36 4.1.6 Economic Instruments ............................................................................................... 36 4.1.7 Current Dumpsites and Landfill ................................................................................. 37 4.1.8 New Landfill and Closing of Hulene ........................................................................... 38
4.2 Beira ...................................................................................................................... 38 4.2.1 Overview .................................................................................................................... 38 4.2.2 Waste Production and Collection .............................................................................. 38 4.2.3 Waste Transport ........................................................................................................ 39 4.2.4 Dumping Site ............................................................................................................. 39 4.2.5 Recycling in Beira - The Case of Terra Nova .............................................................. 40 4.2.6 Beira Municipality’s Features .................................................................................... 40
4.3 Vilankulo ................................................................................................................ 40 4.3.1 Overview .................................................................................................................... 40 4.3.2 Current Situation ....................................................................................................... 41 4.3.3 Recycling .................................................................................................................... 41
5 Emissions from the Waste Sector ........................................................................ 43 5.1 A global overview of emissions from the waste sector ............................................. 43 5.2 Reported Emissions from the Waste Sector in Eastern and Southern Africa .............. 45 5.3 Emissions from municipal solid waste in Mozambique ............................................. 47
5.3.1 Methodology ............................................................................................................. 47 5.3.2 Activity data ............................................................................................................... 47 5.3.3 Emission factors and other parameters .................................................................... 49 5.3.4 Results and uncertainties .......................................................................................... 53
6 Waste Treatment Options and Opportunities in Mozambique ............................. 56 6.1 Sanitary landfills with methane recovery ................................................................. 57 6.2 Establishment of Mechanical and Biological Treatment Facilities in the Form of Waste Transfer and Recycling Centers ......................................................................................... 59
6.2.1 Recyclables ................................................................................................................ 61 6.2.2 Composting ................................................................................................................ 64 6.2.3 Waste to energy ........................................................................................................ 66
6.3 Policies and Regulations.......................................................................................... 68 6.3.1 Introduction of Proof of Service for Large Waste Producers .................................... 68 6.3.2 Separation at Source ................................................................................................. 69 6.3.3 Licensing of Private Waste Management Operators ................................................. 69 6.3.4 Calculation of Waste Fees Based on Cost Recovery .................................................. 69
7 Nationally Appropriate Mitigation Actions and International Climate Finance ..... 70 7.1 Introduction ........................................................................................................... 70 7.2 Nationally Appropriate Mitigation Actions .............................................................. 71 7.3 NAMAs in the Waste Sector .................................................................................... 72
7.3.1 Integrated Solid Waste NAMA in Colombia .............................................................. 73 7.3.2 National Program for Catalyzing Industrial and Commercial Organic Waste in Chile 74
7.4 Sources of Funding NAMAs ..................................................................................... 75 7.4.1 The Green Climate Fund ............................................................................................ 76 7.4.2 The Global Environment Facility ................................................................................ 77 7.4.3 The Climate Investment Funds .................................................................................. 77 7.4.4 Japanese Fast Start Finance Initiative ........................................................................ 77 7.4.5 NAMA Facility ............................................................................................................ 78
8 Bibliography ....................................................................................................... 79

8

9
Executive Summary
Municipal solid waste management is a growing problem in Mozambique. In many municipalities, the cost for the collection and treatment of waste is putting increasing pressure on the municipal budget and the continued practice of uncontrolled dumpsites is posing significant health threats to urban populations.
Limited information is available about municipal solid waste generation in Mozambique. Nevertheless it can be estimated that Mozambique generates approximately 2.5 million tons of municipal solid waste per year. Organic waste constitutes approximately 60% of the waste.
Taking into account the continuing rapid economic growth of the country, especially in the center and in the north, the population growth and the growing urban population the waste production is expected to further increase in the coming years.
The final destination of solid waste in Mozambique is mostly open bins and uncontrolled dumpsites, with no or very little waste treatment.
Waste collection rates vary per municipality. In most cases, municipal tariffs and fees are insufficient to cover the costs for the collection and treatment of waste.
Limited information is available about waste recycling in Mozambique. The Mozambican Association for Recycling estimates that less than 1 % of the waste is currently being recycled. Recycling activities are limited to a small number of local companies and NGO's.
The most important sources of legislation for waste management in Mozambique are provided in the Environment Act (Law 20/97 of October 1st), the Solid Waste Management Regulations (Decree 13/2006 of June 15th) and the Finance and Municipal Heritage Act (Law 11/97 of May 31). In addition, the Strategy for Integrated Municipal Solid Waste Management in Mozambique and the National Strategy for Climate Change Adaptation and Mitigation 2013-2025 provide important policy guidance for sustainable waste management in the country.
Further policy formulation and enforcement is required to enhance the collection of waste management fees by municipalities, to promote separation at source and to engage large waste producers in the implementation of integrated waste management practices, including recycling.
The disposal of municipal solid waste in uncontrolled landfills is a major source of greenhouse gas emissions. Carbon Africa estimates that current emissions from uncontrolled dumpsites in Mozambique stand at 776,546 tCO2e in 2014 and, if unabated, are expected to nearly double to a level of 1,369,721 tCO2e in 2030.
Uncertainties exist regarding the greenhouse gas estimations due to the lack of country specific activity data, especially with regard to waste generation levels, waste collection rates and waste treatment practices.
As a way to establish more sustainable waste management practices, the Government of Mozambique has already started planning the implementation of sanitary landfills in major municipalities in the country. The process has been spearheaded by the Environmental Sector Plan (2005-2015) and the Environmental Strategy for Sustainable Development of Mozambique. If combined with methane capture and/or flaring, the introduction of sanitary landfills can result in significant emission reductions.
In order to further enhance the long-term sustainability of waste management practices in Mozambique, this report also proposes the establishment of Waste Transfer and Recycling Centers, where waste is being sorted and processed for further treatment and recycling. It is expected that this will not only result in cost reductions for waste collection and increase the

10
useful life of the sanitary landfills but it will also lay the foundation for the creation of a waste value chain in Mozambique, which will result in further business and employment opportunities in the country.
To finance the investments that are required for the establishment of sanitary landfills and Waste Transfer and Recycling Centers, international sources of climate finance can be tapped into. The formulation of a framework for Nationally Appropriate Mitigation Actions (NAMAs) is considered an important first step towards accessing future sources of climate finance. Countries like Colombia and Chile have already started the formulation of NAMAs in the waste sector. These and other NAMAs can provide examples and guidance for the formulation of a waste sector NAMA in Mozambique. The modalities for Monitoring, Reporting and Verification (MRV) of greenhouse gas emissions and sustainable development benefits are an essential element in the implementation of a NAMA and next steps in the formulation should therefore consider how these modalities can be set up.
Climate finance flows from developed countries to developing countries amounted to at least US$ 39-62 billion in 2012. The largest part of climate finance investments is coming from the private sector. At the moment, the most important public sources of international climate finance are the Climate Investment Funds, the Global Environment Facility, the Japanese Fast Start Finance Initiative and the NAMA Facility. Other (smaller) sources of public climate finance exist that can support the formulation and development of a NAMA.

11
Map of Mozambique

12
Introduction
Solid waste management is a major challenge to many municipalities in developing countries mainly because of the technical organizational difficulties of waste collection and disposal, as well as lack of adequate public funds for extensive solid waste management service provision. Insufficient funds and technical organizational challenges in the waste management sector often have severe public health and environmental challenges especially in urban areas.1
At the same time, the waste sector is also an important source of greenhouse gas emissions mainly through the production of methane (CH4) from uncontrolled landfills. The Intergovernmental Panel on Climate Change (IPCC) has estimated that the waste sector contributes approximately 5% of global greenhouse gas emissions. In the absence of proper waste management strategies and plans, it is expected that in most developing countries greenhouse gas emissions from uncontrolled landfills will continue to increase due to rapid population growth and urbanization.
In Mozambique, the generation of municipal solid waste has rapidly grown over the last couple of decades due to rapid population growth and the quick expansion of the urban population. In most municipalities, waste management infrastructure and services are still inadequate and waste collection and treatment is putting more and more pressure on limited municipal budgets. Also, if unabated, it is estimated that the continued disposal of municipal solid waste in uncontrolled landfills will result in a doubling of greenhouse gas emission by 2030.
In order to put Mozambique on a more sustainable and low carbon development pathway, additional investments will be needed. International climate finance can provide opportunities to co-finance part of the investments that are needed.
In this context, the Climate Change Service of the Belgium Federal Government commissioned a study to carry out an initial assessment of the waste sector in Mozambique and identify measures that could be taken to reduce greenhouse gas emissions while at the same time contribute to the establishment of more sustainable waste management practices in Mozambique. The objective of the report is to lay the foundation for further discussions about possible measures that could be taken to put Mozambique on a more sustainable and low carbon pathway in the waste sector. The report also serves as a first step towards the formulation of a financeable framework for Nationally Appropriate Mitigation Actions (NAMA) in the waste sector in Mozambique, which, in the future, can allow Mozambique to benefit from international sources of climate finance.
The report starts with an overview of the waste sector in Mozambique with a focus on waste generation, collection and treatment practices (Chapter 1), including the waste value chain and recycling (Chapter 2). Chapter 3 provides a summary of the main policies and regulations with regard to the waste sector in Mozambique. To provide further context, Chapter 4 presents specific case studies from three municipalities in Mozambique. Chapter 5 then continues with an estimation of greenhouse gas emissions from the waste sector and provides projections of greenhouse gas emission up the year 2030. Chapter 6 discusses a number of measures that can be taken to put Mozambique on a more sustainable and low carbon pathway. Finally, Chapter 6 introduces the concept of Nationally Appropriate Mitigation Actions (NAMA) and discusses how climate finance can be used to (co-)finance the implementation of more sustainable and low carbon waste management practices in Mozambique.
1 GIZ (2012) Economic Instruments in Solid Waste Management. Case Study Maputo, Mozambique.

13
1 The Waste Sector
1.1 General Overview
Despite consistent economic growth of eight per cent per year (on average) in the period 2001-2011, Mozambique remains one of the poorest countries in the world. Recent estimates indicate that 60% of the 23.9 million inhabitants are still living on less than US$ 1.25 per day.2
In addition, the long and consuming civil war occurring after Independence (1977 – 1992) and the country’s vulnerability to flood and drought, particularly the extraordinary floods in 2000, forced many rural people into the cities. This, together with rapid population growth, has led to a rapid expansion of the suburban areas around the city centers, giving the government little opportunity to organize the settlements or sustain basic service delivery, including proper waste management services.3
In 1999, five years after the first multiparty national elections, 32 cities became formally recognized and municipal elections were held. The decentralization process transferred significant responsibilities from central to local government, including the responsibility for solid waste management with the exception of hazardous waste, which remained the responsibility of the Ministry for Coordination of Environmental Action (MICOA) and biomedical waste, which remained the responsibility of the Ministry of Health (MISAU). The decentralization process was, however, not accompanied by a transfer of necessary financial, technical and institutional resources. The first years after the decentralization were, therefore, characterized by a further decline in service provision despite several trials with external support. Equipment could not be maintained and trained personnel left early for better-paid employment in the private sector. As a result, frequent and severe emergency situations made waste management a hot topic in public discussions.4
Today, the country has a total of 53 municipalities, with 91 officially classified urban centers including 23 towns and 68 villages.5 In most Mozambican cities and towns, solid waste management remains a challenge that is poorly addressed. This can be broadly explained through the general lack of financial and human resources allocated to solid waste management. As a result, an increasing amount of waste ends up in uncontrolled dumpsites without receiving any treatment. This is leading to poor urban environmental conditions that endanger public health and depreciates real estate value.
In response to the above challenges, many Mozambican municipalities have started privatizing waste collection and treatment and work together with international cooperation. In terms of private waste collection, Portuguese and South African companies dominate the market.
Despite some common trends, municipalities also display important differences in the way they handle waste management. In Maputo for instance, economic instruments such as a tax linked to energy consumption and a gate fee at the dump site have enabled the budget allocated to solid waste management to increase from US$ 600,000 per year in 2004 to more than US$ 2.1 million in 2012.6 Public-private partnerships have also been enhanced, as well as the provision of technical assistance.
2
http://www.acdi-cida.gc.ca/Mozambique-f 3 GIZ (2012) Economic Instruments in Solid Waste Management. Case Study Maputo, Mozambique.
4 Ibid.
5 MICOA (2012) Estratégia de Gestão Integrada de Resíduos Sólidos Urbanos em Moçambique
6 GIZ (2012) Economic Instruments in Solid Waste Management. Case Study Maputo, Mozambique.

14
Recycling has existed in Mozambique for a long time but has been limited to scrap export. With the economic growth that followed the signing of the peace agreements in 1992, solid waste management increased and diversified. However, recycling only began to diversify from 2006, and primarily in the cities of Maputo and Beira with the implementation of pre-processing units for metal cans, paper and cardboard, glass, plastic and organic waste.
Nevertheless, the recycling landscape remains quite limited in processing and sales volume. The Mozambican Association for Recycling (AMOR) estimates that only 1% of the urban waste produced in Mozambique is recycled by formal recycling companies, especially in Maputo and Beira. The added value of the activity is weak in that there is little local processing of recyclable materials into finished products. The working conditions of waste pickers are poor because of poverty and their concentration around dumps and containers that do not have adequate infrastructure for separation of waste.
The absence of collection systems based on separation at source principles leads to the wasting of large amounts of recyclable material. Collection is concentrated in the city centers, and the method currently used does not allow for collection that maintains a clean urban environment.
Environmental awareness programs and campaigns are relatively new, often led by the private sector or NGOs promoting awareness in public schools. These need to be intensified to raise the public perception of the challenges of waste management. Strong support and commitment will be needed to implement waste separation, recycling and sustainable waste management in the urban areas. While solid waste management is becoming a major and growing practical preoccupation, recycling is now receiving more attention along with other waste-related activities in the country.
1.2 Waste Production
Due to the Mozambican context and the decentralized waste management operations, it is difficult to gain an accurate figure of the waste produced in the country’s urban areas. In some cases, very different figures are found depending on the sources. Generally speaking, one can assume that Mozambique’s solid waste production is about 1 kg/person/day in the urban areas, and 0.5 kg/person/day in the suburban areas.7 These are official figures that have been verified in Maputo and Matola. For the other urban centers of the country, the figures are probably slightly lower but follow a similar pattern. Overall, the figures are in line with the regional defaults from the Intergovernmental Panel on Climate Change (IPCC), which estimate municipal solid waste generation at 0.29 tons/cap/year or 0.79 kg/cap/day.8
An approximate percentages of waste composition in urban areas is as follows:
60% of organic material;
25% of dry waste (potentially recyclable);
15% of other waste.9
These percentages obviously depend on the lifestyle of the population, with different kinds of waste in urban and suburban areas. The ‘fine fraction’, consisting of sand and dust, represents the biggest percentage of the waste collected in suburban areas whereas the urban areas produce more organic as well as dry recyclable waste (see Table 1 below).
7 MICOA (2012) Estrategia Nacional de Adaptação as Mudanças Climaticas 2013-2025.
8 IPCC (2006) IPCC Guidelines for National Greenhouse Gas Inventories. Volume 5.
9 Figures based on AMOR and Terra Nova’s experience.

15
Table 1: Amount and composition of Municipal Solid Waste (MSW) in urban and sub-urban areas in Maputo.
Area in Maputo city
Production of solid waste
(kg/capita/day)10 Composition of waste11
Urban area (inner city)
1.0 kg
(between 0.54 and 2.16)
Suburban area
0.5 kg
(between 0.45 and 0.55)
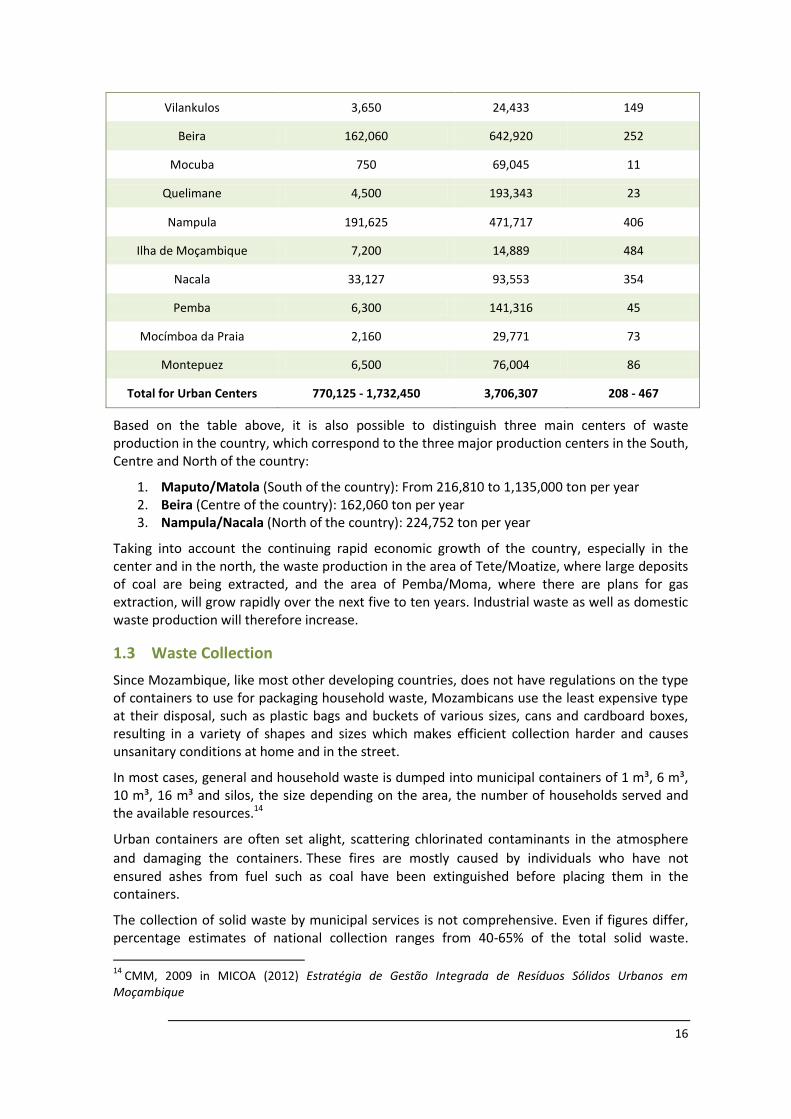
Table 2 shows the waste generation estimations for selected urban centers. The waste generation figures are based on figures prepared by MICOA in 2009. In order to compare the figures from the different municipalities, population data from the National Statistics Institute (INE) was used to calculate the per capita waste generation. As can be seen from the table, the resulting per capita waste generation figures display a significant variance ranging from 11 kg/cap/year in Mocuba up to 484 kg/cap/year and 1,037 kg/cap/year in Ilha de Moçambique and Maputo, respectively. It is unlikely that these differences can be explained through differences in lifestyles only and some of the waste generation figures in the MICOA report might have been overestimated or underestimated.
Table 2: Waste generation in selected cities in Mozambique
Urban Centre Estimated production
(ton/year)12
Estimated
population13
Average production
(kg/year/person)
Maputo From 216,810 to 1,135,000 1,094,628 From 198 to 1,037
Matola 110,000 672,508 164
Xai-Xai 17,163 116,343 148
Inhambane From 8,280 to 52,370 65,837 From 126 to 795
10
MICOA (2012) Estratégia de Gestão Integrada de Resíduos Sólidos Urbanos em Moçambique 11
Ibid. 12
MICOA, 2009 in MICOA (2012) Estratégia de Gestão Integrada de Resíduos Sólidos Urbanos em Moçambique 13
Instituto Nacional de Estadisticas, 2007
16
Vilankulos 3,650 24,433 149
Beira 162,060 642,920 252
Mocuba 750 69,045 11
Quelimane 4,500 193,343 23
Nampula 191,625 471,717 406
Ilha de Moçambique 7,200 14,889 484
Nacala 33,127 93,553 354
Pemba 6,300 141,316 45
Mocímboa da Praia 2,160 29,771 73
Montepuez 6,500 76,004 86
Total for Urban Centers 770,125 - 1,732,450 3,706,307 208 - 467
Based on the table above, it is also possible to distinguish three main centers of waste production in the country, which correspond to the three major production centers in the South, Centre and North of the country:
1. Maputo/Matola (South of the country): From 216,810 to 1,135,000 ton per year 2. Beira (Centre of the country): 162,060 ton per year 3. Nampula/Nacala (North of the country): 224,752 ton per year
Taking into account the continuing rapid economic growth of the country, especially in the center and in the north, the waste production in the area of Tete/Moatize, where large deposits of coal are being extracted, and the area of Pemba/Moma, where there are plans for gas extraction, will grow rapidly over the next five to ten years. Industrial waste as well as domestic waste production will therefore increase.
1.3 Waste Collection
Since Mozambique, like most other developing countries, does not have regulations on the type of containers to use for packaging household waste, Mozambicans use the least expensive type at their disposal, such as plastic bags and buckets of various sizes, cans and cardboard boxes, resulting in a variety of shapes and sizes which makes efficient collection harder and causes unsanitary conditions at home and in the street.
In most cases, general and household waste is dumped into municipal containers of 1 m³, 6 m³, 10 m³, 16 m³ and silos, the size depending on the area, the number of households served and the available resources.14
Urban containers are often set alight, scattering chlorinated contaminants in the atmosphere
and damaging the containers. These fires are mostly caused by individuals who have not ensured ashes from fuel such as coal have been extinguished before placing them in the containers.
The collection of solid waste by municipal services is not comprehensive. Even if figures differ, percentage estimates of national collection ranges from 40-65% of the total solid waste.
14
CMM, 2009 in MICOA (2012) Estratégia de Gestão Integrada de Resíduos Sólidos Urbanos em Moçambique

17
According to the Agence Française de Développement (AFD), this rate does not exceed 30%15, though it varies from one municipality to another. In Maputo, it is estimated that the collection coverage among households stood at 82% in 2012.16
The collection usually covers the central, built-up inner city areas, sometimes the suburbs, but rarely includes the peri-urban areas. Nevertheless, the majority of the population lives in suburban and peri-urban areas, where because of a lack of waste collection services, many inhabitants either bury or burn their waste, and in some instances dump it into watercourses and ravines.
The means of transport used for the collection of solid waste in urban centers ranges from tricycles to trucks, hydraulic compactors, and tractors. As for the municipal containers, there is a great variety of context according to the municipalities. It should be noted that the use of trucks with hydraulic compactors as a means of collection and transportation of solid waste is not advisable for small municipalities due to poor access roads and high costs for their maintenance.
In some suburban areas, a two-step collection system has been implemented: locally based small-scale enterprises paid by the municipality first collect the waste from households with a so called tchova (a hand-cart) and transport it to larger containers, which are placed in easily reachable locations for the municipality (closer to the main roads). The municipality then collects the waste from the containers.
Only Maputo and Beira have clear annual solid waste management plans and programmes, although many municipalities have produced or are currently producing a master plan for waste management. As an example, in 2013, the Municipalities of Pemba and Nacala have produced such master plans.
1.4 Waste Treatment and Final Disposal
The final destination of solid waste in Mozambique is mostly open bins and uncontrolled dumpsites, with no or very little waste treatment.
Although studies on the impact of dumpsites on public health in Mozambique have not been performed, one cannot ignore the potential danger of lixiviation, with soil, water and air contamination, since no specific treatment is given to the waste.
Concern is expressed about current waste treatment practices, such as:
a) The dumps are very often located near residential areas that have developed in the last decade. Solid waste is then being transported to the dump by access roads with heavy traffic.
b) There are no studies on the soil type of these dumps so there is high-risk of groundwater pollution. Similarly, uncontrolled dumpsites may cause air pollution by fumes, odours and potentially toxic particles as the solid waste is not subject to prior selection and is burnt from time to time. Even when not burnt by the municipality, a natural phenomenon, through the decomposition of the organic fraction keeps the temperature high when a lot of waste is accumulated, giving rise to spontaneous fires.
c) In some cases, the dumps are not easily accessible or only accessible with a fee (when the collection has been privatized). Thus, some private companies deposit their waste in vacant lots or along the roads.
15
Sector Note on Environmental Health, AFD 16
GIZ (2012) Economic Instruments in Solid Waste Management. Case Study Maputo, Mozambique.

18
At the dumpsites, some private initiatives informally select glass, plastics and metals as well as other materials for their own use or for sale. These practices occur mainly in municipal dumps of large cities such as Maputo and Beira, with associated risks to both individuals and communities.
Recently civil society actors have started to promote waste separation at source and recycling (see section 2).
1.5 Current Situation of Sanitary Landfills in the Mozambican Waste Sector
The government of Mozambique has taken the initiative to establish sanitary systems in different urban areas across the country. The process has been spearheaded by the Environmental Sector Plan (2005-2015)17 and the Environmental Strategy for Sustainable Development of Mozambique, which among many things, advocates for long-term goal of opening of controlled landfills.
Sanitary landfills involve the controlled disposal of solid waste on land. This method of waste handling has been advocated as suitable for developing countries due to its flexibility and relative simplicity of the involved technology. Sanitary landfills control the exposure of the environment and humans to the detrimental effects of solid wastes placed on land. Disposal in sanitary landfills is accomplished in a way that contact between the environment is greatly reduced while the waste concentrates on one area.
The adoption of this technique of waste handling in the developing countries has been faced with the challenge of lack of information on the technology and shortage of capital and properly trained human resource.18
The following table shows the current situation regarding the planning and construction of sanitary landfills in different municipalities in Mozambique. The information is based on a presentation given by the MICOA on the 18th of February 2014, during the workshop on NAMAs in the waste sector.19
Table 3: Status overview of the planning and implementation of sanitary landfills in selected municipalities in Mozambique
Municipality Current situation and progress on establishment of sanitary landfills
Maputo/Matola - A sanitary landfill location has been identified. - Tenders have been invited for securing the area through fencing
it - Call for Environmental Impact Assessments on the site has been
issued.
Xai-Xai - Studies have been carried out for identification of the appropriate location of the sanitary landfill.
- Tenders were invited for firms wanting to fence the area in March 2014 and fencing of the site was expected to be done by April 2014.
17
MICOA Plano Estratégico do Sector do Ambiente (2005-2015). 18
UNEP (2005) Closing an Open Dumpsite and Shifting from Open Dumping to Controlled Dumping and to Sanitary Land Filling 19
http://www.climat.be/fr-be/mediatheque/presentations/workshop-climate-finance-mozambique

19
Inhambane - The site for the landfill has been identified. - An Environment Impact Assessment (EIA) and preliminary design
of the Sanitary Landfill was approved in 2010. - Fencing of the landfill site took place was completed on January
2014. - A tender for carrying out the economic viability studies for
the design of the landfill project was done in February 2014. - Economic feasibility and design studies for the landfill project
took place in March 2014. - Construction of the landfill is expected to start in 2014.
Chimoio - Preliminary EIA study of three identified locations for the landfill was carried out in June 2013 and the identified locations were rejected.
- Identification and preliminary evaluation of the new landfill site took place in December 2013.
- Fencing of the landfill site is expected to be finalized in 2014.
Tete - Two locations for construction of landfills were identified - Fencing of the identified final landfill site took place in January
2014. - Drawing of the executive and project economic feasibility study
took place between February / March 2014.
Nampula - The site identification for the landfill took place in November 2013.
- EIA and technical design studies for the project are expected to take place in April-June 2014).
Lichinga - The location of the landfill was identified in June 2013 - A preliminary EIA study and technical feasibility was undertaken
in July 2013 - Fencing of the landfill site is was to be due between December -
February 2014 - Studies of economic feasibility and design of the landfill project
are planned to be carried out between March - April 2014 - Construction of the landfill is to commence in 2014
Pemba - The area for the construction of the landfill was identified in June 2013.
- A preliminary EIA study and technical feasibility tool place in July 2013.
- Fencing of the landfill site took place in December / February 2014.
- Studies of economic feasibility and design of the landfill project executive took place between March / April 2014.
- Construction of the landfill is set to start in May 2014.

20
1.6 Cost Recuperation and Economic Instruments
The costs of collection and treatment are a challenge in low-income countries such as Mozambique. Waste management costs are mainly related to service provision contracts (e.g. for municipal waste collection) but also the municipality's own expenses for investment, salaries and operational costs of the solid waste sector. To address this issue, municipalities have developed various economic tools within the existing legal framework that allows them to raise sufficient funds to carry out waste collection and disposal.20
In Maputo, for instance, a waste fee was introduced in 2002, but was abandoned a few months later. Poor service performance and no public information about the fee caused protest that led eventually to the fee’s withdrawal. With support from German Agency for International Cooperation (GiZ), a broad and thorough awareness campaign prepared the way for a second introduction of the waste fee a year later.
Since then, the fee is charged through the electricity bill and has therefore a wide and relatively efficient distribution network. The fees range from 10 MZN for consumption below 100 kWh and 80 MZN for a consumption higher than 500 kWh.21 The reintroduction has been largely successful; people paid their waste fee and the key economic instrument for a sustainable waste management system was introduced.
The Municipality of Maputo also introduced a “Proof of Service” for large waste producers, as well as a disposal fee at the official disposal site in Maputo for private operators and a set of fees and fines for additional services or illegal waste disposal. In 2012, the combined income of all economic instruments in Maputo amounted to USD 4,110,000, i.e. about 69% of the total waste management costs (USD 5,945,529).22
20
More information in section 3 21
GIZ (2012) Economic Instruments in Solid Waste Management. Case Study Maputo, Mozambique. 22
Ibid.

21
2 Recycling and the Waste Value Chain in Mozambique
2.1 Recycling Chain and Focus
Recycling is the reprocessing of old materials into new products, aiming at preventing the waste of potentially useful materials and reducing the consumption of fresh raw materials. "Recyclable materials" or "recyclables" may originate from home, business or industry. They include glass, paper, metal, textiles and plastics.23 Figure 1 below presents a summary of core activities involved in recycling.
Figure 1 Schematic overview of the recycling value chain (Source: Pagalata)
These four core activities can be considered to form the recycling industry’s value chain:
1. Waste collection and preparation – The first stage of the value chain consists in collecting, sorting and grading recyclable waste into specific categories, and then reducing its volume to ensure transport efficiency and meet recycling specifications. In Mozambique, processing actors are mainly located at this stage of the value chain. Recyclable waste collection can take place at the source of waste or, in developing countries like Mozambique, can happen at final waste deposit points like dumps or landfills.
2. Waste conditioning and recycling – Pre-processed waste is then cleaned and further prepared to become raw material that can be used for the production of another product (e.g. paper is turned into paper pulp). In some cases the recycling operation is a division of a large corporation that sells the end goods (e.g. Mondi recycling division in South Africa buys used paper and recycles it into paper pulp to use for new paper – Closed cycle recycling). In some other cases, the recycled product is used for another purpose other than the original after the production of waste e.g. tin cans that are melted and turned into second grade steel pipes for construction (open cycle recycling).
3. Fabrication of goods – Goods are produced from virgin material. Part of this virgin material can be processed recycled raw materials, as explained above. According to various sources, production from recycled goods has demonstrated to be more efficient and environmentally sound than from the original raw materials. For example, the Economist states that energy consumed in the production of 1 ton of paper from waste paper is 40% less than from paper made from original materials. For steels, this rate is reaching 60% whereas it reaches 70% for plastics.24
4. Consumption – Finished goods are then placed at end markets for consumption, having as a consequence waste generation. As consumption levels increase world and region wide, waste production has increased accordingly (South Africa, Mozambique’s main market, has experienced a GDP increase of 5% on average over the last ten years).25 Consequently, demand for recycled raw materials has increased significantly, boosting the demand for
23
In Wikipedia http://en.wikipedia.org/wiki/Recycling#cite_note-0 24
http://www.economist.com/node/9302727 - The Economist - Recycling: The price of virtue. 25
More details about South Africa’s economic growth in http://www.southafrica.info/doing_business/economy/econoverview.htm
Recyclable Waste Produced
Waste Collection
and Preparation
Waste
Recycling
Fabrication of
GoodsConsumption

22
recyclable waste. For example, it is estimated that about 42% of steel production worldwide is made from recycled scrap.
Table 4 below present some of the recyclable products that have potential in Mozambique.
Table 4: Recyclable products
Item Name Definition26 Designation
Cardboard
Clean, sorted, printed or unprinted cardboard cartons, boxes or sheets, must be Kraft or jute liner content. May contain staples or poly tape, must be free of asphalt tapes and asphalt lined materials, and may not contain more than 5% fiber reinforced tapes.
Cardboard
Mixed Office Paper
Clean, sorted ledger & writing paper, free of brown grades, cardboard, boxboard, may contain up to 10% ground wood paper fiber content. Bales shall be compressed into secure uniform bundles. Bale ties may be wire, strapping or appropriate bale cordage. (unless otherwise declared by individual buyers)
Paper
Mixed Steel Can Scrap
Flattened or whole steel cans. This material is typically generated from food cans from municipal recycling programs. May contain Bi-Metal (aluminum/steel) beverage cans.
Cans
Scrap Post Consumer
Container Glass
Scrap postconsumer container glass shall consist of mixed colors of broken or whole container glass, (free of non-container glass & foreign materials).
Glass
Baled Mixed PET Scrap
Assorted PET bottles or containers compacted into secure bundles. May contain Post Consumer PET Soda Bottles of mixed colors.
Plastic and PET
Mixed LDPE Regrind / Baled
Clean reground flake of Low Density Polyethylene (LDPE)
Mixed LDPE Scrap (Baled)
Assorted Low Density Polyethylene (LDPE) scrap, compacted into secure bundles.
Organic
Waste containing carbon compounds; derived from animal and plant materials.
Organic Waste
2.2 Re-use and Recycling in Mozambique
2.2.1 Re-use Culture in Mozambique
As a consequence of low-income levels, there is a strong re-use culture in Mozambique. However, this can be considered to a large extent as a delay in the recycling chain. Cardboard, glass and plastic containers are reused for different purposes when found in good condition
Cardboard: many used cardboard boxes are resold
Glass: some of the non-returnable bottles are sold to informal bottlers in different parts of the country, with a special mention for a glass buyer located in the city of Tête, who re-uses the
26
Most definitions are taken from www.scrapindex.com
23
bottles for his own beverage. Recently, Cervejas de Moçambique (CDM), the major brewery of the country, introduced a new shape for little beer bottles, in order to make them returnable.
Plastic: PET bottles are usually cleaned and used to store other kinds of liquids.
2.2.2 Recycling in Mozambique - General Overview
Recycling currently is nascent but quite limited in Mozambique in terms of processing and sales volume. AMOR estimates that less than 1% of the waste produced in Mozambique is actually recycled, this percentage having a slight tendency to rise year after year.
In Maputo, recycling has existed for a long time but was limited to scrap export. Recycling only began its diversification in 2006 with the implementation of the pre-processing of metal cans, paper and cardboard, glass and plastic followed more recently by organic waste.
By reducing the volume of waste in the municipal dump and in the streets, recycling significantly contributes to mitigating the environmental challenges posed by the current deficient waste management system. On the Costa-do-Sol and Tofo beachfronts, two sensitive zones that are under much environmental pressure, the result of a recycling activity is obvious with a drastic reduction of cans or glass bottles lying on the beach. In the municipal dumpsite, tons of paper, cardboard, plastics and cans are being collected instead of burned with a direct positive influence on the surrounding residential areas.
Beside the environmental and public health benefits, recycling contributes to informal employment opportunities for numerous people, most of them marginalized and without financial and technical means to start any kind of lucrative activity. Both formal and informal jobs created by recycling activities contribute to reducing poverty, while generating incomes for the State through export and foreign currency. Indeed, through its exportation, recycling manages to transform useless material into hard currency, thus affecting positively Mozambique’s balance of payments.
Unfortunately, since the recyclable material are mainly prepared for export markets (South Africa, Asia) the added value of the activity is weak in that there is little local processing of recyclable materials into finished products. The local market for the collection and purchase of recyclable material is also very dependent on the fluctuations of the export markets and transport costs. As a result, certain products such as glass and cans have suffered a sharp drop in prices since the 2008 world financial crises. Thus, the low value for recyclables and the absence of separate collection involves the wastage of large amounts of recyclable material.
2.2.3 Recycling Actors - Processing Actors
All over the country, we can estimate that the recycling sector has about 2,000 casual workers. Mostly, their working conditions are poor because of their concentration in dumps that do not have adequate infrastructure to separate waste.
Currently, the pre-processing units are limited to a few entities, such as:
Pagalata Limitada - Pagalata started operations in December 2006. It processes and exports cans, paper, cardboard and glass in Maputo and Matola. Most of the recycling material comes from municipal dumps and the streets of Maputo where about 300 families sort and then sell waste to Pagalata. Since 2010, Pagalata is AMOR’s biggest buyer, supporting the association in its efforts to promote waste separation and recycling. In its yard, Pagalata formally employs 20 people who process recyclables into raw materials, mainly for export to South Africa and Asia. Pagalata is currently Mozambique’s biggest pre-processing unit recycling about 6,000 tons per year, with a constant increase.

24
Recicla - Recicla is a cooperative dealing with HDP plastic in Maputo since 2007. The organization was born from an innovative joint venture between LVIA/Caritas, Agresu/GIZ and the Municipality. Recicla is located close to Hulene dump, with the purpose of creating quality jobs for informal collectors at the Hulene dump and has successfully created 13 jobs, recycling about 250 tons of plastic per year. The operation has almost reached financial sustainability. A gentleman’s agreement between Pagalata and Recicla allows Recicla to be the sole player in HDP recycling business, excluding other plastics. However, market research indicated the organization only covers about 4% of recyclable plastic waste in Maputo therefore allowing enough room for entry by others without compromising its survival.
Terra Nova Limitada - Terra Nova is a company that has been processing organic waste into compost in Beira since 2009. Terra Nova was created by a French agronomist. Through a strong partnership with the municipality the company receives the municipal waste and turns the organic fraction into compost, which is then sold locally. So far, Terra Nova has been operating on a micro-scale level and has not yet reached financial sustainability.
Fertiliza - Fertiliza is a cooperative that started in 2008 with processing organic waste in Maputo. Most of the waste comes from the Xiquelene market, and is processed into compost and sold locally. The cooperative stopped working in 2012 and moved to the Bairro Ferroviario. In 2013, the activity started again and Fertiliza now intends to recycle 600 tons of organic waste per year.
Reclam - New Reclamation Group - Reclam is a South African scrap company active in Mozambique. Reclam is both a purchaser of loose or compacted scrap, and a processor of inputs.27
Some local businesses also take advantage of certain waste, especially the metal and plastic waste in major cities, as for example, Limetal, a scrap buyer located in the Maputo area, which is also buying scrap for baling and export. Facobol buys plastic to melt it and produce irrigation tubes. The plastic businesses are mainly held by people originating from India or China, who buy HDP plastic to melt it and produce new plastic objects.
Most of the above mentioned recycling actors send the recyclables abroad, mainly to South Africa and Asian markets. The extreme south of the country, close to South Africa has the best facilities to recycle, also because it has the largest concentration of waste production in the country. Thus, recycling waste from Tête or Chimoio, in the center of the country, or from cities further north is difficult to sustain, as transport costs will often exceed the value of the recyclables market.
2.2.4 Organizations Promoting Recycling in Mozambique
AMOR, the Mozambican Association for Recycling, was founded in 2009 by specialists in waste management (Ex-Pagalata’s manager) and environmental activists, to organize and promote recycling throughout the country. The association follows a logic based on three pillars:
Installing infrastructure for recycling;
Raising awareness;
Providing sustainability through added-value activities.
Since its creation, paper, cardboard, glass, plastic, metal, cooking oil, and electronic waste are collected for onward sales to the recycling industries. The waste materials are provided by individuals, shops, institutions and firms, or sold by waste-pickers, to whom the Eco-points are a source of income.
27
Feasibility Study: Recycling Run by a Micro- enterprise in Vilanculos, Mozambique
25
AMOR also advocates for the 3R policy (Reduce, Reuse, Recycle). In 2012, after several years of lobbying, initially started by Pagalata and followed by AMOR, Cervejas de Moçambique, the major brewery of the country, started the collection of the small beer bottles that used to be single use and are now returnable. CDM produces about 1.3 million small, returnable bottles per month, distributed all over the country, of which the recycling sector already collects 300,000 per month.
AMOR is also steadily expanding the recycling markets. Another partnership with CDM and M-Cel, the major cell phone operator, began in December 2012 to sponsor broken glass recycling. Since there was no market to buy broken glass, AMOR was previously not able to buy it at its Eco-points. Thanks to private sector sponsorship (three Meticais paid for each kilogram of broken glass28), the AMOR Eco-points are now buying more than two tons of broken glass per month. The initiative also contributes to the improvement of Maputo’s beach area (Costa do Sol district), considerably reducing the number of the many discarded cans and bottles.
In 2013, AMOR started implementing a cooking oil processing unit converting used cooking oil into biodiesel. In the long term, the association plans the implementation of a large transformation line for paper and cardboard into ecological roof shingle.
AMOR also has a strong role in advocacy - lobbying and creating a movement around recycling. Through its position as a local NGO, AMOR has been collecting information about recycling and will eventually develop a platform for recycling activities, linking not only sellers and buyers but also civil society organizations (such as Centro Terra Viva, Olho do Cidadão), artists and innovators for environmental advocacy and actions.
ALMA (Associação de Limpeza e Meio-Ambiente) is an association that has been active in Tofo and the city of Inhambane, both in the province of Inhambane in southern Mozambique. ALMA is a non-profit organization focusing on the environment, keeping it clean and using its resources in a sustainable way. ALMA implements several projects to raise awareness of the challenge of increasing waste and offers alternatives for waste disposal. ALMA has been organizing waste collection as well as a proper dumpsite, producing quality recycling handicrafts and organizing waste separation (it recycled for a while through Pagalata).29
Nationwide other local organizations may not be as focused on recycling as AMOR and ALMA but nonetheless advocate for better waste management and recycling. For instance, Centro Terra Viva, Livaningo (in Maputo), or the recently created COMSOL, a waste-pickers cooperative doing a segregated waste collection in the district of Sommerschield, Maputo, in cooperation with the Municipality of Maputo.
28
3 MTS = 0,10 US$ (June 2014) 29
More information on www.almatofo.org
26
3 Legal Framework and Policies
Several policies, regulations, legal instruments and laws exist in Mozambique that together define and regulate the management of waste in terms of:
The definition of responsibilities for the management of different types of waste
The definition of the conditions and goals under which municipalities can develop their municipal ordinances to implement concrete measures for waste management
The definition of the rights and responsibilities of municipalities regarding waste management, for example, who is responsible for cleaning the city, what are the sources of revenue for the municipality to finance solid waste management, etc.
This chapter provides an overview of the most important policies, laws and regulations that govern waste management in Mozambique.
3.1 International Framework
The World Conference on Environment and Sustainable Development held in Rio de Janeiro in 1992, known as the Rio Summit, recognized that the prosperity, peace and economic development of a country depend on its environment.
The Summit adopted the so-called Agenda 21, which recognizes the need for cities to become sustainable, independently from their size, particularly looking at the needs of water supply, access to environmental sanitation, wastewater management, and solid waste management systems, among others.
3.2 National Framework
In Mozambique, the Constitution of 2004 and the Law 20/97 of 1st October, known as the Environment Act (Lei do Ambiente) are the most important texts dealing with environment.
3.2.1 Constitution of Mozambique (2004)
Article 90 of the Constitution states that: "Every citizen has the right to live in a balanced environment and the duty to defend it. The state and local authorities, with the collaboration of associations for environmental protection, adopt policies to protect the environment and ensure the rational use of all natural resources."
As such, the constitutional legislation explicitly recognizes the right to a safe and healthy environment as a fundamental right of citizens. At the same time, the Constitution explicitly mentions the duty of the state and local authorities to protect this environment.
3.2.2 National Environment Policy (Política Nacional do Ambiente - PNA)
The National Environmental Policy (Política Nacional do Ambiente – known as PNA) was approved by Resolution No. 5/95 of 3 August 2008. The PNA is a legal recognition of the interdependence between development and the environment. Chapter 3.7 of the National Environmental Policy refers to the management of the urban environment: it provides an ever-closer coordination between MICOA (Ministry for Coordination of Environmental Action) and Municipal Councils, which are to be trained in terms of management of solid waste. The resolution also provides for the need to introduce systems of waste treatment and recycling, and recommends the introduction of separation mechanism of domestic solid waste.
3.2.3 The Environment Act (Lei do Ambiente) - Law 20/97 of October 1st
The Environment Act was approved on the 1st of October 1997 and sets the foundation for sustainable management of the environment and its components. The law shows that waste management, though managed by the municipalities, is not governed autonomously: it remains
27
under the coordination of the MICOA – the MICOA being the entity responsible for the coordination of environmental action at the national level.
As such, the Strategy for Integrated Municipal Solid Waste Management is produced by the MICOA (see section 3.4.1) and defines the roles of the authorities and civil society to improve solid waste management in Mozambique.
Thus, MICOA produces regulations for certain types of waste, with particular emphasis on hazardous waste. Some waste-related decrees have been added to complement the Law 20/97, such as:
Regulation on the Management of Bio-Medical Solid Waste (Decree 8/2003 of February 18th). The decree says that coordination must be established between the MICOA and the local authorities, providing a license to manage bio-medical waste. This implies coordination between MICOA, Municipal Councils and other government institutions.
Regulation on Environmental Inspection (Decree 11/2006 of June 15th). The decree allows the MICOA to realize environmental inspections, including waste related inspections.
3.2.4 Solid Waste Management Regulations (Decree 13/2006 of June 15th)
This very important decree gives Local Authorities (the Municipalities), in the area under their jurisdiction, the power to:
Adopt specific rules on waste management;
Establish fees for providing services to the public through their own means, in particular within the collection and disposal of solid waste, including hospitals and toxic waste;
Approve removal processes, treatment processes and disposal of solid waste, including hospitals and toxic waste;
License establishments producing hazardous or toxic waste.
Article 7 (Waste Management Plan) of the Decree requires all public and private entities that operate waste management activities to develop a waste management plan to be submitted to and approved by MICOA, with a validity of 5 years from the date of its adoption.
Up to now, only the Municipalities of Maputo (in 2008) and Inhambane (in 2010) have an approved Waste Management Master plan. Within the PDA Program (Programa de Desenvolvimento Autarquico), the Waste Management Master Plans of the Municipalities of Ilha de Moçambique, Mocuba, Quelimane, Nacala and Pemba are currently being written.30 Also the Waste Management Master Plans for Cuamba, Montepuez and Dondo are expected to be finalized in the near future.
3.3 Local Level
3.3.1 Law of Local Government (Lei das Autarquias Locais known as LAL) - Law 2/97 of February 18th
At the local level, this is the main important text as it establishes the legal framework for the implementation of waste management by the Local Government (Autarquias Locais), i.e. Municipalities. It refers to environmental issues in particular, the removal processes, treatment and disposal of solid waste, including hospitals and toxic waste. Among the other duties of local authorities it is important to note the following point relevant to solid waste management:
30
The PDA is a capacity-building program funded by international donors and implemented in 13 Central and Northern Municipalities. The PDA has a strong waste management component.

28
Responsibilities (Article 6. b and 46): Environment, sanitation and quality of life.
Skills (Article 45, n. 3): approve regulations and procedures; establish by law municipal rates and other sources of revenue and fix their quantitative value; fix tariffs for the provision of services to the public through their own means, in particular within the collection, disposal and treatment of waste;
3.3.2 Finance Act and Municipal Heritage - Law 11/97 of May 31
The Finance Act and Municipal Heritage is important at the local level because it establishes that the local government enjoys administrative and financial autonomy, and possesses its own finances independently managed by the respective agencies. The following articles are specifically relevant in the context of waste management:
Article 3 (Exercise of powers of local authorities) stipulates that for the charge of tax Local Authorities must "respect the principles of legality, security, equality and ability to pay of the respective populations". Paragraph 2 of the article further states that: "the competent government bodies, in determining the amount of fees to be charged, must act fairly, being forbidden to set values that in their size exceeds a balanced relationship between the compensation for the services rendered and the amount received by the local authority". In other words, the local government cannot raise taxes that would exceed the costs of the services.
Article 4 (Collaboration within local government) says that: "Municipalities can associate themselves to the pursuit of works or provision of public interest". An example of this is the project for the construction and management of the future common landfill between the Municipality of Maputo and the Municipality of Matola.
Article 13 (Own Revenues) stipulates what can constitute the own revenues of local authorities, among others:
The product from fees for licenses granted by the local authorities;
The product of a percentage of state taxes, as shall be provided by law;
The product of charging fees or tariffs resulting from the provision of services;
The product of fines that by law, regulation or procedure, fit the local authority;
Any other revenues established by law in favor of local authorities.
Article 25 (Responsibilities of Local Authorities) stipulates that the Municipality has the responsibility to invest in the following areas, among others:
a) Rural and urban equipment: Green spaces including gardens and nurseries of the municipality, roads and pavements, affordable housing, public cemeteries, markets and fairs, etc.
b) Sanitation: systems of municipal water supply, sewage systems, collection and waste management systems, public cleaning, etc.
Article 35 (Autonomous Services) stipulates that the Municipalities can create autonomous services or municipal public enterprises to meet the collective needs of their populations, when such needs are of interest and relevance to the community or autonomous management proves to be the most efficient solution. These services are managed in business terms, at the risk of the Municipality, enjoying a financial and administrative autonomy.
The Article 36 (Concession of public services exploitation) stipulates that the Municipal Assembly may authorize a private actor to execute public services as long as the public interest is proved to be properly secured and the choice of concessionaire takes place through a public tender to be held in compliance with the legislation in force.

29
Article 37 (Regulation and supervision of tariffs) says that services whose exploitation is subject to concession are subject to regulation and supervision of the local government, being also the Municipality executive bodies to approve its tariff policy. The Municipality may terminate contracts of concession if it appears to act in violation of the contractual clauses affecting the public interest, or when the services manifestly work under unsatisfactory conditions to meet the needs of the users.
Article 70 (Fees and charges for services) stipulates that the Municipality can apply tariffs or exchange service under their direct administration for the provision of certain public service, and in particular in the following cases:
Water and electricity;
Collection, storage and treatment of waste as well as the connection, conservation and wastewater treatment;
Collective urban transport of people and goods;
Maintenance of gardens and markets;
Maintenance of roads.
Article 71 (fines and penalties) defines the fines and penalties in the case of violation of procedures and regulations.
3.4 National Priorities, Policies, Strategies and Technical Assistance
3.4.1 Strategy for Integrated Municipal Solid Waste Management in Mozambique
In recognition of the seriousness of the municipal solid waste management challenge in the country, the Government introduced the Strategy for Integrated Municipal Solid Waste Management in Mozambique, which characterizes the situation and develops the technical, institutional and management framework for municipal solid waste in the country by 2025. The Strategy has a time horizon of 12 years of implementation.
The Strategy stresses the fact that waste is a problem affecting the whole of Mozambican society: “Given that solid waste represents a problem that affects not only large cities, but even small towns and that these residues are produced by all members of society, whether in the home, on public roads, hospitals, schools and in the workplace, it is everyone's business and everyone independently of their social class, religion or belief".
The Strategy guides the different stakeholders on how to design, implement, and manage public cleaning systems involving the wide participation of all sectors from the civil society, with the final goal of contributing to sustainable development through:
Construction of landfills;
Improved waste collection of urban solid waste;
Eradication and /or improving the conditions of open rubbish dumps;
Promotion of separation, where feasible, of recyclable materials at source;
Resource mobilization and partnerships to continue on-going initiatives;
Organization of waste collectors and withdrawal of children from open rubbish dumps;
Promotion of the creation of income associated with solid waste;
Improved inter-sectorial coordination;
Elimination of the burning of solid waste disposal sites;
It is within this perspective that the Strategy assigns responsibilities to all stakeholders, described as follows:

30
Central and local governments (provincial, district and village) - it is the responsibility of governments to support municipalities in mobilizing financial and material resources, adopting appropriate legislation to ensure the implementation of waste management programs towards a healthy environment of cities and towns in solid urban waste management, providing incentives for this and the sustainable management of municipal solid waste, among others.
Municipal Councils – Municipal Councils play a key role in the management of solid waste. It is up to the Municipal Councils to approve the key legal instruments to implement a system of sustainable management of solid waste, such as regulations, charges or fees and rates, tax code, resource mobilization and organization of the different stakeholders, initiatives for sustainable management of solid waste, etc. Municipal Councils also have to promote studies for the rehabilitation and reuse of the existing open rubbish dumps for other uses.
Private sector (business and trade services) – The private sector is an important actor because it produces large quantities of solid waste, often collected together with household/residential waste. Therefore, members of the Commercial Association shall participate in committees drawing up local plans on solid waste management.
Waste pickers – Waste pickers have a responsibility and should be organized into forums or associations and qualified to implement programs of selective collection of solid waste in cities and towns. In other words, they are expected to be treated as priority partners in separate collection.
Local communities and residents – they have the responsibility to participate actively in the implementation of all stages of the system of solid waste management including:
Production - households and local communities must assimilate and adopt the principle of 3R (Reduce, Reuse and Recycle);
Packaging – suitable packaging must be adopted to facilitate solid waste removal;
Collection – when existing, the schedules for the collection of deposited solid waste in secure containers must be respected;
Treatment - households and local communities should adopt the techniques of low-cost solid waste treatment (composting, small landfills, reuse, recycling and craft development), and create cooperatives/associations to treat solid waste;
Final disposal - households and communities should ensure segregation of solid waste at source.
Non-governmental organizations and civil society – NGO's and civil society have a responsibility to actively participate in the educational and informative part, as well as the creation of new job opportunities and income generation. They also have the responsibility to monitor the performance of the public sector.
So far, the MICOA has identified the following main challenges:
Ensure the construction of landfills;
Ensure the development and implementation of regulations related to the management of municipal solid waste;
Adopt mechanisms to control and reduce risks to the environment by ensuring the proper handling, treatment and final disposal of waste in accordance with the Solid Waste Management Regulations;
Ensure the development and implementation of Municipal Solid Waste Management Plans for all Municipalities and municipal districts;
Supporting initiatives to minimize the generation of waste at source and segregation of waste;

31
Support the establishment of recycling centers and composting in order to contribute to the reduction of greenhouse gases, monetization of solid waste and the consequent improvement of environmental quality and living standards;
Create a database containing information on each landfill (waste, emissions, etc.);
Inventory of waste, in collaboration with stakeholders from municipal solid waste management process;
Involve the private sector, local communities and NGOs in the process of awareness, environmental improvement and exercise of environmental citizenship.
3.4.2 Poverty Reduction Action Plan - PARPA
Mozambique is one of the poorest countries in the world with 7.5 million people living on less than a dollar a day. The government's main objective is the reduction of absolute poverty through the creation of employment or income generating activities, according to national plans, PARPA I and II (Plano para Acção A Redução da Pobreza Absoluta). In order to achieve these objectives, Mozambique is receiving development assistance from a number of different countries. PARPA II (2006-2009) sought to provide a more direct relationship between poverty reduction and environmental management, going beyond what had been articulated under PARPA I (2001- 2005). In PARPA II, efforts were made to expand inter-institutional coordination through the creation of working groups on Environment, Health, Water and Sanitation with the participation of State agencies, donors and civil society, and to implement policies, which include environmental management on the government’s agenda and in the fight against poverty.
3.4.3 International Cooperation and Technical Assistance
Several international development cooperation agencies are to be mentioned for their contribution to the Mozambican waste sector.
Funded by the German GIZ, the program AGRESU (Support for Management of Municipal Solid Waste) has been implemented in the greater Maputo area since 2002 and contributes greatly in modifying the context of waste management by municipal authorities and their development potential. Before 2002, the Spanish cooperation worked together with the Municipality of Maputo on waste issues.
Amongst others, AGRESU helps the Municipality to raise funds through the implementation of economic instruments, and promotes the concept of partnerships with public and voluntary sectors allowing implementation of various initiatives with noticeable results in terms of improvement of the degree of collection and community participation. The German cooperation agency has also been present in Inhambane, as well as the Finnish cooperation in Xai-Xai.
The PDA is the Programa de Desenvolvimento das Autarquias: funded by Swiss, Danish, Austrian and recently Irish government development cooperation funds, the program aims to help 13 municipalities from the Central and Northern provinces, one of the main components being the waste management.
International organizations like UN-Habitat have also worked on waste-related issues. NGOs like the WWF or Endangered Trust advocate for better waste management and while often address waste management in their projects, don’t have a specific action program targeting it. Other forms of external assistance can support local waste related projects through funding as do some international and Mozambican companies through their corporate social responsibility mechanisms.

32
Lately, international cooperation such as the German cooperation (GiZ) or the Belgian Government have pushed towards capacitation of the Mozambican government about Nationally Appropriate Mitigation Actions (NAMA's) (see section 7).
3.4.4 National Strategy for Climate Change Adaptation and Mitigation (NSCCAM) 2013-2025
Mozambique, as a signatory to the United Nations Framework Convention on Climate Change (UNFCCC), has taken some actions to mitigate GHG emissions and adapt its development policies with a view to respond to climate change impacts.
Mozambique is very vulnerable to climate change due to its geographic location in the inter-tropical convergence zone and downstream of many watersheds, its long coastline and the presence of extensive areas with altitude below sea level (as the city of Beira, for instance). Moreover, the high level of poverty, limited investment in advanced technology, and the fragility of infrastructure and health services contribute to its vulnerability and low adaptive capacity, among other factors.
The National Strategy for Climate Change Adaptation and Mitigation, adopted in 2012, aims at integrating the different initiatives, to strengthen institutions, and highlights how climate change is a factor that can prevent the social and economic development of the country. The Strategy stipulates how this can be counteracted by increasing the resilience and development of low-carbon initiatives.
Regarding waste management, the Strategy points to the growth of the urban population which imposes additional challenges that need to take into account the requirements of city dwellers, such as water availability and sanitation, waste management, resilience of fragile ecosystems, which are to be addressed in the process of planning and building new settlements. Without entering into details, the Strategy mentions at several points the necessity to have an effective waste management system.
Within this category are presented strategic mitigation actions that are related to the use, production and transportation of waste.
Management and recovery of waste
Collection and recycling of waste
Construction of landfills
Heat/electricity generation (for industrial use) through waste incineration
Waste disposal at landfills and methane recovery
Several tools are introduced as possibilities to support policies and mitigation measures that will be implemented in Mozambique:
Clean Development Mechanism (CDM)
CDM Programme of Activities
Development of standardized baselines
Sectorial approaches
Nationally Appropriate Mitigation Actions (NAMAs)
Other market mechanisms - emissions trading
Voluntary carbon market
Reducing Emissions from Deforestation and Forest Degradation (REDD+).
The strategy explicitly asks for training to design and implement a NAMA plan for Mozambique. According to the MICOA, the NAMAs must be designed within the framework of the existence of a national inventory, and within the framework of robust sectorial inventories. One of the activities foreseen by the National Strategy is to explore the possibility of elaborating a sectorial NAMA, giving as examples: Transport, Buildings, and Waste.

33
3.5 Summary of the main legislation
As discussed in this chapter, the responsibility of solid waste management mainly rests with MICOA and with the Local Authorities and Municipal Councils. Table 5 below summarizes the basic legislation with focus on the management of solid waste.
Table 5: Summary of main legislation regarding waste management in Mozambique
Legal Framework
Organ of authority
Foundation Important
Articles/Observation Scope
Fundamental Law
Constitution of the Republic (2004)
Assembly of the Republic
It is the Law of Laws (Constitution). Fundamental Law of Mozambique.
Article 90 – enshrines the Right to the Environment.
National
Government Policies
Environmental Policy (Resolution 5/95, 3 August)
Ministers Council
To achieve the goal of ensuring sustainable development and environmental protection.
Essential tool for the creation of the current law of the environment.
National
Strategy for Integrated Municipal Solid Waste Management in Mozambique
Ministers Council
Defines clearly roles and responsibilities to achieve sustainable waste management systems.
In recognition of the seriousness of the problem, gives orientation to all society to improve waste management.
National
Ordinary Laws
Law 20/97, 1st October- Environment Law
Ministry for Coordination of Environmental Action (MICOA)
Assigns the Government to develop and coordinate programmes for sustainable management.
Articles 4, 5, 7, 8. 10. National
Law 2/97 of February 18, Local Government Act
Local Authorities
Assigns Local Authorities the co-responsibility of protecting the environment, ensuring sanitation and quality of life.
Articles 6, 11, 14. Local
Law 11/97 of May 31, Finance Act and Local Government Heritage
Local Authorities
Standardize the Finance and Municipal Heritage, and defines the exercise of powers of the Local Authorities
Articles 3, 4, 13, 25, 35, 36, 37, 70.
Local

34
4 Case Studies
4.1 Maputo
Although much information on Maputo has been presented throughout this document, this case study gives a better insight of the solid waste management situation. The most comprehensive overviews of the waste sector in Maputo can be found in the Plano Director - Gestão de Resíduos Sólidos Urbanos na Cidade de Maputo (Município de Maputo, 2008), hereinafter referred to as the Waste Master Plan, and in Economic Instruments in Solid Waste Management. Case Study Maputo, Mozambique (GIZ, 2012).
4.1.1 Overview
Maputo is the capital and largest city of Mozambique. The 1.1 million inhabitants produce about 1,000 tons of waste per day. As for every Mozambican municipality, solid waste management is the sole responsibility of the Municipality of Maputo with the exception of hazardous waste (MICOA, Environmental Ministry) and biomedical waste (MISAU, Ministry of Health).
Within the Municipality, waste management falls under the responsibility of the Directorate of Hygiene, which is responsible for the execution of collection services, contracting, supervision, and disposal site management. Street sweeping has been handed over to the urban district administrations. The key legal instruments are the Municipal By-law on Solid Waste Management and a set of operational regulations to support its implementation (approved and published in 2008).
An urbanized city center and sprawling suburban areas characterize the city. The city center has approximately 120,000 inhabitants and is the main place for public administration, commerce and institutions. The suburban areas (980,000 habitants) can be divided in the older neighborhoods around the city center and the broader, better-organized settlements further away. The key problem in these areas has been access to collection services.
Box: Maputo Solid Waste Management (SWM) Facts and Figures
1,094,628 inhabitants
Waste generation Inner City: 1.0 kg/pp/d
Waste generation suburban areas: app. 0.5 kg/pp/d
Significant fine fraction (sand and dust) from suburban areas
Total waste production: app. 1,000 tons per day (without fine fraction)
Total costs to collect and dispose of the city’s waste : US$ 5.9 million per year
Collection coverage (households) in 2012: 82%
Private sector service provider for waste collection
120 ton of recyclables per month collected at present
4.1.2 Collection
According to the Municipality, about 850 tons of waste are deposited in the Hulene dumpsite every day, i.e. 25,500 tons per month. The municipal services collect about 2,310 tons per month, the rest being collected by private waste service providers.

35
The current collection system comprises adequate solutions for the different characteristics of the inner city and the suburban areas. Private companies provide the majority of services. The inner city has one contractor to collect rubbish in either plastic bags in the residential areas or in 1.1 cubic meter containers located in public places and along the streets.
The suburban areas have a two-step collection: locally based small scale enterprises, paid by the Municipality, collect the waste twice a week from households (door to door) and transport it to larger containers (usually six to twelve cubic meter containers), which are placed in easily reachable locations close to the main roads. These are then collected by a private company and transported to Hulene, the municipal disposal site.
The two-step collection system started in 2004 with a non-profit association and a micro enterprise from the informal sector performing the first primary collection of solid waste in two suburban districts. These projects have presented an extremely positive model, which is why their expansion to other suburban neighborhoods has been on-going.31
There is a large demand for waste management services due to the municipal law that forces every waste producer with an output larger than 25 kg or 50 liters of waste per day to use a waste management service provider. There are five major players in Maputo city: Interwaste, Enviroserv, Neoquímica and VisaBeira as well as Ecolife, who won the tender for the Municipal waste collection. Those companies do not separate waste upon collection and unload majority of it in the municipal dump. This reduces available recyclable materials. Only a few companies and organizations segregate their waste and force their service provider to direct their recyclable waste to proper final disposal. However, market research indicated willingness of these service providers to collaborate with recycling actors. As an example, a partnership between AMOR and Solua, a waste collection company operating mainly in Maputo, started in 2012. In exchange for a recycling certificate, Solua offers part of the collected recyclables to AMOR’s Ecopoint. This benefits their operation mainly because it reduces the amount of waste needed to be carried by their collection system, and also introduces recycling among the services they provide to clients.
4.1.3 Technical Assistance
The solid waste sector of Maputo has been receiving periodic support from different donors, like the Spanish cooperation before 2002, then the German cooperation with the project AGRESU (Assistance to Solid Waste Management in the Greater Maputo Area), which focused on technical assistance (provided by GIZ) and helped to shape the strategic orientation of solid waste management and extend actual service delivery in Maputo. In 2007, a Municipal Development Program (Pro-Maputo) started with financial backing from the World Bank. This program cooperated closely with AGRESU and a joint approach on solid waste management was designed and implemented. In 2013, a new support program began with support from JICA, the Japan International Cooperation Agency. This support focuses initially on equipment donations and specific training measures and will evolve over the year towards capacity building.
4.1.4 Waste Composition
As seen in Table 6 below, there are significant differences in the waste produced in the different areas of the city. Organic waste represents at least 68% of the weight of the produced waste. According to the Waste Master Plan, Maputo produces around 29.7 ton per day of green waste coming from parks and gardens. The city has 42 official markets, of which 30 are informal
31
@Verdade online - Contratadas 43 micro-empresas para recolha de lixo em Maputo
http://www.verdade.co.mz/ambiente/15166-contratadas-43-micro-empresas-para-recolha-de-lixo-em-maputo

36
markets. These produce about 89.2 ton per day, of which the biggest part is organic waste. More than 7,000 people work in the 17 largest markets of the city.
Table 6: Waste composition in Maputo in percentage (Source: Município de Maputo, 2008)
Inner City Suburban areas,
without fine fraction Suburban areas, with fine fraction
Components (% - Weight)
Paper/cardboard 12.4 5.0 2.1
Rags / leather / rubber 2.3 3.7 1.6
Ferrous / non-ferrous metal 1.8 1.7 0.7
Glass 3.3 2.6 1.1
Soft and Hard Plastic 9.9 8.7 3.7
Thin/Thick organic 68.4 69.0 29.4
Others (hazardous and debris) 1.9 9.2 3.9
Fine fraction (< 10mm) 57.5
4.1.5 Re-use and Recycling
Being the major location for the production of waste within the country, and the closest to the South African recycling markets, Maputo is the city with the highest value chain for recyclables, due to the proximity of processing units. Maputo logically has the largest concentration of recycling actors: all together, they recycle around 120 tons per month. Considering the 1,000 tons per day produced, there is still a great potential for recycling.
AMOR has installed recycling points in Maputo and Matola, and is planning to install an additional Ecopoint in the course of 2014. COMSOL is starting a recyclables only collection in the district of Sommerschield.
4.1.6 Economic Instruments
Several economic instruments have been applied by the Municipality in order to cover the waste management costs:
The monthly waste fee is the most important source of income for financing waste collection and transport in Maputo. When introduced, everybody with an official electricity connection paid a flat fee of roughly US$ 0.8 per month per family. The system has two big advantages: it uses an established revenue collection system covering more than 90% of all households in 2011 and it attaches the waste fee to a basic facility, electricity in this case, which greatly increases the motivation to pay the waste fee.32
With the revision of the fee in 2007, consumption related tariffs were introduced. Linked to energy consumption higher income households paid up to two times more than regular energy consumers. The Municipality, despite significant political and society opposition, successfully defended the logic that energy consumption is a valid social-economic indicator and therefore a suitable reference for waste quantities.
This adjustment of the fee also marked the introduction of the polluter pays principle and social criteria for public tariff setting. As such, non-household waste producers were also included in the same system, but with higher fees. Revenues from both fees increased from US$ 600,000 in
32
GIZ (2012) Economic Instruments in Solid Waste Management. Case Study Maputo, Mozambique.

37
2004 to US$ 4,110,000 in 2012. Significant increases were implemented in 2007 and 2010. An increase planned for 2012 has not yet been introduced.
In 2006, the Municipality introduced a licensing and registration system designed for waste producers who generated too much waste to be allowed to use the public waste collection. The system is called “Proof of Service”. Every non-household waste producer has to register, but only producers with an estimated average of more than five times above the family average (equivalent to 25kg or 50l per day) need to follow the procedures. In this system, the responsibility for waste collection and disposal lies with the actual waste producers. They have to contract a licensed service provider and pay an additional contribution to the city’s cleaning services. The system has been operational since 2008 but its financial contribution is still below expectations. Resistance from the commercial sector and organizational challenges are the main reasons.
The combined revenues from all economic instruments currently (2012) cover about 69% of the total costs. Costs are mainly service provision contracts but also the Municipality’s own expenses for investment, salaries and operational costs of the solid waste sector.
4.1.7 Current Dumpsites and Landfill
Maputo has an official dump for all the waste collected in the city. The dump is located in Hulene, a densely populated district about 10 km from the city center and near the airport. The site has an area of about 17 hectares and a height of solid waste deposited between 6 and 15 m. The dump is open 24 hours a day. The site was opened in the mid 1960s and is supposed to have another 5 years capacity remaining. Nevertheless, Hulene is meant to have closed, as a new landfill should have already opened in 2012, according to the 2008 Waste Master Plan.
Currently between 280 and 350 tons a day are deposited in the dump (estimates of the Municipality are as high as 850 tons per day). Since August 2006, all waste arriving at the dump is weighed using a weighbridge installed there. The machines available are an old bulldozer of 25 tons, and a new one (2004) of 14 tons. They operate about 6 to 8 hours per day depending on the available fuel. The access to the dump was rehabilitated in 2007 to mitigate the negative effects, especially during rainy weather.
The discharge of waste is carried out without much control and with low compression. There is no coverage of dumped waste, which allows the access by waste-pickers to solid waste. These people often complicate the dumping operations while looking for usable materials, such as tires or metal cords. They are often very close or even inside the vehicle at the time of waste discharge.
Even though most of the waste is domestic, commercial and industrial, some clinical and hazardous waste has been noted in the dumpsite. The residents of local neighborhoods complain because of air pollution, flies and other negative factors.
Because of inadequate solid waste collection in Maputo, several places along the streets and ravines suffer from illegal accumulations of solid waste. For example, a large cavity close to Hulene (500 m distance from the dump) was illegally converted into a dumpsite. Not only are the locals and surrounding communities using this site, but also some private companies in waste collection sometimes use it to avoid paying the fee of the official dumpsite.
In 2005 the Mavoco landfill opened for hazardous waste. This landfill is located near the aluminum production factory, Mozal, in the city of Matola. It is operated by a private company under the control of MICOA.

38
4.1.8 New Landfill and Closing of Hulene
The implementation of a landfill for the Greater Maputo area (Maputo together with Matola) is justified because of the current population of the two cities, estimated at about 1.7 to 2.0 million inhabitants. This number will grow considerably over the next 10 years. In this regard, the site for the construction of the new landfill must be within the boundary of Matola Municipality since the city of Maputo does not have enough area to do so, even when considering the areas planned for its extension.
The site has been identified in an area in Matola known as Mathemele. Because of the expected amount of solid waste disposal expected in this new location, the site has to be equipped with technical installations to a considerably high level in order to avoid environmental pollution.
On the basis of a "Feasibility Study for a New Landfill for Greater Maputo Area" which is already finalized, since 2009 the two Municipalities (Maputo and Matola) have been preparing the plan for the construction and operation of the new landfill. It was planned to start operations in the second half of 2010, depending on an agreement that would guarantee funding for its construction.
Hulene will be rehabilitated in three phases:
1. Improvement of operations with the introduction of appropriate equipment to minimize environmental impacts (fires, flies, smells), splitting of the dump with periodic covering of waste with soil, closure of parts already considered completely filled.
2. Complete closure of the dump, including a rehabilitation of its area after the opening of a new landfill (reducing water infiltration, monitoring greenhouse gas emissions).
3. Use proper urban terrain of trash, including methane extraction. One of the suggested ways to rehabilitate Hulene is to transform the current dump site into a waste transfer center. This would avoid the Municipality renegotiating all the contracts signed with private companies, as they would keep on dumping their waste in the same geographical site.
4.2 Beira
4.2.1 Overview
As a Mozambican municipality, the Municipal Council of Beira is responsible for the management of urban solid waste in the city of Beira. The city of Beira has approximately 642,920 inhabitants. As such, Beira is the third largest city of the country, after Maputo and Matola.
4.2.2 Waste Production and Collection
The daily production of waste in Beira is estimated at 350 tons, i.e. about 128,000 tons per year +/- 14%, meaning between 110,080 and 145,920 tons per year. MICOA estimates the production at 162,060 tons per year (see Table 2).
The municipal services collect six days a week about 75% of this waste, i.e. 262 tons of rubbish.
Currently the collection takes place throughout the city, excluding areas not accessible by truck collection. The people dump their waste in containers of six cubic meters, in large drums of 120 liters or in some areas directly on the ground.
There are currently 155 six cubic meter containers, 350 drums of 120 liters, and about fifty locations for direct deposition on the ground. The rate of removal of these containers depends on the filling speed and varies between two to three times per day (for the markets) and three to five times per week. Waste deposited on the ground is removed daily.
39
Two experiences of primary collection funded by two NGOs (ESSOR and Africa70) have been led in two areas inaccessible to vehicles (Chipangara and Munhava Central) but the practice has not been approved yet.
4.2.3 Waste Transport
Beira has seven compactor trucks that are used in the following way: the driver has six assistants to collect waste using big bags and to put it in the truck. The waste is then compacted from three cubic meters to one cubic meter, until it is totally filled. The maintenance of trucks is guaranteed by the municipal technical services.
Beira has seven container loading trucks. The driver has an assistant to support the docking and undocking, and to empty the containers. One cubic meter contains between 200 and 220 kg of waste.
The transport system operates as follows:
There are 30 to 35 drivers, of which 15 are women;
There are four to five compactor trucks making three trips to the dump per day, during the day (11-13 trips/day) and four container-loading trucks making 11 to 13 trips per day;
During night shifts, only compactor trucks are used.
Fuel is regularly paid by the Municipality. Maintenance is done by 60-70 municipal technical staff. Mechanical problems related to the hydraulic system (compactor-trucks) are the most common.
4.2.4 Dumping Site
The current dump is located in Munhava, Matope. It has been in operation since 1972. It is a former rice cultivation site, in an area vulnerable to flooding, with a groundwater table only 1.5 meters deep. The current waste (10 ha) is managed with the occasional help of a bulldozer leveling the waste, pushing it out to the surrounding rice fields
A ten hectare landfill was recently delimitated in Munhava, Vaz to permit the deposit of future waste and to leave the site of the old dump free for the operation of a wastewater treatment plant. However, the area of the new landfill is swampier than the original dump, very close to rice cultivation fields, and has a water table at one meter, even in the dry season. Hence the necessity of a geotextile protection33 that is covering one hectare, and the obligation to deposit waste above the soil level (there is no possibility of "digging" as in other dumps).
Given the relatively small size of the new dump (10 ha in total), the area protected by geotextile (one hectare) would actually serve as a waste reception area, while the waste is then spread to the surrounding rice fields, whose farmers have been compensated. However, given the weakness of the access road to the new dump, the old dump is still being used.
There is a desire to close access of the future landfill to prevent access by any person outside the service; however, this requires significant funding that is not available at the present.
There are few informal dumpsites, and they are only located close to the official dumpsite, and created by drivers wanting to save time.
33
Geotextiles are permeable fabrics which, when used in association with soil, have the ability to separate, filter, reinforce, protect, or drain. http://en.wikipedia.org/wiki/Geotextile.

40
4.2.5 Recycling in Beira - The Case of Terra Nova
Terra Nova is a Mozambican company founded in 2009 by a French agronomist. Terra Nova first evaluated the amount of organic waste as 65% of the amount of waste collected by the Municipality. It then signed a Memorandum of Understanding with the Municipality of Beira, according to which Terra Nova is the owner of the waste collected by the Municipality. For its operation, Terra Nova was given three hectares of land out of the ten hectares of the new landfill: this land includes the one hectare covered with geotextile protection.
Terra Nova receives from the Municipality the collected waste, does the waste separation and transforms the organic waste into compost. The non-organic waste is then taken by the Municipality to the landfill.
In 2011, Terra Nova composted about 2,000 tons of waste and produced 600 tons of organic compost, with a team of 35 people34. It received around nine containers per day (approximately twenty tons) that was sorted and transformed into compost through a pile composting technique. The compost is then bagged into 25 or 50 kg bags and sold to farmers and the Municipality.
In 2012, after having received support from international donors, the project slowed due to human resource issues but has regained its momentum in 2013, with the challenge of convincing farmers and the agriculture sector of the added value of organic compost compared to conventional chemical fertilizer. A strong marketing campaign was launched in March and April 2014 with free distribution of compost and the first results will be available in the course of 2014, revealing whether the project is sustainable or not.
Terra Nova aims to compost at least 9,000 tons of waste per year, producing 2,800 tons of compost per year.
It should be noted that there is currently no composting operation in Mozambique at the scale envisaged by Terra Nova. There are only small plants with a treatment capacity of a few tons per day, but if this innovative model shows its sustainability, it will be replicable in other Municipalities.
4.2.6 Beira Municipality’s Features
The Municipality of the city of Beira has won several prizes for good management and considers waste management as a top priority, more so than many other municipalities in the country.
Projects of the Municipality regarding the collection of waste are meant to reach 100% of waste collection (by improving the access roads and investing in mini-tractors), increase the numbers of containers and trucks, and work closely with micro-enterprises and NGOs.
4.3 Vilankulo35
4.3.1 Overview
The Municipality of Vilankulos is a coastal town situated in the district of Vilanculos, in the southern province of Inhambane. The Municipality is divided into nine bairros (districts) that contain approximately 14,000 households and 50,000 people. Vilankulos is one of the major tourist destinations in Mozambique. It is known for its beaches, fishing, diving, snorkeling and its
34
Personal Communication Terra Nova Limitada, Gildo Husseine, October 2012, Feira do Ambiente. 35
The content of this case study about Vilankulo is mainly taken from the document Feasibility Study: Recycling Run by a Micro-enterprise in Vilankulos, Mozambique, prepared for the Municipality of Vilankulo, and written by Tiffany Hay, in May 2013.

41
proximity to the luxury accommodation and natural beauty of the Bazaruto Archipelago. The high levels of poverty in Vilankulos are a result of rapid population growth in combination with a lack of formal employment, accessible higher education, infrastructure, and fertile land.
4.3.2 Current Situation
High levels of poverty and population growth are putting an increasing strain on the ability of the Municipality to manage environmental problems. One of these problems is increasing volumes of unmanaged waste. The current system of waste collection in Vilankulos includes:
Collection of waste from the two central markets, out of the five markets in Vilanculos;
Collection of waste from 33 containers that are located in three of the towns central districts;
Collection from all of the centrally located and formalized commercial and government institutions;
Collection from the 172 households that have signed-up for waste collection.
It is estimated that Vilanculos produces between 18 and 25 tons of waste per day (MICOA estimates 10 tons per day), of which only 40 to 50% is currently collected by the municipality, and brought to the dump. A new landfill is meant to open in 2014. The new landfill will be further away from the town.
Acknowledging the impact that poorly managed waste has on human and environmental health, the Municipality together with the Italian foundation Centro Cooperazione Sviluppo (CCS) drafted a proposal for a European Union grant. The grant is intended for the financing of a two-year integrated waste management project. The project was approved in the autumn of 2012.
The broad objective of the project is to contribute to a sustainable waste system while having a positive impact on the socio-economic and environmental health of the Municipality. This is to be achieved through extensive training, capacity building, education and community organization. All aspects of the project will be managed by the Municipality and monitored by CCS.
4.3.3 Recycling
There is a strong re-use culture, especially for plastic bottles and cardboard. Plastic bottles are mostly reused to store paraffin, which is used as fuel for lanterns. An integral part of the project is to introduce recycling into the municipal waste strategy. Recycling will be implemented and supported within the public, private and community sector relationship. The program will involve three elements that support recycling:
Source separation – the Municipality will require households with waste pick-up to separate recyclables. This will mean less recyclable raw material will end up in the landfill. The idea is that the Municipality will be able to increase the number of waste collection contracts by merging collection fees into electricity bills, as done in Maputo.
Establishment of a micro-enterprise at the landfill – 10 informal collectors at the landfill will receive appropriate training that will enable them to operate a formalized micro-enterprise. Recyclables will be processed at the landfill and sold into the recyclable raw material market. The EU budget allocates a small fee for trainers and the construction of sorting cells at the landfill site.
Establishment of two “junkshops” – junkshops will be managed by five individuals that belong to environmentally focused community-based organizations which operate in the Municipality. The junkshops will be stalls where individuals can sell recyclable material. The material will then be sold to the microenterprise at the landfill
42
In 2013, the Municipality of Vilankulo signed a Memorandum of Understanding with the Mozambican Association for Recycling (AMOR) and bringing significant changes to the project. AMOR proposed an integrated recycling and waste management, with a recycling center that will receive and treat the waste collected by the municipality.36 Once the recycling center is operational, activities will be initiated on environmental awareness, waste segregation and added value, as proposed in the EU funded project.
Instead of taking the collected waste to the dump - the current scenario - the municipality will take it to AMOR's recycling center, which will operate segregation of waste. Organic waste (65% of waste collected) will be composted.
The recyclable waste (15 to 20% of waste collected) will be conditioned by AMOR and sent for recycling. Waste that cannot be reused (15-20%) will be taken by the Municipality to the landfill. Thus, the final landfill will receive only sanitary waste later, representing between 15 and 20% of waste collected, which will drastically decrease the burden of the Municipality in terms of waste management and transport, and generate substantial savings.
A position will be created for the Municipality for the control of waste flows at the recycling center for AMOR. This position will be the counterpart of the Municipality, which will oversee the arrival of collection trucks, and organize evacuation of non-recyclable materials to the final landfill.
The Memorandum of Understanding signed between the Municipality and AMOR includes (1) the availability of land and the right to use it (DUAT) by AMOR, (2) the responsibility of the Municipality to transport the waste to the recycling center, to evacuate the waste that was not recovered to the final landfill and to provide an employee responsible for the recycling center flows. With the Memorandum of Understanding signed, AMOR, officially backed by the Municipality, will seek funds through public and private donors to raise the necessary amount for the installation of infrastructure and running costs, until self-sustainability is reached.
36
More recently, AMOR has signed a joint development agreement with Carbon Africa to co-develop the establishment of the waste recycling centers in various municipalities in Mozambique, including Vilanculos.

43
5 Emissions from the Waste Sector
5.1 A global overview of emissions from the waste sector
Municipal solid wastes (MSW) are the most visible and troublesome residues of human society. The total amount of MSW generated globally has been estimated at about 1.5 Gt per year and it is expected to increase to approximately 2.2 Gt by 2025. Of the current amount, approximately 300 Mt are recycled, 200 Mt are treated with energy recovery, another 200 Mt are disposed in sanitary landfills, and the remaining 800 Mt are discarded in non‐sanitary landfills or dumps.37
Per capita waste generation and waste treatment systems do vary per region (see Table 7 below). Per capita waste generation, for instances, ranges from an estimated 0.21 tons per year in South-Central Asia and Central America to 0.65 and 0.69 tons per year in North America and Oceania, respectively (per capita waste generation in Mozambique is estimated at 0.2 ton per year - see Table 2 in section 1.2). Similarly, the fraction of municipal solid waste being composted is as high as 15% in Western Europe and negligible in Africa, Central America and Oceania. It should be noted that the data in Table 7 are based on country-specific data from a limited number of countries in each region. In general, there also exist significant uncertainty about waste statistics for many countries.
Table 7: Municipal Solid Waste (MSW) generation and treatment data - IPCC Regional Defaults.38
Region
MSW Generation Rate
39 40
41
(tonnes/cap/yr)
Fraction of MSW disposed to SWDS
Fraction of MSW incinerated
Fraction of MSW composted
Fraction of other MSW management, unspecified
42
Asia
Eastern Asia 0.37 0.55 0.26 0.01 0.18
South-Central Asia 0.21 0.74 - 0.05 0.21
South-East Asia 0.27 0.59 0.09 0.05 0.27
Africa43
0.29 0.69 - - 0.31
Europe
Eastern Europe 0.38 0.9 0.04 0.01 0.02
Northern Europe 0.64 0.47 0.24 0.08 0.2
37
1 Mt = 1 million tons 38
IPCC (2006) Guidelines for National Greenhouse Gas Inventories. Volume 5. 39
Data are based on weight of wet waste. 40
To obtain the total waste generation in the country, the per-capita values should be multiplied with the population whose waste is collected. In many countries, especially developing countries, this encompasses only urban population 41
The data are default data for the year 2000, although for some countries the year for which the data are applicable was not given in the reference, or data for the year 2000 were not available. 42
Other, unspecified, includes data on recycling for some countries. 43
A regional average is given for the whole of Africa as data are not available for more detailed regions within Africa.

44
Southern Europe 0.52 0.85 0.05 0.05 0.05
Western Europe 0.56 0.47 0.22 0.15 0.15
America
Caribbean 0.49 0.83 0.02 - 0.15
Central America 0.21 0.5 - - 0.5
South America 0.26 0.54 0.01 0.003 0.46
North America 0.65 0.58 0.06 0.06 0.29
Oceania44
0.69 0.85 - - 0.15
Treatment and disposal of municipal, industrial and other solid waste produces significant amounts of methane (CH4). GHG emissions associated with the waste sector heavily depend on how waste is treated. The most important sources of emissions in the waste sector are emissions associated with solid waste disposal sites (landfills) and wastewater handling.
Figure 2: Global waste emissions MtCO2eq/year, global waste emissions per GDP and global waste emissions per capita referred to 1970 values (Source: IPCC, 2014)
Figure 2 above presents global emissions from waste from 1970 until 2010. Methane emissions from solid waste disposal almost doubled between 1970 and 2010. The drop in CH4 emissions from solid waste disposal sites (SWDS) starting around 1990 is most likely related to the decrease in such emissions in Europe and the United States.
44
Data for Oceania are based only on data from Australia and New Zealand.

45
Global waste emissions per unit of GDP decreased 27% from 1970 to 1990 and 34% from 1990 to 2010 (see black line in Figure 2 above), with a decrease of 48% for the entire period (1970–2010). Global waste emissions per capita increased 10% between 1970 and 1990, decreased 5% from 1990 to 2010, with a net increase of 5% for the entire period 1970–2010 (see dashed line in Figure 2 above).
Several reasons may explain these trends: GHG emissions from waste in EU, mainly from solid waste disposal on land and wastewater handling decreased by 19.4% in the decade 2000–2009; the decline is notable when compared to total EU27 emissions over the same period, which decreased by 9.3%. The significant decline in emissions from the waste sector in Europe is probably due to the following factors:
Energy production from waste in the EU in 2009 was more than double that generated in 2000, while biogas has experienced a 270% increase in the same period.
With the introduction of the Landfill Directive 10 1999/31/EC, the EU has established a powerful tool to reduce the amount of biodegradable municipal waste disposed in landfills.
Methane emissions from landfills in the United States decreased by approximately 27% from 1990 to 2010. This net emissions decrease can be attributed to many factors, including changes in waste composition, an increase in the amount of landfill gas collected and combusted, a higher frequency of composting, and increased rates of recovery of degradable materials for recycling, e.g., paper and paperboard.
China's GHG emissions in the waste sector increased rapidly in the 1981 to 2009 period, along with the growing scale of waste generation by industries as well as households in urban and rural areas. A 79% increase in landfill methane emissions was estimated between 1990 (2.4 Mt) and 2000 (4.4 Mt) due to changes in both the amount and composition of municipal waste generated.
In India, the waste sector contributed 3% of total national CO2 emission equivalent of which 22% is from municipal solid waste and the rest are from domestic wastewater (40%) and industrial wastewater (38%). Domestic wastewater is the dominant source of CH4 in India. The decrease of GHG emissions in the waste sector in the EU and the United States from 1990 to 2009 has not been enough to compensate for the increase of emissions in other regions resulting in an overall increasing trend of total waste‐related GHG emissions in that period.
5.2 Reported Emissions from the Waste Sector in Eastern and Southern Africa
In order to get a better idea about the emissions in the waste sector in Southern Africa and Mozambique, this study has considered the Greenhouse Gas inventory data of selected countries in Eastern and Southern Africa as provided on the UNFCCC website.45 The data are summarized in Table 8 below.
Table 8: GHG emission data for the waste sector in selected countries in Eastern and Southern Africa in Mg CO2e (Source: UNFCCC)
Solid Waste Disposal on Land
Wastewater Handling Total
Malawi 1990 84,840 5,880 90,720
1994 81,480 8,610 90,090
45
http://unfccc.int/di/DetailedByParty.do

46
Tanzania 1990 348,709 640,038 988,747
1994 348,804 665,622 1,014,426
Mozambique 1990 407,400 4,200 411,600
1994 1,557,990 - 1,557,990
Zimbabwe 2000 1,192,800 237,300 1,430,100
Zambia 1994 374,010 1,041,180 1,415,190
South Africa 1990 14,054,670 401,730 14,456,400
1994 15,156,540 447,930 15,604,470
Figure 3: GHG emissions for the waste sector in selected countries in Eastern and Southern Africa in Mg CO2e (Source: UNFCCC).
A number of observations can be made in relation to the data in Table 8 and Figure 3 above:
South Africa has by far the highest emissions (more than twice the emissions from the other countries combined).
Most of the emissions reported in the waste sector in Malawi, Mozambique, Zimbabwe and South Africa originate from solid waste disposal on land (landfills). In Zambia and Tanzania, most of emissions come from waste water handling. It is not clear whether this difference is due to differences in data collection and accounting systems or whether this is an actual reflection of the situation on the ground.
Tanzania and South Africa show a slight increase in GHG emissions from 1990 to 1994. GHG emissions from the waste sector in Mozambique have almost quadrupled between the 1990 and 1994.
Most recent data are from Zimbabwe. All other countries submitted their last GHG inventory in 1994. Mozambique is currently in the process of updating its GHG data.
Overall, the above observations seem to indicate that there are still a number of uncertainties regarding the accuracy of some of the emission reduction data. This is also an observation made by the IPCC in their Fifth Assessment Report: "The estimation of the past, current, and future emissions, as well as the mitigation potential in the waste sector has many uncertainties, the

47
most important relating to the poor quality of activity data needed for estimation of emissions".46
5.3 Emissions from municipal solid waste in Mozambique
As mentioned in section 5.2 above, the GHG emissions estimations for the waste sector in Mozambique vary considerably between the 1990 and 1994 data. In order to validate the GHG emission estimations that are presented in Mozambique's GHG inventories, the authors have carried out an independent estimation based on different waste generation scenarios using the 2006 IPCC Guidelines for Greenhouse Gas Inventories. Most of the resulting GHG emission estimations turn out to be significantly lower than the ones provided in the GHG inventories prepared by the Government of Mozambique. The authors were not able to evaluate possible differences in methodological approaches and assumptions and hence the differences in estimations could not yet be explained. The differences do indicate however that considerable uncertainties remain with regard to waste generation data and other parameters that affect GHG emissions in the waste sector in Mozambique. Further research and data collection will be required to come up with more accurate estimations in the future. In what follows, a detailed overview is given of the assumptions that were made to estimate the GHG emissions in the waste sector.
5.3.1 Methodology
The GHG emissions calculations focus on emissions from solid waste disposal sites (e.g. dumpsites and landfills) only. Both municipal solid waste and industrial waste are being considered. The calculations do not include emissions from wastewater handling. The calculations are based on the First Order Decay (FOD) method as provided in the IPCC 2006 Guidelines for Greenhouse Gas Inventories. This method assumes that the degradable organic component (degradable organic carbon, DOC) in waste decays slowly throughout a few decades, during which CH4 and CO2 are formed. If conditions are constant, the rate of CH4 production depends solely on the amount of carbon remaining in the waste. As a result emissions of CH4 from waste deposited in a disposal site are highest in the first few years after deposition, then gradually decline as the degradable carbon in the waste is consumed by the bacteria responsible for the decay.
The calculations are largely based on the Tier 1 method, i.e. default activity data and default parameters are mainly used.
The IPCC considers it good practice to use disposal data for at least 50 years as this time frame provides an acceptably accurate result for most typical disposal practices and conditions. As such, by default, the IPCC Waste Model starts the emission calculations from the year 1950 onwards. However, since the Hulene dumpsite in Maputo (the largest dumpsite in the country) only opened in the mid 1960s, this calculation only starts calculating emissions from 1970 onwards because emissions from waste disposal before 1970 were probably negligible. Emissions were estimated up to the year 2030.
5.3.2 Activity data
Activity data consist of waste generation data, waste composition data and data on the fraction of waste disposed to Solid Waste Disposal Sites (SDWS).
Waste generation data
46
IPCC (2014) Climate Change 2014: Mitigation of Climate Change. Working Group III Contribution to the Fifth Assessment Report of the Intergovernmental Panel on Climate Change. Chapter 10 - Industry.
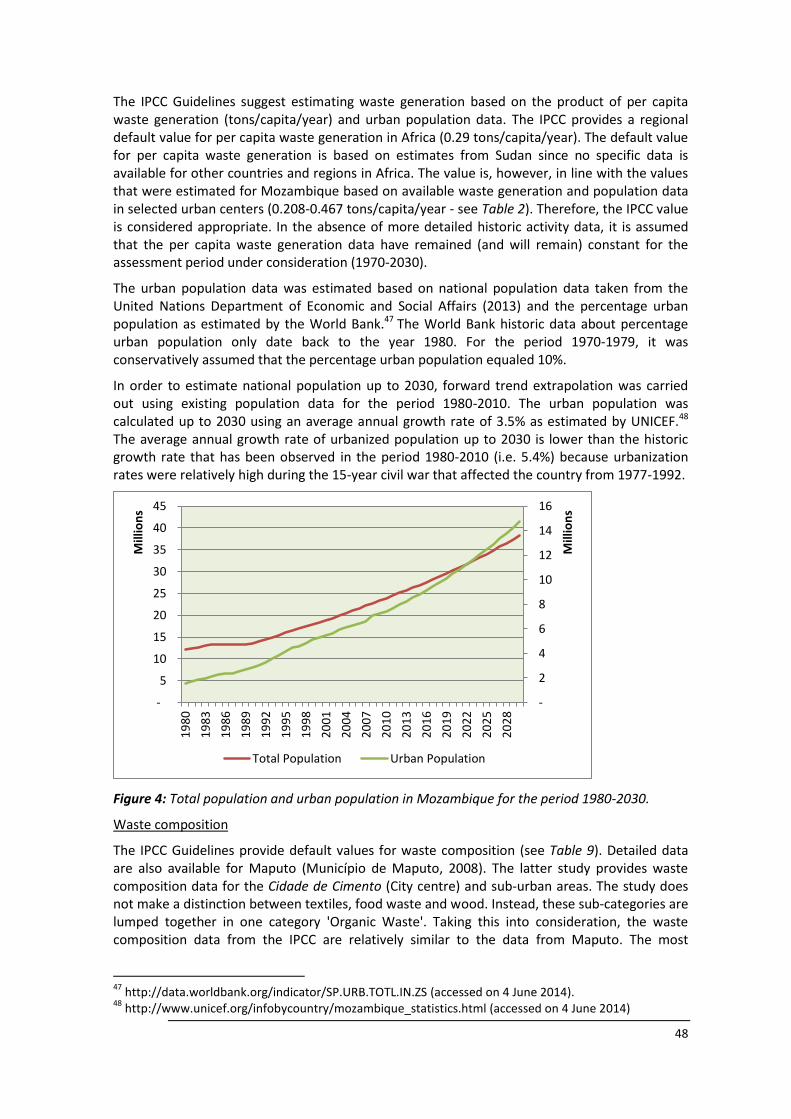
48
The IPCC Guidelines suggest estimating waste generation based on the product of per capita waste generation (tons/capita/year) and urban population data. The IPCC provides a regional default value for per capita waste generation in Africa (0.29 tons/capita/year). The default value for per capita waste generation is based on estimates from Sudan since no specific data is available for other countries and regions in Africa. The value is, however, in line with the values that were estimated for Mozambique based on available waste generation and population data in selected urban centers (0.208-0.467 tons/capita/year - see Table 2). Therefore, the IPCC value is considered appropriate. In the absence of more detailed historic activity data, it is assumed that the per capita waste generation data have remained (and will remain) constant for the assessment period under consideration (1970-2030).
The urban population data was estimated based on national population data taken from the United Nations Department of Economic and Social Affairs (2013) and the percentage urban population as estimated by the World Bank.47 The World Bank historic data about percentage urban population only date back to the year 1980. For the period 1970-1979, it was conservatively assumed that the percentage urban population equaled 10%.
In order to estimate national population up to 2030, forward trend extrapolation was carried out using existing population data for the period 1980-2010. The urban population was calculated up to 2030 using an average annual growth rate of 3.5% as estimated by UNICEF.48 The average annual growth rate of urbanized population up to 2030 is lower than the historic growth rate that has been observed in the period 1980-2010 (i.e. 5.4%) because urbanization rates were relatively high during the 15-year civil war that affected the country from 1977-1992.
Figure 4: Total population and urban population in Mozambique for the period 1980-2030.
Waste composition
The IPCC Guidelines provide default values for waste composition (see Table 9). Detailed data are also available for Maputo (Município de Maputo, 2008). The latter study provides waste composition data for the Cidade de Cimento (City centre) and sub-urban areas. The study does not make a distinction between textiles, food waste and wood. Instead, these sub-categories are lumped together in one category 'Organic Waste'. Taking this into consideration, the waste composition data from the IPCC are relatively similar to the data from Maputo. The most
47
http://data.worldbank.org/indicator/SP.URB.TOTL.IN.ZS (accessed on 4 June 2014). 48
http://www.unicef.org/infobycountry/mozambique_statistics.html (accessed on 4 June 2014)
-
2
4
6
8
10
12
14
16
-
5
10
15
20
25
30
35
40
45
19
80
19
83
19
86
19
89
19
92
19
95
19
98
20
01
20
04
20
07
20
10
20
13
20
16
20
19
20
22
20
25
20
28
Mill
ion
s
Mill
ion
s
Total Population Urban Population

49
important difference is that the IPCC default values assume a higher percentage of inert material (plastic, metals, etc.), whereas the study from the Municipality of Maputo estimates a higher fraction of organic waste. This would result in a possible underestimation of emissions in case the IPCC default values are used. However, the possible underestimation of organic waste in the IPCC default values is most likely compensated by a potential overestimation of the fraction of waste disposed at solid waste disposal sites (see next section).
Table 9: Waste composition - IPCC default data and data for Maputo
Waste type Default percentage49 Percentage for Cidade de Cimento in Maputo50
Percentage for suburban areas of Maputo, without fine fraction51
Paper/cardboard 7.7% 12.4% 5%
Textiles 1.7% - -
Food waste 53.9% 68.4% 69%
Wood 7.0% - -
Rubber/leather 1.1% 2.3% 3.7%
All other, inerts 28.6% 16.9% 22.2%
Total 100% 100% 100%
Fraction of waste disposed at SWDS
The IPCC regional default value estimating the fraction of waste disposed at SWDS in Africa stands at 69%. The value is based on data from Egypt (70%), Sudan (82%), South Africa (90%) and Nigeria (40%). No country-specific data is available for Mozambique. However, based on expert opinion, it is estimated that the actual fraction of waste disposed at SWDS is considerably lower in Mozambique. In 2008, the Municipality of Maputo estimated that the waste collection system at that time covered only about 50% of solid waste from "Cidade de Cimento" and approximately 25% of the suburban areas. Since 2008, the waste collection system in Maputo has improved substantially (see for example GIZ, 2012) but it is unlikely that the waste disposal rates in the entire country are as high as 69% (see also section 1.3). In the absence of consistent country-specific data, the IPCC default was still applied also assuming that the overestimation of waste disposal rates are partly compensated by the underestimation of the fraction of organic waste (see above).
5.3.3 Emission factors and other parameters
Degradable Organic Carbon
Degradable organic carbon (DOC) is the organic carbon in waste that is accessible to biochemical decomposition. The IPCC default values for different types of waste can be found in Table 10 below.
49
IPCC (2006) Guidelines for National Greenhouse Gas Inventories. Volume 5. 50
Município de Maputo (2008) Plano Director - Gestão de Resíduos Sólidos Urbanos na Cidade de Maputo 51
Ibid.

50
Table 10: Degradable Organic Carbon - IPCC Default Values and Ranges.52
Waste type Default Value Range
Food waste 0.15 0.08-0.20
Garden 0.2 0.18-0.22
Paper 0.4 0.36-0.45
Wood and straw 0.43 0.39-0.46
Textiles 0.24 0.20-0.40
Disposable nappies 0.24 0.18-0.32
Sewage sludge 0.05 0.04-0.05
Rubber 0.39 0.39
Bulk MSW waste 0.18 0.12-0.28
Industrial waste 0.15 0-0.54
Fraction of Degradable Organic Carbon which decomposes (DOCf)
Fraction of degradable organic carbon which decomposes (DOCf) is an estimate of the fraction of carbon that is ultimately degraded and released from SWDS, and reflects the fact that some degradable organic carbon does not degrade, or degrades very slowly, under anaerobic conditions in the SWDS. The recommended default value for DOCf is 0.5.
Methane Correction Factor (MCF)
Waste disposal practices vary in the control, placement of waste and management of the site. The IPCC guidelines introduce a so-called CH4 correction factor (MCF), which accounts for the fact that unmanaged SWDS produce less CH4 from a given amount of waste than anaerobic managed SWDS. In unmanaged SWDS, a larger fraction of waste decomposes aerobically in the top layer. In unmanaged SWDS with deep disposal and/or with high water table, the fraction of waste that degrades aerobically should be smaller than in shallow SWDS. Semi-aerobic managed SWDS are managed passively to introduce air to the waste layer to create a semi-aerobic environment within the SWDS. The MCF in relation to solid waste management is specific to that area and should be interpreted as the waste management correction factor that reflects the management aspect it encompasses.
The IPCC distinguishes between five different categories of Solid Waste Disposal Sites (SDWS). The characteristics of the different SDWS categories as well as the associated MCF value are summarized in Table 11.
52
IPCC (2006) Guidelines for National Greenhouse Gas Inventories. Volume 5, Chapter 2, Table 2.4
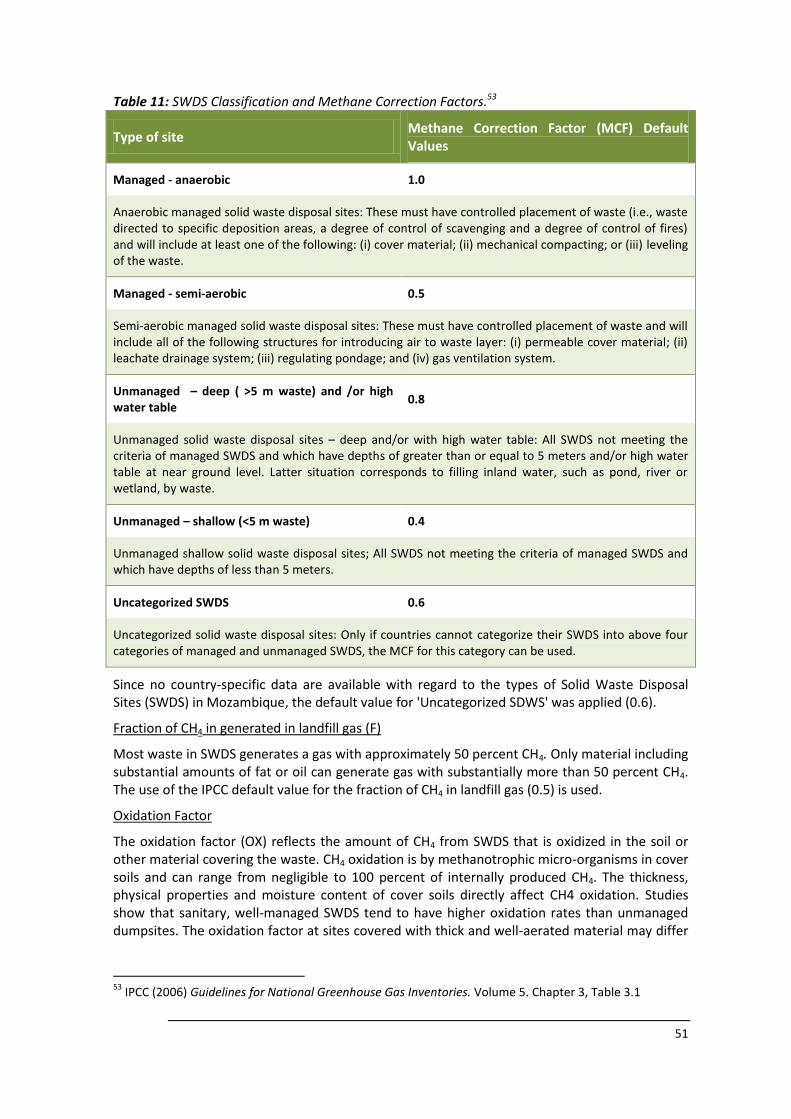
51
Table 11: SWDS Classification and Methane Correction Factors.53
Type of site Methane Correction Factor (MCF) Default Values
Managed - anaerobic 1.0
Anaerobic managed solid waste disposal sites: These must have controlled placement of waste (i.e., waste directed to specific deposition areas, a degree of control of scavenging and a degree of control of fires) and will include at least one of the following: (i) cover material; (ii) mechanical compacting; or (iii) leveling of the waste.
Managed - semi-aerobic 0.5
Semi-aerobic managed solid waste disposal sites: These must have controlled placement of waste and will include all of the following structures for introducing air to waste layer: (i) permeable cover material; (ii) leachate drainage system; (iii) regulating pondage; and (iv) gas ventilation system.
Unmanaged – deep ( >5 m waste) and /or high water table
0.8
Unmanaged solid waste disposal sites – deep and/or with high water table: All SWDS not meeting the criteria of managed SWDS and which have depths of greater than or equal to 5 meters and/or high water table at near ground level. Latter situation corresponds to filling inland water, such as pond, river or wetland, by waste.
Unmanaged – shallow (<5 m waste) 0.4
Unmanaged shallow solid waste disposal sites; All SWDS not meeting the criteria of managed SWDS and which have depths of less than 5 meters.
Uncategorized SWDS 0.6
Uncategorized solid waste disposal sites: Only if countries cannot categorize their SWDS into above four categories of managed and unmanaged SWDS, the MCF for this category can be used.
Since no country-specific data are available with regard to the types of Solid Waste Disposal Sites (SWDS) in Mozambique, the default value for 'Uncategorized SDWS' was applied (0.6).
Fraction of CH4 in generated in landfill gas (F)
Most waste in SWDS generates a gas with approximately 50 percent CH4. Only material including substantial amounts of fat or oil can generate gas with substantially more than 50 percent CH4. The use of the IPCC default value for the fraction of CH4 in landfill gas (0.5) is used.
Oxidation Factor
The oxidation factor (OX) reflects the amount of CH4 from SWDS that is oxidized in the soil or other material covering the waste. CH4 oxidation is by methanotrophic micro-organisms in cover soils and can range from negligible to 100 percent of internally produced CH4. The thickness, physical properties and moisture content of cover soils directly affect CH4 oxidation. Studies show that sanitary, well-managed SWDS tend to have higher oxidation rates than unmanaged dumpsites. The oxidation factor at sites covered with thick and well-aerated material may differ
53
IPCC (2006) Guidelines for National Greenhouse Gas Inventories. Volume 5. Chapter 3, Table 3.1

52
significantly from sites with no cover or where large amounts of CH4 can escape through cracks and fissures in the cover.
The IPCC default value for oxidation factor is zero. The use of the oxidation value of 0.1 is only justified for covered, well-managed SWDS. For the purpose of the current emission estimation, the IPCC default value is applied.
Half-life value and k value
The half-life value (t1/2) is the time taken for the mass of degradable organic carbon in waste to decay to half its initial mass. To model this process, the IPCC's First Order Decay model uses a reaction constant k.
The half-life is affected by a wide variety of factors related with the composition of the waste, climatic conditions at the site where the SWDS is located, characteristics of the SWDS, waste disposal practices and others. The most rapid rates (k = 0.2, or a half-life of about 3 years) are associated with high moisture conditions and rapidly degradable material such as food waste. The slower decay rates (k = 0.02, or a half-life of about 35 years) are associated with dry site conditions and slowly degradable waste such as wood or paper.
Table 12 below provides an overview of different Methane Generation Rates in different climatic zones.
Table 12: Methane Generation Rate (k) values under Tier 1.54
Boreal and temperate climate (MAT≤20°C)
55
Tropical climate (MAT>20°C)
Dry (MAP/PET<1)
56 57
Wet (MAP/PET>1)
Dry (MAP<1000mm)
Wet (MAP>1000mm)
Paper/textiles waste 0.04 0.06 0.045 0.07
Wood/straw waste 0.02 0.03 0.025 0.035
Other (non-food) organic putrescible/Garden and park waste
0.05 0.1 0.065 0.17
Food waste/sewage sludge
0.06 0.185 0.085 0.4
Based on World Bank data, the Mean Annual Temperature in Mozambique is estimated at 24.08 °C and the Mean Annual Precipitation is 1,032 mm per year.58 59 For the purpose of this calculation, the k-values for a 'Tropical climate' with 'Wet' conditions were therefore used.
Methane recovery
54
IPCC (2006) Guidelines for National Greenhouse Gas Inventories. Volume 5, Chapter 3, Table 3.3. 55
MAT = Mean Annual Temperature 56
MAP = Mean Annual Precipitation 57
PET = Potential Evapotranspiration 58
MAT value: http://sdwebx.worldbank.org/climateportal/index.cfm?page=country_historical_climate&ThisRegion=Africa&ThisCCode=MOZ (accessed on 4 June 2014) 59
MAP value: http://data.worldbank.org/indicator/AG.LND.PRCP.MM (accessed on 4 June 2014)

53
CH4 generated at SWDS can be recovered and combusted in a flare or energy device. The recovery of methane can reduce the emissions from SWDS. The IPCC default value for CH4 recovery is zero. This value is considered appropriate for the Mozambican context where no methane is currently being recovered at SWDS.
Delay Time
In most solid waste disposal sites, waste is deposited continuously throughout the year, usually on a daily basis. However, there is evidence that production of CH4 does not begin immediately after deposition of the waste.
At first, decomposition is aerobic, which may last for some weeks, until all readily available oxygen has been used up. This is followed by the acidification stage, with production of hydrogen. After which there is a transition period from acidic to neutral conditions, when CH4
production starts.
The period between deposition of the waste and full production of CH4 is chemically complex and involves successive microbial reactions. Time estimates for the delay time are uncertain, and will probably vary with waste composition and climatic conditions. The IPCC provides a default value of six months for the time delay. This is equivalent to a reaction start time of 1st of January in the year after deposition, when the average residence time of waste in the SWDS has been six months.
5.3.4 Results and uncertainties
Based on the data and parameter assumptions discussed in section 5.3.2 and 5.3.3 above, the emissions associated with the disposal of municipal solid waste at Solid Waste Disposal Sites in Mozambique are calculated and presented in Figure 5. According to the calculations, the emissions in 1990 and 1994 were 228,431 tCO2e and 296,578 tCO2e60 , respectively. This is lower than the emissions that are presented in Mozambique's 1990 and 1994 GHG Inventories and in Mozambique Initial National Communication to the UNFCCC, which amounted to 407,000 tCO2e in 1990 and 1,588,000 in 1994.61 The calculations further estimate that the GHG emissions will amount to 776,546 tCO2e in 2014 and increase to a level of 1,369,721 tCO2e in 2030.
60
A Global Warming Potential of 21 was assumed (i.e. 1 tCH4 = 21 tCO2) 61
MICOA (2003) Mozambique Initial National Communication to the UNFCCC 2003 http://unfccc.int/resource/docs/natc/moznc1.pdf
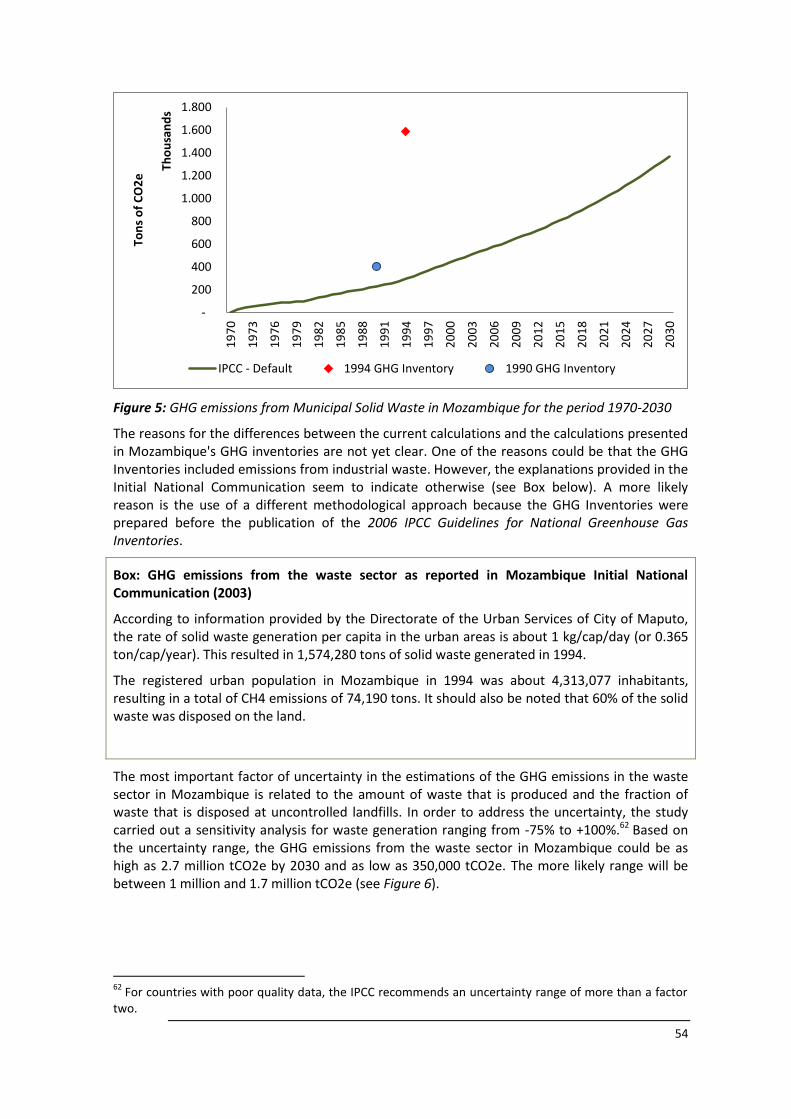
54
Figure 5: GHG emissions from Municipal Solid Waste in Mozambique for the period 1970-2030
The reasons for the differences between the current calculations and the calculations presented in Mozambique's GHG inventories are not yet clear. One of the reasons could be that the GHG Inventories included emissions from industrial waste. However, the explanations provided in the Initial National Communication seem to indicate otherwise (see Box below). A more likely reason is the use of a different methodological approach because the GHG Inventories were prepared before the publication of the 2006 IPCC Guidelines for National Greenhouse Gas Inventories.
Box: GHG emissions from the waste sector as reported in Mozambique Initial National Communication (2003)
According to information provided by the Directorate of the Urban Services of City of Maputo, the rate of solid waste generation per capita in the urban areas is about 1 kg/cap/day (or 0.365 ton/cap/year). This resulted in 1,574,280 tons of solid waste generated in 1994.
The registered urban population in Mozambique in 1994 was about 4,313,077 inhabitants, resulting in a total of CH4 emissions of 74,190 tons. It should also be noted that 60% of the solid waste was disposed on the land.
The most important factor of uncertainty in the estimations of the GHG emissions in the waste sector in Mozambique is related to the amount of waste that is produced and the fraction of waste that is disposed at uncontrolled landfills. In order to address the uncertainty, the study carried out a sensitivity analysis for waste generation ranging from -75% to +100%.62 Based on the uncertainty range, the GHG emissions from the waste sector in Mozambique could be as high as 2.7 million tCO2e by 2030 and as low as 350,000 tCO2e. The more likely range will be between 1 million and 1.7 million tCO2e (see Figure 6).
62
For countries with poor quality data, the IPCC recommends an uncertainty range of more than a factor two.
-
200
400
600
800
1.000
1.200
1.400
1.600
1.800
19
70
19
73
19
76
19
79
19
82
19
85
19
88
19
91
19
94
19
97
20
00
20
03
20
06
20
09
20
12
20
15
20
18
20
21
20
24
20
27
20
30
Ton
s o
f C
O2
e Th
ou
san
ds
IPCC - Default 1994 GHG Inventory 1990 GHG Inventory
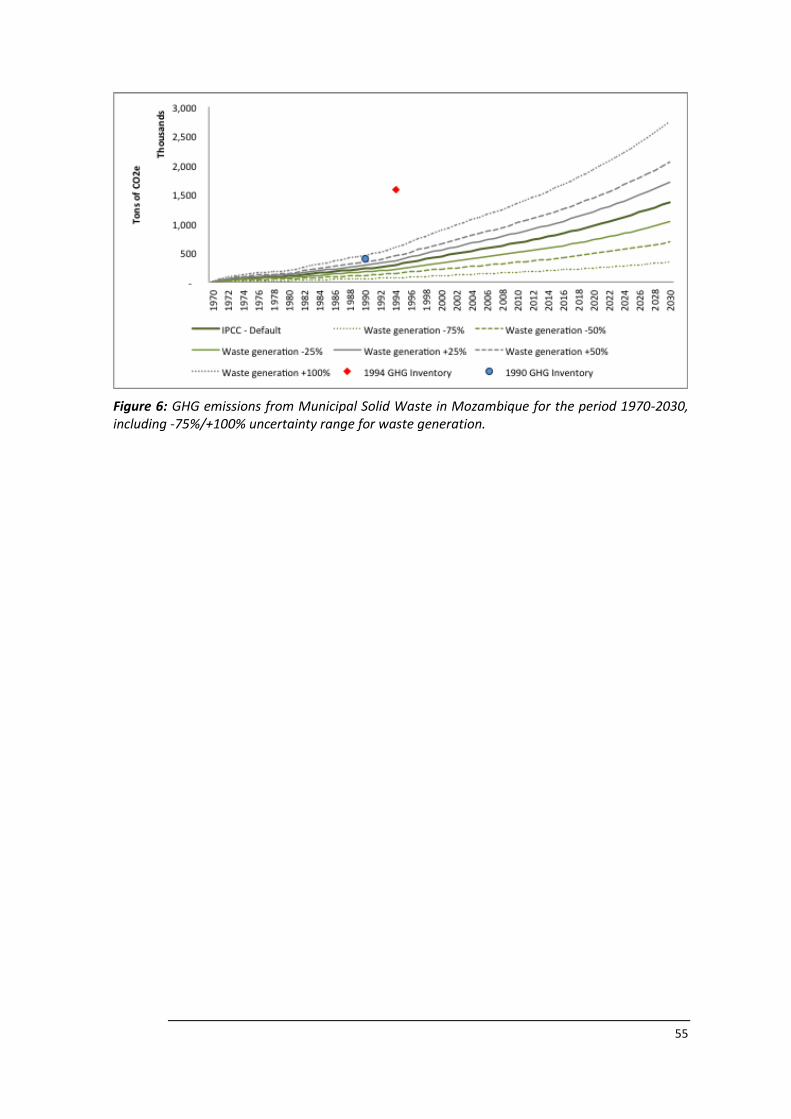
55
Figure 6: GHG emissions from Municipal Solid Waste in Mozambique for the period 1970-2030, including -75%/+100% uncertainty range for waste generation.

56
6 Waste Treatment Options and Opportunities in Mozambique
As discussed in the previous chapters, the waste management sector in Mozambique is facing increasingly more challenges in terms of the collection and treatment of waste. Also, if unabated, the GHG emissions associated with current waste treatment practices in Mozambique are expected to almost double by 2030.
In order to address these issues, the Government of Mozambique has already formulated a number of policies and regulations that provide a framework for the introduction of more sustainable waste management practices in the country (see Chapter Legal Framework and Policies3).
A wide range of mature technologies and options are available to sustainably manage and treat municipal waste streams, while at the same time mitigate greenhouse gas emissions. Figure 7 below provides an overview of the most important waste treatment systems, including landfilling, recycling, composting, anaerobic digestion, incineration and the establishment of Mechanical and Biological Treatment (MBT) facilities.
Figure 7: Overview of different solid waste treatment options and technologies (MBT = Mechanical and Biological Treatment).63
The ‘hierarchy of waste management’ as shown in Figure 8, ranks the different waste management options based on their sustainability and climate impact. The hierarchy places waste reduction at the top, followed by re‐use and recycling. Next in the hierarchy are waste treatment systems with energy recovery (including anaerobic digestion) and treatment without energy recovery (including incineration and composting). The hierarchy also distinguishes between four types of landfills ranging from modern sanitary landfills that treat liquid effluents and also attempt to capture and use the generated biogas, through to traditional non‐sanitary landfills (waste designated sites that lack controlled measures) and open burning. Finally, at the bottom of the pyramid are crude disposal methods in the form of waste dumps (designated or
63
Bogner, J., M. Abdelrafie Ahmed, C. Diaz, A. Faaij, Q. Gao, S. Hashimoto, K. Mareckova, R. Pipatti, T. Zhang (2007), "Waste Management" in Climate Change 2007: Mitigation. Contribution of Working Group III to the Fourth Assessment Report of the Intergovernmental Panel on Climate Change [B. Metz, O.R. Davidson, P.R. Bosch, R. Dave, L.A. Meyer (eds)], Cambridge University Press, Cambridge, United Kingdom and New York, NY, USA.

57
non‐designated waste disposal sites without any kind of treatment) that are still dominant in many parts of the world, including in Mozambique.64
Figure 8: Waste management hierarchy.65
Based on the available waste treatment options presented above, this Chapter proposes a general technology framework for climate-friendly waste treatment in Mozambique. The framework consists of two key pillars and is based on the authors' understanding of the current situation in the Mozambican waste sector as presented in the previous chapters and also taking into consideration the capital requirements of the different technologies. The two pillars include the following:
1. The implementation of sanitary landfills with methane recovery 2. The establishment of Mechanical and Biological Treatment Facilities in the form of
Waste Transfer and Recycling Centers
Each pillar is discussed in more detail in the sections below. As the proposed waste management options are expected to reduce future greenhouse gas emissions, the options might also be eligible for different forms of climate finance. Chapter Nationally Appropriate Mitigation Actions and International Climate Finance will discuss international climate finance as an opportunity to (co-)fund some of the waste management options with a special focus on Nationally Appropriate Mitigation Actions.
6.1 Sanitary landfills with methane recovery
A sanitary landfill is an engineered disposal facility designed, constructed, and operated in a manner that minimizes impacts to public health and the environment. In contrast to open
64
IPCC (2014) Climate Change 2014: Mitigation of Climate Change. Working Group III Contribution to the Fifth Assessment Report of the Intergovernmental Panel on Climate Change. Chapter 10 - Industry. 65
Ibid.

58
dumpsites and controlled dumps, sanitary landfills undergo thorough planning right from the selection of the site up to post-closure management. Thus, although it requires substantial financial resources, it is the most desirable and appropriate method of final waste disposal on land. Figure 9 below shows a typical schematic of a sanitary landfill and its main components.66
Figure 9: Schematic overview of a sanitary landfill (Source: UNEP, 2005b)
As discussed in Chapter 4, the main source of GHG emissions from the waste sector originate from methane that is generated at (uncontrolled) landfill sites. Methane is a major concern for sanitary landfills since it is an explosion hazard if it accumulates. For these reasons, sanitary landfills include gas extraction facilities to collect the gases and, either flare them or recover them for use as an alternative energy source. In fact, according to the IPCC, the implementation of an active landfill gas extraction system is the single most important mitigation measure to reduce emissions. Intensive field studies have shown that >90% recovery can be achieved at landfill cells with final cover and an efficient gas extraction system.67
Various municipalities in Mozambique have started planning the construction and implementation of sanitary landfills (see Section 1.5). However, in most cases, the funding for the establishment of the sanitary landfill has not yet been put in place. As an intermediate and immediate step, municipalities could consider the establishment of controlled dumps. A controlled dump is a non-engineered disposal site where improvement is implemented on the operational and management aspects rather than on facility or structural requirements. The introduction of improved operational and management is typically less costly but can already have immediate results. Controlled disposal of wastes may be implemented over existing wastes (from previous open dumping operations) or on new sites.
It should be noted that the introduction of sanitary landfills and/or controlled landfills will not have a significant impact on the reduction of greenhouse gas emissions, unless methane is captured and flared or used for energy generation. The additional investment needed to capture and flare methane or convert it into energy can possibly be financed through sources of international climate finance (see chapter 7).
66
UNEP (2005) Closing an Open Dumpsite and Shifting from Open Dumping to Controlled Dumping and to Sanitary Land Filling 67
Bogner, J., M. Abdelrafie Ahmed, C. Diaz, A. Faaij, Q. Gao, S. Hashimoto, K. Mareckova, R. Pipatti, T. Zhang (2007), "Waste Management" in Climate Change 2007: Mitigation. Contribution of Working Group III to the Fourth Assessment Report of the Intergovernmental Panel on Climate Change [B. Metz, O.R. Davidson, P.R. Bosch, R. Dave, L.A. Meyer (eds)], Cambridge University Press, Cambridge, United Kingdom and New York, NY, USA.
59
6.2 Establishment of Mechanical and Biological Treatment Facilities in the Form of Waste Transfer and Recycling Centers
Waste Transfer and Recycling Centers (WTRC) are facilities that combine the characteristics of traditional waste transfer centers with the implementation of Mechanical and Biological Treatment Systems.
Traditional waste transfer centers are facilities where municipal solid waste is unloaded from collection vehicles and briefly held while it is reloaded onto larger long-distance transport vehicles for shipment to landfills or other treatment or disposal facilities. By combining the loads of several individual waste collection trucks into a single shipment, municipalities can save money on the labor and operating costs of transporting the waste to a distant disposal site. They can also reduce the total number of vehicular trips travelling to and from the disposal site.68 In the context of Mozambique, it is expected that the establishment of waste transfer centers can create important cost savings as the country is setting up new landfills in locations that are typically further away from the city centers.
A Waste Transfer and Recycling Center (WTRC) is a waste transfer center where recycling activities are carried out on site. In practice this means that once the waste arrives at the facility, the waste will be separated and processed and the recyclables are either transformed on site or transported to recycling units. The part of the waste that is non-recyclable is then transported to the final landfill. As such, Waste Transfer and Recycling Centers are best planned in combination with (sanitary) landfills. Figure 10 provides an overview of potential mechanical and biological treatment processes that can take place at a Waste Transfer and Recycling Center.
68
http://www.epa.gov/osw/nonhaz/municipal/transfer.htm

60
Figure 10: Schematic overview of potential treatment options at a Waste Transfer and Recycling Center. ABT = Advanced Biological Treatment.69
The benefits associated with Waste Transfer and Recycling Centers are manifold. Not only does it increase the efficiency of transporting waste to the final landfill but can also substantially reduce the amount of waste that needs to be transferred to the final landfill. Indeed, with effective recycling facilities on site for organic waste and dry recyclables, only 20-35% of waste will have to be transported to the final landfill. This will not only reduce the overall waste transport costs but will also increase the lifetime of the landfill.
In addition, compared with landfilling, mechanical and biological treatment can theoretically reduce CH4 generation by as much as 90%.70 It should be noted that, in practice, reductions are smaller and dependent on the specific treatment processes employed.
Finally, by putting a value on waste, Waste Transfer and Recycling Centers are a key element in the establishment of a waste value chain. The establishment of a waste value chain will generate additional revenue streams from selling recyclable waste and can create new business opportunities for small-scale entrepreneurs as well as large-scale recycling and energy industries in Mozambique.
The concept of Waste Transfer and Recycling Centers has already been successfully implemented in a number of countries in the world. In South Africa, for example, there are a
69
DEFRA [Department for Environment, Food and Rural Affairs] (2007) Mechanical Biological Treatment of Municipal Solid Waste. 70
Bogner, J., M. Abdelrafie Ahmed, C. Diaz, A. Faaij, Q. Gao, S. Hashimoto, K. Mareckova, R. Pipatti, T. Zhang (2007), "Waste Management" in Climate Change 2007: Mitigation. Contribution of Working Group III to the Fourth Assessment Report of the Intergovernmental Panel on Climate Change [B. Metz, O.R. Davidson, P.R. Bosch, R. Dave, L.A. Meyer (eds)], Cambridge University Press, Cambridge, United Kingdom and New York, NY, USA.

61
number of such stations. The Alton landfill in Mhlathuze Municipality now operates as a transfer station and a drop-off center for organic waste and recyclables. This allows people in the vicinity to continue disposing of garden waste and recyclables at the old landfill site, the new landfill being much further away.
On a larger scale and in a developed country, San Francisco-based Recology, an employee owned waste and resource recovery company, has helped the city of San Francisco divert 80% of its solid waste from landfill.71 Recology processes around 750 tons of recycled items per day at its material recycling facility, which sorts and bales the material into 16 commodities, returns them to the market and keeps them out of landfill. Since 1996 the company has operated a large-scale composting program that takes about 600 tons per day of organic matter turned into compost.
For the establishment of a Waste Transfer and Recycling Center, a relatively large piece of land is needed (although smaller than the piece of land that is needed for a landfill). Since most municipalities will have to close the existing dumpsite in the near future, the land of the existing dumpsite could be reused and transformed into Waste Transfer and Recycling Centers. This would also be in line with the Strategy for Integrated Municipal Solid Waste Management in Mozambique, which requires municipalities to promote the best practices for the rehabilitation and reuse of the existing open rubbish dumps for other uses.72
In the context of Mozambique, the mechanical biological treatment options at Waste Transfer and Recycling Centers could include (1) recovery of recyclable materials, (2) production of compost and (3) the production of Residue Derived Fuel (RDF). The sections below provide an initial screening of the potential for each of these treatment options.
6.2.1 Recyclables
As discussed in Chapter 2, there are already a number of initiatives in Mozambique that are seeking to create value out of recyclable material. Most of the initiatives remain small though. In order to assess the potential for future expansion of recyclables recovery activities, this study has looked at the regional supply chain for recyclable materials. The assessment is based on experience from AMOR and on a business plan study that was prepared for Pagalata Limitada with support from UNDP, the Global Compact and the Mozambican Center for Promotion of Investment (CPI). The assessment focuses on Maputo because it is the largest source of municipal solid waste in the country and because of its proximity to the recycling markets in South Africa. It should be noted that the distance to the recyclable markets is a major barrier for recyclables from municipalities further up-country because the high transportation costs will typically eat away the margins that can be made and will interrupt the value chain before the recyclables can reach their final destination. The issue of transportation of recyclables is not further addressed in this report but will need to be carefully assessed when establishing Waste Transfer and Recycling Centers up-country.
Table 13 provides an overview of the estimated waste production per type of waste producer (domestic, commercial, industrial, markets, etc.) and per waste category. The table also provides recovery targets as percentage of the total recyclable waste.73 Based on the data and figures presented in Table 13, the total realistic supply of recyclable waste in Maputo for the market is estimated at 29,785 ton per year.
71
http://www.waste-management-world.com/articles/2013/05/video---san-francisco-s-recycling-success-a-model-for-the-nation.html 72
MICOA (2012) Estratégia de Gestão Integrada de Resíduos Sólidos Urbanos em Moçambique 73
Recovery targets are estimations of the amount of recyclable waste that can be collected and recovered. The estimations are based on expert judgment and do not represent real targets.

62
Table 13: Estimated amounts of recyclable waste (tons per year) in Maputo that can be recovered and supplied to the recyclables market
Waste Category
Domestic Commercial Industrial
Markets & Fairs
Total Maputo City City Suburbs
Cardboard 3,137 2,773 12,903 3,920 5,566 28,299
Paper 627 693 5,161 1,568 0 8,050
Cans 627 1,387 7,742 784 2,226 12,766
Glass 1,882 4,160 5,161 784 1,392 13,379
Plastic & PET 3,137 12,480 2,581 3,136 2,783 24,116
Other 53,323 117,169 18,064 5,489 15,863 209,908
Total 62,733 138,661 51,612 15,682 27,830 296,518
% recovery targets
25% 10% 50% 60% 20% 10%
Cardboard 784 277 6,452 2,352 1,113 10,978
Paper 157 69 2,581 941 0 3,748
Cans 157 139 3,871 470 445 5,082
Glass 470 416 2,581 470 278 4,216
Plastic &PET 784 1,248 1,290 1,882 557 5,761
Total 2,352 2,149 16,774 6,116 2,393 29,785
Domestic waste: Domestic recyclable waste can be further divided into urban and suburban:
Urban: In this sub-segment recyclable waste production is estimated to be only about 15% of overall waste produced. Assuming a 25% recovery target, a total recyclable waste potential of 2,352 tons per year can be calculated for urban areas.
Suburban: For suburban domestic waste, 16% is estimated by the Municipal Council to be recyclable and 10% is considered accessible for collection, assuming agreements with the micro-companies responsible for primary collection at the suburban neighborhoods level (also see section 4.1). This leads to an estimated relevant recyclable waste potential of 2,149 tons per year.
Commercial and industrial: These segments are the most attractive to the recycling expansion strategy since large proportions of waste are recyclable (about 65% estimated) and, to a great extent, accessible. However, to be realistic, only 50% to 60% of waste estimates were considered as accessible for recovery.
Markets and fairs: According to the municipality, Maputo city has more than 40 markets (including informal). Apart from organic waste, these generate significant amounts of cardboard and plastic (about 33% of total waste), which can be accessible to the recycling center if collection containers are effectively located. However, only 20% of the recyclable waste
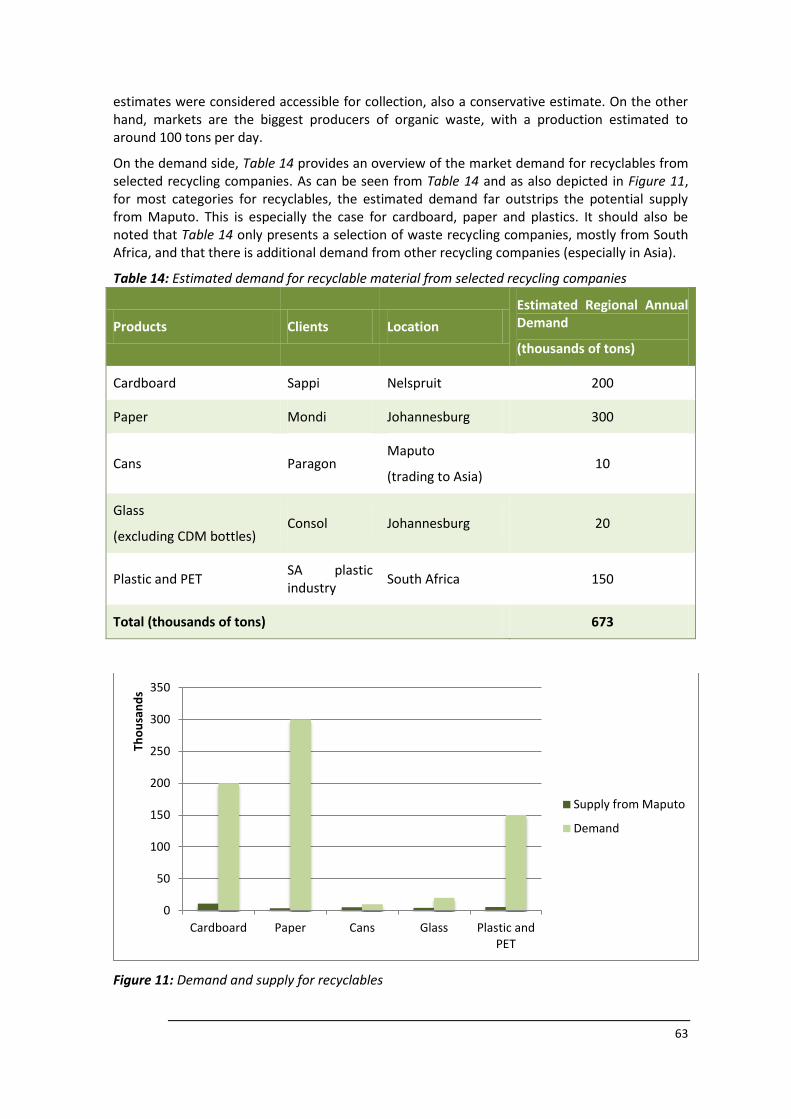
63
estimates were considered accessible for collection, also a conservative estimate. On the other hand, markets are the biggest producers of organic waste, with a production estimated to around 100 tons per day.
On the demand side, Table 14 provides an overview of the market demand for recyclables from selected recycling companies. As can be seen from Table 14 and as also depicted in Figure 11, for most categories for recyclables, the estimated demand far outstrips the potential supply from Maputo. This is especially the case for cardboard, paper and plastics. It should also be noted that Table 14 only presents a selection of waste recycling companies, mostly from South Africa, and that there is additional demand from other recycling companies (especially in Asia).
Table 14: Estimated demand for recyclable material from selected recycling companies
Products Clients Location
Estimated Regional Annual Demand
(thousands of tons)
Cardboard Sappi Nelspruit 200
Paper Mondi Johannesburg 300
Cans Paragon Maputo
(trading to Asia) 10
Glass
(excluding CDM bottles) Consol Johannesburg 20
Plastic and PET SA plastic industry
South Africa 150
Total (thousands of tons) 673
Figure 11: Demand and supply for recyclables
0
50
100
150
200
250
300
350
Cardboard Paper Cans Glass Plastic andPET
Tho
usa
nd
s
Supply from Maputo
Demand

64
As the data clearly show, there exist substantial market potential for expanding the recovery of recyclables from municipal solid waste in Maputo. Further studies will be required to assess in more detail the costs associated with the recovery, processing and sales of the recyclable waste. The assessment of the potential in other key municipalities in Mozambique will also need to evaluate the transportation costs based on the proximity of markets for recyclables.
6.2.2 Composting
Composting has always existed on every field and forest floor, and intuitively it makes sense to compost the organic fraction of the municipal solid waste stream.
The production of compost out of organic municipal waste has two major benefits: firstly it significantly reduces the final volume of municipal waste (as an estimated 60% of Mozambican municipal waste is made out of organic material) and secondly it provides a product that improves and restores the soil fertility, potentially contributing to improved agricultural productivity as well as better resilience to climate variability.
The use of compost for land applications seems to be particularly relevant in many African countries where agriculture constitutes an important part of annual Gross Domestic Product (GDP) and where soils have been severely degraded over the last couple of decades. Africa’s land degradation problems can be attributed to many causes, but analysts generally agree that a fundamental contributing factor has been the failure by most farmers to intensify agricultural production in a manner that maintains soil fertility. It is widely agreed that compost and organic fertilizers, where they are available, can and should be an integral component of soil fertility management strategies, mainly because of their soil enhancing and water retention capacities.
Compost increases soil fertility by holding and gradually releasing nutrients and building up organic matter levels in the soil. Composting also improves the water holding capacity of the soil and makes crops better able to survive droughts and floods.74 Thus, in a highly vulnerable country such as Mozambique, the application of compost will increase the resilience of small-scale farmers to climate variability.
Despite its clear advantages and benefits, experience has also shown that many composting schemes have failed in the past on account of inappropriate technologies, lack of markets for the product and weak business models.75 The potential for composting should therefore be carefully assessed on a case-by-case basis. Useful guidelines and lessons learn exist from various parts of the world.76 There are also a number of successful examples of composting projects and businesses in Africa (see Table 15). In addition, numerous financial viable composting operations exist in India and other countries in Asia.
Table 15: Examples of successful composting projects in Africa
Compost project Country Description
Reliance Compost77 South Africa Reliance is based in Cape Town, focuses solely on composting and has large scale operations, with
74
http://www.fao.org/docrep/009/a0100e/a0100e07.htm 75
Waste Concern (2006), Decentralised Composting for Cities of Low- and Middle-Income Countries. A User's Manual. 76
See for instance Government of Canada (2013) Technical Document on Municipal Solid Waste Organics Processing; Rytz, I. (2001) Assessment of a Decentralised Composting Scheme in Dhaka, Bangladesh. Technical, Operational, Organisational and Financial Aspects. EAWAG/SANDEC, Waste Concern; Zurbrügg, C., S. Drescher, A. Patel, H.C. Sharatchandra (2004), "Decentralized composting of urban waste - an overview of community and private initiatives in Indian cities" in Waste Management, 24, pp. 655-662. 77
http://www.reliance.co.za/aboutus.html
65
more than 9 million cubic metres of municipal organic waste diverted from landfills over the last 15 years.
Oricol Environmental Services
South Africa
Oricol is a mid-sized company that provides a suite of collection, recovery and treatment services including composting of organic and green waste, some of which is from municipal sources. The company processes 18,500 tonnes of organic waste per year, is profitable and has recently attracted equity investors to fund its expansion.
Avenor78 Ghana Avenor is located in Accra and has a pilot facility that is reportedly commercially successful at a small scale.
Soil and More79 Various
Soil and More is a Dutch company established in 2007 with composting operations in several African countries and in India and Mexico. Soil and More report the sustained viability of their approach to small-scale composting in developing countries.
In Mozambique, the value chain for compost has not yet matured and there is no hard data available regarding market size and prices. The study, therefore, carried out a number of preliminary interviews and assessment.
In the area around Maputo, initial discussions with a number of large-scale farmers and agribusinesses show that a number of farmers are already importing compost from South Africa at a price of 150 USD/ton. However, most farmers complain about the hassle of importing the compost and the delays that often occur at the border.
The price mentioned by large-scale farmers and agribusinesses is similar to other price indications that have been encountered in Mozambique. Street vendors in Maputo are selling 50 kg bags of compost at a price of 200 MZN. This is equal to a price of approximately 130 USD per ton.80
The study also conducted interviews with a number of small-scale farmers and agricultural shops in the periphery of Maputo. A dozen of small-farmers from three different farmers associations (Associação Luisa Diogo, Associação 25 de Junho, Associação Janet Mondlane) as well as four small-size agricultural shops (Tecap, Soluções Rural, Procampo, Twiga Chemicals) were interviewed.
The findings have to be understood in the context of urban and peri-urban agriculture with high poverty rates, small pieces of land (on average 25 m² per farmer) and intensive production. Farmers in the urban periphery prefer to plant rapid-growing vegetables such as cabbage and lettuce, which reach maturity in 30 to 45 days, in order to sell them regularly. As such, there is very few crop rotation which lead to highly damaged soils.
78
http://mci.ei.columbia.edu/files/2013/03/Assessment-of-the-Avenor-Pilot-Community-Composting-Facility-and-Its-Adaptability.pdf 79
http://www.soilandmore.com/index.php/Composting 80
Exchange rate: 1 USD = 30 MZN

66
The interviews showed that the majority of small-scale farmers confuse the use of organic compost, chemical fertilizers and manure. Most interviewed farmers responded that composting is not well known among farmers.
In the field it was noticed that none of the small-scale farmers produce their own compost, choosing to buy fertilizer rather than entering into a three months compost production process. Similarly, farmers would prefer to buy compost rather than producing themselves, and eventually would prefer buying it on a kg basis rather than in 25kg bags.
The four agricultural shops interviewed are only selling few quantities of compost because compost is not well known by small-scale farmers (which constitute their main market). The sellers themselves have little knowledge about compost use. One of the proposed ways to make people aware of the benefits is to use demonstration fields and work closely with the municipal agricultural workers supporting the farmer associations.
Overall, it is clear that compost production (both from municipal waste and from other organic sources) and consumption are still very much limited and even though composting is obviously not a panacea to today’s waste management problems, it should be considered as an important component within most integrated municipal waste management strategies because of its ability to transform large amount of organic waste into value-added products.
6.2.3 Waste to energy
The conversion of solid waste into briquettes (or pellets) provides an alternative means for environmentally safe disposal of organic waste. Briquetting of municipal solid waste involves the processes of segregating, crushing, mixing high and low heat value organic waste material and solidifying it to produce fuel pellets or briquettes, also referred to as Refuse Derived Fuel (RDF).
The briquetting process is essentially a method that condenses the waste or changes its physical form and enriches its organic content through removal of inorganic materials and moisture. The calorific value of RDF briquettes ranges between 2,000-4,000 kCal/ kg depending upon the percentage of organic matter in the waste, additives and binder materials used in the process.81 In comparison, the calorific value of raw Municipal Solid Waste (MSW) is around 1,000 kCal/kg and of furnace oil is around 9,651 kCal/kg.
MSW is a poor-quality fuel and its pre-processing is necessary to prepare RDF to improve its consistency, storage and handling characteristics, combustion behavior and calorific value. In general, pre-processing and production of RDF take places through the following processes:
Separation of waste at source;
Sorting or mechanical separation;
Size reduction (shredding, chipping and milling);
Separation and screening;
Blending;
Drying and pelletising;
Packaging; and
Storage.
There are two approaches for the production of RDF:
Mechanical Biological Treatment plant; and
Dry Stabilisation Process.
In a mechanical biological pre-treatment plant (MBT) (see Figure 10), metals and inerts are separated out and organic fractions are screened out for further stabilisation using composting
81
http://www.bioenergyconsult.com/tag/briquettes/ (accessed on 20 June 2014)

67
processes, either with or without a digestion phase. It also produces a residual fraction, which has a high-calorific value as it is composed mainly of dry residues of paper, plastics and textiles.
RDF can also be produced through a ‘dry stabilisation’ process, in which residual waste (minus inerts and metals) are effectively dried (and stabilised) leaving the residual mass with higher calorific value and suitable for combustion.
The quantity of RDF produced per ton of MSW varies depending on the type of collection, treatment process and quality requirement. According to a report from the European Commission, RDF production from MSW can vary between 23 and 50% of waste processed depending on the treatment process used and country.82 In comparison, other surveys have quoted a recovery range varying from 55 to 85%.83
Various qualities of fuel pellets can be produced, depending on the needs of the user or market. A high quality of RDF briquette should have a high heating value, and lower values for moisture and ash contents. RDF briquettes can be considered for various applications, including:
Cement kilns
RDF-based power plants
Co-firing in a coal-fired power plant
As fuel for industrial steam/heat boiler
Institional and household cooking stoves
In the context of Mozambique, Cimentos de Moçambique could be considered as a potential off-taker for RDF briquettes. Cimentos de Moçambique operates as a subsidiary of Cimentos De Portugal (CIMPOR), SGPS, S.A., a cement group present in nine countries all over the world with a cement capacity of 38 Mt per year. Today, Cimentos de Moçambique mainly uses natural gas or coal as fuel in the fabrication process. Synergies could be found with the Municipalities of Maputo and Matola to use municipal waste as an alternative fuel. In Brazil, CIMPOR's João Pessoa plant has already been co-processing alternative fuels and raw materials such as used tires and waste from the footwear industry.
For RDF briquettes to be used in the cement industry, the briquettes will need to meet certain quality standards. Various countries have adopted special RDF briquette standards for the cement sector (see for instance Table 16). Currently, there are no national standards in Mozambique for RDF briquettes.
Table 16: RDF specifications for cement plants in Sweden84
Parameter Criteria
Calorific value 23.9 - 31.4 MJ/kg
Flash point < 21°C
Specific density at 15°C 0.9-1.1 kg/dm3
Viscosity Pumpable
82
European Commission (2003) Refuse Derived Fuel, Current Practice and Perspectives. Final Report. Directorate General Environment 83
Environment Agency (2001) Solid Recovered Fuels in Cement and Lime Kilns – An International Perspective. R&D Technical Report P4-087/TR/1 84
European Commission (2003) Refuse Derived Fuel, Current Practice and Perspectives. Final Report. Directorate General Environment

68
Ash content 5-10%
Water < 30%
Cl < 1%
Cr < 300 ppm
Zn < 2,000 ppm
Cd < 10 ppm
Pb < 350 ppm
Apart from the cement sector, another potential market for RDF briquettes in Mozambique can be households and institutions (schools, hospitals, prisons, etc.). Currently, a large majority of households in Mozambique rely on biomass for cooking purposes, both in the form of firewood and charcoal.
The high reliance on biomass resources is putting increasing pressure on forest areas in the country and according to a report prepared by the European Energy Initiative Partnership Dialogue Facility the situation in some regions is becoming critical and irreversible damages are being caused to forest resources.85
Experience with use of briquettes in Mozambique is very limited though. Up to present, there have been only a handful pilot and experimental projects which tried to implement these technologies. The Mozambican Directorate of National Rural Extension tried to develop a pilot project for the Maputo periphery. The logic was that being Maputo a big demand area, a briquette solution would fit very well into the efforts to provide more affordable biomass solutions to the growing Maputo charcoal consumer base and surroundings. Unfortunately, the planning behind this initiative was not properly done and the end result was that a machine was bought and no feedstock is being sourced for briquette production.86 New initiatives that target household and institutional consumers will have to take into consideration the lessons learned from this and other pilot and experimental projects.
6.3 Policies and Regulations
To allow for the successful implementation of sanitary landfills in combination with mechanical and biological treatment facilities for recycling, a number of policies and regulations will need to be considered.
6.3.1 Introduction of Proof of Service for Large Waste Producers
As discussed in section 6.2.1, large waste producers (commercial, industrial, markets, etc.) produce significant amounts of recyclable waste that are easily accessible. As such, large waste producers constitute an important target for policies and regulations that promote recycling and sustainable waste management practices.
In 2006, the Municipality of Maputo already started with the introduction of a licensing and registration system designed for waste producers who generated too much waste to be allowed to use the public waste collection. The system is called “Proof of Service”. Every non-household waste producer has to register, but only producers with an estimated average of more than five
85
EUEI PDF (2012) Mozambique Biomass Energy Strategy. 86
EUEI PDF (2012) Mozambique Biomass Energy Strategy.

69
times above the family average (equivalent to 25kg or 50l per day) need to follow the Proof of Service procedures. Above this limit the responsibility for waste collection and disposal lies with the actual waste producers who has to contract a licensed service provider and pay an additional contribution to the city’s cleaning services. The system is operational since 2008 but its implementation is still below expectations. Resistance from the commercial sector and organizational challenges are the main reasons. Here stronger political commitment and more public awareness would be required.87
6.3.2 Separation at Source
The separation of waste at source is essential from the perspective of reduction and recovery of materials, since in addition to diverting waste from undifferentiated collection circuit, reduces contamination of materials by eliminating the mixture;
The identification and definition of types of waste to be recovered should be regulated in order to ensure a necessary segregation without being too demanding. The separation should be simple and compatible with the fates of recovery, which may include the following materials:
Glass;
Paper and cardboard;
Metal;
Plastics; and
Organic waste.
Economic incentives can also be considered to incentivize large waste producers to separate at source by allowing them to deduct recycled quantities from the total waste quantities and, as such, reduce the waste collection fee.
6.3.3 Licensing of Private Waste Management Operators
Despite collection by private operators is already happening, their regulation is not yet properly defined in most municipalities, which implies risk situations for all involved. Thus, the licensing of private operators of collection should be reviewed in order to ensure a service under the conditions required by the Municipal Council and minimum standards of quality and safety for residents.
6.3.4 Calculation of Waste Fees Based on Cost Recovery
In most municipalities in Mozambique, the waste fees that are charged by municipalities fall far short of the actual costs that need to be incurred to offer proper waste management services. In Chimoio, for instance, supermarkets are reported to pay 25 MZN (less than 1 USD) per month for waste collection.88 This is far below the actual cost. In order to address this situation, more accurate calculations have to be made to estimate actual municipal waste management costs and to assess appropriate fee structures.
87
GIZ (2012) Economic Instruments in Solid Waste Management. Case Study Maputo, Mozambique. 88
Personal communication Stephane Temperman, President of the Mozambican Association for Recycling (AMOR). In March 2014, AMOR visited 10 municipalities in Mozambique. All municipalities expressed the need to update waste fees.
70
7 Nationally Appropriate Mitigation Actions and International Climate Finance
7.1 Introduction
International climate finance refers to financial resources mobilized nationally and internationally to assist developing countries mitigate and adapt to the impacts of climate change. In general, a distinction is made between climate finance for adaptation (adapting to the impacts of climate change) and climate finance for mitigation (reducing greenhouse gas emissions or avoiding them to limit climate change).
In the context of the waste sector in Mozambique, climate finance could be applied for co-financing the development and implementation of measures that reduce GHG emissions in the waste sector, including some of the measures that have been discussed in Chapter 6 above. Figure 12 illustrates the GHG emissions in a business-as-usual scenario versus a hypothetical scenario in which a 50% of solid municipal waste is diverted away from landfills is diverted away from landfills and recycled by the year 2030. As can be seen from Figure 12, GHG emissions in the 50% target scenario would peak in 2025 and would result in a reduction of slightly more than 400,000 tCO2e in 2030 and a total of more than 2 million tCO2 in the period 2015-2030.
Figure 12: GHG emissions in the waste sector in Mozambique for a business-as-usual scenario and a scenario in which 50% of the waste is diverted away from landfills by 2030.
Under the UNFCCC process, Nationally Appropriate Mitigation Actions (NAMAs) are positioned as one of the main vehicles for financing mitigation action in developing countries in the future. It is expected that a considerable amount of climate financing pledged for the years to come will be made available through the co-funding of NAMAs by international, bilateral or multilateral donors.
This Chapter will provide a brief introduction to the NAMA concept and present some examples of NAMA initiatives in the waste sector that are currently under development in different parts of the world. The chapter will also give an overview of existing sources of international climate finance that could potentially be tapped into for financing low-carbon waste management activities in Mozambique. The chapter does not pretend to be all-inclusive (the Chapter will for instance not discuss the Clean Development Mechanism and carbon market opportunities) and
-
50
100
150
200
250
300
350
400
450
-
200
400
600
800
1.000
1.200
1.400
1.600
20
10
20
11
20
12
20
13
20
14
20
15
20
16
20
17
20
18
20
19
20
20
20
21
20
22
20
23
20
24
20
25
20
26
20
27
20
28
20
29
20
30
Tho
usa
nd
s
Ton
s o
f C
O2
e Th
ou
san
ds
50% target Business as usual Emission Reductions
Introduction of 50% target.

71
for a more comprehensive overview of international climate finance the reader is referred to other reports and documentation.
7.2 Nationally Appropriate Mitigation Actions
There is no formal guidance on what constitutes a NAMA other than its definition from the 13th Conference of the Parties (COP 13) to the United Framework Convention on Climate Change (UNFCCC) in Bali in 2007 that introduced NAMAs as “nationally appropriate mitigation actions by developing country parties in the context of sustainable development, supported and enabled by technology, financing and capacity building.” Since the introduction of the NAMA concept, a number of NAMA characteristics have emerged:
Unlike the Clean Development Mechanism (CDM), NAMAs do not result in tradable emission reductions that can be sold on a market. In its current applications, NAMA funding rather resembles ODA type funding and it is subject to the criteria and processes of the funding entity.89
NAMA funding does not necessarily occur ex post against verified results (like the Clean Development Mechanism) but the funding can also be made available in advance (before the actual emission reductions have been achieved) to mobilise capital investments.
While climate finance donors express that funding is tied to the level of ambitions displayed by the host country there are no formal requirements, guidelines or methodologies on how to set and establish the ambition level.
Funding for NAMAs is diverse and different financial instruments can be designed and tailored to the needs of the mitigation activities. After 2020, most funding is expected to come from the newly established Green Climate Fund (GCF - see section 7.4.1).
Activities and actions under a NAMA are varied and range from project based mitigation actions to economy-wide emission reduction initiatives. They address a variety of sectors including transport, energy, waste, industry, buildings, forestry and agriculture. In addition, NAMAs cover activities varying from drafting low carbon development strategy (LCDS) to creating plans for introducing certain policies and promoting certain types of projects.
While no formal requirements exist, NAMA proposals must fulfil certain quality criteria in order to attract funding. Among the key elements of NAMAs are that they are government led, foster national sustainable development, have a national or sectoral character and comply with a Monitoring, Reporting and Verification system in case the NAMA is financed by international sources.90
In a Global NAMA Financing Summit - the first of its kind - hosted by CCAP and the Danish Ministry of Climate, Energy, and Building in May 2013, potential NAMA supporters also expressed the need for NAMAs to pursue long-term transformation of sectors, and to include financial mechanisms that ‘leverage’ international support and private sector investments.91
89
Some discussions are going on to establish so-called “Credited NAMAs”. However, at the moment, there are no practical examples of Credited NAMAs and there is no market where the NAMA credits could be sold. 90
UNFCCC secretariat: NAMAs and market- and non-market mechanisms. Presentation given in Bonn, 8 October 2013 at workshop on the new market mechanism, available at http://unfccc.int/cooperation_support/market_and_non-market_mechanisms/items/7712.php 91
Mitigation Momentum: Status Report on Nationally Appropriate Mitigation Actions (NAMAs), Mid-year update June 2013, page 14, available at http://nama-database.org/images/5/5c/Mitigation_Momentum_Status_Report_JUNI2013.pdf

72
In the context of Mozambique, the first important steps towards the formulation of NAMAs have already been taken. In December 2013, a first training on NAMAs was organized during which priority actions were identified. In February 2014, a national workshop on climate finance was organized with support from the Climate Change Service of the Belgium Federal Government. The workshop focused on the waste sector and on green charcoal for cooking.92
Mozambique is currently also in the process of updating its Greenhouse Gas Inventory for submission to the UNFCCC and is receiving support from the Portuguese Carbon Fund for the development and implementation of a low carbon development strategy.
7.3 NAMAs in the Waste Sector
Since the introduction of the NAMA concept, a number of countries have started the formulation of NAMAs in the waste sector. Some NAMAs have already been registered in the NAMA Registry, which is established under the UNFCCC and helps record NAMAs to facilitate matching finance, technology and capacity building support for their implementation. The registry also helps fasten mitigation action in developing countries and support by developed countries. This is particularly crucial for so-called Supported NAMAs, which seek international support. Some of the waste management NAMAs that are currently registered in the NAMA Registry are provided in Table 17 below:
Table 17: Waste Sector NAMA's (Source: UNFCCC NAMA Registry, accessed on 24 June 2014)
Party Title Sector Type of Item
Jordan Rehabilitation of Al-Akaider Landfill
Waste management NAMA seeking Support for Preparation
Jordan NAMA for national domestic waste management
Waste management NAMA seeking Support for Preparation
Dominican Republic
Tourism and Waste in the Dominican Republic
Waste management, and Energy supply
NAMA seeking Support for Implementation
Chile
National Program for Catalyzing Industrial and Commercial Organic Waste Management in Chile
Waste management NAMA seeking Support for Implementation
Dominica Low Carbon Climate Resilient Development Strategy
Agriculture, Forestry, Transport and its infrastructure, Waste management, Energy supply, Residential and Commercial buildings, Industry
NAMA seeking Support for Implementation
92
http://www.climat.be/fr-be/mediatheque/presentations/workshop-climate-finance-mozambique/
73
Dominican Republic
NAMA in cement/Co-processing and Waste Sector
Waste management, Industry
NAMA seeking Support for Implementation
Not all the NAMAs that are under development worldwide are registered in the UNFCCC NAMA Registry. Another source of information about NAMAs that are being developed can be found in the NAMA Database, an “open access wiki” intended to compile information for all supported NAMAs for which public information is available. To date, according to the NAMA Database, 96 NAMAs are under development and eight NAMAs are in implementation in a total of 27 countries.93 Sections 7.3.1 and 7.3.2 below provide some more details on two NAMAs that are being developed in the waste sector in Colombia and Chile, respectively.
7.3.1 Integrated Solid Waste NAMA in Colombia94
The waste sector in Colombia contributes 5.7% of total greenhouse gas (GHG) emissions, totaling 10 million tCO2e. As one of the fastest growing countries in the Latin American region, these emissions are expected to grow rapidly under the business-as-usual scenario. Most of the current emissions are generated through methane emissions from landfills in which Colombia disposes most of its solid waste. While this is good practice from a basic waste management perspective, Colombia is not optimizing the economic value that is present in solid waste streams through processes such as recycling, composting and conversion to fuel. Hence, Colombia is actively considering a Solid Waste Sector NAMA in order to maximize generation of economic value from waste streams and also achieve reduction of methane emissions by diverting solid waste away from landfills. The NAMA would transform the waste sector resulting in carbon neutrality shortly after implementation. Additionally, this NAMA is also expected to have several other social, economic and environmental benefits thereby making it consistent with Colombia’s sustainable development objectives.
The NAMA will support the Colombian government in transforming the solid waste sector by overcoming various existing policy, financial, market and social barriers. The cornerstones of the NAMA are regulatory changes, the promotion of alternative waste treatment technologies, creation of appropriate financial mechanisms, and the integration of informal recyclers into the formal sector. Some of the key components of the NAMA include:
Tariff revision: One of the central elements in the proposed NAMA is the reform of how solid waste tariffs are calculated. The tariff sets the price that solid waste operators can charge to collect, transport, and dispose of waste in landfills. Under the current tariff structure, it is much more profitable for waste operators to dispose of waste in landfills instead of diverting waste to recycling, composting, or waste-to-energy (WTE) plants. The NAMA feasibility studies have included assistance to the national regulatory agency to help them determine the true economic cost of alternative waste treatment methods in order to devise a new tariff structure.
Promotion of Mechanical-Biological Treatment Facilities: Colombia is proposing the promotion of new technologies such as mechanical-biological treatment (MBT) facilities that can process waste diverted away from landfills to produce commodities such as recyclables, compost, and refuse derived fuel (RDF).
NAMA Equity Fund: The NAMA intends to create a NAMA Equity Fund financed through public resources of Colombia and climate finance contributions from donor countries up to US$ 40 Million. The Fund will contribute equity capital to the MBT facilities. The contribution of the Fund to the total equity capital of each of these projects will reduce over time as the private
93
www.nama-database.org (accessed on 25 June 2014) 94
http://ccap.org/assets/Colombia_Solid_Waste_May_2013_NAMA_Executive_Summary.pdf

74
sector becomes more comfortable with the MBT technology and the operational and financial risks associated with it.
Public Private Partnerships: In order to further increase the returns and reduce the risk associated with these projects, cities will be encouraged to implement MBT facilities using the Public-Private Partnership (PPP) framework established under Colombian law in which private sector investors can receive up to 20% of the total construction and operation costs from the Colombian government as revenue support during the operating phase of the project.
Inclusion of informal workers: Another crucial aspect of the solid waste NAMA in Colombia is that policies and business models are being designed in order to include informal workers in the modernization of the sector, allowing them opportunities to work in the formal economy and increase the standard of their working and living conditions. Several international studies suggest that integrated solid waste management processes like the ones contemplated in the NAMA can create up to 6 to 10 times the number of jobs than those focused on disposal. Thus, additional jobs created through the Solid Waste NAMA could be used to employ a large number of existing informal workers, including many indirect jobs that will be created through increased recycling (transformation into new products) and the creation and sale of compost and RDF.
Separation at source: The Colombian government is also contributing to the success of the Solid Waste NAMA by proactively designing next generation waste management processes such as source separation and selective routes for waste collection that will enhance the efficiency of MBT facilities and also increase the quality of their outputs.
7.3.2 National Program for Catalyzing Industrial and Commercial Organic Waste in Chile95
The objective of the waste sector NAMA in Chile is to catalyze the installation of the first facilities for industrial and commercial organic waste management in Chile (it does not include household organic waste). The waste sector in Chile currently represents approximately 3% of the country´s greenhouse gas (GHG) emissions, the majority of these generated by industrial waste. This NAMA will therefore contribute to the country´s ability to meet its voluntary commitment to the United Nations to achieve a 20% deviation below the “business-as-usual” emissions growth trajectory by 2020, as projected from the year 2007.
The National Program seeks to promote a solution for organic waste management in Chile by supporting the installation of approximately five organic waste management facilities (specifically dry fermentation plants that include indoor treatment, power generation or "waste-to-energy" and compost products obtained from the organic treatment process). The National Program will specifically target industrial organic waste produced by agroindustry (wine, fruits, crops), fisheries (salmon), livestock (poultry, pigs), and commercial organic waste generated from pruning activities and the operation of local food markets, hotels and restaurants. Currently in Chile, municipalities are responsible for disposing of household and commercial waste while the industrial sector is responsible for disposing of its own waste separately.
The National Program has been designed to address the financial, economic, cultural and social barriers for the development of organic waste management facilities in Chile. In doing so, it will support the creation of a market for organic waste management in Chile which will ultimately allow private sector waste management companies to develop these projects without support.
Financial models that have been developed for the preparation of this NAMA indicate that the full cost of implementation of this Program and the resulting organic waste management facilities put in place by the private sector in Chile will total around 160 million USD. The National Program will include four (4) action areas: 95
http://www4.unfccc.int/sites/nama/_layouts/un/fccc/nama/NamaSeekingSupportForImplementation.aspx?ID=9&viewOnly=1

75
1. Regulatory Improvement: The Ministry of Environment of Chile will oversee the National Program and has begun developing national norms to regulate organic waste management (use of compost, requirements for bio-digester installations). The Ministry also plans to develop a system for the monitoring, reporting and verification of the emissions reductions resulting from plant installations that result from this NAMA.
2. Co-financing feasibility studies: The Chilean Economic Development Agency has funds available (accessible through a competitive application process) to co-finance up to 50% of the amount needed by the private sector for feasibility studies related to organic waste management projects.
3. Financial Support: Support is needed to cover part of the initial investment for approximately five plant installations. This financial support will only be needed and available for these first few projects supported by the NAMA funds.
4. Credit Guarantee Fund: As the organic waste management will include technologies yet to be tested and installed in Chile, the first projects will require special guarantees covering the construction and first year of plant operation, to leverage private sector funding. Financial models indicate that this guarantee will be able to cover the first 8-10 organic waste management plants installed in Chile.
7.4 Sources of Funding NAMAs
The global climate finance architecture is complex: finance is channeled through multilateral funds, such as the Global Environment Facility (GEF) and the Climate Investment Funds (CIF), as well as increasingly through bilateral channels. In addition, a growing number of recipient countries have set up national climate change funds that receive funding from multiple developed countries in an effort to coordinate and align donor interests with national priorities.
The 2009 Copenhagen Accord pledged funds of USD 10 billion a year from 2010 to 2012, increasing to USD 100 billion per year by 2020 to combat climate change in developing countries through mitigation and adaptation. By some estimates, the volume of climate finance globally may already be as high as USD 359 billion per year (CPI, 2011), although the majority (USD 224 billion) comes from private finance. Climate finance flows from developed countries to developing countries amounted to at least USD 39-62 billion in 2012.96 Also here, a significant part of the climate finance is coming from the private sector.
Figure 13 below provides a schematic overview of the main sources and channels of climate finance. The sections below discuss a number of different climate finance opportunities that are currently available or will become available in the near future.
96
Buchner, B. et al. (2013) The Global Landscape of Climate Finance 2013. Climate Policy Initiative. CPI Report.
76
Figure 13: Climate finance sources and channels97
7.4.1 The Green Climate Fund
The Green Climate Fund (GCF) is expected to be the mechanism through which a large share of scale-up global climate finance will be channeled in the future. The GCF has not yet received pledges from the international climate finance community and is therefore not yet fully operational.98 It therefore remains to be seen how the fund, which is expected to be several times larger than the biggest multilateral climate funds existing today, will affect the global climate finance infrastructure.
The GCF was adopted as a financial mechanism of the UNFCCC at the end of 2011. It aims to make an ambitious contribution to attaining the mitigation and adaptation goals of the international community. Over time it is expected to become the main multilateral financing mechanism to support climate action in developing countries. In recent months, the GCF Board has started formulating the key operational aspects that will guide fund implementation in the future.
The GCF will use various financial instruments and will be tailored to the specific needs of the projects they support. Concessional forms of finance are designed to minimize market distortions and potential disincentives to private investment.
It is not yet possible to apply for funding from the GCF because the fund is only in its start-up phase. It is expected that pledges to the Green Climate Fund will be made in the third quarter of 2014. Investment criteria are likely to be quite similar to the Clean Investment Fund (see section 7.4.3 below). Funding from the GCF will mostly focus on projects embedded in National Appropriate Mitigation Actions (NAMAs). In future the GCF might constitute a relevant and possible source of funding for NAMAs in Mozambique.
97
Wehner, Stefan et al. (2013) Guidance for NAMA Design: Building on Country Experiences. 98
The first pledges are expected towards the end of 2014.
77
7.4.2 The Global Environment Facility
The Global Environment Facility (GEF) is a multilateral fund that aims to help developing countries and economies in transition to contribute to the overall objective of the United Nations Framework Convention on Climate Change (UNFCCC) to both mitigate and adapt to climate change, while enabling sustainable economic development. The GEF is intended to cover the incremental costs of a measure to address climate change relative to a business-as-usual baseline.
The GEF Trust fund was established in 1994 and is replenished every 4 years. Total approved funding amounted to USD 221 million with an estimated USD 3.5 billion provided as co-financing. Grant funding to individual projects has ranged from USD 723,595 to USD 22.5 million.99
7.4.3 The Climate Investment Funds
The Climate Investment Funds (CIFs) were established in 2008, and are administered by the World Bank in partnership with regional development banks including the African Development Bank (AfDB), the Asian Development Bank (ADB), the European Bank for Reconstruction and Development (EBRD), and the Inter-American Development Bank (IDB). They consist of a Clean Technology Fund (CTF) that receives the majority of these funds ($4.1 billion), a Strategic Climate Fund that includes the Pilot Program for Climate Resilience (PPCR), the Forest Investment Program (FIP), and the Scaling-Up Renewable Energy Program for Low Income Countries (SREP).
Mozambique is already receiving US $86 million in grants and near-zero interest credits from the Pilot Program for Climate Resilience (PPCR). Mozambique’s PPCR strategic program will provide investments to support infrastructure upgrades, better resource management, enhanced cli-mate services, and the development of local and national capacities for climate resilient planning and action.100
7.4.4 Japanese Fast Start Finance Initiative
In December 2009, Japan announced the Hatoyama Initiative, which pledged USD 15 billion in
financial assistance to assist developing countries address climate change. While this financing is
not released through one individual fund, the assistance falls under Japan’s fast-start finance
commitment and marks one of the world’s most ambitious bilateral climate funding schemes.
The funding is disbursed through both Japanese development institutions (JICA, JBIC) as well as
multilateral contributions channelled through the Climate Investment Funds and the Global
Environmental Facility.101
As of 29 February 2012, about USD 13 billion had been committed to 783 projects in 107
countries.102 More than USD 10.1 billion of the contribution to date is sourced from public
finance. With about 70% of the funds invested in mitigation projects, Japanese climate finance is
heavily focusing towards mitigation. Most mitigation finance, in turn, is financed through loans,
which constitute about 75% of the contribution for infrastructure development projects, such as
urban transport projects.103 Most funds are channeled through the Japanese development
99
http://www.thegef.org/gef/gef_projects_funding accessed on 17 October 2013. 100
https://www.climateinvestmentfunds.org/cifnet/?q=country/mozambique accessed on 26 June 2014 101
Figures of actual distribution to different funds and multilateral’s differ significantly. This might be due to different methodological to calculate climate finance contributions. 102
World Resources Institute (2012). THE JAPANESE FAST-START FINANCE CONTRIBUTION
103 World Resources Institute (2012). THE JAPANESE FAST-START FINANCE CONTRIBUTION
78
institutions (JICA, JBIC) while, compared to other countries, only a small fraction is channeled
through multilateral financing institutions.
For the period after 2012, the Japanese Government has pledged to provide USD 16 billion of
climate finance in the next 3 years.104
7.4.5 NAMA Facility
The NAMA Facility was announced during the climate negotiations in 2012 in Doha when the German Federal Ministry for the Environment, Nature Conservation, Building and Nuclear Safety (BMU) and the Department of Energy and Climate Change (DECC) of the United Kingdom jointly established the NAMA Facility and contributed € 70 million of funding to support developing countries that show strong leadership on tackling climate change and want to implement transformational NAMAs. Germany is one of the leading countries in developing climate finance at this moment.
The NAMA Facility105 provides grants up to EUR 15 million for the implementation of NAMA
pilots. The facility has completed its first contract awarding round in November 2013. A new
round with a total funding of EUR 50 million has been launched in 2014.
The NAMA Facility works through an open tender procedure and does not have any preference
for country or sector. There is an objective set of selection criteria, including:
Transformational potential;
Co-benefits;
Financial ambition;
Mitigation potential.
In the first round 43 proposals were submitted, of which four were selected for funding.
The NAMA Facility requires that the funded project is a discrete set of activities, which can be
carried out within a determined period of time. Any emission reductions attributable to the
funding by the NAMA Facility need to be surrendered.
The NAMA Facility does not yet consider funding NAMAs on a larger scale. However,
participating in the NAMA Facility can position a project for follow-up by Germany, the UK or
other climate funders at a later stage.
In addition to the above-mentioned sources of climate finance, many more (smaller)
opportunities exist for accessing climate finance for government, civil society and the private
sector. The availability of different sources of climate finance need to be assessed on a case by
case basis.
104
Bloomberg Sustainability (2013). Climate Finance Battle Shows Expectation Gap at UN Talks. http://www.bloomberg.com/news/2013-11-20/climate-finance-battle-shows-expectation-gap-at-un-talks.html 105
http://www.nama-facility.org/news.html

79
8 Bibliography
Blodgett, C., J. Rohe, S. Kabisch and D. Tänzler (2012) Nationally Appropriate Mitigation Actions: A Technical Assistance Source Book for Practitioners. GIZ.
Bogner, J., M. Abdelrafie Ahmed, C. Diaz, A. Faaij, Q. Gao, S. Hashimoto, K. Mareckova, R. Pipatti, T. Zhang (2007), "Waste Management" in Climate Change 2007: Mitigation. Contribution of Working Group III to the Fourth Assessment Report of the Intergovernmental Panel on Climate Change [B. Metz, O.R. Davidson, P.R. Bosch, R. Dave, L.A. Meyer (eds)], Cambridge University Press, Cambridge, United Kingdom and New York, NY, USA.
Buchner, B. et al. (2013) The Global Landscape of Climate Finance 2013. Climate Policy Initiative. CPI Report.
DEFRA [Department for Environment, Food and Rural Affairs] (2007) Mechanical Biological Treatment of Municipal Solid Waste.
European Environment Agency (2001) Solid Recovered Fuels in Cement and Lime Kilns – An International Perspective. R&D Technical Report P4-087/TR/1
European Environment Agency (2007) EU Wide Projections of Greenhouse Gas Emissions from Municipal Waste Management. Workshop on methodologies for greenhouse gas emission projections.
European Commission (2003) Refuse Derived Fuel, Current Practice and Perspectives. Final Report.
GIZ (2012) Economic Instruments in Solid Waste Management. Case Study Maputo, Mozambique.
Golder Associate (2010) Quantitative and Qualitative Analysis of Landfill Gas Production at Hulene Dump Site.
Government of Canada (2013) Technical Document on Municipal Solid Waste Organics Processing.
Hay, T. (2013) Feasibility Study: Recycling Run by a Micro- enterprise in Vilanculos, Mozambique. Master Thesis.
Hoornweg D., L. Thomas, L. Otten (1999) Composting and Its Applicability in Developing Countries. World Bank. Working Paper Series.
IPCC (2014) Climate Change 2014: Mitigation of Climate Change. Working Group III Contribution to the Fifth Assessment Report of the Intergovernmental Panel on Climate Change. Chapter 10 - Industry.
IPCC (2006) Guidelines for National Greenhouse Gas Inventories. Volume 5.
Conselho Municipal de Maputo (2008) Limpeza de Resíduos Sólidos Urbanos do Município de Maputo. Posturas e Regulamentos.
MICOA (2003) Mozambique Initial National Communication to the UNFCCC 2003.
MICOA (2012) Estratégia de Gestão Integrada de Resíduos Sólidos Urbanos em Moçambique.
MICOA (2012) Estrategia Nacional de Adaptação as Mudanças Climaticas 2013-2025. Versão de trabalho de 30 de Setembro de 2012.
Morris M., V.A. Kelly, R.J. Kopicki, D. Byerlee (2007) Fertilizer Use in African Agriculture – Lessons Learned and Good Practices guideline. Directions in Development – The World Bank, 2007

80
Município de Maputo (2008) Plano Director - Gestão de Resíduos Sólidos Urbanos na Cidade de Maputo.
Rytz, I. (2001) Assessment of a Decentralised Composting Scheme in Dhaka, Bangladesh. Technical, Operational, Organisational and Financial Aspects. EAWAG/SANDEC, Waste Concern.
Segala, K., I. Opressa and J. Palalane (2008) Urbanização e Desenvolvimento Municipal em Moçambique. Gestão de Resíduos Sólidos. Instituto Brasileiro de Administração Municipal.
UNDP (2012) Indicadores Rápidos de Moçambique. Unidade de Análise de Políticas e Economia PNUD Moçambique.
UNEP (2005) 'Chapter IVX: Sanitary Landfill' in Solid Waste Management.
UNEP (2005) Closing an Open Dumpsite and Shifting from Open Dumping to Controlled Dumping and to Sanitary Land Filling.
UNFCCC, Greenhouse Gas Inventory Data - Detailed data by Party http://unfccc.int/di/DetailedByParty/Event.do?event=go
Waste Concern (2006) Decentralised Composting for Cities of Low- and Middle-Income Countries. A User's Manual.
Wehner, Stefan et al. (2013) Guidance for NAMA Design: Building on Country Experiences
Zurbrügg, C., S. Drescher, A. Patel, H.C. Sharatchandra (2004), "Decentralized composting of urban waste - an overview of community and private initiatives in Indian cities" in Waste Management, 24, pp. 655-662.