a comprehensive approach to fast high … throughput analysis pittcon 2008 march 2008 a...
TRANSCRIPT

High Throughput AnalysisPittcon 2008March 2008
A Comprehensive Approach to Fast High Throughput LC/MS Analysis
Tony Brand, Ph.D.ScientistAgilent Technologies, Inc.

March, 2008
High Throughput AnalysisPittcon 2008
Productivity in LC and LC/MS Analysis
LC: To produce sufficient resolution in the shortest timepossible with minimal instrument cycle time, maximum
reproducibility and minimal downtime.
To review data quickly and efficiently.
To produce reports which provide information.

March, 2008
High Throughput AnalysisPittcon 2008
The Agilent 1200 Rapid Resolution LCHighest Performance RRLC/UV/MS and Conventional HPLC – All on one System!
PerformanceUp to 60% higher resolution compared to HPLCUp to 20x faster than HPLC
With same or better performanceCompliant with strictest regulatory performance requirements2000 Samples/Day on HT-configuration with ACR
Flexibility and Investment ProtectionRRLC and HPLC on standard delay volume configurationSupport of RRLC and HPLC on Std and Narrow bore columnsVery broad range of RRHT columnsSame chemistry easy, fast and secure method transfer1100 Compatibility and Emulation mode for non-Agilent softwareStepwise transition to RRLC, minimum training & switching costs
March, 2008
High Throughput AnalysisPittcon 2008
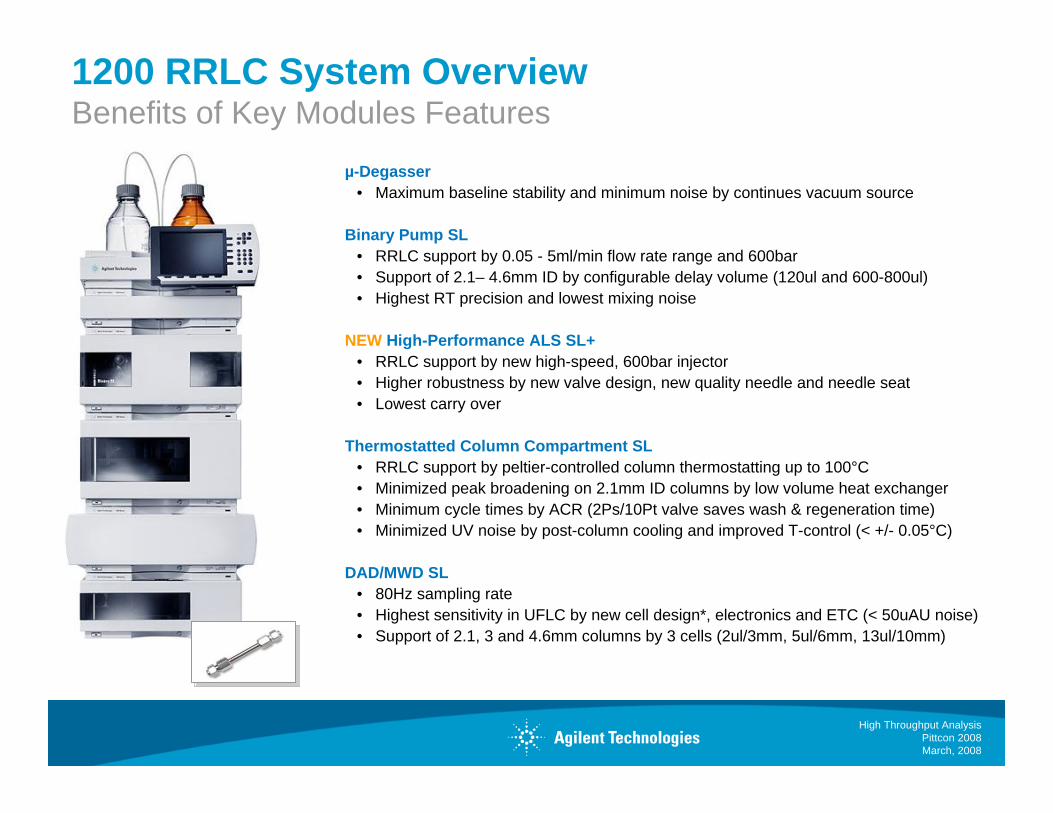
µ-Degasser• Maximum baseline stability and minimum noise by continues vacuum source
Binary Pump SL• RRLC support by 0.05 - 5ml/min flow rate range and 600bar • Support of 2.1– 4.6mm ID by configurable delay volume (120ul and 600-800ul)• Highest RT precision and lowest mixing noise
NEW High-Performance ALS SL+• RRLC support by new high-speed, 600bar injector• Higher robustness by new valve design, new quality needle and needle seat• Lowest carry over
Thermostatted Column Compartment SL• RRLC support by peltier-controlled column thermostatting up to 100°C• Minimized peak broadening on 2.1mm ID columns by low volume heat exchanger• Minimum cycle times by ACR (2Ps/10Pt valve saves wash & regeneration time)• Minimized UV noise by post-column cooling and improved T-control (< +/- 0.05°C)
DAD/MWD SL• 80Hz sampling rate• Highest sensitivity in UFLC by new cell design*, electronics and ETC (< 50uAU noise)• Support of 2.1, 3 and 4.6mm columns by 3 cells (2ul/3mm, 5ul/6mm, 13ul/10mm)
1200 RRLC System Overview Benefits of Key Modules Features

March, 2008
High Throughput AnalysisPittcon 2008
Area Precision (n=10)
Inj. Vol.: 3.0µl 0.307% RSD
Inj.Vol.: 1.0µl 0.569% RSD
Inj.Vol.: 0.5µl 0.672% RSD
min1.27 1.28 1.29 1.3 1.31
mAU
0
20
40
60
80
100
120
140
Buty
roph
enon
eBe
nzop
heno
ne
Vale
roph
enon
e
Hex
anop
heno
ne
Hep
tano
phen
one
Oct
anop
heno
neAcet
anilid
e
Acet
ophe
none
Prop
ioph
enon
e
min0.2 0.4 0.6 0.8 1 1.2 1.4
Agilent 1200 RRLC: Speed and ReproducibilityMaintaining Area Precision at High Analysis Speed

March, 2008
High Throughput AnalysisPittcon 2008
The New Agilent 1200 Hi-P ALS SL+
A Quantum Leap in reducing carryover
New lower delay volume in MAINPASS mode for RRLC
Higher precision (<1% for 0.1uL injections)
Injection volume: 0.1 to 40µl (optional, 100µl kit)

March, 2008
High Throughput AnalysisPittcon 2008
Agilent 1200 HiP-ALS SL+: Simple Superior Design

March, 2008
High Throughput AnalysisPittcon 2008
The Agilent 1200 HiP-ALS SL+: Single Draw Flow Through Design
Bypass ModeSample Loading
Mainpass ModeRunning Sample

March, 2008
High Throughput AnalysisPittcon 2008
The New Agilent 1200 Hi-P ALS SL+Cleaning Procedures
Inside of the needle is continuously flushed during the complete analysis
Outside of the needle is flushed prior to injection with fresh solvent. This outside wash of the needle is done using the flush port of the ALS and prevents contamination of the needle seat.
New post-run automated cleaning procedure for the needle seat. Seat is flushed with mobile phase. The injection needle is elevated from the seat, but remains in mainpass and the pump delivers flow through the needle onto the seat.

March, 2008
High Throughput AnalysisPittcon 2008
Carry-over Chlorhexidine<0.003 % with MSD in SIM mode
min0.6 0.8 1 1.2 1.4 1.6 1.8
0
500
1000
1500
2000
2500
3000
3500
MSD1 TIC, MS File (D:\DATA\CARRYMSHEX24JAN\CARRYHEX24JAN2-57\HEX_240NGCARRY.D) ES-API, Pos, SIM, Frag: 70
chl
orhe
xidi
MSD1 TIC, MS File (D:\DATA\CARRYMSHEX24JAN\CARRYHEX24JAN2-57\BLANK_AFTER1.D) ES-API, Pos, SIM, Frag: 70 240ng Chlorhexidine injected
SIM ion :505.30 m/z
Carry over after injection of 1µl mobile phase: 0.0028%
240ng Chlorhexidine
Carry over peak
Former results: 0.041% carry over
No carry over in the UV could be observed under these conditions
Column: 2.1x50mm Zorbax SB C18, 1.8µmSample: Chlorhexidine dissolved in Water + 0.1%TFAMobile Phases: water+0.05%TFA, Acetonitrile+0.045%TFAFlow rate: 0,5ml/minGradient: at 0 min 30%B, at 3min 60%BInjection volume: 1µl, external needle wash with water + 0.1%TFA, draw and inject speed= 100µl/minColumn temperature: 50°CMSD API-ES positive: SIM ion 505.30, Fragmentor: 70, gas temp: 250°C, drying gas =12L/min , Vcap = 3000V
Early R&D data

March, 2008
High Throughput AnalysisPittcon 2008
• 100°C for higher speed and resolution in RRLC
• New low volume heat exchanger for minimized peak broadening on 2.1mm ID columns.
• 600bar 2Ps/10Pt micro valve for minimum cycle times by ACR (alternating column regeneration, which saves wash & regeneration time)
• PCC (post-column cooling) and improved peltier temperature control (< +/- 0.05°C) for minimized UV noise under most demanding conditions (< 50µAU at high flow rates and temperatures)
The Agilent 1200 RRLC System Thermostatted Column Compartment SL

March, 2008
High Throughput AnalysisPittcon 2008
Pre-Column heating/cooling
Post-Column heating/cooling
Integrated Column Selection or Column Regeneration Valve
Beyond Column Temperature, Managing Temperature Before the Detectors
The Agilent 1200 Thermostated Column Compartment SL
Column temperatures to 100oCHigher column temperatures
- reduce viscosity and back pressure- improve peak shape- improve recovery and reproducibility

March, 2008
High Throughput AnalysisPittcon 2008
Alternating Column Regeneration (ACR) saves up to 50% of cycle time
Throughput of > 2000 sample/day can be achieved in conjunction with
Automatic Delay Volume Reduction
Overlapped Injections
Offline Data Analysis
External Needle Wash
Sequential analysis (vs. parallel) ensures performance, flexibility, robustness and ease-of-use of std LC instruments
RRLC Speed & Throughput2000 Samples/Day using ACR

March, 2008
High Throughput AnalysisPittcon 2008
Post-column CoolingNoise reduction at high flow rates and high temperatures
0.685 - Anthracene
min0.5 1 1.5 2 2.5
mAU
-0.05
0
0.05
0.1
0.15
0.2
0.25
• Column Temperature: 80°C • Detector-in Temperature: 50 °C• Noise = 90 uAU• S/N = 3.3
• Column Temperature: 80°C• Detector-in Temperature: 24 °C• Noise = 30 uAU• S/N = 10• No Peak Broadening
Column: 4.6 x 50mm, 1.8um
Flow Rate: 4ml/min

March, 2008
High Throughput AnalysisPittcon 2008
High Temperature LC-MS/MS (HTLC-MS/MS) for High Throughput BioanalysisDaniel Tang, PhD, PDM, Michigan Laboratories, PGRD, Pfizer Pharmaceuticals
Post-Column Heating Temperature Effect on LC/MS Sensitivity

March, 2008
High Throughput AnalysisPittcon 2008
Agilent 1200 DAD and MWD:Flow Cells Recommendations in RRLC
13µl Standard Flow Cell: For highest sensitivityHigh-demanding quantitative work, e.g. analytical method development, QA/QC
2µl Micro Flow Cell: For highest resolutionUltra-fast semi-quantitative work, e.g. Screening Experiments, HT LC/MS/UV
5µl Semi-micro Flow Cell: Best compromise of sensitivity and resolutionFor good quantitative and qualitative results, e.g. Screening, HT LC/MS/UV, Early Formulation Studies
* Depends on analytical conditions and column dimension
+++
+++
Sensitivity* Resolution*Dimension
+++2 µl / 3mm++5 µl / 6mm+13 µl / 10mm

March, 2008
High Throughput AnalysisPittcon 2008
The New Agilent 1200 Series ELSD
• Proven detector for highest sensitivity and reliability
• Suitable for LC and RRLC
• Reliable and Robust
• Minimal maintenance
• System Support from a single vendor

March, 2008
High Throughput AnalysisPittcon 2008
Why ELSD? “Detection insurance”
min0 1 2 3 4 5 6 7 8
mAU
0
100
200
300
400
500
600
700
800
5.42
7 min1 2 3 4 5 6 7 8
mV
100
200
300
400
500
600
700
1.89
2 3.88
3
4.87
2
5.56
4
ELSD ~12.8 mg/l5 μl injection
DAD~ 12.8 mg/l5 μl injection
Prol
ine
Valin
e
Isol
eucin
e
Phen
ylal
anin
ePh
enyl
alan
ine

March, 2008
High Throughput AnalysisPittcon 2008
3. Detection
Agilent ELSD Technology: Simple, Reliable1. Nebulization
2. LT-Evaporation

March, 2008
High Throughput AnalysisPittcon 2008
Why ELSD?
ELSD sees any compound less volatile than the eluent
Analysis of biologically active compounds from soya

March, 2008
High Throughput AnalysisPittcon 2008
The New Agilent 1200 Series ELSD
Advanced technology by optimized nebulizers and Gas Supported Focusing in optical head
High and low (ambient to ~60°C) temperature evaporation
Low peak dispersion by optimizednebulizers, evaporator and head
4 nebulizers available for optimized sensitivity and peak width at different flow rates
Convenient front access for inspection and maintenance
Best sensitivity and peak shape and width
Applicable to non- and semi-volatile compounds
RRLC enabled for peak width >/= 0.8 sec
To cover all HPLC techniqiues from low µl- to semi-prep at 5 ml/min
User friendly, low maintenance

March, 2008
High Throughput AnalysisPittcon 2008
Low Temperature ELSD for lower limit of detection of semivolatiles ?
30° C evaporation
50° C evaporation
Analysis of caffeine with30° and 50°C evaprationtemperature

March, 2008
High Throughput AnalysisPittcon 2008
1200 Series ELSD in RRLC w/ peak width 0.8 sec
min0 0.1 0.2 0.3 0.4 0.5 0.6 0.7 0.8 0.9
mV
0
100
200
300
400
500
600
ELS1 A,Voltage (C:\WORK\ELSD\DATA FILES CHEMST\RRLC_PARABENS_3 2007-09-14 17-25-43\001-0101.D)
0.133
0.173
0.242
0.357
Analysis of 4 semi-volatile parabens in less than 0.4 minutes,data rate 30 Hz results in 25 data points for 0.8 sec peak
Evaporation: 26° C
0.8 sec

March, 2008
High Throughput AnalysisPittcon 2008
The ELSD Value Proposition
• For samples without chromophore, fluorescence, or ionizability: natural products, unknowns, combinatorial chemistry libraries ...
• Univeral Detection (well almost)
• Frequently used as complementary detection mode to UV and to LC/MS
• State of the art ELSD w/ excellent sensitivity and minimal peak width
• Low temperature evaporation enables detection of semi-volatiles, for example, ibupofen, parabens, caffeine

March, 2008
High Throughput AnalysisPittcon 2008
The Agilent 6000 LC-MS Detectors

March, 2008
High Throughput AnalysisPittcon 2008
The Agilent 6100 Series LCMS Quadrupole

March, 2008
High Throughput AnalysisPittcon 2008
Lens2RF – A Patented Agilent Solution
Issue: As m/z value goes up, amplitude of quadrupole RF increases, more difficult to inject ions into the quadrupole and ion transmission drops.
Octopole
Quad Mass Filter
Lens 1 Lens 2
Implemented on the 6130 and 6140 models
Solution: ramping the DC and RF amplitudes with mass on lens 2 and offsetting the phase relative to the quadrupole, ion transmission into the quadrupoleincreases.
Result: Ion transmission increased by ~3X at m/z 600 and up to 10X at m/z 3000

March, 2008
High Throughput AnalysisPittcon 2008
TIC Chromatogram: Customer Sample #48
min0.5 1 1.5 2 2.5 3 3.5
0
200000
400000
600000
800000
1000000
0.10
60.
128
0.26
3
1.79
81.
835
1.99
3
2.20
3
Chromatographic parameters: Column: Zorbax SB C-18 RR 2.1x50mmGradient: 5% ACN to 95% over 3 min at 1.0 ml/min.
Peak #5 Integration Parameters:Width: .0239 min (1.43 sec)
# Spectra across peak: 46
MS Acquisition parameters: Scan range: m/z 100 to 900Cycle time: 0.085 sec. (~9400 u/sec)
m/z420 425 430 435 440 4450
20
40
60
80
100Max: 357248
436.
243
7.2 43
8.2
[M +H]+
[M +Cl35]+ [M +Cl37]+
Chlorine isotopes of Peak #5

March, 2008
High Throughput AnalysisPittcon 2008
Simultaneous Electrospray and APCI: Pos/Neg
NH
+
NN
min0.5 1 1.5 2 2.5
1.10
1
2.51
7
min0.5 1 1.5 2 2.5
2.50
9
APCI
ESI, usually ionizes >80% of analytes
Indole
Crystal Violet
2.49
2
min0.5 1 1.5 2 2.5
1.10
8
Simultaneous ESI/APCI, Pos
N
min0.5 1 1.5 2 2.5
1.98
0
APCI
1.98
2
min0.5 1 1.5 2 2.50.
991
Simultaneous ESI/APCI, Neg
min0.5 1 1.5 2 2.5
0.94
6
ESI
HexaneSulfonic Acid
F
FF
NO- O
NO
O
SO
OOH
Positive Ion Mode Negative Ion Mode
Dinitrobenzo-trifluoride

March, 2008
High Throughput AnalysisPittcon 2008
The Agilent Multi-Mode Source Design: InnovationTruly Simultaneous Electrospray and APCI
Nebulizer (grounded)
Reversing electrode (+ve)
APCI counter electrode pin
Gas temperature controllerIR emitter power to controlled by feedback from temperature sensor in vapor stream exiting source
ES Charging electrode (-ve)
Infra-red heaterTuned to H2O IR band
Infra-red heaterTuned to H2O IR band
MS capillary inlet with shield and countercurrent N2 drying gas flow
ES Field shaping electrodes
Thermal Container
Drying gas consumption is reduced ca. 50% compared to dedicated ESI source because heat is supplied by IR emitters
APCI corona needle (+ve)Separator
Isolates ions generated by ES and APCI

March, 2008
High Throughput AnalysisPittcon 2008
Vaporization Using Infrared Emitters:Optimal APCI Conditions for Reserpine (10 pg)
min10 20 30 40 50
500
1000
1500
2000
2500
3000
3500Vaporizer
temperature
250 °C
225 °C
200 °C
175 °C
150 °C
125 °C
Relativepeak area
16.8
15.1
12.7
8.3
3.7
1
Rel. std dev.4 replicates
2.0%
1.7%
2.1%
2.9%
1.5%
13.4%
75:25 MeOH:water, 5 mM ammonium formate1 mL/min

March, 2008
High Throughput AnalysisPittcon 2008
Beyond browsing to reviewing…..
Analytical Studio Review
A simple, clean interface for reviewing small to large to very large data sets.Comprehensive data displayPeak purity, sample purity, target massesA New Reporting Engine: Clean, Simple & Brief

March, 2008
High Throughput AnalysisPittcon 2008
Analytical Studio Reviewer (ASR)Fast Data Review on Everyone’s Desktop
CLND Chromatogram
MS Spectrum
MS TIC
UV Chromatogram
Sample Purity ELSD Chromatogram

March, 2008
High Throughput AnalysisPittcon 2008
Analytical Studio Review

March, 2008
High Throughput AnalysisPittcon 2008
Analytical Studio Review: Report Versatility
ChemStation ASR File
Analytical Studio Review
Raw Data
Report
Report

March, 2008
High Throughput AnalysisPittcon 2008
Analytical Studio ReviewA New Reporting Engine: Clean, Simple & Brief

March, 2008
High Throughput AnalysisPittcon 2008
Analytical Studio Review – Flexible Reporting

March, 2008
High Throughput AnalysisPittcon 2008
ASR – Editing Feature

March, 2008
High Throughput AnalysisPittcon 2008
SQ on Mass Hunter Migration
Instrument Control
Real-time monitoring
Method set-up
Autotune
Qualitative Analysis
Chromatographic results
Spectral results
Find compounds
Quantitative Analysis
User filters
Compound results
Calibration curve

March, 2008
High Throughput AnalysisPittcon 2008
Now Single Quad Users get Powerful and Easy Report Customization
Drag and drop columnsfrom XML results
Add tables and graphics using tool buttons
Print Preview in Excel

March, 2008
High Throughput AnalysisPittcon 2008
The Agilent 1200 Series LC and 6000 Series LC-MS
Thanks for listening!