a comparison of three qrs detection algorithms over a … · · 2013-10-09a comparison of three...
TRANSCRIPT

A comparison of three QRS detection algorithms over apublic database
Raul Alonso Alvarez
Abstract
We have compared three of the best QRS detection algorithms, regarding theirresults, to check the performance and to elucidate which get better accuracy.In the literature these algorithms were published in a theoretical way, withoutoffering their code, so it is difficult to check the real behaviour of them. Thiswork brings the community the source code of each algorithm and their resultsvalidation over a public database. In addition, this software was developed asa framework in order to permit the inclusion of new QRS detection algorithmsand also it’s testing over different databases.
Keywords: ECG analysis, QRS detection, Phasor transform
Preprint submitted to Elsevier May 13, 2013

1. Introduction
An electrocardiogram, also called ECG or EKG, reflects the electrical activ-ity of the heart. Every heart contraction produces an electrical impulse thatis caught by electrodes placed in the skin. The heartbeat produces a seriesof waves with a time-variant morphology. These waves are caused by voltagevariations of the cardiac cells.
The primary function of the heart is to pump oxygen-rich blood throughoutthe body. The heart is composed of muscle cells, which produces the contraction;these cells are connected into a network (conduction system) that allows anelectrical impulse spreads throughout the heart. A cardiac cycle is created whenan impulse propagates through the conduction system. The cardiac cycle startsin the atria and goes down throw the ventricles, so the impulse is triggered inthe atria and it precedes the heart contraction [1].
Each cardiac cycle is composed of two stages, contraction and relaxation,called in electrical terms depolarization and repolarization. Depolarization pro-duces a rapid change in the cell potential (from -90 to 20 mV), and this changein voltage causes the depolarization of neighbour cells. After it’s depolarizationcells come back to their resting stage, produced by their repolarization.
The electrocardiogram provides important and relevant information aboutthe heart state. Physicians all over the world are using it to diagnose cardiacdiseases, which are the main cause of mortality in our society. There are a widevariety of devices that allow to analyze the heart activity, e.g. Holters, arrhyth-mia monitors, ECG stress test systems and so on. Nowadays the informationprovided by these gadgets can be easily digitized and processed by computers.Thus, using the power of computers, we can detect heart diseases or anomaliesthat otherwise could only be detected by experts physicians.
In ECG processing, it is very important to detect very accurately heartbeats,because it is the base for further analysis. The energy of heartbeats is located inthe QRS Complex. So, an accurate QRS detector is essential for ECG analysis.
In order to analyze the ECG signal is important to know waves that formsthe heartbeat, see Figure 1 on page 3. Each beat is divided in three stages, atrialdepolarization (P wave), ventricular depolarization (QRS) and finally ventric-ular repolarization (T wave). These three stages are continuously repeated inthe ECG signal, representing heartbeats over the time.
QRS detection is difficult, because the signal varies along the time and differ-ent types of noise can be present in it. From the eighties, software QRS detectionhas been a research topic. Whereas in the early years the performances of the al-gorithms were determined by its computational load and complexity, nowadaysthe detection performance is the major objective.
In most QRS detection algorithms there are two differentiated stages: pre-processing and decision [2]. In the pre-processing stage different techniques areapplied to the signal, such as linear and nonlinear filtering or smoothing, toattenuate P and T waves as well as the noise. While in the decision stage themost important task is the determination of thresholds and in some cases theuse of techniques to discriminate T waves. Some algorithms include anotherdecision stage to reduce false positives.
To evaluate the performance of each algorithm there are available benchmarkdatabases, where the heartbeat’s positions are well annotated by two cardiol-ogists that must be in agreement about each beat position. These databases
2

Figure 1: The QRS complex in the ECG signal
contain a large variety of ECGs, as well as signals that are rarely observed butclinically important. Some of these databases are: MIT-BIH [3], AHA (http://www.heart.org/HEARTORG/) or the QT Database (http://www.physionet.org/physiobank/database/qtdb/doc/node3.html).
Nowadays there are many algorithms for detecting heartbeats published butmost of them do not offer the source code and are not validated on the samedatabases. Usually these algorithms are explained in a theoretical way, whileothers only include a few guidelines for real implementation. It becomes nec-essary, therefore, a tool that allows users to implement their algorithms andto compare its performance against different databases. In this research work,three of the best QRS detection algorithms, regarding their results, are com-pared in order to check its performance and see which get better accuracy.
This work was developed using the free software programming language R [4],typically used for statistical computing and graphics. This language is availablein multiple operating systems, for this reason our software will be multiplat-form. R is very powerful using matrix operations and it is simple to plot theresults, which makes it very adequate for signal processing. However it is highlyinefficient with loops, which makes our application to run very slow when usingloops.
To solve this situation we linked R with C using a R library that allowsdoing computationally intensive tasks in C language, thus our software is muchmore faster. However this implies that it should be compiled for each differentoperating system and computer.
2. State of the Art
Pahlm and Sornmo [2] noticed that most of QRS detectors are divided intwo sections: pre-processing stage and decision stage. Almost all algorithms use
3

a filter stage before the detection, in order to remove the noise and reduce theamplitude of P and T waves to facilitate the subsequent detection [5]. Somealgorithms apply a bank of high-pass and low-pass filters, which is known as aband-pass filter, while others do it separately. Once the signal is pre-processed,the QRS complex is detected by thresholding the signal, where thresholds canbe fixed or adaptive. Finally, most algorithms use another decision stage, wheredecision rules are applied in order to reduce false positives.
During the last 30 years there have been proposed a lot of algorithms forQRS detection. There are many approaches, from artificial neural networksor genetic algorithms to wavelet transforms, filter banks, heuristic methods ormachine learning methods [6].
2.1. Different Approaches
• Derivate-based algorithms: algorithms based in filters and derivative asin [7]. They often use a high-pass filter and derivative is used to determinethe maximum slope, which corresponds to QRS complex.
• Algorithms based on digital filters: other algorithms with use more sophis-ticated filters [8] [9]. Two different filters process the ECG, low-pass andhigh pass ones, with different cut-off frequencies, forming the band-passfiltered signal. Also thresholds are compared adaptively [10] [11].
• Wavelets: wavelet based approaches discompose the signal into differentscale components to analyze the signal in different frequency bands [12] [13] [14].Then fixed thresholds are applied to obtain the characteristic points.
• Neural Networks: neural networks are used to predict current signal valuesfrom the past ones, and therefore apply suitable filters to attenuate thenoise [14] [15].
• Hidden Markov Models: HMMs model the data sequence according to anunderlying Markov chain [16]. The algorithm infers the underlying statefrom the observed signal.
• Genetic algorithms: they intend to get optimal polynomial filters, for pre-processing stage, and parameters for decision stage [17].
• Phasor Transform: transform each sample of the signal into a complexvalue preserving the signal information [18]. It enhances ECG waves andthen the detection is easier applying thresholds.
Table 1 shows the performance of each algorithm. Okada algorithm [9] wasnot considered because it uses only 4 ECG records obtained from patients insurgery, and a cardiologist analyzed the performance position-by-position di-rectly. In the case of Arzeno’s paper [7], he compared traditional first-derivativebased algorithms, where he obtained the best results with the Hamilton & Tomp-kins algorithm [11].
Most algorithms are developed by research groups, they own the source codeand they only share with scientific community the behaviour of their algorithmswith a few guidelines and the results of its validation over a database. Thereare also commercial systems for ECG analysis, but these do not offer their codeneither the validation data.
4

Algorithm Database Sensitivity Pos. PredictivityN. Arzeno 2008 [7] MIT-BIH 99.68% 99.63%V. Afonso 1999 [8] MIT-BIH 99.59% 99.56%J. Pan 1985 [10] MIT-BIH 99.3% -
P. Hamilton 1986 [11] MIT-BIH 99.69% 99.77%J. Martinez 2004 [12] MIT-BIH, QT, ST-T, CSE 99.66% 99.56%
C. Li 1995 [13] MIT-BIH 99.8% -B. Abibullaev 2011 [14] MIT-BIH 97.2% 98.52%
Q. Xue 1992 [15] MIT-BIH 99.5% 97.5%D. Coast 1990 [16] AHA 97.25% 85.67%R. Poli 1995 [17] MIT-BIH 99.6% 99.51%
A. Martinez 2010 [18] MIT-BIH, QT, ST-T,TWA 99.81% 99.89%
Table 1: Performance of some QRS detection algorithms. For each algorithmwe show the best result provided by their authors
3. Original contribution
In this research work we decided to implement two algorithms based ondigital filters, Pan & Tompkins algorithm [10] and Hamilton & Tompkins algo-rithm [11] and a new algorithm based on the phasor transform [18].
The Pan & Tompkins algorithm was a major breakthrough at the time ofits publication. Furthermore it is the most cited paper (more than 850 times)related with QRS detection. It made use of the latest techniques at that timeand it is an algorithm that can quickly adapt to the signal changes and get agood detection even in noisy signals.
Hamilton & Tompkins algorithm was published the following year and itis very similar to Pan & Tompkins. It uses the same pre-processor with slightvariations but with completely different decision rules. Theoretically it improvesa bit the detection compared with the previous algorithm.
The phasor-based algorithm is a recent work, published in 2010, and it ischaracterized by its robustness, low computational cost and mathematical sim-plicity. The results are even better than those of the other two algorithms,according to their authors.
In this section the developed software is presented, highlighting those partsthat are an original contribution. Besides the algorithm, we also explain otherfeatures of this software.
3.1. Programming language
As a programming language to implement the detection algorithms we havechosen R [4]. It is a programming language widely known in the scientificcommunity, therefore will be not trouble to understand the source code. Theadvantages of using R are:
• It allows plotting very easily, this allows check the signal morphology orthe positions marked as a beat, which facilitates the identification of errors.
• It is a language based on matrix operations, useful for searching minimum,maximum, mean, median or do sums, differences and products of matrices.This kind of operations are widely used in signal processing.
5

• It is open source, which allows us to share our software with the scientificcommunity, with the benefits of that.
3.2. Package structure
We have divided the package in four components: Linux Scripts, ECGRecords, R code and Results (see Figure 2). Linux scripts contain all neces-sary code for doing the automatic validation. In ECG Records folder there arethe records to analyze, while Results folder contains the output after apply theautomatic validation.
The code of the three detection algorithms developed are in the R codefolder, it also includes the C functions to enhance the performance.
The three algorithms follow the same workflow, represented in Figure 3.
Figure 2: Package components
Figure 3: Algorithms workflow
3.3. Database and validation process
In this context, a database is a collection of recordings, available as a setflat of files. Some ECG databases are freely available via Physionet [19] (http://www.physionet.org/) to the research community. Many of these databaseswere developed at MIT and at Boston’s Beth Israel Hospital (MIT-BIH).
From all the available ECG databases in Physiobank (http://www.physionet.org/physiobank/database/#ecg), we have selected the MIT-BIH ArrhythmiaDatabase, because it contains a large variety of ECGs, including signals, whichare rarely observed but clinically important.
The difference with other databases is that it is focussed in heartbeat posi-tions with different QRS morphologies, while others are focussed in other waves,P, T or another features such as ST episodes, rhythm changes, and signal qualitychanges. In addition, this database has been the most used for QRS detectionalgorithms validation, see table 1.
Each ECG record contains three files with different suffixes that indicatetheir content. A record contains:
• .dat (signal) file: a binary file containing the digitized samples of the ECGsignal.
• .hea (header) file: a short text file describing the signal features.
• .atr (annotations) file: it contains labels, each of which describes signalfeatures at specific time, such as QRS complex location, and type.
6

The MIT-BIH Arrhythmia Database contains 48 half-hour excerpts of two-channel ambulatory ECG recordings. However in our software we only analyzeone channel because, as Pan & Tompkins noticed, the electrode positions in anECG device recording are orthogonally placed, so a high-quality signal on onechannel normally implies a low-amplitude ECG with poor signal-to-noise ratioon the second channel [10].
To validate our detector we used some WFDB functions (http://www.physionet.org/physiotools/wfdb.shtml). WFDB is software for viewing,analyzing, and creating recordings of physiologic signals. Our software pro-duces as output a text file with the heartbeat positions that later are convertedinto an annotation (.atr) file. Then this new annotation file is compared withthe original ECG annotation file, and the results are saved in a new text filewith the accuracy of sensitivity and positive predictivity.
The comparison is performed by bxb routine, a basic functionality of theWFDB library, which compares annotations beat-by-beat. The performancemetric is expressed in terms of sensitivity and positive predictivity, given by:
Sensitivity (Se) = TPTP+FN
Positive Predictivity (P+) = TPTP+FP
where TP is the number of true detection, FN is the number of undetectedbeats and FP is the number of false detections.
To automate this process, we have created some Linux scripts in order toautomatically check the result of all ECG records and calculate the mean sensi-tivity and positive predictivity. This allows users framework users to obtain ina fast and convenient way the results of their detection algorithm.
3.4. Pan & Tompkins algorithm
This algorithm was developed in assembly language, using integer arith-metic to be more computationally efficient, and it is able to do real-time QRSdetection. The R wave slope is the typical feature to locate the QRS complex,however it is insufficient for proper QRS detection. For this reason this algo-rithm analysis is based on the slope, amplitude and width of the signal [10].As we mentioned in section 2 this algorithm is divided in two different stages,pre-processing and decision. In the pre-processing stage the signal is preparedfor later detection, removing noise, smoothing the signal and amplifying theQRS slope and width. Later, in the decision stage, thresholds are applied tothe signal in order to remove noise peaks and consider only signal peaks.
3.4.1. Pre-processing stage
The first step of this stage is to pass the signal through a block of filters [20]to reduce noise and influence of the T wave. The block of filters is a cascade oflow-pass and high-pass filters to achieve a 3 dB pass band of 5-12 Hz. Low-passfilter is used to remove noise while high-pass filter attenuates P and T wavesand baseline drift. This digital band-pass filter improves the signal-to-noiseratio and permits the use of lower thresholds than would be possible on theunfiltered signal.
In the next step the derivative is applied to filter output, providing complexslope information. Then the signal is squared point by point, which intensifies
7

the slope of the derivative signal and helps to reduce false positives caused byhigher than usual T waves.
Finally a moving window integrator is applied, which includes informationabout slope and width of the signal. The length of the integration window isvery important because it must always contain the QRS complex that can beof different extents and, nevertheless, not be mixed with other waves such as Twave. In our case we get the best results using a window size of 150ms, whichin case of a sample rate of 360 samples/s, implies 54 samples wide.
All the equations needed for this pre-processing stage are described else-where, [10]. Moreover it should be noted that band-pass filters and the deriva-tive operations cause a delay, which must be considered when the fiducial markis placed.
3.4.2. Decision stage
Once the signal is pre-processed, it is ready for QRS detection. In thisstage two sets of thresholds are applied to both, filtered ECG and the signalafter moving window integration (henceforth mwi). By using thresholds in bothsignals, the reliability of detection is improved compared to using only onewaveform.
The detection thresholds float over the noise that is sensed by the algorithm(considering as noise each peak which is not classified as signal peak), adjustingthem to the signal changing conditions automatically. To accomplish this, first isneeded a peak detection, considering that a peak is a local maximum, and thenclassifying every peak as noise or signal, according to the established threshold.
In our case we developed a local maximum detection algorithm, which de-tects all local maximum of the signal (see Figure 4a). The local maximum is thehighest peak in an interval; in our case we get the best results with an intervalof 80 samples. A smaller interval would detect too many peaks, while a largerone may not detect some signal peaks.
In this algorithm, in order to establish the threshold over the noise (peaks),and then automatically classify peaks as noise or signal, it becomes necessaryto seek the correct initial threshold. Once we have this done, we can proceedwith the execution of the algorithm and then threshold will be automaticallyupdated and it automatically discriminates between noise and signal peaks.
To set the initial threshold, in our case we decided to find the two first Rpeaks (see Figure 4b), and then classifying these two peaks as signal peaks andall peaks found until that second R peak, classified as noise peaks. From thispoint we will have information on signal peaks and noise peaks so that it iseasy to establish initial threshold over the noise. The threshold is calculated asfollows:
SPKI = 0.125 × PEAKI + 0.875 × SPKINPKI = 0.125 × PEAKI + 0.875 ×NPKITHR1 = NPKI + 0.25 × (SPKI −NPKI)THR2 = 0.5 × THR1
• PEAKI is the current signal peak in SPKI calculation or current noisepeak in NPKI calculation
• SPKI is the running estimate of signal peaks
8

(a) Peaks, detected as localmaximum
(b) Two first R peaks and ini-tial threshold
(c) After splitting the sig-nal in segments, and initialthreshold
Figure 4: Stages in the ECG pre-processing, from Pan & Tompkins and Hamil-ton & Tompkins algorithms
• NPKI is the running estimate of noise peaks
• THR1 and THR2 are thresholds; the second threshold is half of the firstbecause it is used in case a search-back is needed.
To classify the two R peaks correctly independently to the waveform mor-phology, we have implemented our own technique as an original contribution.This technique classifies correctly the two first peaks even in signals with higherthan usual T waves.
This technique is to find the median of the first N maximum peaks foundand use a percentage of the median as a threshold. Then the first two pointsabove this threshold are considered R peaks. To search the N first maximum,what we did was split the signal into segments, see Figure 4c, in which at leastone heartbeat is present, regardless heart rate from the ECG.
Considering that physiologically minimum heart rate is 25 beats/min, thismeans that every 2.4 seconds we have at least one heartbeat. In our case,segments are marked every 3 seconds and we look for the maximum peak in everysegment and when we have all the maximum peaks the median is calculated.Next we set the threshold at 35% the median, this percentage was determinedexperimentally after a lot of testing in database’s records.
When we have located the first two peaks, the threshold is applied to thesignal and peaks are classified. Thus the majority of R peaks that representQRS complex are obtained. However, there are lost peaks in some irregularsignals or waves with abrupt changes in amplitude or frequency.
To solve this problem the algorithm uses prior information about RR inter-vals. So if the current RR interval is a 166% higher than the average of the lastRR intervals, a search-back is applied, R peak is considered as the higher peakthat is in the current interval between the THR1 and THR2 thresholds. Thusdetecting heartbeats that otherwise would not be detected.
Moreover, this algorithm includes another technique consisting in false posi-tives removal, which consists in removing peaks considered as T waves. If aftera R peak another peak is detected within 200 ms is considered to be a T-wave,and if it is caught between 200 ms and 360 ms a judgement is made to decide
9

(a) R peaks detected in the derivativesignal
(b) R peaks detected in the mwi signal
Figure 5: Placing the fiducial marks in the R peaks in the derivative and mwisignals
whether it is a T-wave or an ectopic beat. Is considered to be a T-wave if theslope in the derivative signal is less half of the previous peak slope, otherwise itis considered a QRS peak.
To place the fiducial mark, Pan & Tompkins mentioned that can be placedat the point of maximum slope of derivative signal or at the R peak. We triedto put it in both positions and we obtained better results by placing the fiducialmark at the R peak (see Figure 5). Furthermore, as we had located the R peaksand classified as signal peaks or noise peaks, fiducial mark placed at the R peakdid not mean to add more computational calculation to the algorithm.
As we said before, this algorithm applies thresholds over two different signals,derivative signal (Figure 5a) and the signal after moving window integrator(Figure 5b). So we detect the fiducial mark in both signals and then we onlyconsider peaks coincide in both signals as QRS complexes.
To check if a peak is the same in both signals, it is important to take intoaccount the delay between these signals, in this case the delay is half the widthof the integration window. Since it is very unlikely that the R peak coincidesin the same sample in both signals even when taken into account the delay, itis also taken into account a possible deviation of the peak, which after testingwe established in 50 samples. Therefore, when the difference between both Rpeaks is less than 50 samples the peak is considered as a true detection
To check if the R peaks match, we always start from the signal with lesspeaks detected and then look in the other signal if each peak match another. Inour case we always marked the final peaks in the mwi signal, and finally placethose peaks in the original signal considering the delay.
3.5. Hamilton & Tompkins algorithm
Hamilton & Tompkins algorithm [11] consists of a pre-processing stage,which provides a number of events classified as QRS complex and noise, andthen a decision stage at which they added new rules to discriminate among QRSand noise events.
10

(a) Ripples in the mwi. Image taken from [11] (b) Multiple peaks detected due to theripples in the mwi signal in our imple-mentation
Figure 6: The problem of detect various peaks in the same R peak due to theripples in the wave
The most important decision rule is where to place the detection threshold.Other rules are blanking, ignore events that follow a QRS in a set time, backsearch and using the slope to distinguish T-waves and ectopic beats.
To develop this algorithm, we have taken advantage of Pan & Tompkins pre-processing, including the peak detector. The only condition needed in this algo-rithm is to have event vectors, of maximum local peaks, which will be classifiedas noise peaks or signal peaks. Therefore, in this algorithm the pre-processingstage will not be explained since it was explained previously (see 3.4.1).
We are only going to highlight how we solved one of the problems detectedin this algorithm: the local maxima peak detector could falsely detect multiplepeaks due to ripples. Figure 6 shows the problem of multiple ripples and howHamilton & Tompkins algorithm solve it ( 6a) and an example of using a narrowinterval in the peak detector in our development ( 6b)
Hamilton & Tompkins developed an algorithm that avoid multiple detection,they store the first peak position and height and a new peak is defined only aftera height which is less than half of the previous peak. In our implementation weavoid the multiple detection, considering a peak when its value is higher thanits neighbourg in both sides of an interval. This way it does not need to useanother algorithm and it correctly detect only one peak, as maxima.
3.5.1. Decision stage
As in the previous algorithm, this stage is also based on differences betweennoise peaks and signal peaks. Then, it is set a level for noise peaks and anotherfor signal peaks, and detection threshold is set between them.
The main difference with the above algorithm is the manner in which itestablishes noise level and signal level. While in previous algorithm an equationis used to update levels when each peak is detected, in this algorithm differentapproaches were used to obtain these levels.
They focused on optimizing the decision rules, and as we mentioned abovethe most important of these is where to set the detection threshold. They testedthe performance of three estimators to place the adaptive threshold: the mean,median, and an iterative peak level. They concentrate primarily on explaining
11

the advantages and disadvantages of each of these three estimators and theirresults obtained (detection accuracy, false positive rate and false negative rate).
For our development we use the median as estimator, which is the one theyreported as the better, as much for detection accuracy as for fewer false positives.For calculating the adaptive threshold we used this equation:
DT = NPL+ TC × (QRSPL−NPL)
Where DT is the detection threshold, NPL is the noise peak level, TC isthe threshold coefficient and QRSPL is the QRS peak level. The authors affirmthey got the best results with a threshold coefficient of 0.133 and using an evennumber of previous peaks to calculate the median, greater than 6. We attemptwith 8, 10 and 12 data peaks and we achieve similar results. To calculate thefirst two peaks we use the same technique as in the Pan & Tompkins algorithm(see Figure 4).
In this algorithm, in addition to peak level estimation, another decisionrules are used, as search back and refractory blanking. The search back in thisalgorithm is done in a simpler way than the previous. The information of theprevious 8 RR intervals is stored, and when a QRS complex is not found inan interval of length the 150 percent of the median of these RR intervals, thesearch back is applied.
We always keep the highest peak that not exceeds the DT threshold butexceeds the search back threshold, because this peak happens to be considereda QRS complex if there is no R peak exceeding the DT threshold in the searchback interval. Search back threshold was 30% of the detection threshold asauthors established in their paper [11]
Finally, the last decision rule we used was the refractory blanking, whichis to ignore any peak detected in 200ms since the last peak considered a QRScomplex. Initially we tried to classify as T wave or QRS those peaks that arebetween 200 and 360ms from the previous peak, as in the previous algorithm,but in this case we lowered the sensitivity of the detection, so we finally discardthis classification.
According to Hamilton & Tompkins, the fiducial mark should be placed inthe largest peak in the band-passed signal, searching this peak in a range from225 to 125 ms preceding each detected peak in the mwi signal. We placedthe fiducial mark in three different signals: low-pass signal, high-pass signaland derivative signal, by moving back according to the delay that exists ineach signal. The best results were obtained by placing the fiducial mark inthe derivative signal, and then moving the fiducial mark to the original signalaccording to the delay.
3.6. Phasor algorithm
The detection algorithm based on the Phasor transform (henceforth PT) isrecent, year 2010, and it is characterized by its robustness, low computationalcost and mathematical simplicity. In this paper, besides the QRS complex detec-tion, they have made the delineation of all ECG waves, i.e. mark its beginningand end, which brings more utility to ECG analysis for both physicians andbiomedical engineers. Nevertheless we are only interested in the part of thisarticle that focuses on QRS detection.
The PT converts a real function in the complex domain preserving its infor-mation, regarding root mean square and phase values. It converts each instan-
12

(a) (b)
Figure 7: (a) Example of an ECG beat, x[n], where waves are notably low am-plitude, and the resulting PT signal, ϕ[n]. (b) Establishing a threshold of 0.003rad. below the maximum phase variation (π/2). Images extracted from [18].
taneous ECG sample into a complex number, called phasor. A constant valueRv is considered the real part, whereas the imaginary component is the originalvalue of the ECG sample:
y[n] = Rv + jx[n]
Where y[n] is the phasor. The magnitude M[n] and the phase ϕ[n] arecomputed as:
M [n] =√R2
v + x[n]2 and ϕ[n] = tan−1(x[n]Rv
)
Converting each instantaneous ECG sample into a phasor enhances the ECGwaves. Thus, considering instantaneous phase variation in consecutive samplesof the phasor transformed ECG, the slight variations provoked by P and T wavesin the original signal are maximized (Figure 7a). The equations are explainedin depth elsewhere [18].
3.6.1. QRS detection
QRS complexes were detected applying the PT with a value of Rv = 0.001 tothe absolute value of the original ECG, previously removing its baseline wanderwith a forward/backward high-pass filter of 0.5 Hz cut-off frequency. Thus, byestablishing a threshold of 0.003 rad. below the maximum phase variation (π/2),the QRS can be located at those segments exceeding the threshold, Figure 7b.The R peak is set in the maxima magnitude M[n] point of each segment.
When a peak is not detected in an interval longer than the 150% of thelast RR distance, they apply a new search-back with lowered thresholds untilsuccessful detection. In the other hand, when two RR points are localized inan interval lower than 40% of the last RR distance, they remove the one withlower magnitude to prevent double R detection within a beat.
3.6.2. Our implementation
At first we tried to read the digitized signal as we did in the previous algo-rithms. In ECG records the information of the signal is digitized by default, so
13

(a) PT signal, with the beats posions (b) Original signal with the beats positions
Figure 8: PT and original signals in our software with the same beats in bothsignals. The peaks are placed according to the magnitude M[n], for this reasonthe higher beats does not appear in the original signal plot.
its value depends on the analog-to-digital converter gain. In the previous algo-rithms we get the independence of the ADC normalizing the signal, however inthis case we did not achieve the desired results, so we decided to use the ECG’sphysical units that are represented in millivolts.
Once the signal is read, it is normalized and then a forward/backward filteris applied. We first did the normalization as in the previous algorithm, between0 and 1 for the whole signal. Regarding the filter, we used the filtfilt functionprovided in the signal package (http://cran.r-project.org/web/packages/signal/index.html), which allows filtering in both directions with the desiredcut off frequency without producing a delay. Finally we apply the PT to theabsolute value of the filtered signal.
Next we apply the threshold to the PT and seek the maximum magnitudeM[n] values in those segments exceeding the threshold (Figure 8a). Althoughdue to the irregular morphology of the signal, in those sites where the amplitudeof the QRS complex is small, the PT does not reach the threshold. Thereforeour results were far from the article results.
As we were unable to achieve the results obtained for their authors, wecontacted one of the them, A. Martinez, who told us that there was a pre-processing stage that consists of removing the baseline, the DC component,and normalizing the signal. And, although the article does not indicate it, itis appropriate windowing a stretch of the ECG signal and also using adaptivethresholds.
Thus we tried a windowed normalization, both between 0 and 1, and -1 and1. Finally we discarded this option because, although the detection improvedslightly, it added too computational cost seeking the minimum and maximumvalue each time the window is moved along the signal.
However, using adaptive thresholds significantly improved our detection, be-
14

cause it adapts to the signal changes. Due to the experience we had from theprevious algorithms, we decided to calculate the adaptive threshold based inthe median of the latest detected peaks, placing the threshold 0.001 below themedian of the last R peaks, (see Figure 8a).
We also used search back and remove false positive techniques, but instead ofusing only the latest RR interval, we decided to improve it and use the medianof the past 8 RR as in the Hamilton & Tompkins algorithm.
After applying these techniques we reached a little better detection rates,but the results of our phasor based algorithm are still far from the other twoalgorithms. Due to the lack of time we could not do more improvements to thisalgorithm.
4. Results and discussion
In this section we present a comparison of results obtained with the algo-rithms implemented. The values presented are the results we got after doingmultiple tests with each algorithm, and testing different detection parameters.
We can get better results in sensitivity or predictivity changing the param-eters, but improving a term causes worsen the other. For example, in Hamilton& Tompkins or Pan & Tompkins algorithm, if we decide that the interval forsearching local peaks is smaller, the algorithm would detect more peaks, whichwould increase the sensitivity, in this case the predictivity would be worse. Thesame occurs in Pan & Tompkins algorithm to check if a peak is the same inthe derivative signal and mwi signal, if we reduce the interval we get betterpredictivity otherwise we get better sensitivity.
Hence, the results presented in the following tables and graphics are the bestwe get for each algorithm in terms of sensitivity and predictivity.
In table 2 we present the average results we obtained after validated eachalgorithm with the entire database. Comparing the results with table 1 we cansee that we improve the result of the first algorithm, almost reached the secondand we were not able to get the third. To perceive the significant differencesbetween these results, table 5 shows the p values obtained comparing algorithms.
Tables 3 and 4 summarized all the information of the sensitivity and positivepredictivity results, to examine how the distributions of the results behave.
In addition, in Figures 9 and 10 can be seen the results presented by eachalgorithm in each of the 48 analyzed records, from the MIT-BIH ArrhythmiaDatabase. In both figures a zoom is shown to allow differentiating values near100% and finally to highlight the difference between the two best algorithms 2boxplots are provided, (Figure 11).
Algorithm Sensitivity + Predictivity RMS RR error1- Pan & T. 99.79% ± 0.35 99.84% ± 0.39 99.40ms2- Hamilton & T. 99.71% ± 0.46 98.65% ± 3.37 103.99ms3- Phasor 87.12% ± 24.44 93.06% ± 10.96 31387.46ms
Table 2: Mean results for each algorithm over all database records, in terms ofsensitivity, positive predictivity and the RR interval error
15

Algorithm Min. 1st Qu. Median Mean 3rd Qu. Max.Pan & T. 98.06 99.79 99.94 99.80 100.00 100.00
Hamilton & T. 97.68 99.73 99.92 99.72 100.00 100.00Phasor 0.12 88.02 99.29 87.12 99.86 100.00
Table 3: Summary of positive sensitivity results for each algorithm
Algorithm Min. 1st Qu. Median Mean 3rd Qu. Max.Pan & T. 98.13 99.89 100.00 99.89 100.00 100.00
Hamilton & T. 80.44 99.26 99.85 98.65 100.00 100.00Phasor 52.59 89.97 99.09 93.07 99.95 100.00
Table 4: Summary of predictivity results for each algorithm
Compared algorithms Sensitivity p value Predictivity p valuePan & T. vs Hamilton & T. 0.3679 0.0192
Pan & T. vs Phasor 0.0007 9.293e-05Hamilton & T. vs Phasor 0.0008 0.0013
Table 5: Significant differences in the comparison among algorithms
(a) Comparison of all the results (b) Zoom of the comparison
Figure 9: Sensitivity of the three algorithms for the 48 records
16
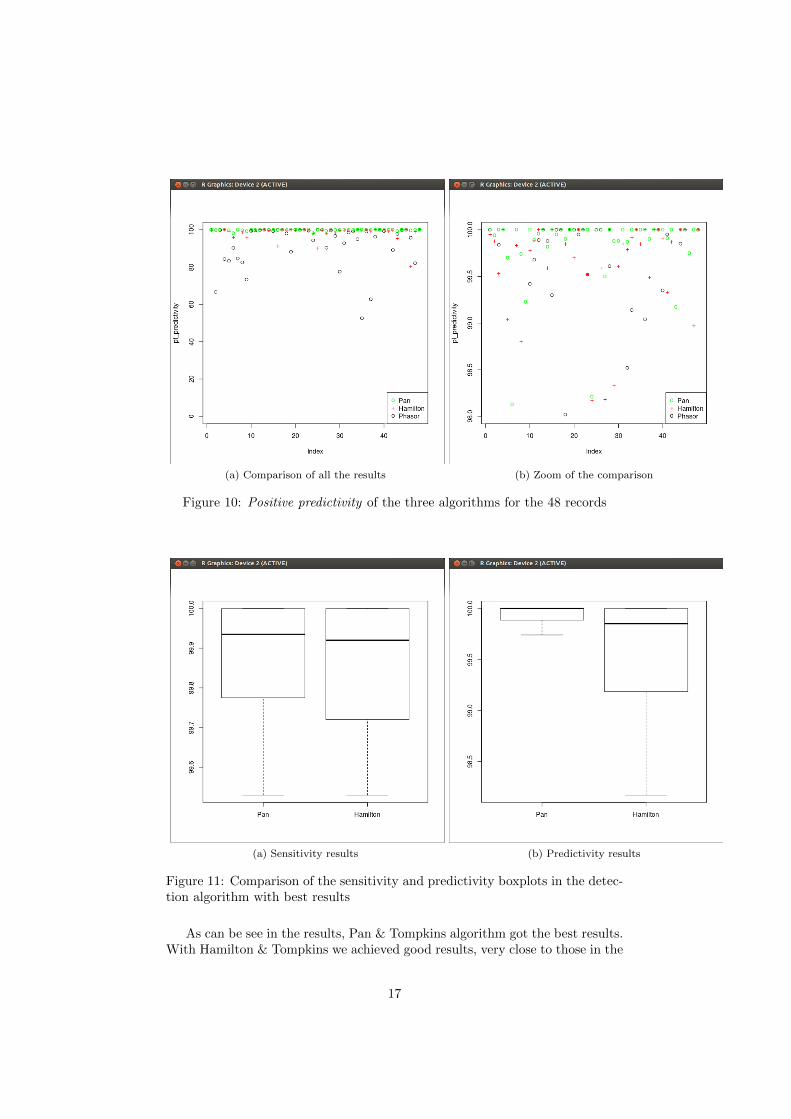
(a) Comparison of all the results (b) Zoom of the comparison
Figure 10: Positive predictivity of the three algorithms for the 48 records
(a) Sensitivity results (b) Predictivity results
Figure 11: Comparison of the sensitivity and predictivity boxplots in the detec-tion algorithm with best results
As can be see in the results, Pan & Tompkins algorithm got the best results.With Hamilton & Tompkins we achieved good results, very close to those in the
17

papers, but as can be seen in Figure 11b, the predictivity is significantly lowerthan Pan & Tompkins algorithm. Finally with the Phasor algorithm we got theworst results.
After developing the 3 algorithms we can conclude that Pan & Tompkinsand Hamilton & Tompkins, can be implemented and reproduce results similarto those obtained by their authors, while for the case of the Phasor the resultswere not reproducible.
In the phasor work, they do not fully explained what are the necessarypre-processing operations to prepare the signal before applying the transform.Because of this ambiguity or our ignorance, we were not able to achieve betterresults.
5. Conclusions and future works
In this research work we have compared the performance of three of the bestQRS detection algorithms, getting the results presented in the previous section.
As a result, besides the implementation of the three algorithms, we havebegun the development of a ECG analysis software tool. This tool will permitto read ECGs records in different formats, ECG analysis, and visualization bydifferent plots and automated validation of the obtained results. At this mo-ment, this tool has already incorporated: three detection algorithms, differentplotting functions and scripts for automatic validation using the WFDB library.
We have created our software as an open source tool to share with the sci-entific community. This way anyone can use it as a basis for their work, andexpand it or improve it if they wish. In addition, having a detection algorithmwith a good accuracy that greatly facilitates the detection or subsequent delin-eation of all ECG waves.
Our software is also suitable for those who want to start in electrocardiogra-phy, having the opportunity to test some functionality that until now was notavailable, and have access to source code and documentation explaining howwork each part of the developed algorithms.
A future improvement will be: complete the package, reading different ECGformats, and validate the software over different databases.
6. References
[1] L. Sornmo and P. Laguna, Bioelectrical Signal Processing in Cardiac andNeurological Applications. Elsevier Academic Press, June 2005.
[2] O. Pahlm and L. Sornmo, “Software qrs detection in ambulatory monitoring— a review,” Medical and Biological Engineering and Computing, vol. 22,no. 4, pp. 289–297, 1984.
[3] G. Moody and R. Mark, “The impact of the mit-bih arrhythmia database,”Engineering in Medicine and Biology Magazine, IEEE, vol. 20, no. 3,pp. 45–50, 2001.
[4] R Core Team, R: A Language and Environment for Statistical Computing.R Foundation for Statistical Computing, Vienna, Austria, 2012. ISBN 3-900051-07-0.
18

[5] G. Friesen, T. Jannett, M. Jadallah, S. Yates, S. Quint, and H. Nagle,“A comparison of the noise sensitivity of nine qrs detection algorithms,”Biomedical Engineering, IEEE Transactions on, vol. 37, no. 1, pp. 85–98,1990.
[6] B.-U. Kohler, C. Hennig, and R. Orglmeister, “The principles of soft-ware qrs detection,” Engineering in Medicine and Biology Magazine, IEEE,vol. 21, no. 1, pp. 42–57, 2002.
[7] N. Arzeno, Z.-D. Deng, and C.-S. Poon, “Analysis of first-derivative basedqrs detection algorithms,” Biomedical Engineering, IEEE Transactions on,vol. 55, no. 2, pp. 478–484, 2008.
[8] V. Afonso, W. J. Tompkins, T. Nguyen, and S. Luo, “Ecg beat detectionusing filter banks,” Biomedical Engineering, IEEE Transactions on, vol. 46,no. 2, pp. 192–202, 1999.
[9] M. Okada, “A digital filter for the qrs complex detection,” BiomedicalEngineering, IEEE Transactions on, vol. BME-26, no. 12, pp. 700–703,1979.
[10] J. Pan and W. J. Tompkins, “A real-time qrs detection algorithm,” Biomed-ical Engineering, IEEE Transactions on, vol. BME-32, 1985.
[11] P. S. Hamilton and W. J. Tompkins, “Quantitative investigation of qrsdetection rules using the mit/bih arrhythmia database,” Biomedical Engi-neering, IEEE Transactions on, vol. BME-33, no. 12, pp. 1157–1165, 1986.
[12] J. Martinez, R. Almeida, S. Olmos, A. Rocha, and P. Laguna, “A wavelet-based ecg delineator: evaluation on standard databases,” Biomedical En-gineering, IEEE Transactions on, vol. 51, no. 4, pp. 570–581, 2004.
[13] C. Li, C. Zheng, and C. Tai, “Detection of ecg characteristic points us-ing wavelet transforms,” Biomedical Engineering, IEEE Transactions on,vol. 42, no. 1, pp. 21–28, 1995.
[14] B. Abibullaev and H. Seo, “A new qrs detection method using waveletsand artificial neural networks,” Journal of Medical Systems, vol. 35, no. 4,pp. 683–691, 2011.
[15] Q. Xue, Y. Hu, and W. J. Tompkins, “Neural-network-based adaptivematched filtering for qrs detection,” Biomedical Engineering, IEEE Trans-actions on, vol. 39, no. 4, pp. 317–329, 1992.
[16] D. Coast, R. Stern, G. Cano, and S. Briller, “An approach to cardiacarrhythmia analysis using hidden markov models,” Biomedical Engineering,IEEE Transactions on, vol. 37, no. 9, pp. 826–836, 1990.
[17] R. Poli, S. Cagnoni, and G. Valli, “Genetic design of optimum linear andnonlinear qrs detectors,” Biomedical Engineering, IEEE Transactions on,vol. 42, no. 11, pp. 1137–1141, 1995.
[18] A. Martınez, R. Alcaraz, and J. J. Rieta, “Application of the phasor trans-form for automatic delineation of single-lead ecg fiducial points,” Physio-logical Measurement, vol. 31, no. 11, p. 1467, 2010.
19

[19] A. L. Goldberger, L. A. N. Amaral, L. Glass, J. M. Hausdorff, P. C. Ivanov,R. G. Mark, J. E. Mietus, G. B. Moody, C.-K. Peng, and H. E. Stanley,“PhysioBank, PhysioToolkit, and PhysioNet: Components of a new re-search resource for complex physiologic signals,” Circulation, 2000.
[20] P. Lynn, “Online digital filters for biological signals: some fast designs fora small computer,” Medical and Biological Engineering and Computing,vol. 15, no. 5, pp. 534–540, 1977.
20