a comparison of the stability of measures of personality ... · specific pattern of ... differences...
TRANSCRIPT

A Comparison of the Stability of Measures of Personality Traits, Self-Esteem, Affective Well-Being, and Cognitive
Well-being
by
Ivana Anusic
A thesis submitted in conformity with the requirements
for the degree of Master of Arts
Graduate Department of Psychology
University of Toronto
© Copyright by Ivana Anusic 2008

ii
A Comparison of the Stability of Measures of Personality Traits, Self-Esteem, Affective Well-Being, and Cognitive Well-being
Ivana Anusic
Master of Arts
Graduate Department of Psychology
University of Toronto
2008
Abstract
A variety of statistical models have been developed to examine longitudinal stability and change
of individual differences. Kenny and Zautra’s (1995) trait-state-error (TSE) model models
stability as a function of stable variance that does not change (trait), moderately stable variance
that changes over time (state), and error variance. Applications of this model have been limited
to panel studies with repeated observations of the same individual. The present study developed
a non-linear regression model to apply the TSE model to retest correlations from different
samples. This model was used to compare the stability of measures of personality traits, affective
well-being (AWB), cognitive well-being (CWB), and self-esteem. After correcting for
differences in reliability, age, gender, and scale length, the amount of trait (vs. state) variance
was similar across constructs. Stability of the state component was highest for AWB and CWB,
suggesting that situational influences have most enduring effects on these two constructs.

iii
Table of Contents
Abstract ...........................................................................................................................................ii
Table of Contents ...........................................................................................................................iii
List of Tables................................................................................................................................... v
List of Figures ................................................................................................................................vi
Chapter 1 – Introduction ................................................................................................................. 1
1.1 Types of Longitudinal Stability of Individual Differences ................................................... 1
1.2 Models of Longitudinal Stability .......................................................................................... 3
1.2.1 Linear Model .................................................................................................................. 3
1.2.2 Heise’s (1969) Model..................................................................................................... 3
1.2.3 Trait-State-Error Models ................................................................................................ 5
1.3 Hierarchy of Consistency...................................................................................................... 6
1.4 Previous Studies of Stability ................................................................................................. 8
1.5 Estimating TSE using Nonlinear Regression ...................................................................... 11
1.6 Overview of Present Study.................................................................................................. 13
Chapter 2 – Method....................................................................................................................... 16
2.1 Database construction ......................................................................................................... 16
2.2 Process of analysis .............................................................................................................. 19
Chapter 3 – Results ....................................................................................................................... 23
3.1 Database Characteristics ..................................................................................................... 23
3.2 Overall Analysis.................................................................................................................. 24
3.3 Construct as Moderator ....................................................................................................... 24
3.4 Scale Length, Age, Gender, and Construct as Moderators of Stability .............................. 27
Chapter 4 – Discussion.................................................................................................................. 33

iv
4.1 Limitations and Future Directions....................................................................................... 36
References ..................................................................................................................................... 38
v
List of Tables
Table 1 Means (and standard deviations) for age, gender distribution, and scale length
across individual difference constructs. AWB = affective well-being, CWB =
cognitive well-being........................................................................................................ 23
Table 2 Estimates (and 95% confidence intervals) of the TSE model parameters from
non-linear regression with construct as moderator. AWB = affective well-being,
CWB = cognitive well-being .......................................................................................... 25
Table 3 Estimates (and 95% confidence intervals) of the TSE model parameters from
non-linear regression with construct, scale length, and age as moderators. AWB
= affective well-being, CWB = cognitive well-being..................................................... 28

vi
List of Figures
Figure 1 Trait, state, error model based on Kenny and Zautra (1995). O = observed
score, rel = reliable variance, E = error variance, T = trait variance, S = state
variance, stab = stability of the state component. .......................................................... 12
Figure 2 Scatter plots of retest correlations and the regression curves for the measures of
personality, self-esteem, affective well-being, and cognitive well-being...................... 26
1
Chapter 1 – Introduction
A basic tenet of personality psychology is that individuals tend to behave in consistent
manner, and that the consistency in behaviour is caused by personality traits; that is, enduring,
internal dispositions. It has been proposed that these traits develop during childhood, but remain
stable during adulthood (e.g., Costa & McCrae, 1994; James, 1890).
Empirical support for this hypothesis stems from longitudinal studies that have
demonstrated stability of individual differences over long periods of time for a diverse set of
personality characteristics such as personality traits (Conley, 1984; 1985; Roberts & DelVecchio,
2000), self-esteem (Trzesniewski, Donnellan, & Robins, 2003), well-being (Lucas & Donnellan,
2007), intelligence (Conley, 1984), and vocational interests (Low, Yoon, Roberts, & Rounds,
2005). However, due to methodological constraints, these articles did not examine the amount of
trait variance in these constructs. Moreover, few articles have examined whether some constructs
are more heavily influenced by stable dispositions than others (Conley, 1984). The purpose of
the present paper is to provide a meta-analytic examination of the relative contribution of
different sources of stability and change to stability of four individual difference constructs:
personality, self-esteem, cognitive well-being (CWB; e.g., life satisfaction), and affective well-
being (AWB).
1.1 Types of Longitudinal Stability of Individual Differences
Two types of stability of psychological constructs are generally studied: absolute stability
and rank-order stability. Absolute stability concerns stability of mean-levels, whereas rank-order
stability refers to the stability of the level of an individual to the average level at any time of
measurement. Stability or change of means provides little information about the stability of
individual differences. Absolute levels can change, even if individual differences are highly

2
stable (e.g., height of children at ages 4, 5, & 6). It is also possible that mean levels remain
stable, while individual differences change over time (e.g., life satisfaction in Germany over the
past 20 years). The focus of this paper is exclusively on rank-order stability of individual
differences.
Rank order stability is assessed through test-retest correlations. Correlations are not
influenced by changes in the mean level because scores are first standardized to a constant mean
of zero. To the extent that individuals retain their rank-ordering on a construct measure, the retest
correlation would be high and positive. Taken to the extreme, the conceptualization of human
behaviour as caused by stable trait dispositions would predict perfect rank-order stability. That
is, retest correlations would be 1.00 regardless of the length of the retest interval. Of course,
correlations of 1.00 are virtually unknown in research. Instead, researchers repeatedly find a
specific pattern of retest correlations over time (e.g., Low et al., 2005; Roberts & DelVecchio,
2000; Trzesniewski et al., 2000). Four aspects characterize this pattern. First, retest correlations
tend to be positive even over extremely long time periods. Second, retest correlations taken over
longer time intervals tend to be lower than retest correlations taken over shorter time intervals.
That is, retest correlations decrease with increasing retest intervals. Third, the rate of this
decrease is faster over shorter intervals than over longer intervals. For example, the difference
between 1-year and 5-year retest correlations tends to be substantially larger than the difference
in retest correlations taken over 10-year and 15-year intervals. Fourth, even at very short-term
intervals (e.g., 1 day or less), the retest correlations are less than 1.00.
A valid model of stability and change in individual differences would need to account for
this pattern and explain (1) why retest correlations are positive, (2) why the retest correlations are
short of unity at very short retest intervals, (3) why retest correlations are lower for longer time

3
intervals than for shorter time intervals, and (4) why the rate of this decrease is faster for shorter
than longer intervals.
1.2 Models of Longitudinal Stability
1.2.1 Linear Model
Most meta-analyses (e.g., Low et al., 2005; Roberts and DelVecchio, 2000; Trzesniewski
et al., 2003), have relied on the strict linear model of construct stability. According to this model,
stability can be modeled as a function of single parameter that reflects the constant rate of change
for a specified time interval (e.g., one year). Thus the model predicts a uniform linear decline of
retest correlations as the retest interval increases. However, the linear model also makes
theoretically unlikely predictions. For example, because the correlations are assumed to show a
linear decline with an increase in time interval, the model predicts that the retest correlations will
eventually become negative. This would imply that we would see a reverse in individual
differences over time. For example, individuals who are happy or sociable would over time
become unhappy and shy. This prediction has no theoretical basis. That is, a plausible
explanation for an inversion of the rank-order over time is lacking. In addition, the model is
inconsistent with empirical finding that retest correlations are always positive. Finally, the model
is inconsistent with the finding that the rate or decline in retest correlations is not linear. Thus,
the linear model does not provide a satisfactory explanation of the actual pattern of retest
correlations.
1.2.2 Heise’s (1969) Model
A more complex model was developed by Heise (1969). This model assumes that retest
correlations are influenced by three independent factors: (a) the reliability of the measure, (b) the

4
stability of the reliable variance over a fixed time interval (e.g., annual stability), and (c) the
length of the retest interval (e.g., number of years). These three factors determine observed
correlations according to the formula:
Retest correlation = Reliability x StabilityRetest Interval
The major contribution of this model is that it controls for unreliability of the measures.
Thus, it is possible to make an estimate of stability of the “true” construct in question.
Furthermore, Heise’s (1969) model predicts a non-linear trend in change of retest correlations.
As a result, the model avoids the problem of the linear model that retest correlations will
eventually become negative. Instead the model assumes that retest correlations will eventually
become zero.
Heise’s (1969) model provides a superior account of empirical patterns of retest
correlations (e.g., Conley, 1984). The main problem of this model is its prediction that retest
correlation will eventually reach a value of zero. This prediction relies on the implicit
assumption that all of the reliable variance is state variance that can change over time. Even high
levels of stability are merely a function of stability of state variance. This assumption is
fundamentally different from the assumption of personality psychology that individual
differences are influenced by stable traits. Thus, the relatively good fit of this model to empirical
data might suggest that this fundamental assumption of personality psychology is flawed. High
stability over time could just reflect stable environmental factors or social class rather than true
internal dispositions. However, ample evidence from behavioural genetics studies undermines
this conclusion. Twin studies suggest that most of the stable variance in personality traits and
well-being measures is heritable (Lykken & Tellegen, 1996; McGue, Bacon, & Lykken, 1993;
Nes, Roysamb, Tambs, Harris, & Reichborn-Kjennerud, 2006)

5
There are two alternative explanations for these contradictory findings regarding the
importance of personality traits. On the one hand, it is possible that twin studies are biased due to
violations of basic assumptions (e.g., equal environment assumption). On the other hand, it is
possible that Heise’s (1969) model is incorrect even though it has a relatively good fit to actual
data. It is possible that a model with an additional trait component would provide an even better
fit to the data.
1.2.3 Trait-State-Error Models
Several models with an explicit trait component have been developed (Cole, Martin, &
Steiger, 2005; Kenny & Zautra, 1995; Steyer & Schmitt, 1994). Although the specifics of these
models vary, they are based on a common underlying theory: variation between individuals on
any construct can be partitioned into three separate sources. One source of variability between
individuals is error. Psychological scales are never perfectly reliable. Because measurement error
is assumed to be random and thus uncorrelated over time, this source would account for point (3)
above, that even at very short retest-intervals, the retest correlations are short of 1.00. In fact,
measurement error would predict that in the hypothetical situation in which the same test is
administered twice at the same time (i.e., retest interval is zero), the retest correlation would be
less than 1.00 and would be equal to the period-free test reliability, or the proportion of reliable
variance in the observed test scores.
Another source of variation in individual difference scores is true variability on a certain
construct. Some people are happier than others, some have higher self-esteem, and some are
more neurotic. Thus, even if we are able to remove all variation due to error, some variation
between individuals would remain. Furthermore, the true variation between individuals can
further be partitioned into a stable component (trait) and a changing component (state).

6
Variability due to state may be conceptualized as situation-specific variation. Situational factors
may contribute to lower retest correlations. For example, an individual who feels ill at one of the
assessment waves may rate himself lower on the happiness scale at that particular wave, yet at
the next wave the individual rates himself higher than usual on happiness because he had just
received a raise. Thus, the rating on a certain construct may depend on the situation, either
environmental (e.g., testing room) or internal (e.g., mood), in which the person finds him- or
herself at the time of assessment.
On the other hand, a person may still rate himself as happier than other people would rate
themselves if they were in a similar situation. Thus, to some degree, the differences between
individuals are stable under stable conditions. This source of variation between individuals
comes from the stable trait dispositions. Variation due to trait is stable over time and is not
affected by the length of the retest time interval. The stability in variation between individuals
may be caused by internal (e.g., genetic) factors, or very stable environments.
In sum, the model that fits the observed patterns of retest correlations predicts that there
are three sources of variation between individuals: trait, state, and error. The purpose of the
present paper is to examine the stability of individual differences in personality, self-esteem,
CWB, and AWB in the context of the trait-state-error model. In addition, we compare the
relative contribution of these three sources of variance across these four individual difference
constructs in order to develop a hierarchy of consistency (e.g., Conely, 1984). Using a meta-
analytic approach, we provide a comprehensive analysis of available data in literature.
1.3 Hierarchy of Consistency
Early studies have suggested that some individual differences show higher rank-order
stability than others (e.g., Darley, 1938; Fansworth, 1938). Based on results from a 20-year
longitudinal study, Kelly (1955) concluded that vocational interests and values were more stable
7
than personality traits, which were in turn more stable than attitudes. Informed by previous
longitudinal studies of intelligence (Barley & Oden, 1955; Owens, 1953), Kelly also speculated
that this construct would be at the top of the hierarchy of consistency of individual differences.
Conley (1984) conducted the first meta-analysis of retest correlations of intelligence, personality
traits, and self-opinions (e.g., life satisfaction, self-esteem) to test Kelly’s proposed hierarchy of
consistency. The results were consistent with Kelly’s predictions, as intelligence topped the
hierarchy with annual stability, followed by personality traits, with self-opinions being at the
bottom of the hierarchy of stability. Superior stability of personality traits over life satisfaction
has since been replicated by Fujita and Diener (2005). However, the difference between self-
esteem and personality was not replicated in another study in which the authors found that
stability of self-esteem and personality was equal (Trzesniewski et al., 2003). Additionally, Low
et al. (2005) conducted a meta-analysis of retest correlations of vocational interests across
lifespan that confirmed Kelly’s (1955) observation that vocational differences are more stable
than personality traits.
In this study we restrict our comparisons to closely related measures of personality, self-
esteem, CWB, and AWB. The focus on these constructs allows us to test Schimmack and
colleagues mediator model of the relation between personality traits and well-being.
(Schimmack, Diener, & Oishi, 2002; Schimmack, Radhakrishnan, Oishi, Dzokoto, & Ahadi,
2002; Schimmack, Schupp, & Wagner, in press). Accordingly, personality traits are stable
internal dispositions that influence the amount of pleasure and displeasure that people experience
over time. However, AWB is also influenced by life circumstances and the events individuals
encounter. Thus, measures of AWB should have relatively less trait variance than measures of
personality traits. Finally, personality traits are assumed to influence life-satisfaction only
because people rely on their affective experiences to evaluate their lives. However, they also

8
consider other aspects of their lives that are more strongly influenced by life circumstances. As a
result, life-satisfaction judgments should have even less trait variance than measures of AWB.
Finally, self-esteem is included because it is often highly correlated with life-satisfaction
judgments, and it is often difficult to demonstrate discriminant validity of these two constructs
(Lucas, Diener, & Suh, 1996). However, Schimmack et al.’s (2002) model assumes that life-
satisfaction and self-esteem should differ in the amount of trait variance. Whereas life
circumstances can change individual’s evaluations of their lives, they may not influence
individual’s evaluations of their personality characteristics. For example, unemployment has
notable effects on affective and cognitive wellbeing, but does not alter personality traits
(Schimmack et al., in press).
1.4 Previous Studies of Stability
It is often difficult to compare the results of different studies because they used different
models of stability. The main problem arises from comparisons of studies that rely on observed
correlations versus studies that correct for random measurement error. In the largest published
meta-analysis of longitudinal research on personality, Roberts and DelVecchio (2000) concluded
that stability of personality over a 1-year interval is .55. This estimate is based on observed retest
correlations without controlling for measurement error. To the extent that measurement error
works to lower the retest correlations, this estimate is likely to be an underestimate of the true
stability of personality. Another meta-analysis conducted by Conley (1984) places the estimate
of personality stability over a one-year interval at .98 after controlling for measurement error.
Differential treatment of measurement error produced similar discrepancy between estimates of
self-esteem stability over a one year interval for self-esteem. Whereas Conley (1984) estimated
stability to be .93 after controlling for random error, Trzesniewski et al. (2003) obtained an
estimate of .50 without controlling for random error.
9
Even the comparison of uncorrected estimates for different constructs could be biased if
measures of different constructs have different reliabilities. For example, Trzesniewski et al.
(2003) found strikingly similar stability estimates for personality traits and self-esteem
(personality: .43 in childhood, .64 in mid-adulthood; self-esteem: .40 in childhood, .62 in
adulthood). This finding contradicts Conley’s (1984) hypothesis that personality traits are more
stable than self-esteem. One potential explanation for this discrepancy could be that Conley
compared corrected stability coefficients, whereas Trzesniewski et al. (2003) compared observed
stability coefficients. Another potential reason could be that Conley’s analyses were based on
very few data points. Finally, the comparison may be biased because the coefficients reflect
stability over different time periods. Whereas the stability coefficients for personality traits are
based on an average time interval of 6.7 years, the average retest interval for self-esteem was
only 2.9 years. As retest correlations decrease over time, the results are actually consistent with
Conley’s hypothesis that personality traits are more stable than self-esteem. However, the
reliance on observed coefficients and the variation in time intervals makes it difficult to draw
firm conclusions from these findings.
Surprisingly few studies have used the TSE model to examine the stability of individual
differences. Ormel and Rijsdijk (2000) applied the TSE model to a five-wave study of
personality. Their results suggested that 22% of observed variance in neuroticism was error. Of
the reliable variance, 49% was accounted by the stable trait and 51% was due to the state factor
and would change over time. Stability of the state factor was estimated at .92, which means that
84% (.922 = .84) of the state variance was shared between two consecutive yearly assessments.
However, Ormel and Rijsdijk’s (2000) study lacked statistical power to reliably distinguish
whether the TSE or the state-only model provided a better fit to the data, casting doubt on the
reliability of these estimates. If the analysis cannot distinguish whether the trait component is

10
present as a source of variance, the asymptote of the decline in retest correlations over time has
not been reached and the estimates of the proportion of trait and state are likely to be biased.
Thus, the study lacked statistical power. An advantage of our novel meta-analytic TSE model is
that it can use information from all studies that have reported retest correlations to estimate the
same parameters with more statistical power. Moreover, the estimates are less likely to be biased
by peculiar aspects of a single study.
Lucas and Donnellan (2007) applied the TSE model to life satisfaction data obtained
from two large panels and found that 33% of observed variance is attributable to measurement
error. On average, 50-57% of the reliable variance in life satisfaction scores was stable trait
variance that does not change over time, while 43-50% of the variance was due to the state factor
that changed over time. Comparison of these estimates with those obtained in the study by Ormel
and Rijsdijk’s (2000) would indicate that life satisfaction is similar, or even more stable, than
personality. However, at least two studies (Conley, 1984; Fujita & Diener, 2005) suggest the
opposite, casting further doubt on the replicability and validity of Ormel and Rijsdijk’s (2000)
estimates.
The TSE models have also been applied to longitudinal data of negative affective
symptoms. Cole, Nolen-Hoeksema, Girgus, and Paul (2006; see also Cole, 2006; Cole & Martin,
2005) examined the TSE model in context of Children’s Depression Inventory (CDI; Kovacs,
1985). They found that in adolescence, over a period of 3 years, 60% of valid variance in CDI
scores is due to trait and 40% to state factors. Only 11% of observed variance was measurement
error, indicating high reliability of this test. The stability of the state component of the CDI was
.63, which means that 40% of the state variance carried over from one year to the next. Zautra,
Marbach, Raphael, & Kenny (1995) examined stability of distress symptoms over 10 months and
found that the major part of reliable variance (81%) was due to trait and the rest (19%) was due

11
to state influences. The high proportion of the trait variance is likely due to the short-term nature
of the study (10 months). We suspect that this estimate would be lower and more consistent with
Cole et al.’s (2006) findings over longer time periods. Surprisingly little variance in observed
distress scores (7%) was due to error. The results of this study combined with Cole et al.’s
(2006) findings would suggest that negative affective states are more stable than personality and
life satisfaction over long periods of time. However, as we pointed our earlier, Ormel and
Rijsdijk’s (2000) results are likely unreliable. Thus, the proportion trait variance in the reliable
component of personality measures is likely to be larger than trait variance in AWB measures.
1.5 Estimating TSE using Nonlinear Regression
Although the TSE model is highly theoretically feasible, its applications in published
literature are surprisingly sparse. The main reason is that it is necessary to obtain a minimum of
four measures over a reasonably long time period in large samples to obtain parameter estimates.
Few psychological studies fulfill these requirements. Additional reasons have been
methodological problems in the implementation of the model (Cole et al., 2005). Moreover, the
model has never been used to test differences in the stability of different personality
characteristics, which would require that both characteristics are measured repeatedly in the
same sample.
Our development of a statistical model that can be used to meta-analyse data from
different studies overcomes these problems. Meta-analysis is a very useful tool in avoiding
sampling bias and often have high statistical power (Hunter & Schmidt, 2004). Although this
approach suffers from the problems common to all meta-analyses, it uses the advantages of
meta-analysis and the strength of the TSE model to provide novel insights into the stability and
change of personality characteristics. In addition, because of the high number of waves and data,
12
we do not need to use multiple assessments of a single construct in order to estimate error
variance, and can estimate reliability even for single-item measures.
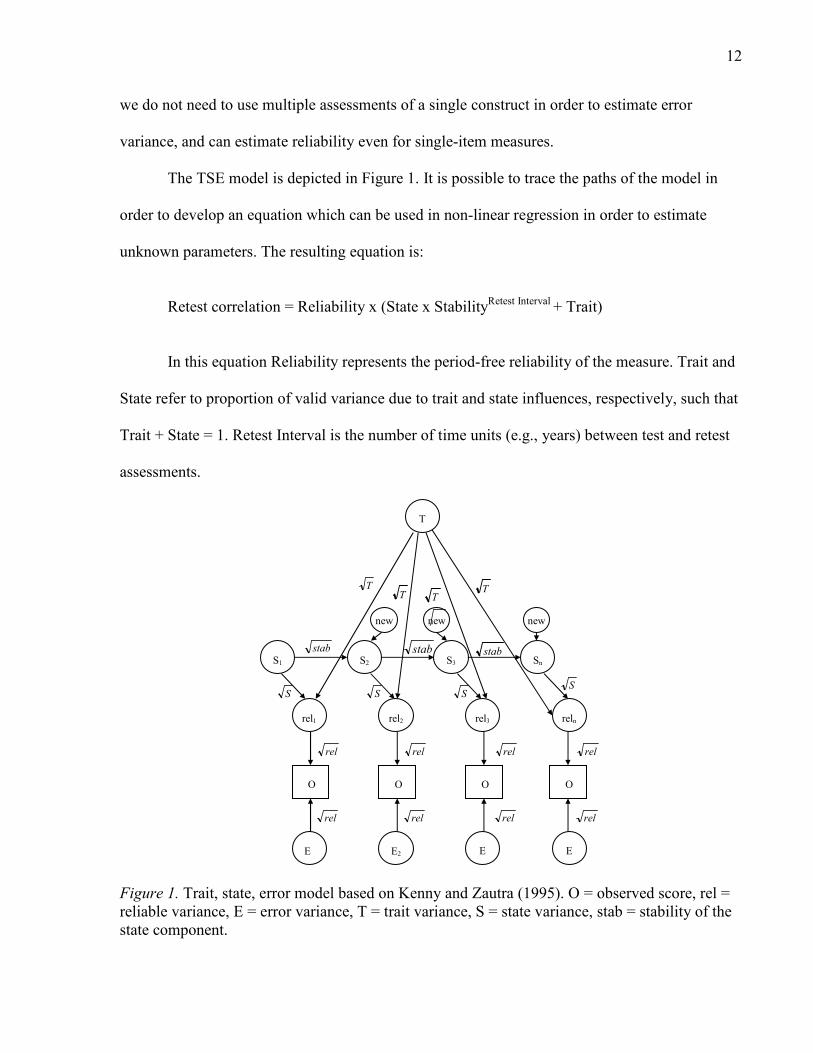
The TSE model is depicted in Figure 1. It is possible to trace the paths of the model in
order to develop an equation which can be used in non-linear regression in order to estimate
unknown parameters. The resulting equation is:
Retest correlation = Reliability x (State x StabilityRetest Interval
+ Trait)
In this equation Reliability represents the period-free reliability of the measure. Trait and
State refer to proportion of valid variance due to trait and state influences, respectively, such that
Trait + State = 1. Retest Interval is the number of time units (e.g., years) between test and retest
assessments.
Figure 1. Trait, state, error model based on Kenny and Zautra (1995). O = observed score, rel =
reliable variance, E = error variance, T = trait variance, S = state variance, stab = stability of the
state component.
S1 S2 S3 Sn
rel1
O
O
O
O
E E2 E
E
rel2 rel3 reln
T
new new new
T
T
TT
stab stab stab
S S S S
rel rel rel rel
rel rel rel rel

13
It is further possible to add interaction terms to the above equation in order to test for
moderating effects or control for confounding variables. First, the equation needs to be rewritten
in a form that isolates the state variable (similarly, the equation can be rewritten to isolate the
trait variable):
Retest correlation = Reliability x (State x StabilityRetest Interval
+ Trait) �
Retest correlation = Reliability x (State x StabilityRetest Interval
+ 1 – State) �
Retest correlation = Reliability x (State x (StabilityRetest Interval
– 1) + 1)
Next, the moderator can be added to each of the parameters:
Retest correlation = (Reliability + mRel x ModVar) x ((State + mState x ModVar) x
((Stability + mStab x ModVar)Retest Interval
- 1) + 1)
In this equation, ModVar represents the possible moderator variable (e.g., domain, age).
mRel, mState, and mStab refer to the moderating effects of the moderator variable on reliability,
state, and stability, respectively. Examination of confidence intervals provides further
information on reliability of estimates of moderating effects. Moderator effects on trait variance
can be obtained by multiplying the moderator effect on state by -1.
1.6 Overview of Present Study
Personality measures have been developed to assess stable and trait-like individual
differences. Thus, we predict that personality trait measures will be most stable over longer
periods of time. As such, we predict that personality is highly resilient to environmental
influences and that any such influences on the state component would be short-lived, resulting in
low stability of the state component over time. Thus our predictions of personality stability are
higher than found by Ormel and Rijsdijk’s (2000). However, as their study was not able to

14
distinguish between state-only and TSE model, we believe that their study is not representative
of personality measures in general and that the proportion of trait variance in their study was
underestimated.
Rather, we suspect that the estimates of trait and state variance of personality will be
similar to those obtained in studies of affective experiences (e.g., Cole, 2006; Cole et al., 2006;
Cole & Martin, 2005; Zautra et al., 1995). Personality has been strongly linked to affective states
(Costa & McCrae, 1980; Larsen & Ketelaar, 1991). However, because people also rely on
external life circumstances to judge their AWB, we predict that the proportion of trait variance
will be lower for AWB measures, compared to personality measures, once differences in
measurement error are controlled for.
On the other hand, results of available research on CWB suggest that its long-term
stability is substantially lower than stability of personality (Conley, 1984; Fujita & Diener, 2005)
and affect (Cole et al., 2006; Lucas & Donnellan, 2007). Lucas and Donnellan’s (2007) findings
of roughly even proportions of trait and state variance in life satisfaction judgements were based
on large, nationally representative samples. Thus, we predict that the results of our meta-analysis
would be similar.
No published studies have yet examined self-esteem in the context of the TSE model.
Conflicting conclusions about self-esteem’s standing in the hierarchy of consistency relative to
personality (Conley, 1984; Trzesniewski et al., 2003) make our study of the stability of this
construct largely exploratory. We suspect that, because self-esteem is an attitude towards the
self, and the self is defined by the personality traits in the Western world (Cousins, 1989), self-
esteem judgements would be influenced more by personality than by external circumstances.
Thus, we expect that self-esteem judgments would have a higher trait component than CWB
judgments.

15
In sum, because of strong influences of genes and stable environments on human
behaviour, we predict that all measures of individual differences would reflect a substantial
amount of trait variance. However, we also predict that some individual differences would be
more stable than others after adjusting for differences in measurement error. Specifically,
personality measures should show highest proportion of trait variance, closely followed by AWB
and self-esteem measures. We expect that CWB measures would show the lowest amount of trait
variance because of strong influences of life circumstances on subjective judgements of well-
being.

16
Chapter 2 – Method
2.1 Database construction
Self-esteem data was obtained from the first author of the Trzesniewski et al. (2003)
meta-analysis. Preliminary data collection for other constructs consisted of searching PsycInfo
and WebOfScience databases with keywords for individual differences (i.e., personality, affect,
feelings, mood, life satisfaction, happiness) paired with each of the following keywords:
consistency, stability, longitudinal, trait, change. Articles obtained in this manner were scanned
for information about retest correlations, and articles that reported retest correlations were
retained for the inclusion in the database. If an article was based on a longitudinal study but did
not report retest correlations, we contacted the article’s first author and asked to provide the
relevant information. Next, we searched for any additional relevant papers that may have been
missed by our preliminary search by reviewing the references of the selected articles and
searching for any newer papers that cited them.
For our analyses, we defined the unit of analysis as the smallest sample within a study for
which retest information was provided. For example, if a study contained separate information
on younger and older males and females, we coded these as four different samples (i.e., younger
females, younger males, older females, older males) and thus they provided four distinct points
in our analyses. Our initial database contained 1820 cases.
For each of the samples we coded the following information.
Age. Age was coded as given at the start of the retest interval. We coded the mean or
median if they were reported in the original paper. If range was reported, we took the mean of
the two endpoitns. Some articles also reported information on sample sizes of specific age

17
groups (e.g., 10 participants aged 12-15, 48 participants aged 16-20). In these cases we estimated
age as the weighted mean of given ages (e.g., [10x13.5 + 48x18] / [10+48] = 17.22).
In order for the regression results to be more meaningful, we created a new age variable
that was a linear transformation of the actual age, such that the new variable equalled (age – 15) /
10. Thus the zero value of the new variable represented age of 15 (the youngest participants in
our sample), and each successive increment of 1 unit of the new variable represented an
increment of 10 years of actual age.
Construct. Construct was coded as AWB, Personality, CWB, or Self-esteem. One
problem that arose in coding for construct is the overlap and lack of research definitions. For
example, a variable labelled “depression” may be classified as (1) AWB, if the scale asks for
depressive feelings, or (2) personality, if the scale asks for tendency to experience depressive
feelings in context of neuroticism. In this paper, we coded such ambiguous labels as they were
reported in the original article. For example, if the authors reported that they were measuring
affect, then we coded this as AWB and not as personality
Domain. We coded stability information separately for different domains (e.g.,
extraversion vs. neuroticism for personality, or positive affect vs. negative affect). This
distinction is not used in the present paper, but will be considered in follow-up studies that
provide closer examination of moderators of each individual difference construct.
Gender. We coded gender as the percentage of female participants. This variable was
coded as 0 for studies that included only male participants, and 1 for studies that included only
female participants. For studies that included both male and female participants, we recorded the
information as provided in the article (e.g., .52 for 52% female), or coded the variable as .50 if
the study did not provide information on the exact proportion of female participants.
18
Scale Length. Whenever such information was provided, we recorded the number of
items contained in the scale for which retest correlation was reported. However, the relationship
between number of items and reliability is not linear (e.g., increase in reliability going from a
single item to a 5-item scale is larger than reliability increase that results from going from a 25-
to a 30-item measure). Thus, for our analysis, we applied logarithmic transformation to the scale
length variable by taking a ln of the number of items. In this new variable, zero represents single
item scales (ln(1) = 0), 1 represents three-item scales (ln(3) ≈ 1), 2 represents 7 items scales
(ln(7) ≈ 2), etc.
Retest interval. Retest interval was coded in years. Some studies reported the time
interval in days, weeks, or months, in which case appropriate transformations were applied so
that all retest intervals were coded in years.
Retest correlation. Raw observed retest correlations were recorded as reported in the
article.
Three issues led us to omit some of the cases from the original database of retest
correlations. First, information about retest intervals longer than 10 years was sporadic and based
largely on small sample sizes. The small sample sizes are likely to lower the reliability of the
estimates. Longer time intervals would also influence estimates more strongly than shorter time
intervals because they would mainly be used to determine the asymptote of the curve, thus
heavily affecting the trait and state estimates. Furthermore, the number of studies based on these
longer time intervals was inconsistent across individual difference domains (e.g., many more
personality studies were based on long-term data than studies on CWB and self-esteem). As the
main goal of this paper is to compare stability estimates across different domains, we eliminated
any data points that were obtained from intervals longer than 10 years. Second, some studies
provided multiple data points for a specific sample, such as multiple indicators for a domain. For

19
example, some studies reported separate retest correlations for anger and anxiety, rather than
retest correlation of the composite negative affect score. In these cases we used the mean of the
retest correlations reported for individual subscales, and used the sum of the subscale items as
the number of items indicator. Third, we excluded four cases of retest correlations that were
based on informant reports. The final database used in analysis contained 721 cases (224 for
personality measures, 61 for self-esteem, 283 for measures of CWB, and 153 for AWB).
2.2 Process of analysis
For the analysis we used the nonlinear regression procedure of SPSS 15.0. In this
procedure it is possible to specify an equation that contains parameters to be estimated. In the
first step of the analysis, the user specifies starting values (e.g., estimated from visual inspection)
of the parameters and the program estimates the best fit to the parameters by looking for the
solution with smallest amount of residual variance. In the second step, the procedure is repeated,
this time using the estimated parameter values from the first step as the starting parameter values.
This step is repeated until the final estimates equal the specified starting values.
In the first step of our analysis we estimated proportion of the trait, state, and error
variance, and the stability of the state component for the overall (i.e., combined) individual
difference measures. In this analysis, we performed non-linear regression with the complete
database using the general equation developed in the introduction:
Correlation = Reliability x (State x StabilityInterval
+ 1 – State)
In the second step, we aimed to examine whether the relative proportions of error, trait,
and state variance, and stability of the state variance varied across individual difference
constructs. To accomplish this, we created three dummy variables to represent the four
constructs in question. We used measures of personality traits as the reference constructs for the

20
dummy variables because these measures reflect the core domain of personality research (e.g.,
Allport, 1927). We coded the first dummy variable as one if the construct in question was AWB,
and zero otherwise. The second dummy variable was coded as one of the measured construct was
CWB and zero otherwise. The third dummy variable was coded as one for self-esteem and zero
otherwise.
We entered the domain dummy variables as moderators of reliability, state, and state
stability using the following equation:
Correlation = (Reliability + mRel1 x d1 + mRel2 x d2 + mRel3 x d3) x
((State + mState1 x d1 + mState2 x d2 + mState3 x d3) x
((Stability + mStab1 x d1 + mStab2 x d2 + mStab3 x d3)Interval
- 1) + 1)
Where:
d1 = dummy variable representing AWB (1 = AWB, 0 = other)
d2 = dummy variable representing CWB (1 = CWB, 0 = other)
d3 = dummy variable representing self-esteem (1 = self-esteem, 0 = other)
mRel1 = difference in reliability of AWB and personality measures
mRel2 = difference in reliability of CWB and personality measures.
mRel3 = difference in reliability of self-esteem and personality measures.
mState1 = difference in the proportion of the trait component in the true AWB and
personality
mState2 = difference in the proportion of the trait component in the true CWB and
personality
mState3 = difference in the proportion of the trait component in the true self-esteem and
personality
21
mStab1 = difference in the stability of the state component of AWB and personality
mStab2 = difference in the stability of the state component of CWB and personality
mStab3 = difference in the stability of the state component of self-esteem and personality
In the last step of our analysis, we conduct the test of hierarchy of consistency controlling
for the effects of scale length, age, and gender across domains. Reliability theories predict that
the number of items should affect only reliability of the measures. There is no apriori reason to
believe that the number of scale items would have an effect on trait and state proportions, or the
state stability. Therefore, we constrained our model to test only the moderating effect of the
number of items on period-free reliability, and assumed no effect on state, and stability.
However, we estimated the effects of age and gender on all three components. The equation used
in the third step is:
Correlation = (Reliability + mRel1 x d1 + mRel2 x d2 + mRel3 x d3
+ mRelL x Length + mRelA x Age + mRelG x Gender) x
((State + mState1 x d1 + mState2 x d2 + mState3 x d3
+ mStateA x Age + mStateG x Gender) x
((Stability + mStab1 x d1 + mStab2 x d2 + mStab3 x d3
+ mStabA x Age + mStabG x Gender)Interval
- 1) + 1)
Where:
mRelL = moderating effect of scale length (log-transformed) on reliability
mRelA = moderating effect of age on reliability (i.e., increase in reliability for every 10-
year increase in age)

22
mRelG = moderating effect of gender on reliability (i.e., difference in reliability between
all-male and all-female samples)
mStateA = moderating effect of age on the state component (i.e., increase in the state
proportion of reliable variance for every 10-year increase in age)
mStateG = moderating effect of gender on the state component (i.e., difference in the
proportion of the state variance between all-male and all-female samples)
mStabA = moderating effect of age on state stability (i.e., increase in stability of the state
component for every 10-year increase in age)
mStabG = moderating effect of gender on state stability (i.e., difference in the stability of
the state component between all-male and all-female samples)
We start with the examination of stability of pooled individual differences, and proceed
to examine stability of individual constructs and their specific moderators.

23
Chapter 3 – Results
3.1 Database Characteristics
Mean age of all participants in our sample was 34.2 years (SD = 17.4 years). On average,
the samples included in our database were 50.5% female (SD = 31.4%). However, the
distribution of age and gender was not equal across studies that assessed different constructs.
Means and standard deviations for these two variables across constructs and average number of
items used to assess each construct, is presented in Table 1.
Table 1
Means (and standard deviations) for age, gender distribution, and scale length across individual
difference constructs. AWB = affective well-being, CWB = cognitive well-being
Personality AWB CWB Self-esteem
Age (years) 33.1 (15.8) 33.0 (18.1) 38.6 (17.8) 21.4 (11.2)
Proportion of
female participants 48.1 (37.9) 55.4 (26.5) 51.4 (26.3) 42.6 (35.5)
Scale length 17.4 (18.2) 9.0 (5.6) 3.4 (3.8) 14.1 (10.7)
In order to control for this variation we included age, gender, and scale length in our final
analysis of moderators. However, because we were not able to code for all variables in all
studies, controlling for these factors will in effect decrease the power of our analysis by lowering
the number of data points we may include. The full analysis and analysis of construct as
moderator included 224, 153, 283, and 61 cases for personality, AWB, CWB, and self-esteem,
respectively. The final analysis included only cases for which information about age, gender, and
scale length was provided, resulting in 134, 143, 268, and 32 cases for personality, AWB, CWB,
and self-esteem, respectively.
24
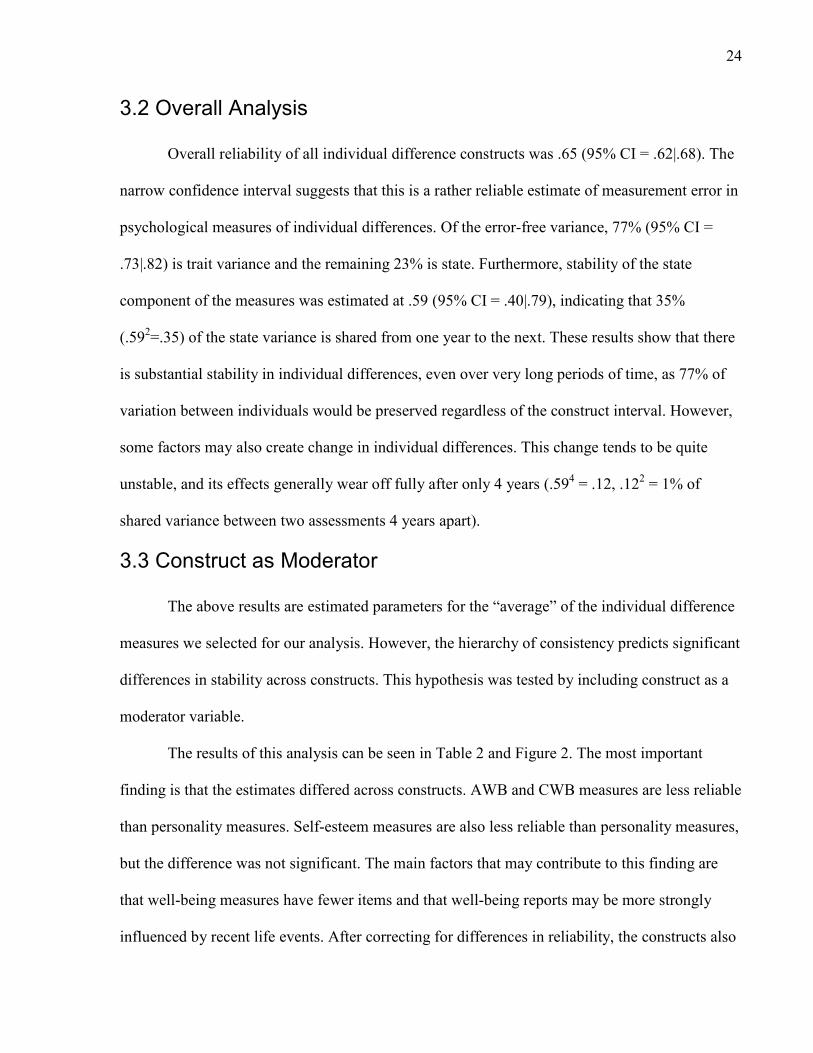
3.2 Overall Analysis
Overall reliability of all individual difference constructs was .65 (95% CI = .62|.68). The
narrow confidence interval suggests that this is a rather reliable estimate of measurement error in
psychological measures of individual differences. Of the error-free variance, 77% (95% CI =
.73|.82) is trait variance and the remaining 23% is state. Furthermore, stability of the state
component of the measures was estimated at .59 (95% CI = .40|.79), indicating that 35%
(.592=.35) of the state variance is shared from one year to the next. These results show that there
is substantial stability in individual differences, even over very long periods of time, as 77% of
variation between individuals would be preserved regardless of the construct interval. However,
some factors may also create change in individual differences. This change tends to be quite
unstable, and its effects generally wear off fully after only 4 years (.594 = .12, .12
2 = 1% of
shared variance between two assessments 4 years apart).
3.3 Construct as Moderator
The above results are estimated parameters for the “average” of the individual difference
measures we selected for our analysis. However, the hierarchy of consistency predicts significant
differences in stability across constructs. This hypothesis was tested by including construct as a
moderator variable.
The results of this analysis can be seen in Table 2 and Figure 2. The most important
finding is that the estimates differed across constructs. AWB and CWB measures are less reliable
than personality measures. Self-esteem measures are also less reliable than personality measures,
but the difference was not significant. The main factors that may contribute to this finding are
that well-being measures have fewer items and that well-being reports may be more strongly
influenced by recent life events. After correcting for differences in reliability, the constructs also

25
differ significantly in terms of the amount of trait (vs. state). Particularly, CWB has significantly
less trait variance than measures of personality traits. AWB had less trait variance than
personality traits and more trait variance than CWB. Although these differences are not reliable
in the present sample, they are consistent with the mediator model of personality influences on
wellbeing (Schimmack et al., 2002). Self-esteem also had less trait variance than measures of
personality traits. Self-esteem also had more trait variance than CWB measures, but the
difference was not statistically significant. Thus, the main definitive conclusion from these
analyses is a confirmation of Conley’s hypothesis that self-opinions like life-satisfaction and
self-esteem are less stable than personality traits.
Table 2
Estimates (and 95% confidence intervals) of the TSE model parameters from non-linear
regression with construct as moderator. AWB = affective well-being, CWB = cognitive well-
being
Reliability Trait State Stability
Estimates for
personality
.84
[.75|.94]
.77
[.68|.86]
.23
[.14|.32]
.29
[.00|.57]
AWB as
moderator
-.26
[-.36|-.16]
-.08
[-.37|.21]
.08
[-.21|.37]
.52
[.10|.94]
CWB as
moderator
-.12
[-.22|-.02]
-.27
[-.36|-.17]
.27
[.17|.36]
.28
[-.03|.58]
Self-esteem as
moderator
-.10
[-.25|.06]
-.16
[-.30|-.02]
.16
[.02|.30]
.29
[-.14|.71]
A significant amount of state variance shows that constructs reflect more than stable
dispositions, and that environmental factors can have lasting effects on individual differences in

26
the respective constructs. However, these effects are not permanent. The stability of the state
variance reveals how persistent environmental effects are. Table 2 shows that the small amount
of reliable state variance for personality traits changes rapidly. With an annual stability of .29,
only 9% of state variance in one year is still present in the next year. For a two-year interval, the
estimate drops to below 1%. In other words, retest correlations over a two-year interval reflect
mostly pure trait variance. Based on our model, observed retest correlations for personality traits
over time intervals of two or more years should be .65 (.77 trait x .85 reliability). Indeed, the
average retest correlation of personality measures for interval lengths greater than 2 years is .65.
Personality
.00
.10
.20
.30
.40
.50
.60
.70
.80
.90
1.00
0 1 2 3 4 5 6 7 8 9 10
Retest interval (years)
Rete
st c
orr
elati
on
Affective well-being
.00
.10
.20
.30
.40
.50
.60
.70
.80
.90
1.00
0 1 2 3 4 5 6 7 8 9 10
Retest interval (years)
Rete
st c
orr
ela
tio
n
Self-esteem
.00
.10
.20
.30
.40
.50
.60
.70
.80
.90
1.00
0 1 2 3 4 5 6 7 8 9 10
Retest interval (years)
Rete
st c
orr
ela
tio
n
Cognitive well-being
-.10
.00
.10
.20
.30
.40
.50
.60
.70
.80
.90
1.00
0 1 2 3 4 5 6 7 8 9 10
Retest interval (years)
Rete
st c
orr
elati
on
Figure 2. Scatter plots of retest correlations and the regression curves for the measures of
personality, self-esteem, affective well-being, and cognitive well-being.
The other constructs show higher stability of state variance, although, due to a lack of
statistical power, some of the individual parameters are not significant. Moreover, power is too

27
low to examine differences between the constructs. However, the stability estimates for these
constructs is still quite low (e.g., .57 for CWB) and would suggest that environmental factors
produce changes that typically last not more than 5 years (.575 = .06, .06
2 < 1% shared variance
between two measurement 5 years apart).
In sum, the results support the hypothesis that personality measures have a strong trait
component and a less stable state component. This finding supports the core assumption of
personality research that trait measures capture stable individual differences between individuals.
However, stable personality traits do not imply that all aspects of individuals’ personality or lives
are equally stable. Consistent with this hypothesis, our analysis suggests that differences exist in
the degree to which different constructs are stable over time. However, these differences are
currently confounded by variation in demographic characteristics across the data available for
different constructs. In our final analysis we examine moderating effects of age, gender, scale
length, and to examine differences in stability across constructs once we control for these effects.
3.4 Scale Length, Age, Gender, and Construct as Moderators of
Stability
Table 3 summarizes the results of the nonlinear regression with moderator tests for scale
length, age, gender and individual difference construct. The first row shows the estimates of
reliability, trait and state proportion of reliable variance, and state stability, for personality
measures, while holding constant scale length (set at 1 item), age (set at 15 years), and gender
(estimates given are for all-male samples). The most important finding is that stability between
constructs differs even after controlling for these variables. However, there were some important
differences between results in Tables 2 and 3, suggesting that scale length, age, and/or gender
played an important moderating role for some constructs.

28
Reliability of AWB and CWB remained lower than personality, even after controlling for
scale length. This finding is especially important in the case of CWB because the majority of
longitudinal CWB data is collected using single-item measures. The finding that CWB measures
contain more error variance even after scale length is taken into account suggests that this
construct may be more difficult to judge than other constructs such as personality. An alternative
explanation is that well-being measures are more strongly influenced by recent life events that
have a short-lived effect that does not influence retest correlations over a one-year period.
Table 3
Estimates (and 95% confidence intervals) of the TSE model parameters from non-linear
regression with construct, scale length, and age as moderators. AWB = affective well-being,
CWB = cognitive well-being
Reliability Trait State Stability
Estimates for
personality
.75
[.63|.88]
.66
[.55|.77]
.34
[.23|.45]
.54
[.30|.79]
AWB as
moderator
-.31
[-.43|-.19]
-.14
[-.40|.12]
.14
[-.12|.40]
.49
[.25|.74]
CWB as
moderator
-.17
[-.29|-.05]
-.29
[-.42|-.16]
.29
[.16|.42]
.36
[.13|.59]
Self-esteem as
moderator
-.18
[-.37|.02]
-.02
[-.19|.15]
.02
[-.15|.19]
.15
[-.30|.61]
Scale length
as moderator
.04
[.03|.06] - - -
Age as
moderator
-.01
[-.02|.00]
.05
[.03|.07]
-.05
[-.07|-.03]
-.01
[-.04|.01]
Gender as
moderator
.08
[.01|.16]
-.05
[-.13|.04]
.05
[-.04|.13]
-.20
[-.33|-.08]

29
Ratings of personality generally ask about frequencies of observable behaviour (e.g.,
talkativeness), whereas CWB measures ask individuals to provide subjective ratings of quality of
their life. Similarly, in judging AWB, individuals have to report on their inner feelings which are
also unobservable and subjective. Thus, the concreteness of a construct may affect its reliability.
Self-esteem judgements, as judgements about self-worth, are also more abstract than ratings of
behavioural tendencies. As such, we would expect them to be less reliable than personality
ratings. This trend is apparent in Table 3, with self-esteem reliability being equal to reliability of
CWB. However, with only 32 data points in the self-esteem analysis, the power of the test was
not high enough to reach statistical significance. Future research could further examine our claim
that more concrete judgements are more reliable.
Once age and gender were controlled for, differences in the trait (vs. state) proportions of
valid variance between personality and self-esteem dissolved. We found no evidence to indicate
that self-esteem was less stable than personality. This finding is consistent with Trzesniewski et
al.’s (2003) conclusions. Stability of the state component also does not differ between self-
esteem and personality. Thus, once differences in measurement error are taken into account, both
short-term and long-term retest correlations of personality and self-esteem will be highly similar.
Similarly, partitioning of reliable variance of AWB measures did not result in proportions of trait
and state variance that were significantly different from their relative proportions in reliable
variance of personality measures. The confidence intervals around the estimates of these
differences were very wide, suggesting that there is a substantial variability in retest correlations
even when after controlling for age and gender. One possible reason for this is that we included
both momentary mood measures and measures of dispositional affective states in our database.
One reason for this approach was because the distinction between these two types of measures is
often not made in published literature, making it difficult, if not impossible, to separate the two

30
types of measures in our database of retest correlations. These two types of measures may be
influenced to a different degree by the two sources of valid variance, resulting in large amount of
noise variance in our estimates of trait and state proportions. Additional results of our analysis
indicate that while the proportion of state variance may not differ between personality and AWB,
stability of the state variance appears to be higher for AWB. However, the actual estimate of
stability of state component of AWB is higher than 1.00 (.54+.49 = 1.03). The confidence
intervals of personality state stability and state stability of AWB are quite wide. Thus, we are not
able to make a reliable estimate of stability of the state proportion of AWB measures other than
to suspect that stability over short time-intervals is higher for AWB compared to personality.
For CWB, estimates of proportion of trait and state variance were virtually identical as in
the previous analysis which did not control for the effect of age and gender. These results
indicate that the proportion of stable trait variance is lower for CWB than personality, but the
overlapping confidence intervals do not allow us to draw firm conclusions about any differences
of the trait and state proportions between AWB and other individual difference constructs.
Finally, the stability of the state component appears to be higher for CWB than for personality,
although the wide confidence intervals around the moderating effect of construct on stability also
brings this result into question. Thus, it is likely that the state component is more stable for CWB
than for personality, however, due to the lower statistical power in this analysis we are not able
to make accurate estimates of state stability.
Thus, some of the TSE model estimates changed once scale length, age, and gender were
controlled for across the four constructs, indicating that some or all of these variables moderate
the stability of individual differences. As predicted, reliability was moderated by scale length.
Our results showed that the measure increases in reliability by .04 as it moves from a single-item
to a 3-item assessment, another .04 with the addition of another 4 items, after which point 13

31
items are necessary to produce the increase in reliability of that magnitude. The number of
required items to raise the reliability by .04 grows exponentially. Another moderator of
reliability was gender, with women providing more reliable ratings than men. However, the
average internal consistency estimates (Cronbach alphas) did not differ between men and women
in our database (women: M = .79, SD = .17, men: M = .78, SD = .09, t(57) = .47, ns). This
finding is surprising and it suggests that internal consistency is not an accurate estimate of
period-free reliability.
Age was also a significant moderator of trait and state proportion of reliable variance,
such that the proportion of trait variance increased and proportion of state variance decreased by
.05 with each 10-year increase in age. This finding suggests substantial effect of age on long-
term stability. For example, this finding implies that the trait component of personality in
adulthood (45-years of age) accounts for 81% of reliable variance, compared to 66% in
adolescence (15-years of age). In addition, gender was a moderator of state stability such that
state component was less stable in women than in men by .20. This finding suggests that the
situational influences have longer lasting effects on men than on women. This finding should be
verified in future studies.
However, it is possible that the moderating effects of scale length, age, and gender are
construct-specific. That is, age may be a moderator of the state and trait components for self-
esteem but not for other constructs. This possibility will be further examined in future research.
In sum, although some of the estimates for individual constructs have changed after
controlling for scale length, age, and gender, our analysis still indicated that important
differences in stability exist between different individual difference constructs. Personality
measures are most reliable. However, personality measures have similar long-term stability as
AWB and self-esteem measures, although the short-term, or state stability is higher for the

32
measures of AWB. CWB measures have lower long-term stability but a more stable state
component compared to personality.

33
Chapter 4 – Discussion
The present paper is the first to employ the method of non-linear regression to separate
sources of variance in a meta-analysis of retest correlations. This model estimates the amount of
error variance, trait vs. state variance, as well as the stability of state variance. The model was
applied to retest correlation of personality traits, measures of affective and cognitive well-being,
and self-esteem. The main predictions were that all measures would have a significant amount of
trait variance and that the amount of trait variance would decrease from personality traits to
affective well being to life-satisfaction. Self-esteem variance was also expected to contain more
trait variance than life-satisfaction. The results were mostly consistent with these predictions.
The most important finding was that all measures had a substantial amount of trait
variance. The lowest estimate of 37% was obtained for CWB measures after including a number
of covariates. This estimate is consistent with estimates based on longitudinal analyses (Lucas &
Donnellan, 2007; Schimmack & Lucas, 2007). Thus, there is strong support for the fundamental
assumption of personality psychology that stable dispositions have a substantial influence on a
variety of personality characteristics and well-being.
The second important finding was that parameter estimates vary systematically across
constructs. As expected, measures of personality traits had more trait variance than other
measures, although the difference with self-esteem measures disappeared after controlling for
potential confounding variables. The difference between the trait (vs. state) proportion of
personality and AWB measures, although not statistically significant, was in the predicted
direction. It is possible that majority of environmental influences on AWB are very short-lived,
resulting in these influences to be grouped with measurement error rather than state variance.
This is more likely to be the case with mood judgments which we included in our AWB
database. Judgements about amount of positive and negative affect over longer periods of time

34
may depend less on momentary environmental influences, resulting in a smaller error component
and thus a smaller trait component. The difference between personality traits and cognitive
measures of well-being was most pronounced. This finding supports the assumption of the
mediator model that personality traits more strongly influence affective well-being than
cognitive well-being measures.
In addition, our analysis shows that, after controlling for measurement error, there are no
differences in long-term or short-term stability of personality and self-esteem. This finding is in
contrast with Conley’s (1984) conclusion that self-opinions (i.e., self-esteem and life
satisfaction) were less stable than personality. In addition, our analysis offered evidence of
discriminant validity between self-esteem and CWB. The finding that these two constructs differ
in stability, which is an important property of individual difference constructs, suggests that they
are two distinct types self-opinion. Self-esteem is an attitude about one’s self-worth, and the
object of this attitude is the self-entity. Because Western individuals tend to define the self
through personality (Cousins, 1989) and because personality is highly stable, self-esteem
judgements also tend to be highly stable over time. On the other hand, CWB judgements are
attitudes towards one’s life. One’s life is nested in the context of the environment, and cognitive
judgements of well-being take into account environmental influences (e.g., housing, health,
relationships; Schimmack & Oishi, 2005). As outside environmental circumstances are likely to
fluctuate more than one’s internal environment (i.e., personality), CWB judgments tend to be
less stable than self-esteem judgments.
Our results also suggest that the stability of the state component of AWB and CWB is
higher than state stability of personality measures. Although, when age and gender are controlled
for, the estimate of state stability of AWB is unreasonable (i.e., > 1.00), converging trend
towards higher state stability of AWB and CWB compared to personality in Tables 2 and 3

35
suggests that this trend is a reliable finding. The out-of-bound estimate may be an artefact of
reduced statistical power when moderator variables are entered into the regression. If so, these
findings suggest that situational influences have a longer lasting effect on judgements of AWB
and CWB than for judgements of personality. As discussed above, CWB judgements are made in
the context of one’s environment (i.e., life), and thus it is not surprising that environmental
changes have lasting effects on CWB.
Scale length, age, and gender moderated some of the TSE parameter estimates. As
expected, scale length moderated reliability of the measure, such that measures with more items
were more reliable. Reliability was also moderated by gender, such that women in general gave
more reliable responses. This finding is in contrast to the observed lack of gender differences in
Cronbach’s alpha coefficients which index internal consistency estimates. Internal consistency is
commonly used as an estimate of measurement error (e.g., Roberts & DelVechio, 2000;
Trzesniewski et al., 2003). Our results suggest that there may be an important distinction
between period-free scale reliability and internal consistency. This distinction should be further
examined in future research.
Gender was also a substantial moderator of stability of the state variance, which was
lower in women than in men. This finding implies that the situational or environmental effects on
personality, AWB, CWB, and self-esteem are more transient for women. However, this finding
should be interpreted with caution as it appears to have led to out-of-bound estimate of state
stability of AWB. Thus it is not clear to what degree this finding is an artefact of low statistical
power that resulted from reduction of available data as we tried to control for the three
moderators.
Age was an important moderator of the relative proportion of trait and state in the reliable
variance of individual differences. Our results suggest an increase of .03 to .07 in trait variance

36
(and a decrease of the same magnitude in state variance) for each 10-year increase in age. This
finding adds emphasis to the fact that the source of trait variance is not necessarily genetic or
biological and fully determined. Increased stability in environment (e.g., stable income and
housing) may also contribute to the trait proportion of variance in individual differences. Moving
from turbulent environments of adolescents and young adulthood results decrease in external
influences that contribute to the changing state component. Thus, the proportion of the trait
component is increased with age.
4.1 Limitations and Future Directions
An important limitation of the TSE approach is that the asymptote to the decline of the
retest correlations must occur during the duration of the study in order for the model parameters
to be estimated correctly. If it does not, it would be impossible to decide the partition between
the state and trait components. Similarly, if information is missing at very short-term intervals, it
would be difficult, if not impossible, to obtain estimates of reliability. Thus, the data for TSE
analysis must be collected over both short and long retest intervals.
Another limitation particular to the non-linear regression approach to TSE is that this
approach can be used only for descriptive purposes (e.g., to estimate relative proportions of
source variance). However, more advanced statistical techniques such as structural equation
modelling may be used to examine unique causes and consequences of each of the variance
components.
Despite these limitations, we believe that the TSE approach to stability is advantageous
over other existing models in literature. Such approach provides more informative estimates as to
the sources of stability. Moreover, this approach can be used to analyze archival data for which
only retest correlations are available. Further research needs to consider conditions under which

37
TSE models can and cannot be defined in order to further facilitate feasibility of this useful
statistical method.

38
References
Allport, G. W. (1927). Concepts of trait and personality. Psychological Bulletin, 24, 284-293.
Barley, N., & Oden, M. H. (1955). The maintenance of intellectual ability in gifted adults.
Journal of Gerontology, 10, 91-107.
Cole, D. A. (2006). Coping with longitudinal data in research on developmental
psychopathology. International Journal of Behavioral Development, 30, 20-25.
Cole, D. A., & Martin, N. C. (2005). The longitudinal structure of the Children’s Depression
Inventory: Testing a latent trait-state model. Psychological Assessment, 17, 144-155.
Cole, D. A., Martin, N. C., & Steiger, J. H. (2005). Empirical and conceptual problems with
longitudinal trait-state models: Introducing a trait-state-occasion model. Psychological
Methods, 10, 3-20.
Cole, D. A., Nolen-Hoeksema, S., Girgus, J., & Paul, G. (2006). Stress exposure and stress
generation in child and adolescent depression: A latent trait-state-error approach to
longitudinal analysis. Journal of Abnormal Psychology, 115, 40-51.
Conley, J. J. (1984). The hierarchy of consistency: A review and model of longitudinal findings
on adult individual differences in intelligence, personality and self-opinion. Personality
and Individual Differences, 5, 11-25.
Conley, J. J. (1985). Longitudinal stability of personality traits: A multitrait-multimethod-
multioccasion analysis. Journal of Personality and Social Psychology, 49, 1266-1282.
Costa, P. T., Jr. & McCrae, R. R. (1980). Influences of extraversion and neuroticism on
subjective well-being: Happy and unhappy people. Journal of Personality and Social
Psychology, 38, 668-678.

39
Costa, P. T., Jr., & McCrae, R. R. (1994). Set like plaster: Evidence for the stability of adult
personality. In T. F. Heatherton & J. L. Weinberger (Eds.), Can personality change? (pp.
21-40). Washington, DC: American Psychological Association.
Cousins, S. D. (1989). Culture and self-perception in Japan and the United States. Journal of
Personality and Social Psychology, 56, 124-131.
Darley, J. G. (1938). Changes in measured attitudes and adjustment. Journal of Social
Psychology, 9, 189-199.
Farnsworth, P. R. (1938). A genetic study of the Bernreuter personality inventory. Journal of
Genetic Psychology, 52, 3-13.
Fujita, F., & Diener, E. (2005). Life satisfaction set point: Stability and change. Journal of
Personality and Social Psychology, 88, 158-164.
Heise, D. R. (1969). Separating reliability and stability in test-retest correlation. American
Sociological Review, 34, 93-101.
Hunter, J. E., & Schmidt, F. L. (2004). Methods of meta-analysis: Correcting error and bias in
research findings. Thousand Oaks, CA: Sage.
James, W. (1890). The principles of psychology. New York: Dover.
Kelly, E. L. (1955). Consistency of the adult personality. American Psychologist, 10, 659-681.
Kovacs, M. (1985). The Children’s Depression Inventory (CDI). Psychopharmacology Bulletin,
21, 995-998.
Kenny, D. A., & Zautra, A. (1995). The trait-state-error model for multiwave data. Journal of
Consulting and Clinical Psychology, 63, 52-59.
Larsen, R., & Ketelaar, T. (1991). Personality and susceptibility to positive and negative
emotional states. Journal of Personality and Social Psychology, 61, 132-140.
40
Low, K. S. D., Yoon, M., Roberts, B. W., & Rounds, J. (2005). The stability of vocational
interests from early adolescence to middle adulthood: A quantitative review of
longitudinal studies. Psychological Bulletin, 131, 713-737.
Lucas, R. E., Diener, E., & Suh, E. (1996). Discriminant validity of well-being measures.
Journal of Personality and Social Psychology, 71, 616-628.
Lucas, R. E., & Donnellan, M. B. (2007). How stable is happiness? Using the STARTS model to
estimate the stability of life satisfaction. Journal of Research in Personality, 41, 1091-
1098.
Lykken, D., & Tellegen, A. (1996). Happiness is a stochastic phenomenon. Psychological
Science, 7, 186-189.
McGue, M., Bacon, S., & Lykken, D. T. (1993). Personality stability and change in early
adulthood: A behavioural genetic analysis. Developmental Psychology, 29, 96-109.
Nes, R. B., Roysamb, E., Tambs, K., Harris, J. R., & Reichborn-Kjennerud, T. (2006).
Subjective well-being: Genetic and environmental contributions to stability and change.
Psychological Medicine, 36, 1033-1042.
Ormel, J., & Rijsdijk, F. V. (2000). Continuing change in neuroticism during adulthood –
structural modelling of a 16-year, 5-wave community study. Personality and Individual
Differences, 28, 461-478.
Owens, W. A., Jr. (1953). Age and mental abilities: A longitudinal study. Genetic Psychology
Monographs, 48, 3-54.
Roberts, B. W., & DelVecchio, W. F. (2000). The rank-order consistency of personality traits
from childhood to old age: A quantitative review of longitudinal studies. Psychological
Bulletin, 126, 3-25.

41
Schimmack, U., Diener, E., & Oishi, S. (2002). Life-satisfaction is a momentary judgment and a
stable personality characteristic: The use of chronically accessible and stable sources.
Journal of Personality, 70, 345-384.
Schimmack, U., & Lucas, R. E. (2007). Environmental influences on well-being: A dyadic latent
panel analysis of spousal similarity. Unpublished manuscript.
Schimmack, U., & Oishi, S. (2005). The influence of chronically an temporarily accessible
information on life satisfaction judgements. Journal of Personality and Social
Psychology, 89, 395-406.
Schimmack, U., Radhakrishnan, P., Oishi, S., Dzokoto, V., & Ahadi, S. (2002). Culture,
personality, and subjective well-being: Integrating process models of life satisfaction.
Journal of Personality and Social Psychology, 82, 582-593.
Schimmack, U., Schupp, J., & Wagner, G. G. (in press). The influence of environment and
personality on the affective and cognitive component of subjective well-being. Social
Indicators Research.
Steyer, R., & Schmitt, T. (1994). The theory of confounding and its application in causal
modeling with latent variables. In A. von Eye & C. C. Clogg (Eds.), Latent variables
analysis: Applications for developmental research (pp. 36-67). Thousand Oaks, CA:
Sage.
Trzesniewski, K. H., Donnellan, M. B., & Robins, R. W. (2003). Stability of self-esteem across
the life span. Journal of Personality and Social Psychology, 84, 205-220.
Zautra, A. J., Marbach, J. J., Raphael, K. G. & Kenny, D. A. (1995). The examination of
myofascial face pain and its relationship to psychological distress among women. Health
Psychology, 14, 223-231.