a comparison of the pyrolysis of olive kernel biomass in ... comparison of the pyrolysis of... · a...
TRANSCRIPT
ORIGINAL PAPER
A Comparison of the Pyrolysis of Olive Kernel Biomassin Fluidised and Fixed Bed Conditions
A. Al-Farraji1 • R. Marsh1 • J. Steer1
Received: 20 May 2016 / Accepted: 16 August 2016
� The Author(s) 2016. This article is published with open access at Springerlink.com
Abstract The use of thermogravimetric analysis to
describe biomass kinetics often uses bench top thermo-
gravimetric analyser (TGA) analysers which are only
capable of low heating rates. The aim of this research was
to compare experimental fast pyrolysis of Olive kernels in
a bespoke laboratory thermogravimetric fluidised bed
reactor (TGFBR) characterised by rapid heating rates at
high flow rates, compared to a smaller bench scale fixed
bed TGA system. The pyrolysis in the TGFBR was anal-
ysed by using the isothermal kinetic approach and it was
theorised that the pyrolysis decomposition reactions
occurred by two mechanisms depending on the tempera-
ture, resulting in an activation energy of 67.4 kJ/mol at
temperatures below\500 �C and 60.8 kJ/mol at tempera-
tures [500 �C. For comparison, a bench scale TGA was
used to look at the thermal behaviour in different fixed bed
thermal conditions giving a higher activation energy of
74.4 kJ/mol due to the effect of external particle gas dif-
fusion. The effect of biomass particle size (0.3–4.0 mm) on
the conversion of biomass at different temperatures, was
investigated between 300 and 660 �C in the TGFBR. The
results suggested inhibition of internal gas diffusion was
more important at lower temperatures, but in comparison
had no significant effect when measured in the fixed bed
TGA at lower heating rates. Bench top TGA analysis of
pyrolysis is a rapid and valuable method, but is limited by
smaller sample sizes and lower heating rates. In compar-
ison, the conditions encountered with the laboratory scale
TGFBR are more likely to be relevant to larger scale
systems where heat distribution, heat transfer and mass
diffusion effects play major roles in the reactivity of
biomass.
Keywords Biomass � Pyrolysis � Processes � Fluidisedbed � Olive kernel � Renewable
Introduction
Olive kernels are a co-product residue of agricultural
activity in the Mediterranean region. Greece has the third
largest Olive oil production industry in the world. About
400,000 tons of Olive kernels are produced annually [1].
Olive kernel is already exploited as a low cost solid bio-
mass fuel (0.046 £/kg), and is mostly utilized for conven-
tional combustion. However, Olive kernel has not yet
utilised its full potential as alternative biofuel [2]. There is
limited scientific research concerning the comparison of
experimental fast pyrolysis of Olive kernels in fluidised
bed and fixed bed systems, hence experimentation with this
kind of biomass is of great interest.
Biomass pyrolysis is a viable route to produce renew-
able bio-oil and includes fundamental chemical reactions
that are precursors of other thermal conversion technolo-
gies, such as combustion and gasification. Therefore, the
study of the pyrolytic characteristics of biomass covers a
key issue in demand for an advancement of biomass ther-
mal conversion technologies.
There are two processes for biomass pyrolysis, slow
pyrolysis and fast pyrolysis. Slow pyrolysis has been used
for the production of charcoal, while fast pyrolysis has
generally been used to obtain liquid products. Fast pyrol-
ysis is described by high heating rates and rapid quenching
& J. Steer
1 Cardiff School of Engineering, Cardiff University, Queen’s
Buildings, The Parade, Cardiff CF24 3AA, UK
123
Waste Biomass Valor
DOI 10.1007/s12649-016-9670-6
of bio-oil products to terminate the secondary conversion
of the products [3].
The pyrolysis characteristics of biomass, in particular
measuring and deriving reaction kinetics, has been carried
out using thermogravimetric analysis (TGA) by other
researchers. This is normally undertaken via the measure-
ment of variation of mass loss with time of a sample held in
the TGA cell at a preset heating rate [4–7]. Other work has
involved the development of reactors at a larger scales to
determine the kinetics of biomass pyrolysis with larger
sample sizes, determining conversion through the analysis
of the yield of gas [8–11].
Traditional TGA can be considered to be a fixed bed
technique with a relatively low heating rate compared to
larger scale systems where biomass is added directly in the
reactor at the reaction temperature so the particle heating
rate is significantly greater. Meanwhile, the chemical
processes in TGA are affected by the interfacial gas dif-
fusion between the reactor space and the solid sample
inside the TGA cell [12]. Other authors have noted the
effect of the heating rate on the reaction kinetics in a TGA,
which limits how comparable these results are with high
heating rate systems such as fluidised bed or circulating
bed gasifiers [13]. The kinetic parameters represented by
the order of reaction or the activation energy may be so
misleading that, if used in scaling up, it may result in
problems with plant operation. It is therefore essential to
make a careful study of the interaction to eliminate phys-
ical effects from purely chemical processes [14]. The
pyrolysis of biomass involves the transport of gas and heat
from the external bulk gas phase to the internal particle
surface, where the chemical reactions take place. More-
over, the intrinsic rate, i.e. the rate of the chemical reaction
step, free from heat and mass transfer limitations, is of
considerable importance. Therefore, it is valuable to
develop an apparatus for the kinetic study of biomass
pyrolysis that has the same principle of measurement, but
it is dealing with a fluidised bed and operating under a fast
heating rate regime.
The thermogravimetric fluidised bed reactor (TGFBR),
designed and fabricated in the School of Engineering at
Cardiff University, used in the present study was capable
of using larger sample sizes up to 60 g per run, compared
with up to 20 mg in the bench scale TGA. Furthermore,
the reactor operates under isothermal conditions by using
impervious alumina porcelain (IAP) as a heat transfer
medium in the preheater. This paper compares the effects
of particle size and temperature on pyrolysis kinetics under
fixed bed conditions using a conventional bench scale
TGA and under fluidised bed conditions using a novel
thermogravimetric fluidisation system (TGFBR) equipped
with built-in load cells for the dynamic measurement of
biomass conversion. The aim of this work was to
investigate the influence of heating rates and heat/mass
transfer effects on the kinetic analyses of the results
obtained in these different systems to describe and
understand the importance of the bed conditions on the
effect of biomass pyrolysis.
Kinetic Methods
The kinetic study attempts to demonstrate how the thermal
decomposition occurs by finding the best kinetic model that
fits and describes the mechanism of the reaction to deter-
mine the kinetic parameters. This is crucial to the design,
build and operation of a large scale industrial reactor for
the Olive kernel biomass.
In solid state kinetic analysis, it is appropriate to
describe the reaction in terms of the conversion, X defined
by Eq. (1) [15]. Where mo is the initial mass of the sample,
m is the instantaneous mass of the pyrolysis sample, and mf
is the final residual mass.
X ¼ mO � m
mO � mf
ð1Þ
Activation energy describes the energy required for the
reaction to occur [12]. It is one of the most important
kinetic parameters for evaluating the reactivity and can be
determined using the model-free/iso-conversional method,
or model-fitting method as used in this study. Since the
pyrolysis of Olive kernel in the TGFBR is a heterogeneous
solid state reaction, the universal kinetics of the thermal
decomposition of biomass are expressed by Eq. (2) [16],
where T is the reaction temperature; t is the reaction time;
f(X) is the differential reaction model; X is the conversion;
and k(T) is the temperature dependant reaction rate that can
be expressed by the Arrhenius Eq. (3), where Ea is the
activation energy, A is the pre-exponential factor and R is
the universal gas constant.
dX
dt¼ k Tð Þf Xð Þ ð2Þ
k Tð Þ ¼ Aexp�Ea
RT
� �ð3Þ
A model fitting method was used for the isothermal tests
in the TGFBR, to calculate the kinetic parameters based on
the integration of Eq. (2) to derive the Eq. (4) and define
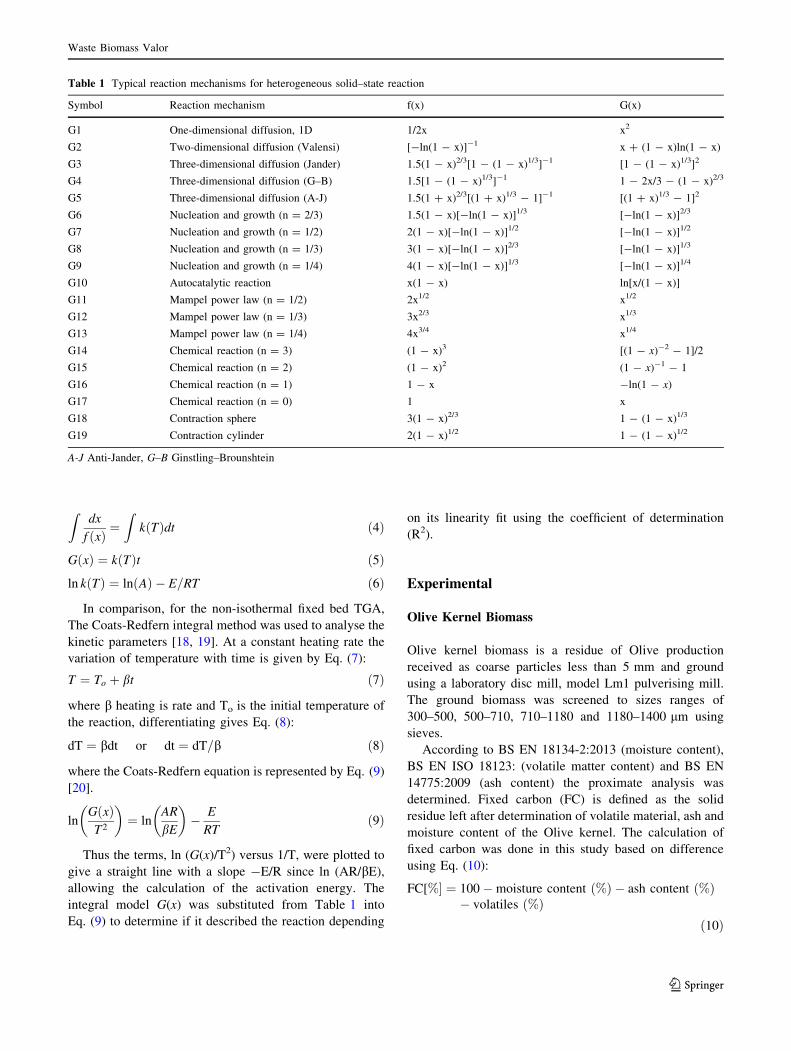
the term G(x) in Eq. (5). This integral term is represented
by the model equations shown in Table 1 and by con-
ducting experiments at a range of isothermal temperatures
a plot of lnk versus 1/T was obtained to derive the acti-
vation energy from the slope of the plot according to
Eq. (5) with the most suitable method determined by the
best linearity fit [17].
Waste Biomass Valor
123
Zdx
f xð Þ ¼Z
k Tð Þdt ð4Þ
G xð Þ ¼ k Tð Þt ð5Þln k Tð Þ ¼ ln Að Þ � E=RT ð6Þ
In comparison, for the non-isothermal fixed bed TGA,
The Coats-Redfern integral method was used to analyse the
kinetic parameters [18, 19]. At a constant heating rate the
variation of temperature with time is given by Eq. (7):
T ¼ To þ bt ð7Þ
where b heating is rate and To is the initial temperature of
the reaction, differentiating gives Eq. (8):
dT ¼ bdt or dt ¼ dT=b ð8Þ
where the Coats-Redfern equation is represented by Eq. (9)
[20].
lnG xð ÞT2
� �¼ ln
AR
bE
� �� E
RTð9Þ
Thus the terms, ln (G(x)/T2) versus 1/T, were plotted to
give a straight line with a slope -E/R since ln (AR/bE),allowing the calculation of the activation energy. The
integral model G(x) was substituted from Table 1 into
Eq. (9) to determine if it described the reaction depending
on its linearity fit using the coefficient of determination
(R2).
Experimental
Olive Kernel Biomass
Olive kernel biomass is a residue of Olive production
received as coarse particles less than 5 mm and ground
using a laboratory disc mill, model Lm1 pulverising mill.
The ground biomass was screened to sizes ranges of
300–500, 500–710, 710–1180 and 1180–1400 lm using
sieves.
According to BS EN 18134-2:2013 (moisture content),
BS EN ISO 18123: (volatile matter content) and BS EN
14775:2009 (ash content) the proximate analysis was
determined. Fixed carbon (FC) is defined as the solid
residue left after determination of volatile material, ash and
moisture content of the Olive kernel. The calculation of
fixed carbon was done in this study based on difference
using Eq. (10):
FC[%� ¼ 100�moisture content %ð Þ � ash content %ð Þ� volatiles %ð Þ
ð10Þ
Table 1 Typical reaction mechanisms for heterogeneous solid–state reaction
Symbol Reaction mechanism f(x) G(x)
G1 One-dimensional diffusion, 1D 1/2x x2
G2 Two-dimensional diffusion (Valensi) [-ln(1 - x)]-1 x ? (1 - x)ln(1 - x)
G3 Three-dimensional diffusion (Jander) 1.5(1 - x)2/3[1 - (1 - x)1/3]-1 [1 - (1 - x)1/3]2
G4 Three-dimensional diffusion (G–B) 1.5[1 - (1 - x)1/3]-1 1 - 2x/3 - (1 - x)2/3
G5 Three-dimensional diffusion (A-J) 1.5(1 ? x)2/3[(1 ? x)1/3 - 1]-1 [(1 ? x)1/3 - 1]2
G6 Nucleation and growth (n = 2/3) 1.5(1 - x)[-ln(1 - x)]1/3 [-ln(1 - x)]2/3
G7 Nucleation and growth (n = 1/2) 2(1 - x)[-ln(1 - x)]1/2 [-ln(1 - x)]1/2
G8 Nucleation and growth (n = 1/3) 3(1 - x)[-ln(1 - x)]2/3 [-ln(1 - x)]1/3
G9 Nucleation and growth (n = 1/4) 4(1 - x)[-ln(1 - x)]1/3 [-ln(1 - x)]1/4
G10 Autocatalytic reaction x(1 - x) ln[x/(1 - x)]
G11 Mampel power law (n = 1/2) 2x1/2 x1/2
G12 Mampel power law (n = 1/3) 3x2/3 x1/3
G13 Mampel power law (n = 1/4) 4x3/4 x1/4
G14 Chemical reaction (n = 3) (1 - x)3 [(1 - x)-2 - 1]/2
G15 Chemical reaction (n = 2) (1 - x)2 (1 - x)-1 - 1
G16 Chemical reaction (n = 1) 1 - x -ln(1 - x)
G17 Chemical reaction (n = 0) 1 x
G18 Contraction sphere 3(1 - x)2/3 1 - (1 - x)1/3
G19 Contraction cylinder 2(1 - x)1/2 1 - (1 - x)1/2
A-J Anti-Jander, G–B Ginstling–Brounshtein
Waste Biomass Valor
123

Table 2 details the characterisation of the Olive kernel
used: its proximate analysis and higher heating value.
Fixed Bed Thermogravimetric Analysis (TGA)
The fixed bed bench top TGA analysis of Olive kernel
biomass pyrolysis was carried out using a Mettler TGA851
in a nitrogen atmosphere with a flow rate of 50 ml/min,
heating rate of 20 �C/min and a 10 mg sample size. The
four sieved size classifications of the Olive kernel sample
used in this study were as follows:
1. 300–500 lm.
2. 500–710 lm.
3. 710–1180 lm.
4. 1180–1400 lm.
Fluidised Bed Thermogravimetric Pyrolysis Reactor
(TGFBR)
The fast pyrolysis of Olive kernel was carried out in a
laboratory scale fluidised bed reactor with a load cell.
Figure 1 shows a schematic diagram of the pyrolysis
apparatus consisting of a stainless steel reactor with 83 mm
internal diameter and a 1000 mm high. A perforated dif-
fuser plate was made from stainless steel with thickness
5 mm and uniformly perforated with 151 9 1 mm diam-
eter holes to retain the bed fluidisation material. A perfo-
rated plate was used in this study because it improved the
mixing significantly (less segregation tendency) compared
to a porous plate [21]. The fluidiser was surrounded by a
split tube furnace (three heating zones) with a maximum
temperature of 1200 �C. The fluidising nitrogen was passedthrough a 50 mm internal diameter 670 mm long tube
containing IAP as a heat transfer medium. The tube was
surrounded by an electrical preheater tube furnace, sup-
plied by LTF. A PID controller was used for temperature
control and to monitor the bed temperature thermocouple
in the fluidised bed.
The fluidised bed was positioned on a bespoke platform
load cell designed by Coventry Scale Company. The bal-
ance tolerance was ±0.5 g with a weighing range up to
25 kg. A multifunction weight indicator model DFW06XP
was connected to a load cell and through a computer to
record the mass change continuously at 1 s time intervals.
Results
Fixed Bed Thermogravimetric Analysis (TGA)
The pyrolysis results obtained from fixed bed thermo-
gravimetric experiments were recorded as a function of the
conversion X, expressed in Eq. (1). The degree of con-
version against temperature at a heating rate of 20 �C/min
for the four particles size classifications of Olive kernel are
shown in Fig. 2. Below 250 �C the mass change due to
moisture loss occurred during the early heating period. The
initial thermal decomposition of the Olive kernel started at
250 �C, but the major decomposition region (active
pyrolysis) happened between 260 and 356 �C. The major-
ity of volatile decomposition, up to 80 % of the overall
mass conversion, occurred during this temperature range.
Therefore, for conversion greater than 80 %, most of the
remaining material is char. Considering only the TGA
results, all particle size classifications exhibited the same
trend. The effect of particle size on pyrolysis was investi-
gated for four particle sizes as shown in Fig. 2 and
demonstrated that particle size does not have an important
influence on the TGA profile of the Olive kernel. A similar
effect for Codium fragile (a marine biomass) has been
reported by Daneshvar and Otsuka [22] for particle sizes
from 75 to 1400 lm.
Biomass is composed of cellulose, hemicellulose, and
lignin which due to essential differences in the structure of
these constituents can be identified and distinguished dur-
ing thermogravimetric analysis [23]. According to Yang
et al. [24] hemi-cellulose decomposes mainly at
220–315 �C, cellulose at 315–400 �C, while lignin
decomposes over a wide temperature range from 160 to
900 �C. Figure 3 shows the differential thermogravimetric
analysis curve (DTG) at heating rate 20 �C/min gives the
differential rate of conversion, dm/dt, for particle sizes
300–500, 500–710, 710–1180 and 1180–1400 lm. The
first peak below 100 �C corresponds to the moisture in the
sample; the second peak between 200 and 300 �C suggests
Table 2 Proximate analysis
and higher heating value of
Olive kernel
Particle size (lm) Fixed carbon Volatile matter Ash Moisture HHV (MJ/kg)
Proximate analysis (wt%)
300–500 17.1 69.0 0.4 13.5 19.3
500–710 17.5 68.8 0.3 13.4 19.2
710–1180 17.7 69.0 0.5 12.9 19.3
1180–1400 17.9 68.6 0.5 13.0 19.3
As received 18.0 68.2 0.6 13.3 19.2
Waste Biomass Valor
123

the thermal decomposition of hemicellulose; and the final
peak between 300 and 380 �C corresponds to cellulose
decomposition. The slow rate of mass loss at higher tem-
peratures[380 �C is consistent with lignin decomposition.
Approximately the same trend of DTG has been reported
by Kastanaki et al. [25] during the pyrolysis of Olive kernel
and Jae et al. [26] through pyrolysis of maple wood.
Fluidised Bed Reactor Thermogravimetric Analysis
(TGFBR)
The experimental measurements using the TGFBR were
achieved at pre-set steady-state temperatures between 300
and 660 �C, covering the chemically controlled regime
area of thermal decomposition illustrated in Fig. 3. Prior to
pyrolysis, the experimental work was started by heating the
reactor to the required temperature ensuring that good bed
fluidisation was achieved as determined by the measure-
ment of the bed pressure drop against the superficial
velocity of the gas flow. Silica sand was used as the inert
fluidised bed material with a diameter of 500–600 lmgiving a measured minimum fluidisation velocity (umf) of
0.06 m/s [27]. After that, the air stream was stopped and
the nitrogen stream flowed at the minimum fluidisation
velocity (umf) [28] until steady state temperature conditions
inside the reactor were obtained. Olive kernel biomass was
fed from the top of the reactor through a pipe into the hot
fluidised bed as shown in Fig. 1. The amount of biomass
Fig. 1 Thermogravimetric
fluidized bed reactor TGFBR
Fig. 2 Relationship between mass conversion and temperature for
olive kernel of different particle size at heating rate 20 �C/min,
sample weight of about 10 mg (TGA), nitrogen flow rate was 50 ml/
min
0
500
1000
1500
2000
2500
3000
0 100 200 300 400 500 600 700 800 900 1000
DTG
[Wt%
/min
]×10
^5
Temperature,°C
300-500 µm
500-710 µm
710-1180 µm
1180-1400 µm
Fig. 3 Variation of the instantaneous rate of reaction with temper-
ature at 20 �C/min heating rate for pyrolysis of olive kernel
Waste Biomass Valor
123

used in each test was 40 g representing 10 wt% of the total
bed material weight. The weight variation in TGFBR
during the pyrolysis process was recorded online with the
weighing indicators at 1 s time intervals. According to
Choi et al. [29], bed particles should have terminal veloc-
ities larger than the superficial gas velocity to prevent
elutriation loss of bed material. Therefore, during this study
the superficial velocity was kept much lower than the ter-
minal velocity (0.89 m/s) and accordingly no significant
losses of bed material were measured (\0.1 %) with the
load cell.
Influence of Nitrogen Flow on Pyrolysis Conversion Rate
A fundamental issue in pyrolysis is the interaction of
evolving nascent, hot pyrolysis vapours with the sur-
rounding decomposing solid. The residence time of the
vapour phase of pyrolysis products is affected by the
nitrogen flow used for fluidisation, which alters the extent
of secondary reactions such as cracking and char formation
[8] and improves the heat transfer from fluid gas to the
particle.
Olive kernel was pyrolysed under different conditions.
Figure 4 shows the variation of the conversion with reac-
tion time for the particle size classification between 1180
and 1400 lm at temperature 300 and 500 �C using dif-
ferent fluidising gas flow velocities that were below the
terminal fluidisation velocity condition for the silica sand
used. The trend of biomass conversion at 300 �C for dif-
ferent flow velocities of N2 were the same, which suggests
the inhibition of internal and external diffusion effects at
this temperature, but there was no effect of increasing the
flow velocity beyond 0.09 m/s (30 l/min) although a small
deviation occurred with the 0.06 m/s (20 l/min) result
which is thought to be due to limited silica sand fluidisation
observed at the beginning of biomass addition.
At the higher temperature of 500 �C, the rate of reactiondetermined from the slope of the conversion line showed a
wide variation up to a velocity of 0.12 m/s (40 l/min), after
which a much smaller variation occurred. This critical gas
flow velocity represents the flow required to minimise the
external diffusion inhibition on the reaction rate [10]. By
operating the gas–solid reaction system at sufficiently high
gas flow velocity and rate, the mass transfer effects could
be minimised so that any further increase in the gas flow
rate did not produce an increase in the overall reaction rate
[30]. Therefore, a flow velocity of 0.12 m/s (40 l/min) was
chosen as the basis for all experimental work, representing
the minimum gas velocity required to limit external
diffusion.
Effect of Particle Size
In laboratory scale pyrolysis, particle size can have a sig-
nificant effect on the reaction rate. When the particle size
increases the temperature gradients inside the particle also
increase, so that at any given time, the surface temperature
is higher than that of the core, which can increase the solid
yields with a corresponding decrease in liquid and gas yield
[8]. In this study, Fig. 5 illustrates the influence of Olive
kernel particle size on conversion at temperatures of 300,
350, 400 and 451 �C. At this range of temperatures, it was
observed that the conversion profile exhibited minimal
differences for the particle sizes tested. Assuming the
temperature and concentration of the produced gases were
uniform, it was concluded that the rate of de-volatilisation
occurred homogenously throughout the particle and the
rate did not depend on the size of particle. Szekely et al.
[30] reported the same explanation for gas solid reactions
at low temperature. However, at higher temperatures
between 500 and 660 �C as shown in Fig. 6, the influence
of particle size was more obvious. When the particle size
decreases the reaction time also decreases. One may
therefore assume that at higher temperatures the effect of
external diffusion is greater, therefore the effect of tem-
perature gradient is greater leading to heat transfer limi-
tations. The comparatively low thermal conductivity of
biomass gives a low heating rate through larger particles
Fig. 4 Total weight conversion against reaction time in TGFBR at different flowrate, T = 300 and 500 �C
Waste Biomass Valor
123

Fig. 5 Progress of conversion fractions against reaction time at temperatures (300, 350, 400 and 451 �C)
Fig. 6 Progress of conversion fractions against reaction time at temperatures (500, 546, 600 and 660 �C)
Waste Biomass Valor
123

which leads to increased char formation [31]. These results
were consistent with findings reported in the literature
where at low temperatures the limitation of the reaction
rate is mainly due to chemical kinetics (up to about
400 �C), while mass transport phenomena limit the reac-
tions at higher temperatures [32].
Effect of Temperature
Figure 7 shows the effect of temperature on char yield as a
percentage of the original Olive kernel mass. For the par-
ticle size classifications (300–500, 500–710, 710–1180,
1180–1400 lm and the as received biomass) the char mass
percent decreased from between 55 and 60 wt% at 300 �Cto 9–12 wt% at 660 �C. A sudden decrease in the char
yield occurred between 300 and 350 �C ranging from 37 %
for the largest particle size (as received) to 28 wt% for the
smallest size classification 300–500 lm. In comparison,
Zabaniotou et al. [33] reported that the Olive kernel char
yield decreased with increasing temperature during pyrol-
ysis to a minimum value of 33 wt% of sample and yields
stabilised above 500 �C.There are two types of reaction through which the
thermal degradation occurs: a comparatively slow decom-
position and charring on heating at lower temperatures
\300 �C and a rapid devolatilization accompanied by the
formation of levoglucosan from pyrolysis at higher tem-
peratures. At temperatures [302 �C, cellulose and hemi-
cellulose depolymerizes producing volatile products [34]
as shown in Fig. 3. For this reason the significant weight
percent change occurring between 300 and 350 �C is likely
to be due to the increased devolatilization rate of hemi-
cellulose and cellulose. The char formation decreases with
increasing temperature due to further decomposition of
biomass and there was little difference observed for the
different classifications.
Figure 8 illustrates the influence of temperature on the
conversion for all particle sizes of Olive kernel (300–500,
500–710, 710–1180, 1180–1400 lm and as received). As
expected, the completion time of pyrolysis reduced with
increasing temperature for all particle sizes. At 300 �C, thereaction time was 450 s reducing to less than 10 s for
temperatures above 500 �C; this suggests that the increase
in temperature leads to a decreased yield of solid and an
increased yield of gas product. The moderate temperature,
high heat transfer to the biomass particles and short resi-
dence time of hot vapour in the reaction zone are the most
significant characteristics of fast pyrolysis, used to describe
processes with reaction times of only a few seconds or less,
[35, 36]. As shown in Fig. 8, the pyrolysis of Olive kernel
in the TGFBR occurred under fast pyrolysis conditions.
Kinetic Analysis of Pyrolysis of Olive Kernel
Non-isothermal testing of Olive kernel was done in the
TGA instrument with a 20 �C/min heating rate. Several
solid-state mechanisms (Table 1) were tested for a suit-
able fit by the Coats-Redfern method in order to determine
the mechanisms responsible for the decomposition of bio-
mass of particle size 1180–1400 lm at conversion levels
between X = 0.2–0.8, because the main conversion occurs
in this study range. Equation (9) was applied separately to
each model, the form of G(x) giving a straight line with the
highest correlation coefficient was considered to be the
model function best representing the kinetic mass loss
reaction. Table 3 shows the different reaction models and
correlation coefficient fits obtained from the plots of
ln(G(x)/T2) verses 1/T as illustrated in Fig. 9. From the
slope of each line, the values of activation energies were
obtained.
Table 3 revealed that the two dimensional diffusion
model (G2) was the best fit. The high coefficient value
(0.986) demonstrated a good fit and the activation energy
of Olive kernel (1180–1400 lm) measured 74.4 kJ/mol.
For the isothermal condition, Fig. 10 (low temperature
\500 �C) and Fig. 11 (high temperature C500 �C) illus-
trate the correlation of G(x) against time at different
reaction temperatures for 1180–1400 lm Olive kernel in
the TGFBR. Based on the fitting accuracy, the most
probable reaction models (Table 4) were selected from
0
10
20
30
40
50
60
70
250 300 350 400 450 500 550 600 650 700
Char
Yie
ld (w
t%)
Temperature, °C
300-500 µm
500-710 µm
710-1180 µm
1180-1400 µm
as received
Fig. 7 Char yield as a function of temperature (TGFBR)
Fig. 8 Olive kernel conversion versus reaction time in TGFBR
Waste Biomass Valor
123

nineteen potential reaction models shown in Table 1. The
two dimensional diffusion (G2) and three dimensional (G3)
model were had the highest fitting accuracy for tempera-
tures between 320 and 451 �C and 500 and 660 �Crespectively. The data contained in Table 4 verifies the
speculation that the decomposition of Olive kernel pro-
ceeded with different consecutive mechanisms. The
mechanism of two dimensional diffusion could describe
the thermal decomposition at low temperature while three
dimensional diffusion described it at high temperatures. G2
is the function for a two-dimensional diffusion controlled
process, while G3 is Jander’s equation for diffusion-con-
trolled solid state reaction kinetics [37].
From straight line plots of the experimental data at
different temperatures, the values of k relating to the
Arrhenius function with temperature (see Fig. 12) are
shown. From the lnk versus 1/T plot, the slope (-EA/R)
was used to obtain the values of activation energy for the
experiments between 320–451 and 500–660 �C for the
Olive kernel pyrolysis, giving activation energies of 67.4
and 60.8 kJ/mol respectively. Table 4 shows the correla-
tion coefficients, conversion range and the normal loga-
rithm of rate constant obtained from the plot of
G(x) against t.
Table 3 Reaction model for
olive kernel decomposition
during fixed bed non-isothermal
pyrolysis
G(X) G2 G3 G6 G7 G8 G9 G11 G15 G17
Non-isothermal (TGA), X = 0.2–0.8
R2 0.9866 0.862 0.9843 0.9809 0.9809 0.9809 0.9763 0.961 0.9763
Ea (kJ/mol) 74.4 – 97 43.7 43.7 43.7 27.9 64.3 27.9
Fig. 9 Correlation of ln(G(X)/T) versus 1/T for 1180–1400 lmparticle size for non-isothermal TGA
Fig. 10 Correlation of G(X) versus time at different reaction temperatures for 1180–1400 lm particle size (low temperatures) for TGFBR
Waste Biomass Valor
123
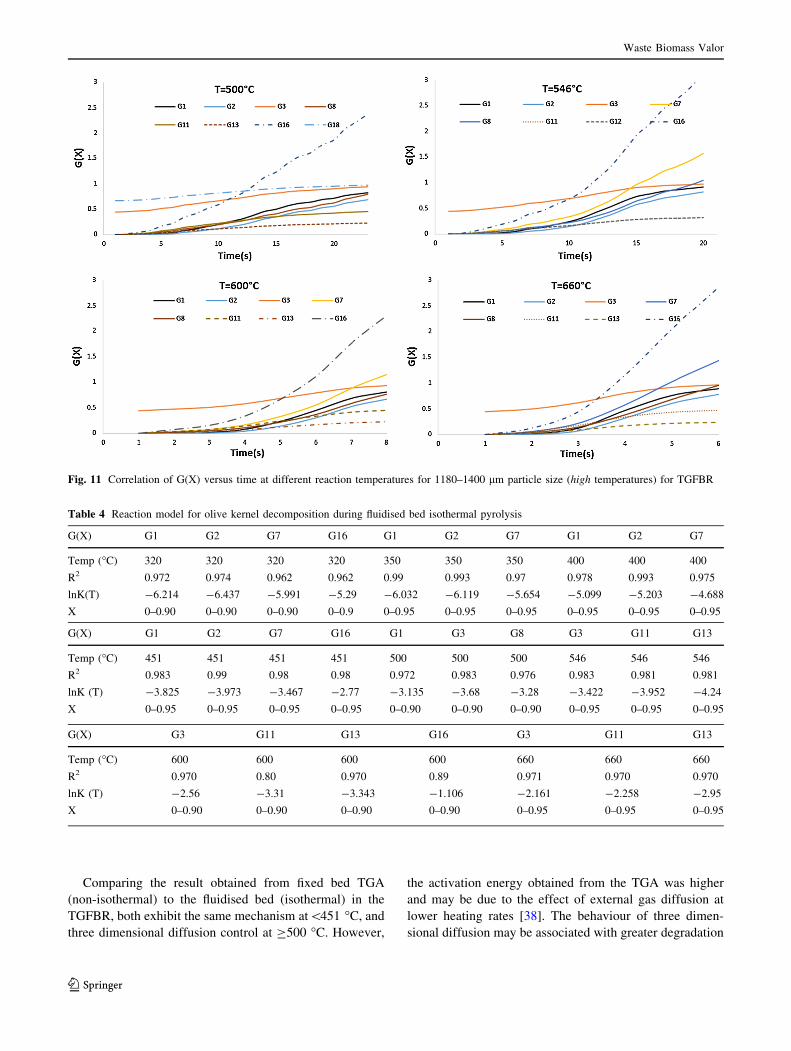
Comparing the result obtained from fixed bed TGA
(non-isothermal) to the fluidised bed (isothermal) in the
TGFBR, both exhibit the same mechanism at\451 �C, andthree dimensional diffusion control at C500 �C. However,
the activation energy obtained from the TGA was higher
and may be due to the effect of external gas diffusion at
lower heating rates [38]. The behaviour of three dimen-
sional diffusion may be associated with greater degradation
Fig. 11 Correlation of G(X) versus time at different reaction temperatures for 1180–1400 lm particle size (high temperatures) for TGFBR
Table 4 Reaction model for olive kernel decomposition during fluidised bed isothermal pyrolysis
G(X) G1 G2 G7 G16 G1 G2 G7 G1 G2 G7
Temp (�C) 320 320 320 320 350 350 350 400 400 400
R2 0.972 0.974 0.962 0.962 0.99 0.993 0.97 0.978 0.993 0.975
lnK(T) -6.214 -6.437 -5.991 -5.29 -6.032 -6.119 -5.654 -5.099 -5.203 -4.688
X 0–0.90 0–0.90 0–0.90 0–0.9 0–0.95 0–0.95 0–0.95 0–0.95 0–0.95 0–0.95
G(X) G1 G2 G7 G16 G1 G3 G8 G3 G11 G13
Temp (�C) 451 451 451 451 500 500 500 546 546 546
R2 0.983 0.99 0.98 0.98 0.972 0.983 0.976 0.983 0.981 0.981
lnK (T) -3.825 -3.973 -3.467 -2.77 -3.135 -3.68 -3.28 -3.422 -3.952 -4.24
X 0–0.95 0–0.95 0–0.95 0–0.95 0–0.90 0–0.90 0–0.90 0–0.95 0–0.95 0–0.95
G(X) G3 G11 G13 G16 G3 G11 G13
Temp (�C) 600 600 600 600 660 660 660
R2 0.970 0.80 0.970 0.89 0.971 0.970 0.970
lnK (T) -2.56 -3.31 -3.343 -1.106 -2.161 -2.258 -2.95
X 0–0.90 0–0.90 0–0.90 0–0.90 0–0.95 0–0.95 0–0.95
Waste Biomass Valor
123

of hemicellulose and cellulose at high heating rates leading
to higher volatility of the main biomass components. In
addition, pore lattice defects are considered a significant
factor because these defects promote reactivity and diffu-
sion of material [39]. The phenomena of two and three
dimensional diffusion has been noticed by Li [40]; where
during the study the kinetic mechanism of the reduction
reactions of Ferrum niobate were quantified. In addition,
the pyrolytic reactions of oil-palm shell at low and high
temperature regimes were found to be based on two
mechanisms according to Guo and Lua [41]. In comparison
to thermogravimetric pyrolysis methods other researchers
have also reported different mechanisms and sequences
involved in the formation of gas species, for example three
dimensional diffusion was found responsible for the pro-
duction of hydrogen and methane during the pyrolysis
process [12, 17].
Conclusion
A laboratory scale thermogravimetric fluidised bed reactor
(TGFBR) was developed to measure the reaction kinetics
of Olive kernel biomass pyrolysis with fluidising sand
mixtures over temperature ranges from 300 to 660 �C and
the results compared with fixed bed pyrolysis in a typical
bench top TGA.
It was shown that above 500 �C, the time taken to fully
react a 40 g sample in a bed of 400 g of sand was less than
10 s. Furthermore, the fast pyrolysis exhibited in the
TGFBR provided a uniform temperature inside the reactor
supressing external diffusion effects confirmed by little
variation in the reaction time above 40 l/min flow rate of
the fluidising gas.
In the TGA apparatus, particle size had no measurable
effect on the reaction rate, whereas a clear dependence of
reaction rate on biomass particle size was demonstrated in
the TGFBR. In both apparatus, at low heating rates
(\451 �C) the reaction time was unaffected by the biomass
particle size over the ranges tested. However, for the
TGFBR there was a dependence of reaction rate on particle
size above 500 �C when it was observed that the reaction
time increased with larger particle sizes.
The pyrolysis reaction kinetics were studied under non-
isothermal conditions in the TGA and isothermal condi-
tions in the TGFBR. A two dimensional diffusion model
was the controlling mechanism identified with the best fit
for the fixed bed TGA with an activation energy of
74.4 kJ/mol. In comparison, 2-dimensional and 3-dimen-
sional reaction mechanisms gave the best fits to describe
the reaction kinetics of the biomass particles over 2 tem-
perature ranges in the TGFBR which could be divided into
two stages: the two dimensional diffusion reaction mech-
anism from 320 to 451 �C with an activation energy of
67.4 kJ/mol; and the three dimensional diffusion reaction
mechanism from 500 to 660 �C with an activation energy
of 60.8 kJ/mol.
Bench top TGA analysis of pyrolysis is a rapid and
valuable method for comparing the behaviour of biomass
reactivity, but the small sample sizes tested and low heat-
ing rates places limits on the relevance of results. In
comparison, the larger laboratory scale TGFBR fitted with
load cells allows detailed measurements at conditions
likely to be more representative of those encountered on
larger scale systems where heat distribution, heat transfer
and mass diffusion effects play a major role in the reac-
tivity of biomass.
Acknowledgments We express our sincere thanks to the Ministry of
Higher Education/AL-Nahrain University for their financial support
under Contract Number 6052.
Open Access This article is distributed under the terms of the Creative
Commons Attribution 4.0 International License (http://creative
commons.org/licenses/by/4.0/), which permits unrestricted use, distri-
bution, and reproduction in anymedium, provided you give appropriate
credit to the original author(s) and the source, provide a link to the
Creative Commons license, and indicate if changes were made.
Fig. 12 Arrhenius plot for olive kernel pyrolysis
Waste Biomass Valor
123

References
1. Zabaniotou, A., Stavropoulos, G., Skoulou, V.: Activated carbon
from Olive kernels in a two-stage process: industrial improve-
ment. Bioresour. Technol. 99, 320–326 (2008)
2. Skoulou, V., Zabaniotou, A., Stavropoulos, G., Sakelaropoulos,
G.: Syngas production from Olive tree cuttings and Olive kernels
in a downdraft fixed-bed gasifier. Int. J. Hydrogen Energy 33,1185–1194 (2008)
3. Yaman, S.: Pyrolysis of biomass to produce fuels and chemical
feedstocks. Energy Convers. Manag. 45, 651–671 (2004)
4. de Jong, W., Pirone, A., Wojtowicz, M.A.: Pyrolysis of Mis-
canthus Giganteus and wood pellets: TG-FTIR analysis and
reaction kineticsq. Fuel 82, 1139–1147 (2003)
5. Wang, G., Li, W., Li, B., Chen, H.: TG study on pyrolysis of
biomass and its three components under syngas. Fuel 87,552–558 (2008)
6. Caballero, J.A., Conesa, J.A., Font, R., Marcilla, A.: Pyrolysis
kinetics of almond shells and Olive stones considering their
organic fractions. J. Anal. Appl. Pyrol. 42, 159–175 (1997)
7. Reina, J., Velo, E., Puigjaner, L.: Thermogravimetric study of the
pyrolysis of waste wood. Thermochim. Acta 320, 161–167 (1998)8. Encinar, J.M., Gonzalez, J.F., Gonzalez, J.: Fixed-bed pyrolysis
of Cynara cardunculus L. Product yields and compositions. Fuel
Process. Technol. 68, 209–222 (2000)
9. Park, H.J., Park, Y.-K., Dong, J.-I., Kim, J.-S., Jeon, J.-K., Kim,
S.-S., Kim, J., Song, B., Park, J., Lee, K.-J.: Pyrolysis charac-
teristics of Oriental white oak: kinetic study and fast pyrolysis in
a fluidized bed with an improved reaction system. Fuel Process.
Technol. 90, 186–195 (2009)
10. Yu, J., Yao, C., Zeng, X., Geng, S., Dong, L., Wang, Y., Gao, S.,
Xu, G.: Biomass pyrolysis in a micro-fluidized bed reactor:
characterization and kinetics. Chem. Eng. J. 168, 839–847 (2011)
11. Kersten, S.R., Wang, X., Prins, W., van Swaaij, W.P.: Biomass
pyrolysis in a fluidized bed reactor. Part 1: Literature review and
model simulations. Ind. Eng. Chem. Res. 44, 8773–8785 (2005)
12. Jian, Y., Zhu, J.-H., Feng, G., Duan, Z.-K., Liu, Y.-Y., Xu, G.-W.:
Reaction kinetics and mechanism of biomass pylolysis in a micro-
fluidized bed reactor. J. Fuel Chem. Technol. 38, 666–672 (2010)13. Lv, P., Chang, J., Wang, T., Wu, C., Tsubaki, N.: A kinetic study
on biomass fast catalytic pyrolysis. Energy Fuels 18, 1865–1869(2004)
14. Ollero, P., Serrera, A., Arjona, R., Alcantarilla, S.: Diffusional
effects in TGA gasification experiments for kinetic determina-
tion. Fuel 81, 1989–2000 (2002)
15. Sait, H.H., Hussain, A., Salema, A.A., Ani, F.N.: Pyrolysis and
combustion kinetics of date palm biomass using thermogravi-
metric analysis. Bioresour. Technol. 118, 382–389 (2012)
16. Guerrero, M.R.B., Marques da Silva Paula, M., Zaragoza, M.M.,
Gutierrez, J.S., Velderrain, V.G., Ortiz, A.L., Collins-Martınez,
V.: Thermogravimetric study on the pyrolysis kinetics of apple
pomace as waste biomass. Int. J. Hydrogen Energy 39,16619–16627 (2014)
17. Gai, C., Dong, Y., Lv, Z., Zhang, Z., Liang, J., Liu, Y.: Pyrolysis
behavior and kinetic study of phenol as tar model compound in
micro fluidized bed reactor. Int. J. Hydrogen Energy 40,7956–7964 (2015)
18. Haines, P.J.: Principles of Thermal Analysis and Calorimetry,
pp. 42–47. Royal society of chemistry, London (2002)
19. Oluoti, K.O., Richards, T., Doddapaneni, T., Kanagasabapathi,
D.: Evaluation of the pyrolysis and gasification kinetics of trop-
ical wood biomass. BioResources 9, 2179–2190 (2014)
20. Yu, J., Zeng, X., Zhang, J., Zhong, M., Zhang, G., Wang, Y., Xu,
G.: Isothermal differential characteristics of gas–solid reaction in
micro-fluidized bed reactor. Fuel 103, 29–36 (2013)
21. Gauthier, D., Zerguerras, S., Flamant, G.: Influence of the particle
size distribution of powders on the velocities of minimum and
complete fluidization. Chem. Eng. J. 74, 181–196 (1999)
22. Daneshvar, S., Otsuka, K.: Pyrolytic behavior of green macro
algae and evaluation of its activation energy. Int. J. Chem. Eng.
Appl. 3, 256–263 (2012)
23. Chen, W.-H., Kuo, P.-C.: A study on torrefaction of various
biomass materials and its impact on lignocellulosic structure
simulated by a thermogravimetry. Energy 35, 2580–2586 (2010)
24. Yang, H., Yan, R., Chen, H., Lee, D.H., Zheng, C.: Character-
istics of hemicellulose, cellulose and lignin pyrolysis. Fuel 86,1781–1788 (2007)
25. Kastanaki, E., Vamvuka, D., Grammelis, P., Kakaras, E.: Ther-
mogravimetric studies of the behavior of lignite–biomass blends
during devolatilization. Fuel Process. Technol. 77–78, 159–166(2002)
26. Jae, J., Tompsett, G.A., Lin, Y.-C., Carlson, T.R., Shen, J.,
Zhang, T., Yang, B., Wyman, C.E., Conner, W.C., Huber, G.W.:
Depolymerization of lignocellulosic biomass to fuel precursors:
maximizing carbon efficiency by combining hydrolysis with
pyrolysis. Energy Environ. Sci. 3, 358–365 (2010)
27. Hartman, M., Svoboda, K.: Predicting the effect of operating
temperature on the minimum fluidization velocity. Ind. Eng.
Chem. Process Des. Dev. 25, 649–654 (1986)
28. Kunii, D., Levenspiel, O.: Fluidization Engineering. Elsevier,
Amsterdam (2013)
29. Choi, J.H., Suh, J.M., Chang, I.Y., Shun, D.W., Yi, C.K., Son,
J.E., Kim, S.D.: The effect of fine particles on elutriation of
coarse particles in a gas fluidized bed. Powder Technol. 121,190–194 (2001)
30. Szekely, J., et al.: Gas Solid Reactions, pp. 65–112. Academic
Press, Inc, New york (1976)
31. Bridgwater, A., Meier, D., Radlein, D.: An overview of fast
pyrolysis of biomass. Org. Geochem. 30, 1479–1493 (1999)
32. Reschmeier, R., Roveda, D., Muller, D., Karl, J.: Pyrolysis
kinetics of wood pellets in fluidized beds. J. Anal. Appl. Pyrol.
108, 117–129 (2014)
33. Zabaniotou, A.A., Kalogiannis, G., Kappas, E., Karabelas, A.J.:
Olive residues (cuttings and kernels) rapid pyrolysis product
yields and kinetics. Biomass Bioenergy 18, 411–420 (2000)
34. Demirbas, A.: Effects of temperature and particle size on bio-char
yield from pyrolysis of agricultural residues. J. Anal. Appl. Pyrol.
72, 243–248 (2004)
35. Czernik, S., Bridgwater, A.: Overview of applications of biomass
fast pyrolysis oil. Energy Fuels 18, 590–598 (2004)
36. Scott, D.S., Piskorz, J., Bergougnou, M.A., Graham, R., Overend,
R.P.: The role of temperature in the fast pyrolysis of cellulose and
wood. Ind. Eng. Chem. Res. 27, 8–15 (1988)
37. Gil, M.V., Casal, D., Pevida, C., Pis, J.J., Rubiera, F.: Thermal
behaviour and kinetics of coal/biomass blends during co-com-
bustion. Bioresour. Technol. 101, 5601–5608 (2010)
38. Xu, G., Gao, S., Yu, J., Li, Q., Zhu, J., Duan, Z.: Characteristics
and kinetics of biomass pylolysis in a micro fluidized bed reactor.
In: 13th International conference on fluidization—new paradigm
in fluidization engineering, Hotel Hyundai, Gyeong-ju, Korea,
16–21 May 2010
39. House, J.E.: Principles of Chemical Kinetics, 2nd edn,
pp. 229–233. Academic press, London (2007)
40. Yang, Y., Han, J., Zhao, W., Zhang, B.: Kinetic mechanism in the
process of carbothermal reduction of ferrum niobate. J. Wuhan
Univ. Technol. Mater. Sci. Ed. 30, 918–922 (2015)
41. Guo, J., Lua, A.C.: Kinetic study on pyrolytic process of oil-palm
solid waste using two-step consecutive reaction model. Biomass
Bioenergy 20, 223–233 (2001)
Waste Biomass Valor
123