a comparison of the nwea measures of academic
TRANSCRIPT

A COMPARISON OF THE NWEA MEASURES OF ACADEMIC
PROGRESS AND THE MISSOURI ASSESSMENT PROGRAM
A Dissertation
Presented to
The Faculty of the Graduate School
at the University of Missouri-Columbia
In Partial Fulfillment
of the Requirements for the Degree
Doctor of Education
by
JUDITH SHIELDS
Dr. Cynthia MacGregor, Dissertation Supervisor
MAY 2008

© Copyright by Judith Shields 2008
All Rights Reserved

The undersigned, appointed by the Dean of the Graduate School, have examined the dissertation entitled:
A COMPARISON OF THE NWEA MEASURES OF ACADEMIC PROGRESS
AND THE MISSOURI ASSESSMENT PROGRAM
Presented by Judith Shields
a candidate for the degree of Doctor of Education
and hereby certify that, in their opinion, it is worthy of acceptance.
______________________________
Dr. Cynthia MacGregor
______________________________
Dr. Beth Hurst
______________________________
Dr. Charles D. Keck
______________________________
Dr. Gerald H. Moseman
______________________________
Dr. Robert Watson

ii
ACKNOWLEDGEMENTS
The help of my advisor, Dr Cynthia MacGregor at the Counseling, Leadership
and Special Education Department at Missouri State University in Springfield, Missouri
has been invaluable. She has been my professor through many of my courses as well as
guiding, prodding, and encouraging me through the dissertation process. Thank you. My
dissertation committee, Dr. Charles Don Keck, Dr. Gerald Moseman, Dr. Robert Watson
of the Counseling, Leadership and Special Education Department, and Dr. Beth Hurst of
the Reading Foundations/Technology Department of Missouri State University, have
been helpful and flexible with the dissertation process. Thank you. To the Superintendent
and Curriculum director at the district I worked with, I express appreciation for the extra
time involved in providing me with the information I needed. I would also like to thank
my daughter, Rebekah Shields, who helped and encouraged me when I was bogged down
in the statistics of this research; my husband, W. Gordon Shields, for his love,
encouragement, and patience, and also his help when the computer had a mind of its own;
to Phillip Shields and Abigail Condra, who were always encouraging. I want to thank my
father and mother, J. Tillman and Berta Williams for instilling the notion in me that it is
never too late to reach for dreams. Thank you to God and the Lord Jesus Christ for the
blessing, among others, of this opportunity and for molding me into the person that I am.

iii
TABLE OF CONTENTS
ACKNOWLEGEMENTS ……………………………………………………….
LIST OF TABLES ……………………………………………………………….
ACADEMIC ABSTRACT ………………………………………………………
Chapter
1. INTRODUCTION TO THE STUDY
Background ………………………………………………………………...
Conceptual Underpinnings for the Study…………………………………..
Statement of the Problem ………………………………………………….
Purpose of the Study ……………………………………………………….
Research Questions ………………………………………………………...
Design of Study ……………………………………………………………
Limitations and Assumptions ……………………………………………..
Definition of Key Terms …………………………………………………...
Summary …………………………………………………………………...
2. REVIEW OF RELATED LITERATURE
Introduction ………………………………………………………………..
History of Standards Movement and High-Stakes Testing ………………..
History of State Involvement with NCLB …………………………………
History of Missouri Assessment …………………………………………...
Advantages of High-Stakes Testing ……………………………………….
Disadvantages of High-Stakes Testing …………………………………….
ii
vi
viii
1
4
7
9
11
13
14
15
21
23
25
32
35
39
41

iv
Computer-Adaptive Testing ……………………………………………….
Summary …………………………………………………………………...
3. METHODS
Introduction ………………………………………………………………..
Research Questions ………………………………………………………..
Population and Sample
Population ………………………………………………………………..
Sample …………………………………………………………………...
Data Collection and Instrumentation ………………………………………
Missouri Assessment Program ………………………………………….
Northwest Evaluation Association Measures of Academic Progress …..
Data Analysis ………………………………………………………………
Summary …………………………………………………………………..
4. RESULTS …………………………………………………………………
Overview of Data ………………………………………………………….
Research Question 1 ……………………………………………………….
Bivariate Linear Regression …………………………………………….
Overall Mathematics RIT Score ……………………………………..
Mathematics Subtests RIT Score …………………………………….
Multiple Regression of Subtests RIT Scores ……………………………
Research Question 2………………………………………………………..
Bivariate Linear Regression …………………………………………….
Overall Mathematics RIT Score ……………………………………...
47
51
53
53
56
58
60
60
63
65
68
70
71
74
74
74
75
76
81
82
82

v
Reading Subtest Scores ………………………………………………
Multiple Regression of Subtest RIT Scores ……………………………..
Research Question 3 ………………………………………………………..
Bivariate Linear Regression …………………………………………….
Overall Language Usage RIT Scores …………………………………
Language Usage Subtest Scores ………………………………………
Multiple Regression of Subtest RIT Scores ……………………………..
Summary ……………………………………………………………………
5. DISCUSSION
Introduction ………………………………………………………………..
Findings ……………………………………………………………………
Limitations …………………………………………………………………
Implications for Practice …………………………………………………...
Implications for Research ………………………………………………….
APPENDIX ……………………………………………………………………...
REFERENCES …………………………………………………………………..
VITA ……………………………………………………………………………..
82
83
89
89
89
90
91
97
99
102
104
105
106
108
124
135

vi
LIST OF TABLES
Table
1. Descriptive Statistics for MO MAP Assessment …………………………..
2. Descriptive Statistics for NWEA MAP Tests and Subtests ……………….
3. Bivariate Linear Regression for Overall Mathematics RIT Score ………...
4. Bivariate Linear Regression for NWEA MAP Mathematics Subtests RIT Score ……………………………………………………………………….
5. Descriptive Statistics of the mUltiple Regression of Subtests f NWEA MAP Mathematics Test and MO MAP Mathematics Assessment ………..
6. Regression Model of Subtest of NWEA MAP Mathematics Test ………..
7. Model Summary for Subtests of NWEA MAP Mathematics Test and MO MAP Mathematics Assessment ……………………………………………
8. Regression Coefficients of NWEA MAP Mathematics Subtests and MO MAP Mathematics Score ………………………………………………….
9. Bivariate Linear Regression for Overall Reading RIT Score of NWEA MAP Test …………………………………………………………………
10. Bivariate Regression for Subtests of NWEA MAP Reading Test RIT Score ……………………………………………………………………….
11. Descriptive Statistics of the Forward Multiple Regression of Subtests of NWEA MAP Reading Test on MO MAP Communication Arts Assessment ………………………………………………………………..
12. Regression Model of Subtests of NWEA MAP Reading Test ……………
13. Model Summary of NWEA MAP Reading Subtests and MO MAP Communication Arts Assessment …………………………………………
14. Regression Coefficients of Subtests of NWEA MAP Reading Test ………
Page
72
73
75
76
77
78
79
80
82
83
84
85
86
88

vii
15. Bivariate Linear Regression for Overall Language Usage RIT Score of NWEA MAP Tests ………………………………………………………..
16. Bivariate Regressions for Subtests of NWEA MAP Language Usage RIT Score ……………………………………………………………………….
17. Descriptive Statistics of the Mulitple Regression of Subtests of NWEA MAP Lnguage Usage Test Against MO MAP Communication Arts Assessment ………………………………………………………………..
18. Forward Regression Model of Subtests of NWEA MAP Language Usage Test ………………………………………………………………………...
19. Model Summary of NWEA MAP Language Usage Subtests and MO MAP Communication Arts Assessment …………………………………..
20. Regression Coefficients of NWEA MAP Subscores ………………………
90
91
92
93
94
96

viii
ABSTRACT
The Missouri Assessment Program’s (MO MAP) required yearly assessment was
compared with the computer-adaptive Northwest Evaluation Association’s Measure of
Academic Progress (NWEA MAP) test to determine if the NWEA MAP was a good
predictor of the MO MAP assessment. Subtest Rasch unit scores of the NWEA MAP, as
well as the overall RIT scores of the mathematics, language usage, and reading tests were
compared with mathematics and communication arts assessments of the MO MAP.
Bivariate and multiple regressions suggested that both the subtests and overall RIT scores
were good predictors of the MO MAP communication arts and mathematics assessment.
Of the NWEA MAP subtests, data and probability was the best predictor of the MO MAP
mathematics assessment, strategies of reading process of the NWEA MAP reading test
was the best predictor of the MO MAP communication arts assessment, and forms and
types of writing of the language usage was the best predictor of the MO MAP
communication arts assessment. The research was conducted on data from a middle
sized, rural Missouri school district, population of 6th, 7th, and 8th graders for the years
2005-2007. The findings, although confined to a small population, should prove useful in
the decision on whether to employ the NWEA MAP in other Missouri districts.

1
CHAPTER ONE
INTRODUCTION TO THE STUDY
Background
High-stakes testing in the United States has been evolving for more than 20 years.
States have attempted various techniques and programs in order to raise the scores on the
state-mandated tests required by the No Child Left Behind legislation of 2001. In
Missouri, the state mandated test (Missouri Assessment Program, MAP) was developed
by teachers in cooperation with CTB/McGraw-Hill. The standards that direct the test and
the grade level expectations (GLE) were also developed by Missouri teachers over a
period of years beginning in 1986 (“Missouri Assessment”, 2006). Several districts in
Missouri have now added another high-stakes test to their repertoire. The computer-
adaptive Measure of Academic Progress (MAP) test has been popular throughout the
nation because of the ease of administration and timeliness of scoring (French, 2003). But
has this MAP test, developed by the Northwest Evaluation Association (NWEA)
enhanced student learning or enabled teachers to predict scores on MO MAP?
In 1983, the publication of A Nation at Risk (National Commission on Education)
was the catalyst for the beginning of the reform movement which would lead to the high-
stakes testing and accountability era in which educators now found themselves (Vogler &
Virtue, 2007). In the following years of the 1980s, states began what was to become three
waves of reform (Guthrie & Springer, 2004). Longer school days, more required courses,
higher standards of teacher certification, alignment of testing to standards, and
accountability programs characterized the second wave. With the passing of the Goals
Act of 1994, federal money was available to support standards-based reform projects and

2
all states began educational initiatives that created educational standards and challenged
content taught in the past (Goertz & Duffy, 2003). The third wave began with the No
Child Left Behind (NCLB) legislation of 2001. This legislation required the restructuring
of state laws, making districts and schools accountable for meeting the standards created
by each state (Guthrie & Springer, 2004). These reforms were known as the standards-
based systemic reforms (Massell, Kirst, & Hoppe, 1997).
Missouri’s accountability system developed along the same lines as other states.
In 1985, the Missouri Excellence in Education Act was passed with the purpose of
expanding opportunities and increasing outcomes of all students (Christenson, Nelson, &
Yseldyke, 2004). Included in the legislation was a list of Core Competencies and Key
Skills that teachers, college professors and administrators had developed for learner
outcomes. Schools were expected to align their curriculum to these key skills. For the
first time, teacher freedoms were limited regarding the curriculum offered to students.
The Missouri Mastery and Achievement Test was the assessment developed to align with
the Core Competencies and Key Skills.
In 1993, the Outstanding Schools Act was passed which called for a new
assessment system for Missouri that was primarily performance-based. This new
assessment system would test not just what the student knew, but how they could apply
that knowledge. The Missouri Assessment Project was established to provide
professional development for teachers who would be experiencing a new type of testing.
Missouri teachers worked with CTB/McGraw-Hill to develop the assessment and
teachers also worked to develop the standards to guide the test creation. By 1997, the first
tests were administered (Osterlind, n. d.).

3
NCLB (2002) changed Missouri’s MAP program. The MAP test was revamped
and new Grade Level Expectations (GLE) replaced the standards. The assessment was
aligned to GLEs and curriculum was required to be aligned as well. New measures of
accountability were put in place for schools, districts, and states (Massell et al., 1997).
The stakes were high with the new measures for accountability holding teachers,
administrators, districts, and states liable for student performance on state tests.
One of the big disadvantages of state-mandated testing was the amount of time
required for scoring, especially in Missouri, where constructed response and performance
test questions were answered by hand and scored by hand (Stokes, 2005). Scores from
March/April testing did not arrive until September of the next school year. All planning
for improvement was based on scores from the previous year (Woodfield, 2003).
Some school districts in Missouri adopted a second test published by Northwest
Evaluation Association (NWEA). The Measure of Academic Progress (MAP) was a
computer-adaptive test that allowed scores to be seen within days of the test. The
computer chose the next question for the student from a large test bank of questions,
according to the way the student answered the previous question (Van Horn, 2003). The
assessment also provided a measurement of student growth because the test was scored
using the Rasch unit (RIT). The RIT score was an equal interval score that was stable:
RIT scores always meant the same thing. As a result, the computer-generated RIT score
could be compared to the score from the last time the student took the test and growth
could be calculated (Northwest Evaluation Association, n. d.; Van Alphen, Halphens,
Hasman, & Imbos, 1994).

4
The United States has been testing its children more than any other industrialized
nation in 30 years (Kohn, 2000). Would adding one more test to a district’s repertoire of
tests have a benefit for student learning or for district accountability? Or was the NWEA
MAP test pulling the district on a tangent, redundant to reaching the target of improved
Missouri MAP scores?
Conceptual Underpinnings for the Study
The conceptual underpinnings of this study were found in utilization-focused
evaluation and policy analysis. Utilization-focused evaluation was an evaluation with the
end in mind (Patton, 1997). Would the evaluation be used or ignored? In analyzing policy
it was helpful to look at how it was “way back then” in order to understand current policy
of using two high-stakes tests to measure student achievement (Fowler, 2004).
Evaluation has been a dreaded word for many in education. Programs and
curriculum that were developed by educators were filled with personal preferences. Most
educators continued with a program because they believed in it. Feelings of insecurity
followed the beginnings of evaluation of precious programs. Personal evaluations by
educators had already formed their opinions of these programs. Nothing of evaluation
brought a positive response (Patton, 1997; Weiss, 1998). With the advent of utilization-
focused evaluation, the focus of evaluation shifted from criticism of adored or abhorred
programs, to using evaluation to answer educator’s questions about the programs.
Utilization-focused evaluation required a working relationship between the
evaluator and intended user. The usefulness of the evaluation drove the evaluation
process (Patton, 1997). Patton and Weiss (1998) both discussed the involvement of the
intended users. For this study, the researcher went to the superintendent of the district and

5
asked what she would like to know. The superintendent suggested that the district needed
to understand the relationship between the state-mandated MO MAP assessment and the
newly purchased NWEA MAP assessment. The NWEA MAP had been bought the
previous spring by the former superintendent. The new superintendent wanted to know if
the cost of the assessment system was worth the benefits. In the time allowed for the
study, there was another superintendent change. The new superintendent was also
interested in the evaluation of the assessment relationship. Although the superintendent
did not have input into the study, he has set the atmosphere for cooperation and curiosity
from the curriculum director.
Patton (1997) suggested that the strongest influence on whether or not an
evaluation was used was the personal factor. The interest of the intended user played the
number one role in whether the evaluation was utilized or ignored. In the case of this
study, the superintendent who asked for this study no longer worked for the district in
question, but the new superintendent did give his approval. If the NWEA MAP was
insignificant in predicting success on the MO MAP, then the superintendent would be
interested in saving money by not buying the assessment for the next years, resulting in a
political agenda for the superintendent. Compounding that agenda was the fact that the
test has been in place for three years and was instituted by a different superintendent.
The first intention of utilization-focused evaluation was for decision making.
Informed decisions could be made when reflective evaluation occurred (Weiss, 1998).
Evaluators made recommendations according to the findings and those recommendations
were supposed to be used. But Weiss found that sponsors were not always utilizing
findings and recommendations. Sometimes, if politically incendiary, recommendations

6
were ignored and status quo continued. Another effect was that even though sponsors
ignored findings and recommendations, stakeholders could still use some of those
recommendations on their own. They could also utilize recommendations of their own
that came from the findings. This study would be useful to the superintendent and
curriculum director. Teachers could use it in either the specified findings or
recommendations or could adopt recommendations of their own.
Fowler (2004) defined public policy as: “the dynamic and value laden process
through which a political system handles a public problem. It includes a government’s
expressed intentions and official enactments as well as its consistent patterns of activity
and inactivity” (p. 9). High-stakes assessment, as required by the No Child Left Behind
(NCLB) legislation of 2001, was one of the policies being analyzed. Beginning in the
1950s with the space race after the USSR launched Sputnik, through the years of writing
and revising standards, unto the present with the increasing accountability and
repercussions of state mandated testing, the past has formed the high-stakes policies of
the present (Fowler).
For many schools across the nation the policy to use more than one high-stakes
test had the goals of raising student achievement and scores on the state mandated tests
required by NCLB. But was this policy useful in meeting its purpose? If state standards
were chosen by educators and parents as the most important curricula for students to
learn, was the extra test adding to student learning and higher scores on the state
mandated test? In using the second test of choice, districts were attempting to empower
themselves by improving scores on the state mandated test. The purpose of this study was
to discover if this policy was succeeding.

7
Evaluation policy analysis formed the basis of this study. Using large amounts of
data from databanks, the researcher assessed how well the policy was reaching its goal.
The superintendent of the studied district played a pivotal role in the evaluation of the
policy of the district. The policy of high-stakes testing has imposed a state test on districts
in Missouri as well as in districts across the nation. It was the superintendent’s choice as
to what techniques to employ to help raise test scores. The superintendent of the study
district chose to add a computer adaptive test to help with student learning and in turn,
raise mandated test scores. As well as following policy, the superintendent was making
policy. The superintendent was interested in whether the policy was effective for the
purpose intended.
Statement of the Problem
The primary research question was whether the NWEA MAP test provided a
useful tool in predicting success on the MO MAP test. The MO MAP test was the state-
mandated test in Missouri that was given in the April of each year to students in third to
eighth grades and once at the chosen grade level in high school. The NWEA MAP test
was a supplemental, computer-adaptive test which some districts have bought to
supplement the state mandated test. The test originated in the Washington area and has
spread throughout the nation. The tests were fairly new in Missouri with testing being
done for only three to four years. The district in the study has been using the test for three
years and was one of the first in Missouri to purchase the test. Even though Missouri has
mandated one state test, the Missouri Assessment Program, the National Forum to
Accelerate Middle Grade Reform (2002) suggests that “No single test should ever be the
sole determinant of a young adolescent’s academic future” (p. 1). The NWEA MAP is a

8
different type of test that the MO MAP. The question is, “Can the two tests be used
together to further the academic growth of students in Missouri schools?”
For many of the states that use NWEA MAP, NWEA has conducted an alignment
of NWEA MAP questions with state standards to increase the validity of the test. NWEA
has not conducted an alignment of questions with Missouri standards to this date, making
it all the more important that this study be conducted (NWEA, 2007b). The districts in
Missouri need to have some assurance that the NWEA MAP test was providing some
benefit for districts trying to increase student learning as measured by the MO MAP. In
this study not only were the general scores of the NWEA MAP examined as predictors of
success of the MO MAP, but also at the subscores of the NWEA MAP as predictors of
success on MO MAP.
Another issue between the NWEA MAP and the MO MAP was that the MO MAP
was a performance assessment. Basically one third of the Missouri MAP assessment were
constructed response question, another third was a performance event, with only one third
as multiple choice questions. Two thirds of the test required a student to write out an
answer, often providing reasons for that answer. This required a student to use higher
order thinking skills in processing the answer (“Missouri Assessment,” 2006). Because
the NWEA MAP was a computer adaptive test, the questions were selected response.
Although the computer chose the questions on the NWEA MAP according to how well
the student answered the former questions (Van Horn, 2003), the questions were still
selected response and students did not have to use higher order thinking to answer them.
Research has yet to validate that the use of a computerized system is an appropriate way
to predict scores on the MO MAP, given the difference in assessment type.

9
One advantage of a computer adaptive test was in measuring growth of individual
students over time. Because the same test was given at least twice a year, for successive
years, the scores could be compared in order to measure growth (Van Horn, 2003). MO
MAP could not measure growth because the tests for successive years were different and
the MO MAP had no growth component in its reported statistics (“Missouri Assessment”,
2006).
Another advantage of computer adaptive testing was timeliness of reporting. MO
MAP scores were reported five months after testing, in the fall after testing in the spring
(Osterlind, n. d.), while NWEA MAP scores could be accessed three days after testing
(Woodfield, 2003). Scores reported in a timely fashion increased diagnostic ability of
teachers (Stokes, 2005). However, the question remained: Did NWEA MAP scores
predict success on MO MAP scores? The answer to this question should address the more
practical question regarding the investment of limited school resources and instructional
time in the administration of another assessment.
Purpose of the Study
High-stakes testing in education was a measure put in place by state and federal
government to monitor student learning. As the demand for increased rigor in curriculum,
also came the demand for increased accountability. All states now have a required state
test. Many states have adopted a test that was composed by a large testing company,
Missouri, however, has developed its own performance based assessment called the
Missouri Assessment Program. K-12 teachers, college professors, community members
have all contributed to test development along with CTB/McGraw Hill. With the

10
development of the test has come professional development for teachers and
administrators. Missouri has a large monetary investment in the MAP test.
School districts in Missouri have a large investment also. Teachers and
administrators have spent much of their professional development time each year in
analyzing the previous year’s results and in preparing their students for the current year’s
test. Teachers have also invested time in considering and preparing standards for students
to attain. The current round of expectations was called Grade Level Expectations (GLEs)
(Osterlind, n. d.). The state and federal governments, parents, and business want to know
how effective our schools in the United States were at reaching those goals that teachers
from schools have set, measuring the rigor of the curriculum and the effectiveness of the
teaching by what the students have learned and can perform (Elmore & Furhman, 2001).
Some districts in Missouri have added a high-stakes, computer-adaptive test
developed by the Northwest Evaluation Association (NWEA) to the battery. The
Measures of Academic Progress (MAP) was taken on the computer, with the computer
adapting the level of questions for each student, according to the correct answers given
by the students. The test was easier to administer and scores were available within three
days. The test can be given up to four times a year and measure the academic growth of a
student during the year and between years (NWEA, 2007a). The purpose of this study
was to determine if the results on the NWEA MAP test had any predictors for success for
the MO MAP test. This information could be used by school stakeholders to determine
money spent on extraneous tests was having the desired effect of raising the academic
achievement levels of the students they serve.

11
Research Questions
Within the context of this study, the following research questions were addressed:
1. How well do Rasch Unit (RIT) scores on the mathematics test of the NWEA
MAP test predict scores on the Missouri MAP mathematics test?
a. How well do RIT scores on the number and operations portion of the
mathematics test of the NWEA MAP test predict scores on the
Missouri MAP mathematics test?
b. How well do RIT scores on the algebraic relationships portion of the
mathematics test of the NWEA MAP test predict scores on the
Missouri MAP mathematics test?
c. How well do RIT scores on the geometric relationships of the
mathematics test of the NWEA MAP test predict scores on the
Missouri MAP mathematics test?
d. How well do RIT scores on the measurement section of the
mathematics test of the NWEA MAP test predict scores on the
Missouri MAP mathematics test?
e. How well do RIT scores on the data and probability section of the
mathematics test of the NWEA MAP test predict scores on the
Missouri MAP mathematics test?
f. Which RIT scores on the mathematics test of the NWEA MAP are the
best predictors of the Missouri MAP mathematics test?
2. How well do RIT scores on the NWEA MAP reading test predict scores on
the Missouri MAP communication arts test?

12
a. How well do RIT scores on the skills for reading process section of the
reading test of the NWEA MAP test predict scores on the Missouri
MAP communication arts test?
b. How well do RIT scores on the strategies for reading process section
on the reading test of the NWEA MAP reading test predict scores on
the Missouri MAP communication arts test?
c. How well do RIT scores on the comprehend/analyze literature section
of the reading test of the NWEA MAP test predict scores on the
Missouri MAP communication arts test?
d. How well do RIT scores on the comprehend/analyze nonfiction section
of the reading test of NWEA MAP test predict scores on the Missouri
MAP communication arts test?
e. Which RIT scores on the reading test of the NWEA MAP test are the
best predictors of the Missouri MAP communication arts test?
3. How well do RIT scores of the language usage test of the NWEA MAP test
predict scores on the Missouri MAP communication arts test?
a. How well do RIT scores of the apply writing process section of the
language usage test of the NWEA MAP test predict scores on the
Missouri MAP communication arts test?
b. How well do RIT scores of the capitalization and punctuation section
of the language usage test of the NWEA MAP test predict scores on
the Missouri MAP communication arts test?

13
c. How well do RIT scores of the parts of speech/spelling/sentence
structure section of the reading test of the NWEA MAP test predict
scores on the Missouri MAP communication arts test?
d. How well do RIT scores on the forms and types of writing section of
the reading test of the NWEA MAP test predict scores on the Missouri
MAP communication arts test?
e. Which RIT scores on the language usage test of the NWEA MAP test
are the best predictors of the Missouri MAP communication arts test?
Design of the Study
This quantitative study has its roots in positivism which assumed that there was a
reality and that reality could be described using measurements (Thomas & Brubaker,
2000). Aimed at discovering a relationship between two high-stakes assessments, the
relationship could be measured using a large sample of people taking both tests over a
period of three years. The results of those tests were analyzed using simple and multiple
regression analysis, looking for predictors from one test to another.
The type of research conducted was associational research because the study
compared two high-stakes tests, looking for predictors from one test to another. By
investigating the possible relationship, the researcher was able to understand the predictor
variable more completely so that it could be successfully used by educators in planning
curriculum that would result in greater student learning. Correlational methodology was
the type of associational research used in this study. Test scores for two different high-
stakes assessments were collected and analyzed with a multiple regression analysis
14
looking for predictor variables for success on the state-mandated test (Fraenkel &
Wallen, 2003).
Limitations and Assumptions
An assumption is defined as anything that was taken for granted in a study. The
researcher could change the tenor of the study by the unstated assumptions (Fraenkel &
Wallen, 2003). Different background assumptions provided different frames for viewing
a problem (Bolman & Deal, 1997). Limitations were the items that put boundaries on the
meaning of the results from the study. The following were the assumptions and
limitations of this study.
Two of the most obvious underlying assumptions from this study were the
concepts that success on the MO MAP and/or academic growth on the NWEA MAP were
caused by increased student learning. Student success on a high-stakes test can result
from teaching to the test or practice in test taking techniques, rather than increased
student learning. In order to adjust for this phenomenon, scores from three years of data
on the same students were utilized. An unusual bounce in the statistics, caused by
teaching to the test, might register one year but level out on the next.
The difference in testing modality was a validity issue with using NWEA MAP to
predict MO MAP. NWEA MAP was a computer assisted test. All questions were selected
response and came from an established data based used for students nationwide. MO
MAP is a test consisting of three types of tests: selected response, constructed response
and performance event. The test was constructed for Missouri students, by Missouri
teachers and community members. Content of the test is governed by the Missouri Grade
Level Expectations (GLE). A second modality issue was the computer usage within the

15
NWEA assessment while MO MAP is a paper and pencil test. The question for the
researchers was whether success on a test of one modality can predict success on a test of
another modality.
The next assumption was that all students were computer literate and were
comfortable taking a computer test. A student with computer anxiety might perform
lower on a computer adaptive test than a peer who was comfortable on a computer. To
compensate for this, teachers would need to ensure that students have the computer skills
needed to complete a computer adaptive test.
Limitations to the study were in sample size and type of district sampled. The
sample, although large in number, was limited to one school district. In order to be
generalized to a Missouri population, several other districts should be analyzed to see if
the data coincides. The district sample was a rural, midsized Missouri school district with
a total population between 2000-3000. For the year 2006/2007: the average graduation
rate was 88.9%, attendance rate was 93.2%, free/reduced lunch was 41.3% and IEP rate
was 18.6%. The annual proficiency rate for this district is slightly above what was
projected in the Annual Yearly Progress report.
Definitions of Key Terms
The following terms have been defined operationally as related to this study:
Adaptive assessment. Adaptive assessment “should be defined as an assessment
that changes its difficulty according to the performance of a student but reports the
outcome of the assessment on a scale that was common to all students” (NWEA, n. d., p.
1).

16
Algebraic relationships. Algebraic relationships is a subscale of the mathematics
test of the NWEA MAP assessment. This subscale measured the student’s ability to use
equations, make generalizations about geometric patterns, and represent a mathematical
situation using a letter or a symbol (NWEA, 2005).
Apply the writing process. Apply the writing process is a subscale of the language
usage test of the NWEA MAP assessment. This subscale measured the student’s ability to
organize information using graphic organizers, generate and revise a rough draft, and edit
a written document (NWEA, 2005).
Adequate Yearly Progress (AYP). Each state defines adequate yearly progress for
itself. This is the definition from the Missouri Department of Elementary and Secondary
Education (n. d.)
This is one of the essential elements of NCLB and probably the most complicated. To achieve the goal of all children being “proficient” (as defined by each state) by 2014, all public schools and districts must make satisfactory improvement each year toward that goal. Based on criteria included in NCLB, the Department of Elementary and Secondary Education has established specific annual targets for AYP in communication arts and math.
Following are Missouri’s AYP goals for 2003 through 2005. These figures show the combined percentage of students who must score at the “proficient” or “advanced” levels on the MAP in order for a school or district to achieve AYP. These targets apply to all subgroups of students listed in the next question.
Missouri’s "starting points" for determining the annual AYP targets were based on 2002 MAP scores and the overall student proficiency rate in the school at the 20th percentile of total public school enrollment. (p. 1-2)
. Capitalization and punctuation. Capitalization and punctuation is a subscale of
the language usage test of the NWEA MAP assessment. This subscale measured how
well students could use capitalization and punctuation in writing (NWEA, 2005).
AYP Targets 2003 2004 2005 Communication Arts 19.4% 20.4% 26.6% Mathematics 9.3% 10.3% 17.5%

17
Comprehend/analyze and evaluate literature. Comprehend/analyze literature is a
subscale of the reading test of the NWEA MAP assessment. This subscale measured how
well a student can identify text features, literary devices, and text elements of fiction
(NWEA, 2005).
Comprehend/analyze and evaluate non-fiction. Comprehend/analyze and evaluate
non-fictions is a subscale of the reading test of the NWEA MAP assessment. This
subscale measured how well a student can identify text features, text elements and
techniques, and understands directions (NWEA, 2005).
CPRE. The Consortium for Policy Research in Education unites researchers from
the University of Wisconsin-Madison, University of Pennsylvania, Harvard University,
University of Michigan, and Stanford University with the purpose of improving
education through practical research.
Data and probability. Data and probability is a subscale of the mathematics test of
the NWEA MAP assessment. This subscale measured the student’s ability to organize
and interpret graphs and data (NWEA, 2005).
Forms and types of writing. Forms and types of writing is a subscale of the
language usage test of the NWEA MAP assessment. This subscale measured the
student’s ability to identify types of writing, audience purpose, and development of
paragraphs (NWEA, 2005).
Geometric relationships. Geometric relationships is a subscale of the mathematics
test of the NWEA MAP assessment. This subscale measured the student’s ability to
recognize and identify the attributes of 2- and 3- dimensional shapes, use coordinate
representations, identify symmetry and describe the results of transformations.

18
High-Stakes Testing. Tests are considered to be “high-stakes when the results of a
test are used to “make significant educational decisions about schools, teachers,
administrators and students” (Amrein & Berliner, 2002a, p. 1). Examples of high-stakes
testing include SAT, mandated state testing such as the Missouri Assessment Program.
Improving America’s Schools Act (IASA), 1994. Improving America’s Schools
Act of 1994 amended the Elementary and Secondary Education Act of 1965. Title I of
this law appropriates funds for the “Fund for the Improvement of Education and specified
uses for those funds” (U. S. Metric Association, 2005, p. 1).
Low-stakes testing. When a test is conducted for diagnostic purposes within a
classroom and does not have significant impact on educational decisions. Examples of
low-stakes testing are tests used within the classroom for classroom assessment or
practice for high-stakes testing (Amrein & Berliner, 2002a).
Measurement. Measurement is a subscale of the mathematics test of the NWEA
MAP assessment. This subscale measured the student’s ability to tell time, count money,
and measure temperature; measure length, weight, and capacity, and calculate perimeter
and area.
MO MAP. MO MAP is the Missouri mandated testing under the No Child Left
Behind Legislation. The Missouri Assessment Program has created a performance-based
test in language arts, mathematics, and science. Language arts assessment was given in
grades 3-8 annually, and in grade 11. Mathematics assessment was given in 3-8 annually,
and in grade 10. Science was given in grades 5, 8, 11. There were three types of questions
on the MO MAP test: selected response questions, constructed response questions, and

19
performance events (Missouri Department of Elementary and Secondary Education,
2007c).
MO MAP language arts test. MO MAP language arts test is one of the tests within
the MO MAP assessment.
MO MAP mathematics test. MO MAP mathematics test is one of the tests within
the MO MAP assessment.
NAEP. The National Association of Educational Progress is “the only nationally
representative and continuing assessment project of what America’s students know and
can do in various subject areas” (NCES, 2007, p. 1). This project falls under the
jurisdiction of the National Center for Educational Statistics, which falls under the
Department of Education. The Commissioner of Education Statistics is required by law to
carry out the NAEP project. The project conducts representative testing in all states in
mathematics, reading, science, writing, the arts, civics, economics, geography, and U. S.
history. The project produces results of this testing in the Nation’s Report Card.
NCLB. The No Child Left Behind Act is a reauthorization of the Elementary and
Secondary Education Act. NCLB was passed by Congress in 2001 and signed by
President George W. Bush on January 8, 2002. “NCLB is built on four principles:
accountability for results, more choices for parents, greater local control and flexibility,
and an emphasis on doing what works based on scientific research” (U. S. Department of
Education, 2007, p. 1).
NWEA. The Northwest Evaluation Association produces the Measure of
Academic Progress test and provides teachers with the tools necessary to analyze student
growth and to utilize the scores in a practical way in their classroom (NWEA, n. d.).

20
NWEA language usage test. NWEA language usage test is one of the three tests
within the NWEA MAP assessment.
NWEA mathematics test. NWEA mathematics test is one of the three tests within
the NWEA MAP assessment.
NWEA reading test. NWEA reading test is one of the three tests within the
NWEA MAP assessment.
NWEA MAP. The NWEA MAP test is a computer-adaptive test developed by the
Northwest Evaluation Association. The Measures of Academic Progress assessment
measured “student general knowledge and academic growth in reading, language usage,
mathematics and science” (NWEA, n. d., p. 1).
RIT. RIT is short for Rasch Unit, named for the Danish statistician Georg Rasch,
who founded the theory. The Rasch unit is an equal interval unit that did not change, like
centimeters on a meter stick. The questions on the test are assigned a RIT level according
to their difficulty. RIT scores are stable. After 20 years of using RIT scores, they are still
the same (NWEA, 2007b).
Skills of reading process. Skills for reading process is a subscale of the reading
test of the NWEA MAP assessment. This subscale measures the student’s phonemic
awareness, use of phonics, and ability to define vocabulary (NWEA, 2005).
Speech/spelling/sentence structure. Speech/spelling/sentence structure is a
subscale of the language usage test of the NWEA MAP assessment. This subscale
measured the student’s ability to identify parts of speech, spell, and construct sentences
(NWEA, 2005).

21
Strategies for reading process. Strategies for reading process is a subscale of the
reading test of the NWEA MAP assessment. This subscale measured the student’s ability
to apply comprehension strategies before, during, and after reading (NWEA, 2005).
Summary
The roots of high-stakes testing can be traced to the publication of A Nation at
Risk (National Commission on Education) in 1983. This report stated that the nation’s
education system was at a crisis and called for reforms. Through the years, the reforms
had varied. Longer school days and more required courses were the first and easiest
reforms. The next reforms were the states’ educational initiatives that set standards for
curriculum and alignment of curriculum for those standards. Then finally with the
passage of NCLB in 2001, the federal government held states, districts, and schools
accountable for the scores on a yearly assessment.
Missouri kept in step with required reforms and developed, with the help of
teachers, their own state test and professional development system for teachers and
administrators. The MAP test was developed as a performance based test with three
components, selected response questions, constructed response questions, and
performance event. The standards have been revised and Missouri schools currently were
working with GLEs that tell teachers exactly what they were responsible for within each
year.
Several districts in Missouri have added a computer-adaptive test to their battery
of tests, the MAP created by NWEA. Computer-adaptive testing had the advantage over
MO MAP testing in the area of timeliness of results and measuring student academic

22
growth. But can teachers and districts use this assessment to enhance student learning
measured by the state mandated MO MAP?
In Chapter Two the literature supporting high-stakes testing is presented; both the
history of development of the concept, and the advantages and disadvantages. The history
of the Missouri testing movement is also explored. The characteristics of the assessments
being compared finish the chapter. In Chapter Three, the research questions are stated
and the sample examined. A discussion of multiple regression analysis and the reasons
this analysis suited this study is discussed. Chapter Four contains the results of the
analysis. Chapter Five includes the discussion of the results and suggestions for further
research.

23
CHAPTER TWO
REVIEW OF RELATED LITERATURE
Introduction
In order to understand the relationships that could exist between the Northwest
Evaluation Association’s (NWEA) Measures of Academic Progress (MAP) test with the
Missouri Assessment Project MAP test, the history of the Standards Movement and its
theoretical underpinnings were essential to review. The NWEA MAP test was a computer
adaptive test, chosen by some Missouri districts as an extra diagnostic test: The Missouri
MAP is a performance based test, required as Missouri’s state test. Amrein and Berliner
(2002) stated a philosophy of learning that agreed with Missouri’s. “The proper goal of
school learning was the transfer of learning, that is, the application or use of what was
learned in one domain or context to that of another domain or context” (p. 13). Although
very different in philosophy, both tests have their roots in the Standards Movement.
Vogler and Virtue (2007) proclaimed the Nation at Risk (1983) to have been the
catalyst for the standards movement and the high-stakes testing era. The standards
movement has had a lasting influence on education. The No Child Left Behind (NCLB)
legislation that followed 19 years after the Nation at Risk, was designed to further
“transform American schools from a culture of compliance to a culture of achievement
and results” (Vogler & Virtue, 2007, p. 55). However, the standards movement, high-
stakes testing, and NCLB have had their critics. It was important to look at the pros and
cons of high stakes testing considering the effects on student learning and on the teachers
themselves.

24
Many states have influenced the development of high-stakes testing and were
affected by the NCLB legislation. The early attempts at educational reform in Texas
proved to be the model for NCLB. But Texas was not the only state experimenting with
high-stakes testing and accountability. Kentucky, Maryland, North Carolina, Texas, New
York, and Florida were first generation reform states. All had experimented with some of
the components of NCLB.
A review of the Missouri standards movement and the state test development
demonstrated a state that was serious about raising standards and bringing those standards
to every school district in the state. Missouri concentrated on professional development at
the same time they developed standards and state assessment, disseminating as much
information as possible to teachers and administrators (“Missouri Assessment”, 2006).
But at the same time, there were problems with the test; those of timeliness and the
inability to track student growth. Missouri, as many other states (Van Horn, 2003), had
not been able to address these issues successfully.
Computer assisted testing in the form of the Northwest Evaluation Association’s
Measures of Academic Progress has been adopted by 2600 districts in the United States.
The test has swept from the Western states to the East. The NWEA MAP test promised
to fill the gap that the Missouri MAP leaves. The computer assisted test could produce
immediate results that appealed to students and teachers alike. The test promised to be
challenging to all students while producing achievement levels that were both norm
referenced and growth referenced. French (2003) concludes, “No single test should ever
be the sole determinant of a young adolescent’s academic future” (p. 20).

25
In this chapter, the history of both the high-stakes testing movement and of the
Missouri testing movement are explained, beginning with the advent of Sputnik in the
late 1950s and ending in the current year. Next, the advantages and disadvantages of
high-stakes test are discussed, with the comparison to computer-adaptive testing included
in the discussion. This chapter concludes with a comparison of the modalities of the
NWEA MAP and the MO MAP tests.
History of Standards Movement and High-Stakes Testing
In order to understand the current high-stakes testing under the No Child Left
Behind Act (2001), an examination of the history of the movement that produced was
appropriate. According to Amrein and Berliner (2002), the educational assessment
movement began with the 1957 launch of Sputnik. Journalists and politicians reasoned
that because the Russians won the race to space, there must be something wrong with
American schools. Schools began giving high priority to science. Achievement levels for
some American schools rose to an all-time high in the next ten years (Guthrie & Springer,
2004).
With the 1970s came another educational change. Politicians led a reform
movement for minimum competence testing in schools. States began to look at basic
skills testing to ensure that all students would learn to a minimum standard (Amrein &
Berliner, 2002b; Massell et al., 1997). But the 1980s brought the discarding of the
minimum competency test because those tests seemed to be promoting low standards or
the “dumbing down of content” (Amrein & Berliner, 2002b). A more lasting change also
began in 1970 with the beginning of the NAEP (National Assessment of Educational

26
Progress) which began national assessments of reading in 1971 and have administered
those assessments regularly ever since.
Even though public education was a constitutional responsibility of state
government, up unto the 1970s, the states had delegated this responsibility to the districts
within the states, especially in the areas of curriculum and instruction. The school district
turned over the responsibility to the teachers and textbook publishers. In this decade,
there were few district staff in charge of instruction (Massell et al., 1997; Walker, 1990).
As a result, teachers were independent and for the most part, set their own curriculum.
Teachers went in their rooms, shut their doors, and taught what they wanted to teach.
In 1983, the National Commission on Education published the report A Nation at
Risk. This report was written in an inspirational style and called for, among other things,
an increase in the rigor of the curriculum and standardized testing of students at regular
intervals in order for schools to provide remediation and enrichment. But the report was a
surprise to President Reagan. Reagan had campaigned for election with the degradation
of public education and the elimination of the cabinet position of Department of
Education as part of his platform. Even though Reagan required Secretary of Education,
Terrell Bell, to prepare a proposal to delete the office of Secretary of Education from the
cabinet, Bell also created a commission to praise American public education and charged
it with giving the President advice on education. But, not only did the commission dislike
Reagan’s agenda of “prayers, vouchers, and abolition of the department” (Guthrie &
Springer, 2004, p. 12), they also did not like Bell’s agenda of praise for the education
system in place.
27
The report they produced not only embraced public education, but declared it to
be a failure (Guthrie & Springer, 2004). The report recommended that school districts
should increase the time students spend at school and upgrade the textbooks being used.
Reagan called a press conference when he received the report, praising the commission
for endorsing vouchers, prayer, and the abolition of the department of education (Guthrie
& Springer, 2004). When the commission announced that the report had done no such
thing, the press jumped on the report. Four hundred copies of the report were requested in
the first 24 hours and in the first year, six million copies had been distributed all over the
world. The press saturated the news with articles and controversy stemming from the
report in the first years. Soon, all of America believed that American schools were failing
(Guthrie & Springer, 2004).
Groves (2002) called A Nation at Risk (1983) the beginning of the “excellence
movement”: Amrein and Berliner (2002) called it the “standards movement.” Whatever it
was called, states rallied to the cry and, within three years, 35 states had begun
comprehensive educational reform (Horn, 2003). In the years following the publishing of
A Nation at Risk, 49 of 50 states developed educational standards and policies to check
those standards (Amrein & Berliner, 2002b; Berube, 2004).
During the late 1980s, states’ policy makers began their first venture into
curriculum and design with three key reforms. The first reform was instituting
challenging academic standards for all students. This was named the First Change Wave
by Guthrie and Springer (2004). It included longer school days and years, more required
courses, especially in math and science. The rate of change was rapid within this time. On

28
the first anniversary of the NAR, three fourths of all states were considering reforms that
were recommended by NAR (Guthrie & Springer).
Alignment of testing, teacher certification, and the accountability programs to the
standards was the second wave which lasted from 1990-2000. Although standards-based
reform had been a priority with the National Governor’s Association since the 1980s,
funding was not available until the Goals 2000 Act of 1994 provided federal money to
support standards-based reform projects (Carpenter, 2001; McDermott, 2003). During the
1990s, all states began educational initiatives that formed educational standards and
challenged content (Goertz & Duffy, 2003). These reforms were characteristic of the
Clinton administration’s educational policies (Sloan & Kelly, 2003), although he also call
for the design of a single national test to be used in all states (Sloan & Kelly, 2003). In
1999, Florida adopted the A+ system, giving it authority to hold schools accountable for
student assessment (Guthrie & Springer, 2004).
The ball was set in motion as former President G. H. W. Bush met with the NGA
(National Governors Association) in 1989 to identify a common set of educational
standards for schools and set standards-based reform as a priority for states (McDermott,
2003). This first Educational Summit in Charlottesville, Virginia identified six national
educational goals that were later expanded to eight goals by Congress. Political leaders
from both parties met and reached consensus on the nation’s highest educational
priorities for the first time in the history of American education. Political discussions of
educational standards had been rare before the Charlottesville summit (NEGP, 1999).
The National Education Goals Panel was created in 1990 to monitor the progress of states
toward these educational goals (Joles, 2003). Then, in 1991, the National Education

29
Goals Report recommended that states be required to put a systematic assessment of
educational progress of students in place. The panel also suggested that there would be an
alignment between state assessment systems and academic state standards. The National
Education Goals had changed the way states judge the effectiveness of their education
systems because of their emphasis on results (NEGP). The year 1997 brought the
amendment to IDEA that included students with disabilities into statewide and district
wide assessments (Joles, 2003).
And, lastly, the third wave of change was the restructuring of state laws to make
districts and schools accountable for meeting the standards of the first reform. It was
characterized by the measurement of outcomes (Guthrie & Springer, 2004). The No Child
Left Behind Act was the beginning of this wave that continues today. NCLB was the
reauthorization of the 1965 Elementary and Secondary Education Act passed in 1965 by
President Johnson. These reforms were known as the standards-based systemic reform
(Massell et al., 1997).
Historically, education reform efforts have not had much staying power . . . Changes in educator’s priorities or in leadership at the national, state and local levels often signaled abrupt changes in the direction of education policy before the results of education reforms could be fully realized. (NEGP, 1999, p. 4)
This standards based reform had lasted 24 years and become entrenched within the
national, state, and local education systems. As it evolved, educators and politicians have
given it time to mature into good educational policy.
Texas was the first state to develop standards based reforms in the late 1980s with
North and South Carolina following close behind. The focus of the states’ reform was
curriculum alignment and capacity building. Capacity building was defined as improving
“the capacity of teachers and administrators to deliver better education” (Carnoy & Loeb,
30
2002, Standards based reform and the role of testing section, ¶ 5). The central message of
the reform efforts was a common set of academic standards for all students that measured
student performance and accountability that focused on outcomes (Goertz & Duffy,
2003). Large scale assessments became the norm for judging schools, teachers,
administrators, and students. There were differences in the way states approached reform.
Some states aggressively attacked reform measures and some had a more methodical
approach. In the end the states that aggressively attacked reform did not progress any
faster than those with the methodical approach, because they stirred up opposition
(Massell et al., 1997).
Lee (2006) explored the increased amount of inputs to schools after A Nation at
Risk (1983). At first, states thought they could increase student learning by mandating
longer school days, providing more advanced courses, and providing better qualified
teachers. However, when The National Education Goals (National Education Goals
Panel) were released in 1990, states began to develop more rigorous performance
standards. With this advent came the increase in the number of states to use student
assessment for accountability purposes. But these policies were intended to be added to
already existing educational efforts and were used because they were expected to cost
less than the previous reforms (Lee, 2006). The cost of assessment based accountability,
called output by Lee, was much lower that input policies such as controlling class size.
The tide had turned from input reform to outcomes in order to regulate schools (Lee,
2006).
Title 1 of the Improving America’s Schools Act (IASA) enacted in 1994 required
the development of high-quality assessments within the states, which were aligned to the

31
state standards. Funds from this act were used to pay for the standards based reform
efforts of various states (McDermott, 2003). These tests were to be given in one grade per
grade span. The purpose of these assessments was to track student achievement and
identify low performing schools.
In 2001, with the new amendment No Child Left Behind (NCLB), signed by
George W. Bush in 2002, more importance was given to state assessment. The new law
increased state testing to every child, every year in grades 3-8, and once in high school,
for reading and mathematics by the year 2005-2006 and testing in science once per grade
span by 2007-2008. The tests were required to align to state standards. “Adequate yearly
progress” of students and schools were tracked with the goal of all students meeting state
mandated proficient levels by 2013-2014 (Goertz & Duffy, 2003).
This infamous law expanded testing. The federal government committed money
for developing the assessments but the states were to absorb the administration and
scoring costs (Goertz & Duffy, 2003). NCLB took seriously that many schools were not
meeting the standards already identified by the states. The law included consequences for
schools that had “improvement status” for two years in a row. Those consequences
included the students’ right to attend another school at the district’s expense; students
within the district had the right to receive supplementary services at the school district’s
expense. At the fourth year of improvement status the school’s staff must be replaced,
converting the school to a charter school or takeover by the State Education Association
(McDermott, 2003). The schools, districts, administrators, and teachers began to feel the
pressure of accountability. This standards-based accountability system “shifted the focus

32
of accountability from education inputs to educational outcomes and from school districts
and students to schools” (Goertz & Duffy, 2003).
Public reporting was the most visible form of accountability. NCLB included
district reporting of school achievement on state tests. The IASA had included the three
levels of advanced, proficient, and below proficient. NCLB kept those three levels, but
renamed below proficient with basic. However, states were allowed to set where each of
these levels would fall and there was wide variance. But, under NCLB, schools must
show incremental and linear progress toward the goals that their state established. All
children must now be tested (Goertz & Duffy, 2003).
The History of State’s Involvement with NCLB
Before NCLB there were states who had already implemented standards reform in
schools. These states, called first generation states, were Kentucky, Maryland, North
Carolina, California, Texas, New York, and Florida. First generation states were in the
forefront in the discussion of high-stakes accountability prior to NCLB (Mintrop &
Trujillo, 2005). However, the NCLB Act seems to have been modeled on the reforms
being developed and carried out in Texas. Begun in 1990 by the Texas State
Commissioner, Texas reform was based on four principles: declaring of the curriculum,
assessment (measuring what is learned), reporting of results and school accountability,
and increasing student learning. The Texas reform movement was based on the idea that
every student deserves to be well-educated, focusing on improvement for each student.
Outcomes rather than inputs defined the effectiveness of school districts. Before this,
inputs, such as per pupil spending, indicated the quality of education. The Texas

33
education reform measured the quality of education by the output of students, assessment
(Nelson, McGhee, Meno, & Slater, 2007).
In 1994, the precursor to NCLB was passes, the Improving America’s Schools
Act (IASA). Its purpose was to encourage states to establish challenging content and
performance standards, measure student performance against those standards, make
school systems accountable for the learning of all students (Goertz, 2005). On the second
half of the decade many states moved toward standards-based reform, but states moved at
different rates with different ideas of reform (Goertz, 2005). Only 17 states fully compied
with IASA at the turn of the 21st century (Christie & Wanker, 2005). “As the Clinton
Administration was leaving office, it found fewer than half of the states in compliance
with the1994 changes in Title I, changes that nudged, rather than bludgeoned, the states
toward performance standards and measurements” (Lewis, 2002, p. 179). Even though
only a few had completely implemented IASA in 2000, 48 states had implemented state-
wide assessments in reading and mathematics. There were 29 states that administered a
mixture of norm-referenced and criterion-referenced tests; many included open-ended
questions with the multiple choice questions. Kentucky and Vermont were the only two
states that included portfolio assessments in their state assessments. Only Kentucky used
performance-based testing with high cognitive complexity. Public reporting as an
accountability mechanism was only used in 13 states in 2000 (Goertz & Duffy, 2003).
Accountability was also present in states’ education reform measures before
NCLB. Twenty eight states and the District of Columbia provided assistance to low
performing schools, 18 states offered rewards for improvement, only 20 states leveled
sanctions against low-performing schools (Goertz & Duffy, 2003). Sanctions in

34
California threatened principals and teachers with reassignment for low performance.
Schools could also be taken over by the state. Maryland also threatened schools with
takeover by the state. Texas’ regulations required public hearings, appointment of a on-
site monitor, and eventual closure. Sanctions in New York were the redesign of schools
or their closure. Kentucky and North Carolina threatened teachers with knowledge-
competency testing and dismissal. But sanctions were rarely imposed and faded over time
(Mintrop & Trujillo, 2005).
When the No Child Left Behind legislation passes Congress in 2001 and was
signed by President George W. Bush in January of 2002, “not even half the states came
close to meeting the mandate of testing every year in grades three through eight” (Lewis,
2002, p. 179) in reading and mathematics. All states needed to reach full compliance of
NCLB by 2013-4 (Mintrop & Trujillo, 2005). Christie and Wanker (2005) summarize
conflicting responses by those affected by NCLB.
Many people believe that NCLB embodies—and even elevates—America’s longstanding commitment to public education. Others view NCLB as well intended but far beyond the capacity of states, districts and schools to carry out. Still others see the law as a burdensome and unwarranted intrusion on state and local prerogatives and responsibilities. (p. 57)
The new demand created by NCLB, has caused panic in some states. Maryland
felt it could not comply with NCLB and still afford improvements to its performance-
based testing. So it dumped the performance-based testing and adopted a multiple-choice
test. “In the rush to meet NCLB deadlines, states are grabbing standardized tests off the
shelf—no matter where they meet their learning standards or not” (Lewis, 2002, p. 180).
The idea that states are being punished for high standards and as a result, Ohio and
Louisiana are among states that have lowered their standards (Lewis). Idaho and South

35
Dakota submitted requests to be allowed to use computer-adaptive tests for state testing.
The request was turned down by the U. S. Department of Education, but the department
approved computer-adaptive tests when they were aligned to state standards (Chirstie &
Walker, 2005). The NAEP project of nationwide testing is a way of checking that states
are maintaining appropriately high standards (Lewis).
Connecticut, Kentucky, New York, Oklahoma, and Pennsylvania were the only
states who had met or were on track to meet all 40 NCLB requirements, as of March,
2004. At the same time, all states were on track to meet one half of the requirements
(Christie & Wanker, 2005). All states have developed accountability policies of AYP,
but only half the states will use the AYP model (Goertz, 2005). At the current time, all
states are progressing at different rates and with different techniques to meet the
requirements of NCLB.
History of Missouri Assessment
Two years after the report A Nation at Risk (1983) was published, Missouri’s 83rd
General Assembly passed the Missouri Excellence in Education Act (MEEA). The
purpose of the MEEA was to expand opportunities to all students and to increase
“equality of outcomes” (Missouri Department of Elementary and Secondary Education,
1986). Section four of the MEEA included a list of Core Competencies and Key Skills.
These competencies and skills were a list of learner outcomes that were considered
important in subject areas. Groups of teachers, school administrators, and college
professors met to develop the competencies to ensure they were balanced and represented
the important outcomes to be learned in each subject. This was the first Missouri attempt
to identify and state clearly what students should be learning. Schools were expected to

36
align their curriculum so that they were teaching core competencies imbedded in their
lessons. No longer were teachers allowed complete freedom of curricular choice within
their classrooms. Promotion and retention policies were still left to local school districts
(Missouri Department of Education, 1986).
The assessment developed to go along with the Missouri Core Competencies and
Key Skills was the Missouri Mastery and Achievement Test. Grade 2 tested
reading/language arts and mathematics. Grades 3-10 tested reading/language arts,
mathematics, science and social studies/civics at every grade level. The assessment was a
battery of multiple choice tests, criterion referenced, and based on the core competencies.
Again professors, k-12 teachers, and curriculum consultants from DESE collaborated to
construct the tests in cooperation with the Center for Educational Assessment at the
University of Missouri-Columbia (CEA). The CEA had formerly worked with DESE to
produce earlier Missouri tests. The first tests were administered in 1987/1988. An annual
report was prepared for the Missouri General Assembly summarizing data for the
academic achievement of Missouri students and identifying general trends in test scores
(Osterlind, n. d.).
In 1993, Governor Mel Carnahan signed the Outstanding Schools Act which
called for a new assessment system for Missouri schools. The new assessment, to replace
MMAT, was to be primarily performance-based. An important outcome of assessment
reform was to change tests from multiple choice and fixed response tests to open-ended,
authentic learning tasks. (Massell et al., 1997) A performance-based test should measure
not only what the student knew, but how the student could apply that knowledge to a
problem-solving situation. The Missouri Assessment Project (MAP) was established to

37
provide professional development for teachers to develop the test, use, and score the test.
The MAP test, in conjunction with CTB/McGraw-Hill, was designed with 3 parts; a
constructed response part, a performance event, and a selected part. Tests were to be
developed by teachers and content specialists and would be aligned with content
standards also to be developed by teachers and content specialists. There was overlapping
in the time given for standards development and test development. The first tests were
given in1997. In order to meet the professional development requirement, MAP teams
were established in individual schools. State professional development specialists trained
key teachers in test development, test taking techniques, and new teaching methods.
Those key teachers, in turn, trained teachers within their districts. Two thirds of the
assessment was hand scored. Missouri teacher were involved with the scoring (“Missouri
Assessment,” 2006).
In January, 2002, President George W. Bush signed into law the No Child Left
Behind Act (NCLB) as an amendment to the reauthorization of the Elementary and
Secondary Schools Act of 1965. The goal of this act was for all public schools to
“achieve academic proficiency in basic skills—communication arts, mathematics, and
science—by 2013-2014” (Primont & Domazlicky, 2004, p. 3). This act was to bring
about changes to Missouri’s MAP program.
One change was that students would be tested every year, beginning in 2006, in
Mathematics and Language Arts instead of every three years. Buy the year 2008/2009,
the science test was to be in place. This test would have a three year rotation. Schools
must make adequate yearly progress (AYP) or face sanctions. The old MAP assessments

38
were revised and reworked. Since the test development was a continuing process, the
groups of teachers working on test development were just redirected.
Sanctions, as described by NCLB, would require that a district that did not meet
AYP in the second consecutive year must provide school choice and pay transportation
for any student wishing to transfer to another school. In the third consecutive year, the
school must provide supplemental educational services such as tutoring. And after four
consecutive years of students failing AYP, the school must replace staff and adopt new
curriculum (Primont & Domazlicky, 2004).
One of the big problems with NCLB has been that states have been able to set
their own levels of proficiency. Several of the states that have been touted to have great
gains in students reached proficiency, have had lower standards (Peterson & Hess, 2005,
2006). Missouri has never been acclaimed as a state that was making high gains in
proficiency. Missouri was in the middle of the pack in the race to proficiency (Lee,
2006). The Education Commission of the States, which met in Denver, ranked Missouri
as lower in readiness (Ritter & Lucas, 2003). But where Missouri has excelled was in its
standards matching the standards of the National Assessment of Educational Progress
(NAEP). NCLB required that states give the NAEP assessment to a sample of students in
fourth and eighth grades. These scores were compared with the scores on the state test to
see how closely they related. This comparison suggested how demanding the state
standards were. States were given grades as if they were in school. Missouri was one of
five states receiving an A on matching NAEP scores in 2003 (Peterson & Hess, 2005). In
2004, Missouri also received an A (Peterson & Hess, 2006). This does not mean that the

39
scores were extremely high; it means that Missouri scores matched scores on the national
assessment, NAEP. It seemed Missouri was on the right track.
Advantages of High-Stakes Testing
Although high-stakes assessment was not perfect, a variety of good things for
education have come from the high-stakes testing movement. A Nation at Risk (1983)
began the search in earnest for increased rigor in curriculum and accountability in the
form of testing and reporting. Its inspirational style touched educators and politicians
alike. The United States should be a leader in education as it had been in commerce and
war. The status of the United States as a world leader might slip if its educational status
were not reaffirmed.
NCLB aggressively tackled two of the recommendations of A Nation at Risk: high
performance standards for every student with high-stakes testing, and also highly
qualified teachers in every classroom (Lee, 2006). Raising student accountability and
learning was the purpose of the NCLB assessment regulations (Carnoy & Loeb, 2002).
Even with all of its detractors, Sloan and Kelly (2003) found that the majority of students
in a high-stakes testing situation worked harder and had higher gains in learning. “When
teachers saw that their students were succeeding, their expectations were raised,
providing fuel they needed on their uphill climb” (Goycochea, 1997, Fueling incentive
section, ¶ 3).
Most teachers had a positive attitude about their state standards. In a survey
conducted by the National Board on Educational Testing and Public Policy which sought
to determine the attitudes of teachers to the state mandated assessments, a majority of
teachers felt that their students would do well on the tests if they taught the state

40
standards (Abrams, Pedula, & Madaus, 2003). Shepard (2002) stated that if the test
covers the curriculum being taught, then there was no harm in teaching to the test.
When the Consortium for Policy Research in Education (CPRE) conducted a
survey of teachers and principals in a variety of states the findings were clearly positive
in regards to state standards and assessment. Teachers prized the feelings of
accomplishment when student learning increased and the appreciation from their peers
and principals. The content was narrowed but also broadened to include areas not being
covered in curriculum that aligned to state standards. Accountability in outcomes
required rethinking of the learning and teaching process, changing instruction. Some
schools were controlling the curriculum more than in the past (Elmore & Fuhrman,
2001).
Because of the accountability system and the fact that all students were required
to test, educators have been forced to pay more attention to a population of students that
may have been ignored before. Minorities, students with learning disabilities, English as
Second Language (ESL) students all were required to test. Schools had a renewed interest
in raising the achievement of this population (Gunzenhauser, 2003).
NAEP assessment of random schools in states provided a means of checking to
see that states were doing what they said they were doing. Carnoy and Loeb (2002)
reported that eighth grade NAEP scores had risen and attributed that rise to the external
pressure placed on schools. Carnoy and Loeb also found a “significant relationship
between proficiency and the strength of the accountability system for all racial ethnic
groups.” The test anxiety that students have showed may not have been be due to the high
stakes test itself. There could be a variety of causes for the anxiety including inadequate

41
instruction. “Thus, it was important that teachers and policy makers not blame the
thermometer but the fever” (Sloan & Kelly, 2003, p. 13).
Disadvantages to High-Stakes Testing
With a major educational emphasis on accountability in recent years, leading to
the high-stakes testing movement, came a volley of criticism also. No movement was
without criticism. Change brought feelings of insecurity and with that came scrutiny that
leads to criticism.
In the past, low-stakes testing has been conducted by schools for diagnostic
purposes. Districts and teachers would base teaching content and techniques on the
results of these diagnostic tests. The high-stakes testing conducted by states to meet
NCLB requirements have not been for diagnostic purposes (Amrein & Berliner, 2002b).
These tests were given at the end of the school year and results were not available until
into the next school year. A year’s teaching strategy could not be based on testing from
the year before. Too few questions on each topic were given to be of any diagnostic use
(Amrein & Berlin, 2002; Sloan & Kelly, 2003). Because the test was typically given a
month before the end of the year, the school year was virtually shortened by that month.
Students were aware that the curriculum taught after testing was not as important as that
taught before testing (Kuhm, 2007), so the learning year basically ended with the testing.
Teachers’ opinions of high-stakes testing have often been negative. “Increasing
the rigor and number of tests their students must pass does little to help teachers become
more effective” (Callahan & Spalding, 2006, p. 337). Anxious to succeed with the tests,
teachers narrowed the curriculum in order to cover the tested curriculum more thoroughly
(Groves, 2002). Time spent on instruction in tested areas increased a great deal, with less

42
time on non-tested content (Abrams et al., 2003). Feeling pressured to match classroom
activities to tested curriculum, for teachers “the test becomes a teacher’s filter for making
instructional decisions. . . . even though they may know other materials will better
prepare students for success in the world” (Steeves, Hodgson, & Peterson, 2002, p. 231).
Non-tested curricula were ignored in favor of tested curricula from September to March
(Abrams et al., 2003; Shepard, 2002).
High-stakes testing had not encouraged conceptual understanding among students
(Shepard, 2002). Constructivist teaching which had always been suggested to encourage
higher order thinking had been pushed aside to make room for testing practice (Berube,
2004; Firestone, Fitz, & Broadfoot, 1999). “Training rather than learning or general
education is taking place in communities that rely on high-stakes testing to reform their
schools” (Amrein & Berliner, 2002b, p. 12). Training for taking high-stakes tests had
become common in classrooms, narrowing the curriculum. As teachers have become
obsessed with test preparation, “tests have not only changed the function of schools, but
they have become the focal point for schools” (Baines & Stanley, 2004, p. 3). Test
preparation strategies may have increased test scores, but not increased actual
achievement (Abrams et al., 2003).
Low teacher morale has been common fallout of teaching to the test. Abrams et
al. (2003) reported on a survey conducted by the National Board on Education Testing
and Public Policy. The survey was to determine teacher attitudes and opinions about
state-mandated programs. Low teacher morale resulted from situations where pressure
was applied to teachers by administrators. “Highly consequential testing policies can
contribute to low morale, increased frustration, and restricted curricular options” (Abrams

43
et al., p. 24). The reason for this low morale was found in an explanation by Baines and
Stanley (2004):
Indeed, no professionals were held accountable in the same simplistic manner as teachers. Lawyers were not held accountable when their clients were sent to prison. Doctors say with resigned regularity that the operation was a success but the patient died anyway. If a patient smoked three packs of cigarettes a day and worked in an asbestos-filled environment, no one would blame the doctor if he couldn’t miraculously cure a case of lung cancer. Yet, such bogus accountability was imposed on teachers with regularity. If an emotionally disturbed, learning disabled child lives with a homeless crack addict and ends up missing 40% of the school year, the teacher still was culpable for that student’s performance on the standardized exam. With the new accountability system, having mainstreamed, learning disabled and emotionally disturbed students in a classroom can be detrimental for teachers who must post impressive gains in achievement. Testing allows public officials to pretend that nothing external to the classroom influences student behavior. (p. 4)
Students also experienced low morale when it came to testing time. The current
trend to motivate students with pep rallies, test-taking techniques, attendance prizes, and
prizes for good scores could backfire. Joles (2003) found that financial and academic
incentives were thought to produce positive motivation, “but in reality the students
encountered despair when faced with such performance pressure” (p. 88). And if just the
pressure of test-taking was not enough, when the results come and students who have
tried have failed, despair could turn into low self-esteem which could translate to more
serious problems: test-taking anxiety, absenteeism, dropping out of school (Joles, 2003).
For low performing children, a label of low ability can adhere for a lifetime and negatively impact their confidence in their learning ability. The fact that a state or federal government can aggregate a child’s score with others and denounce an entire school as a failure provides little service to either the child or the school. (Sloane & Kelly, 2003, p. 3)
Minorities and low socio-economic groups had not been served by high-stakes
testing. Although NCLB was specifically written to address the children who fall through
the cracks and go unnoticed, many felt that the purpose had not been accomplished

44
(Ballou, 2002; Groves, 2002; Goychochea, 1997; Lee, 2006). The first problem was that
socioeconomic groups had often been ignored in reporting data (Groves, 2002). Ballou
(2002) stated that if teachers who ranked in the top 10% of scores were disaggregated by
socioeconomic group, 1/3 of them no longer belonged in the top 10%. In low scoring
schools with poor families and minorities, curriculum was narrowed in order to practice
for tests, reducing the scope of knowledge of their white, middle class peers (Groves,
2002). The underfunded mandates of the NCLB had caused the shortchanging of poor
districts who were expected to meet the same standards as wealthier districts, but who
were starting at a lower level because less wealth had provided fewer highly qualified
teachers, lower student proficiency standards, less educated parents, and fewer classroom
materials (Ballou, 2002; Lee, 2006).
The cultures of the individual school and the school district had been changed by
high-stakes testing: the focus of the school environment shifting from student learning to
performance on the tests (Baines & Stanley, 2004; Steeves et al., 2002). Simply speaking,
the culture of an organization had been expressed in “shared values, shared beliefs,
shared meaning, shared understanding, and shared sense” (Morgan, 1997, p. 138). But
Morgan also elaborated saying the “nature of culture was found in its shared social
norms” (p. 139). A culture could adapt and change (Bolman & Deal, 1997), but to be
considered valid, “it must be taught to new members as the correct way to perceive,
think, and feel” in relation to solving problems (Schein, 1992).
Culture was made up of three areas; formal practices, traditions, and the informal
curriculum. This last area, informal curriculum provided the rules that govern the day-to
day running of the school and define the behaviors and attitudes of teachers and students

45
(Johnson, Dupius, Musial, Hall, & Gollnick, 1996). Schools have replaced the school’s
traditional curriculum with emphasis on preparation for testing. This emphasis causes
both the formal and the informal curriculum to change by stressing the training for taking
high-stakes tests. In-service classes for teachers on test-taking strategies, alignment of
curricula with content covered on the test, and writing good paragraphs have replaced
common in-service themes such as discipline and classroom management. Pep rallies to
boost students’ attitudes for testing, as well as monetary and academic rewards for
students, have changed the atmosphere of the school, both before testing and all year.
Attitudes of teachers and students had shifted: New and old teachers were taught the new
rules of the culture.
Gunzenhauser (2003) connected the current high-stakes testing with the
behaviorist/positivist movement in psychology. In this movement, which emerged from
the physics/mathematics fields, all observable behavior could be explained by
investigation and data, and that sense perception was the only basis of knowledge
(Roediger, 2004; Strauss, n. d.). The theory “builds from a philosophy of reality and the
ability of science to perceive that reality” (Gunzenhauser, p. 54). From these theories had
come the idea of collected data driving the curriculum. The only way to know what a
student knows was by collecting data in the form of testing. The behaviorist philosophy
of educational improvement supported the expansion of testing accountability. On the
positive side, when accountability was attached to the results of assessment, better
teaching and higher student achievement resulted because there was a direct relationship
between the level of stakes attached and the preparation time spent by teachers and
students (Vogler & Virtue, 2007). On the other hand, Gunzenhauser (2003) asserted that
46
the behaviorist/positivist theory of education had caused a default philosophy of
education within our schools. “Tests were designed to be part of a system of
accountability, drive the curriculum, limit instructional motivation, and keep educators
from establishing their own priorities and visions” (Gunzenhauser, p. 53). This
philosophy not only valued what can be measured, but also values the measurement
itself. The default philosophy resulted in “curriculum distortion” in an effort to improve
test scores (Amrein & Berliner, 2002b; Gunzenhauser, 2003; Shepard, 2002). Teachers
may be forced to use methods that were not part of their vision, such as: drill and practice
for the test and elimination of parts of the curriculum that were not tested
(Gunzenhauser). The focus of education had shifted from student learning to the high-
stakes test itself.
As a result, high-stakes testing has had a negative impact on instruction within the
classroom (Callahan & Spalding, 2006). Because of the regulatory effect of the high-
stakes test on the curriculum taught within classrooms, creating challenging, stimulating
courses has been impeded. Collaborative teams of teachers engaged in problem-solving
have been stymied (French, 2003). Schools have replaced energetic pedagogy with test
practice (Groves, 2002). “With high stakes tests . . .student learning was indeterminate,
remains at the same level it was before the policy was implemented, or actually goes
down when high-stakes testing policies were implemented” (Amrein & Berliner, 2002,
p. 2). French (2003) stated that between 50% and 80% of gains made in yearly test scores
were temporary and resulted from changes that had nothing to do with increased student
learning. Sloan and Kelly (2003) concluded that “accountability by itself was unlikely to
lead to deep, or long-term, changes in teaching or student learning” (p. 16).

47
High-stakes testing has had the opposite effect that it intended, demoralizing
teachers and students, and stifling the creativity of the classroom. Teachers are working
harder and spending more time to meet goals set for them by districts, states, the nation.
But their added effort is not improving what is happening in their classrooms
(Gunzenhauser, 2003; Sloan & Kelly, 2003).
Computer Adaptive Testing
As high-stakes testing had become the norm in 49 of 50 states in the United States
of America for at least 10 years (Berube, 2004), teachers had become accustomed to
administering the test, analyzing test data, as well as teaching so that their students would
show achievement gains on the test. Familiarity bred contempt. Teachers had several
valid complaints about NCLB mandated testing. For instance, when the Assessment and
Accountability Commission of the Idaho Department of Education conducted a survey
among Idaho teachers, the biggest complaint was that state tests and the Annual Yearly
Reports of NCLB “did not measure, report, or track student growth; i.e. they didn’t
provide much insight into how teachers could modify the curriculum to improve
learning” (Woodfield, 2003, p. 34). Leftkowitz and Miller (2006) reported that parents
were interested in the progress of their children at school, not in how their children
compared to last year’s group of students.
In most states, state testing was done in the spring of each year with reporting of
scores in the following fall or testing was in mid-October with results not in until
January. In each case the timeliness of the data was called into question. In the first case,
the data was a year behind (Stokes, 2005) and in the second case, not only did the test
data not indicate what the student had learned that year, the results did not come in until

48
after the year was half over. A lot of wasted time had gone under the bridge (Woodfield,
2003).
Online testing with computer adaptive tests seemed to offer a solution not only to
the complaint of timeliness, but online testing promised to assess students with fewer
items and less time for the test-taking (Wall, Baker, & Sampson, 2004). Less time for
test-taking can increase the time available for student learning. Computer adaptive testing
was based on student growth rather than actual achievement (Ballou, 2002).
The Northwest Evaluation Association (NWEA) designed a number of tests
including the computer adaptive test called Measures of Academic Progress (MAP). The
NWEA was a non-profit assessment organization based in Portland, Oregon. This
organization had worked with school districts nationally for 25 years. A need for
computer adaptive or value-added tests had developed because of teacher discontent with
the state mandated tests. State mandated tests do not measure or track student growth or
provide information on how teachers could increase student learning (Woodfield, 2003).
Districts have been using computer adaptive tests for several years. Examples were the
STAR Reading and STAR Math tests and the Advantage STAR Early Literacy tests (Van
Horn, 2003).
There were four primary differences in the Missouri MAP and the NWEA MAP.
First, NWEA MAP provided, appropriately challenging questions for 97%-99% of
students. The NWEA assessment provided questions that were both lower and higher
than grade level, adjusting to keep the student appropriately challenged (Olson, 2002).
Missouri MAP provided grade level questions only. The second difference and one of the
most demanded differences in Missouri MAP and the NWEA MAP was that the latter

49
can track an individual student’s growth from year to year. After all, teachers wanted to
know not only if their students were at grade level, but also if they had learned anything
since the last time tested. To understand if students had learned, the measurement of
student growth was imperative. Districts could also benefit from observing value-added
gains from year to year, because the district could be re-energized if teachers were
recognized for the gains their classes had made (Goycochea, 1997). The achievement
level could be referenced to what was being taught in the classroom and state and
national standards (Woodfield, 2003). Being able to compare and analyze data collected
from a broad spectrum of data (Woodfield) was the third difference. The fourth
difference was that the NWEA test engaged the stakeholders in the education process
with scores available in a timely manner for diagnostic and evaluation purposes
(Woodfield). This data could be used be used by school districts to group students for
instructional purposes, plan student-led conferences, evolve curricular programs to meet
the needs of specific classes, and assess student learning (Stokes, 2005).
The educational differences the NWEA MAP test had provided first was overall
achievement score for all students. NWEA provided the district with a downloadable test
battery housed on the server and the district decided how many times a year it will use
the test. When testing, the computer adjusted items given based on the items that the
student has answered correctly. Students were started at an average level and the level of
questioning moved up or down according the way the last questions were answered. The
computer finally found the ability level of the student (Stokes, 2005). NWEA offered
immediate individual scores and reported on class data within 72 hours (Woodfield,
2003).The test provided curriculum referenced data, plus aligned and measured standards
50
(Montague, 2000). NWEA MAP items were referenced to the Rasch scale (RIT) which
was an equal interval scale named for the founder, Danish statistician Georg Rasch. The
scale values were built on inferences made from the responses of those taking the test. Its
intervals had been compared to those intervals on which a ruler was based; they were
equally spaced. The measurement never changes (Woodfield, 2003). NWEA MAP
assessments have aligned student achievement levels with item difficulty levels. Because
the RIT units were static, they could reliably indicate growth over time (NWEA, n. d.).
When taking the NWEA MAP test, at first students were presented with a variety
of questions with different RITs taken from a test bank of 1500 questions (Van Horn,
2003). Because of student answers, the computer gave the student other questions,
determining a RIT level on the basis of correctly answered questions. NWEA MAP
created a differentiated test for each test taker (Stokes, 2005). When the computer had
collected enough data to report the student’s ability level, the test was over (NWEA, n.
d.) The benefits of RIT scores were their independence from the grade level, equal
interval with a wide range of scores available, and stability (NWEA).
Of course there were drawbacks to the NWEA MAP test. Olson (2002) concluded
the biggest drawback to CAT testing was that students cannot return to questions they
have already answered. So, if a student changed his/her mind, they could not make a
change in his/her answer. Olson also mentioned that not all students were comfortable on
a computer. This method of testing was biased towards those with the most computer
experience. With bias toward students with computers in their homes and schools, this
was not a fair test.

51
Dangers in using CAT testing to hold teachers accountable were also evident.
Ballou (2002) states two reasons what CAT should not be used for teacher evaluation.
There was a lot of statistical noise which statisticians tried to eliminate, resulting in the
raw data not coinciding with the measured performance. Evaluation of a teacher’s ability
from NWEA required data from several years. Often the evaluation had been made too
quickly on one year’s data. Summers (2002) noted that “teachers and schools may be
wrongfully rewarded or punished because value-added testing either over or under
estimates their students’ learning gains” (p. 2).
The revolutionary ideas of computer-adaptive testing have formed from the
convergence of two revolutionary ideas in education: high-stakes testing and the reform
movement, and the continuing increase of technological capability in schools (Wall,
Baker, & Sampson, 2004). The benefits of computer adaptive testing were the timeliness
in reporting and the measurement of student growth. While the disadvantages were that
the easy evaluation may not always be valid, problems with statistical noise on the test,
and students may not be comfortable with computer testing.
Summary
Amrein and Berliner (2002) declared that the United States had tested its children
more than any other industrialized nation for more than 30 years. If testing raised
achievement, why were American students not testing highest of all students in the
world? Will adding one more test to the state mandated test produce better international
results for American students?
Missouri students are required to take the Missouri MAP. Students, teachers,
schools, districts were all judged by this assessment. These are the conditions that made a
52
test “high-stakes” (Joles, 2003). With the curriculum of schools narrowing to focus on the
assessed standards and broadening to include standards formerly not covered in
curriculum, schools had no time for extraneous methods that do not meet curricular needs
set out in Missouri’s state standards. The NWEA MAP test promised to meet many of the
shortfalls of the Missouri MAP: timeliness of reporting, scores based upon a RIT scale,
relief of the boredom of testing because each student’s test was personalized, and
subscores to be used as a diagnostic tool. Could it be used along side of the Missouri
MAP to increase student learning and thus affect scores?
Comparing the MO MAP test with the NWEA MAP test with a multiple
regression analysis can provide information as to the predictor value of the NWEA MAP
on the MO MAP. Since the high-stakes movement has focused schools, districts, and
states on student learning, all efforts must be turned to that end. Assuming student
learning increases as achievement on the MO MAP test increases, the researcher wanted
to know which RIT scores of the NWEA MAP would act as predictors for the
Comunication Arts and Mathematics portions of the MO MAP assessment. The
remainder of the study is organized into: Chapter 3—Research Design and Methodology,
Chapter 4—Results of Analysis, and Chapter 5—A Discussion of the Results.

53
CHAPTER THREE
RESEARCH DESIGN AND METHODOLOGY
Introduction
This chapter contains the plan for simple and multiple regression analysis on data
from two tests. Those tests were the state mandated Missouri’s Missouri Assessment
Program (MO MAP) test, given in the spring of each year and the Northwest Evaluation
Association’s Measure of Academic Progress (NWEA MAP) test. NWEA MAP was an
extra test that could be bought to help a school district reach greater success on the first
test. The population chosen to study was the sixth, seventh, and eighth grade classes from
a rural middle school in Missouri that has been administering NWEA MAP as an added
test for three years. The study included scores for all three years.
Simple and multiple regression analysis allowed the researcher to look for
variables that predict success on the dependent variable. The two dependent variables
(criterion variables) were taken from the results of the MO MAP test and the independent
variables (predictor variables) were subscores taken from the NWEA MAP test. This
study was undertaken to discover if there were predictors in the NWEA MAP test that
envisage success on the MO MAP test.
Research Questions
Within the context of this study, the following research questions were addressed:
1. How well do RIT scores on the mathematics test of the NWEA MAP test
predict scores on the Missouri MAP mathematics test?

54
a. How well do RIT scores on the number and operations portion of the
mathematics test of the NWEA MAP test predict scores on the
Missouri MAP mathematics test?
b. How well do RIT scores on the algebraic relationships portion of the
mathematics test of the NWEA MAP test predict scores on the
Missouri MAP mathematics test?
c. How well do RIT scores on the geometric relationships of the
mathematics test of the NWEA MAP test predict scores on the
Missouri MAP mathematics test?
d. How well do RIT scores on the measurement section of the
mathematics test of the NWEA MAP test predict scores on the
Missouri MAP mathematics test?
e. How well do RIT scores on the data and probability section of the
mathematics test of the NWEA MAP test predict scores on the
Missouri MAP mathematics test?
f. Which RIT scores on the mathematics test of the NWEA MAP are the
best predictors of the Missouri MAP mathematics test?
2. How well do RIT scores on the NWEA MAP reading test predict scores on
the Missouri MAP language arts test?
a. How well do RIT scores on the skills for reading process section of the
reading test of the NWEA MAP test predict scores on the Missouri
MAP language arts test?

55
b. How well do RIT scores on the strategies for reading process section
on the reading test of the NWEA MAP reading test predict scores on
the Missouri MAP language arts test?
c. How well do RIT scores on the comprehend/analyze literature section
of the reading test of the NWEA MAP test predict scores on the
Missouri MAP language arts test?
d. How well do RIT scores on the comprehend/analyze nonfiction section
of the reading test of NWEA MAP test predict scores on the Missouri
MAP language arts test?
e. Which RIT scores on the reading test of the NWEA MAP test are the
best predictors of the Missouri MAP language arts test?
3. How well do RIT scores of the language usage test of the NWEA MAP test
predict scores on the Missouri MAP language arts test?
a. How well do RIT scores of the apply writing process section of the
language usage test of the NWEA MAP test predict scores on the
Missouri MAP language arts test?
b. How well do RIT scores of the capitalization and punctuation section
of the language usage test of the NWEA MAP test predict scores on
the Missouri MAP language arts test?
c. How well do RIT scores of the parts of speech/spelling/sentence
structure section of the reading test of the NWEA MAP test predict
scores on the Missouri MAP language arts test?

56
d. How well do RIT scores on the forms and types of writing section of
the reading test of the NWEA MAP test predict scores on the Missouri
MAP language arts test?
e. Which RIT scores on the reading test of the NWEA MAP test are the
best predictors of the Missouri MAP language arts test?
Population and Sample
Population
The population chosen was a three grade range of students over a period of three
years. The grades considered were the sixth, seventh, and eighth grades of one rural
district in Missouri. Missouri MAP was administered yearly to every grade 3-8 in
mathematics and language arts, then once again in high school. NWEA MAP was given
in the fall and spring every year for all grades, in mathematics, reading, and language
usage. There were subscores in each of the three categories of the NWEA MAP test.
Only students who were present for both Missouri MAP and NWEA MAP in a single
year were considered.
It has been well documented that Middle School has been an age of transition
where student self-esteem and achievement levels often lower (Akos, & Galassi, 2004;
Alspaugh, 1998; Eccles, Wigfield, Midgley, Reuman, Mac Iver, & Feldlaufer, 1993;
Harter, 1981; Seidman, Allen, Aber, Mitchell, & Feinman, 1994). There has been a
myriad of studies concerning this drop of achievement and the causes. Although the
researcher was not looking for the cause of this drop, it was interesting to look at the
characteristics of middle school transition drop. In Missouri, nearly 70% of eighth

57
graders performed below proficient on NAEP tests conducted on the national level
annually (NAEP, 2005). The levels of reading proficiency in Missouri have shown no
significant improvement over the years until the present (NAEP, 2007). Mathematics at
the eighth grade level has shown slight improvement over the last three years (NAEP,
2007). Lenters (2006) reported an actual decline in reading improvement for older
adolescent students; while Eccles et al. found early adolescent years the beginning “of a
downward spiral in school-related behaviors and motivation that often led to academic
failure and dropping out of school” (1993, p. 554). Eccles et al. emphasized the biggest
change in motivation occurred between sixth and eighth grades. Both student self-esteem
and fondness of math was lowest in the seventh grade, especially for girls (Alspaugh,
1998; Eccles et al., 1993). Both GPA and math achievement scores declined with the
transition to seventh grade.
There has been controversy regarding the cause of the achievement and self
esteem drop, but those were not the concern of this study. The documented achievement
drop has been a cause for concern for schools, teachers, and parents. The methods used to
cope with this drop were up to the individual schools and teachers. Neither the MO MAP
test nor the NWEA MAP test was a teaching method to help with the drop, but they can
record the success of the techniques being used to address the achievement/self-esteem
drop. Since they were very different types of tests, it was important to find if there were
predictors on the NWEA MAP for student success on the MO MAP since the MO MAP
was the evidence of school success with student achievement that was used by the state
of Missouri and NCLB. Any help for diagnosis of learning and comprehension problems

58
would be helpful to teachers and administration coping with these drops in self-esteem
and consequently achievement levels.
The district’s MAP scores, compared to other Missouri school districts, showed
the scores in reading and mathematics were at the state average with a little improvement
in either reading or mathematics within the last few years. The NAEP assessment was a
national assessment given annually to 35,000 students nationwide. States are tested
biannually: Half of the states are tested each year. State scores on the NAEP assessment
to a sample of 3,000 students in all grade levels in MO have remained fairly stable at
average levels with students nationally (NAEP, 2005; NCES, 1999, 2005). In 2007,
Missouri reported that eighth graders made significant gains on NAEP testing in 2007,
but stayed the same in reading (Missouri Department of Elementary and Secondary
Education, 2007).
Sample
For a multiple regression analysis, it was important to have a large sample
population to study. In the rural school chosen for our sample, there were approximately
150 students per grade. The study used three grades for the sample; grades six, seven, and
eight, over a three year period; 2004-2005, 2005-2006, 2006-2007. This provided a
sample of approximately 1250 for the study. Bartlett, Kotrlik, and Higgins (2001)
recommended that the ratio of observations to independent variables should not drop
below 5:1, where 5 was sample size and 1 was the independent variable. Bartlett et al.
also suggested a more conservative ratio would be 10:1. Garson (2007) recommended
using the formula N >= 100 + m, where m = the number of independent variables.
Another suggestion Garson made was using the ratio of 20:1. Using a 10:1 ratio would

59
require a sample size (N) to be 160; 20:1 would be a sample size of 320. A p
(predictability) value of .05 was “significantly different from 0,” but a p value of .01 was
“highly significant” (Allison, 1999). For this study a p value of .01 was used. The sample
of 1250 was ample for the regression study, as the sample size would be larger than any
source recommended. Several sources stated that the larger N the better, with bigger
sample giving more precise estimates of p (Allison, 1999; Bartlett et al., 2001; Garson,
2007). There could be a problem if sample size reached 10,000 the analysis can become
so sensitive that it finds forced, faux relationships masquerading as true relationships
(Allison, 1999).
This was a convenience nonrandom sample of one rural, medium sized school
district in Missouri to be generalized to all Missouri school districts. The school district
was chosen because the Superintendent of the district asked the researcher to conduct this
analysis with data from her district. The Superintendent’s question was to find out if the
NWEA MAP test provided a useful purpose in the district’s testing plan. The target
population would be all sixth, seventh, and eighth graders in the State of Missouri: The
accessible population was the sixth, seventh, and eighth graders at the chosen, rural,
Missouri school district.
The school district chosen for the study was an accredited school district with an
average enrollment of 2120. The attendance rate for the 2006/2007 school year was
93.3% and the free/reduced lunch rate was 41.8%. Graduation rate was 91.67%, well
above the graduation rate for the state of Missouri. Teachers with regular teaching
certificates in their field were 96.5% with an average of 12.6 years of experience. The
middle school in the study has an attendance rate of 92.4% with a free/reduced lunch rate

60
of 52.1%. The MO MAP scores for grades 6, 7, 8 were slightly above state standards.
(Missouri Department of Elementary and Secondary Education, 2007).
Data Collection and Instrumentation
The data was collected from the school district chosen for analysis. After the
superintendent of the district wrote a letter of permission to use data, and the IRB process
was procured, the Curriculum Director of the district prepared the data from MO MAP
for the required years and grades. An access number was granted to the researcher to
obtain access to the data from the NWEA site. The data was entered into the SPSS data
analysis program.
The instruments used for comparison were the Missouri Assessment Program’s
MAP assessment (MO MAP) and the Northwest Evaluation Association’s Measures of
Academic Progress (NWEA MAP).
Missouri Assessment Program (MAP)
Missouri’s MAP was a performance based assessment based on three types of
questions: multiple choice, open-ended response, and performance event. In
communication arts the test was given in grades 3-8 and 11. The mathematics assessment
was given in grades 3-8 and 10. This study will use data from grades 6-8 over a three
year period, 2005-2005, 2005-2006, and 2006-2007. This assessment was developed by
the Missouri Department of Elementary and Secondary Education (DESE) during the
1990s and was adapted to meet NCLB requirements between the years 2001-2008. The
MO MAP was a state required assessment for all students. The tests within the MO MAP
assessment that were used for analysis were the communication arts test and the
mathematics test.

61
The time required to take the MO MAP is much greater than the time required for
the NWEA MAP. For the MO MAP, the test is divided into three or four sessions with
each session given on a separate day. For the Communication Arts test, session one and
three are allotted between 45 and 65 minutes. But these times are approximations, and
any student who is making an effort to answer and is not finished is this time is allowed
to finish without a break. Session two is a timed test consisting of two 26 minute tests. In
seventh grade, there is a fourth session that has an estimated time of 60-90 minutes.
Mathematics has a similar time span with two sessions given an approximate time of 40-
45 minutes, extension as needed, and a timed session of 40 minutes. Eighth grade has an
extra session of approximately 50-70 minutes with extension if needed (DESE, 2007).
The time allowed for each of the three sessions in the NWEA tests is
approximately 45 minutes. Each student’s time will be different because as soon as the
computer bank has determined the students RIT level, the test is over for the student. The
actual time needed, however, is governed by the number of computers available for
student testing at one time (NWEA, 2003).
Wiersma (2000) described validity as “the extent to which the instrument
measures what it was designed to measure” (p. 300). Wiersma also listed three types of
evidence for establishing validity: content-related evidence, criterion-related evidence,
and construct-related evidence.
When searching for content-related evidence of validity, the reasons for the
questions that have been chosen for the test must be examined. CTB/McGraw Hill (2006)
states that content validity is “demonstrated through consistent adherence to test
blueprints, through a high quality test development process that includes review of items

62
for accessibility to students with English Language Learners and student with disabilities,
and through alignment studies performed by independent groups” (p. 6). Early design of
test development considered item maps showing the distribution of item/tasks by Content
Standards. Missouri teachers wrote test questions, CTB/McGraw Hill chose questions for
the actual test, Missouri teachers reviewed test, test was piloted, and finally a score and
rewrite workshop was held for Missouri teachers to revise questions and set point levels.
Next a Content and Bias Review was conducted. Missouri educators participated at every
level of development (CTB/McGraw Hill, 2006).
The time allowed for the MO MAP test was considerable. The MO MAP
consisted of two tests, with 3-4 sections each. The sections were to be administered on
different days. All but one section was open ended: Allotted time was approximately 45
minutes but was required to be extended if a student was still working. One section was
timed and divided into two 26 minute sections. The MO MAP often takes two weeks to
test, a week for each test.
Criterion-related evidence was found in the comparison with an external criterion.
The criterion that was used for this research was the NAEP test. Missouri’s score of A for
two years in a row, 2003 and 2004, indicates the test was valid (CTB/McGraw/Hill,
2006).
Construct-related evidence for validity was found in the setting of achievement
levels that “reflect the expectations of Missouri educators and citizens” (CTB/McGraw
Hill, 2006, p. 4). Wiersma (2000) stated that construct validity could be found in logical
and empirical analyses. After operational testing, Missouri educators and community
members, along with CTB/McGraw Hill developed achievement levels that would

63
determine which level, Below Basic, Basic, Proficient, or Advanced, students would
reach. These levels were based on comparisons early on with the State Standards and
later on with the Grade Level Expectations that were an evolution of the State Standards
(CTB/McGraw Hill, 2006).
The reliability of the assessment instrument was about the consistency of the
assessment and the replicability of the results. In order to see the reliability of the MO
MAP the results from another assessment, the National Assessment of Educational
Progress (NAEP), was examined. The NAEP was taken by to 350,000 students
nationwide, annually. Each year half of the states were tested. NAEP tested 3000 students
in Missouri in 2005 and 2007. The results of MO MAP tests and the NAEP were then
compared, looking for correlations in the results. When the results from the MO MAP
and the NAEP assessments were compared, the percentage of students receiving
proficiency on each test was compared. If the percentages were the same, then the MAP
test was as demanding as the NAEP. In both 2003 and 2004, MAP scores were very close
to NAEP scores. Peterson and Hess (2005, 2006) rate Missouri as one of six states with
an A rating on the comparison.
Northwest Evaluation Association’s Measures of Academic Progress (MAP)
The NWEA MAP is a computer adaptive test, or sometimes called a value-added
test, designed to measure general knowledge in language arts, reading, and mathematics.
Because the tests were given and scored on the computer, they could be given up to four
times a year and could be used to measure academic growth over time of an individual
student. Students were scored with a Rasch Interval Scale (RIT), a scaled score whose
numbers always means the same thing if a student were in 3rd grade or eighth grade.

64
Students were given a question and according to the answer, the computer program chose
the next question. The computer program continued to choose questions until a level was
reached where the student was answering most questions correctly. The level of those last
questions determines the RIT score.
Three tests of the NWEA MAP are used by this Missouri school district: reading,
language usage, and mathematics. Each test had several subscales. Reading was divided
into skills for reading process, strategies for reading process, comprehend/analyze
literature, and comprehend/analyze non-fiction. Language usage was divided into apply
the writing process, capitalization and punctuation, speech/spelling/sentence structure,
and forms and types of writing. Mathematics contained algebraic relationships, geometric
relationships, and measurement data and probability.
The NWEA MAP took about three 45 minute session; one session for each
section of the test, reading, language arts, and mathematics. The constraints on time for
this assessment were in the amount of computers a school could access for student
testing.
Validity of the NWEA MAP, as presented by NWEA itself, was based on
concurrent validity, a type of criterion-related validity. NWEA looked at how well scores
on the MAP compared with scores on other established tests. A Pearson correlation
coefficient (r) was used to calculate concurrent validity. The perfect correlation would be
1.00, while .80 was considered to be acceptable (NWEA, 2005). When compared with
the Stanford Achievement Test, r = .82-.83 in grades 6-8. The Iowa Tests of Basic Skills
correlation was .79 in seventh grade. Compared with several state assessments, the

65
correlation was between 0.70 and 0.86. Missouri was not one of the states for which there
was a correlation (NWEA).
The reliability for this test was calculated in two ways: test-retest reliability and
marginal reliability. The test was given twice to the same students over a 7-12 month
period. Although it was the same test, the questions on the test were different, since the
computer chose from a bank of questions. For grades 6, 7, 8 the Pearson coefficient was
between .83 and .94. The marginal reliability coefficient was a measurement of internal
reliability and was measured by calculating the measurement error at different points in
the test and combining those measurements. The marginal reliability coefficient was
calculated between .89 and .94 in grades 6, 7, 8.
Data Analysis
The data was analyzed using simple linear regression and multiple regression
analyses. Simple linear regression was used when one independent variable was
compared to one dependent variable. It was similar to a correlation measuring the
correspondence of one variable to the other variable. Simple linear regression was
described as the regression of the dependent variable on the independent variable (Dallel,
2007a). Dallel continued to describe simple linear regression as “an example of
borrowing strength from some observations to make sharper (that is, more precise)
statements about others” (p. 4). The equation for a simple linear equation was:
Y = a + bX
where Y was the dependent variable (criterion variable), X was the independent variable
(predictor variable), a was the intercept and b was the slope of the line (WINKS, 2007)

66
Multiple regression allowed one dependent variable to be compared to several
independent variables at the same time. The analyses were conducted on the statistical
program SPSS. These independent variables were used as predictor variables for the
dependent variable. Multiple regression analysis enabled the combination of many
variables to create the best possible predictions of the independent variable (Allison,
1999). Multiple regression was a linear relationship, similar to correlation. Predictor
variables (independent) may be correlated with each other and with the criterion
(dependent) variable. Multiple regression’s power was amplified with the study of
multiple predictor variables, providing information about the dependent variable acted on
by the set of predictors together and separately when the other predictors were
statistically controlled. The connection between the criterion variable and the predictor
variable depended on the other predictors included in the regression (Hoyt, Leierer, &
Millington, 2006).
A linear relationship was graphed in a straight line. The simple straight line graph
made it possible for a prediction on the way an independent variable or a group of
independent variables have changed the dependent variable (Allison, 1999). The linear
multiple regression equation looked like this: y = b1x1 + b2x2 + … = + bnxn + c. The
criterion variable was y and x was the predictor variable. The bs were the regression
coefficients, representing the amount of change when the independent variable changed
one unit. The place where the regression line crossed the y axis was the constant c
(Garson, 2007; Allison, 1999). The analysis did not give a clear yes or no answer but a
probability (p) value. If the p value was less that .05, then it was significantly different
from zero. If the p value was less than .01, then it was highly significant. (Allison, 1999)

67
The method of forward regression was utilized by beginning with the predictor
variable best correlated with the criterion variable in the model. With each successive
model, one more predictor variable with the highest partial correlation, contolling for the
first predictor variable, is added. With each model, predictive power of all of the included
predictor variables increased. Predictor variables continue to be added until the addition
of a predictor variable does not increase the R2 by a significant amount, or until all
variables have been entered (Garson, 2008).
The first criterion variable chosen, the scores on the MO MAP mathematics test,
was compared with each predictor variable a-e in a single linear regression analysis,
looking for predictive correlation. Can the increase of the dependent variable be predicted
by the increase of the independent variable? The last predictor variable for this criterion
variable was treated with a forward multiple regression analysis. All the predictor
variables, a-e were put in one stepwise, forward multiple regression to see which of the
predictor variables was the best predictor of the change in the dependent variable.
The second dependant variable, the MO MAP language arts scores, had two sets
of analyses. The first set was associated with NWEA reading test scores and the second
set was associated with the NWEA MAP language art scores. Both sets of analyses were
treated the same as the analyses for the first criterion variable: the last predictor variable
was treated as a stepwise, forward multiple regression and all the others were treated as
simple linear regression.
The first criterion variable was the score on the MO MAP mathematics test. Its
predictor variables were the RIT scores on: the numbers and operations portion, the
algebraic relationships portion, the geometric relationships portion, the measurement

68
portion of the mathematics section of the NWEA MAP test. The second criterion variable
was the score on the MO MAP language arts test. Its predictor variables were the RIT
scores on: the writing process portion, the capitalization and punctuation portion, the
parts of speech/spelling/sentence structure portion, and the forms and types of writing
portion of the reading section of the NWEA MAP test. Another set of predictor variables
for the second criterion variable are: the reading process portion, the strategies for
reading process portion, the comprehend/analyze literature portion, and the
comprehend/analyze nonfiction portion of the reading section of the NWEA MAP test.
Summary
Multiple regression analysis allows many independent variables to be compared
to one dependent variable. This study was looking for predictors on the NWEA MAP test
for the mandated MO MAP test. There were two criterion variables for this study: the
language arts score and the mathematics score on the MO MAP test. The predictor
variables were the subtest RIT scores on the NWEA MAP test. The point was to
determine if there was a predictor score for the MO MAP test from the NWEA MAP test.
The sample for this multiple regression was the sixth, seventh, and eighth grade
classes at a rural middle school in Missouri that has been using NWEA MAP as a
supplemental test for three years. Three years worth of data was included in the study
providing a combined sample of approximately 1250. The sample used was a
convenience non-random sample of students at one rural district that requested the study.
Middle school was an age of transition for students, where achievement traditionally falls
and interest in school was at an all time low. Low achievement/interest made it all the
more important to examine what was happening at middle school age.

69
In chapter 4 the results of the multiple regression analysis on the data looking for
predictor variables from the NWEA MAP test on the MO MAP test is presented. All of
the research questions are addressed. Chapter 5 includes a discussion of the data, singling
out the predictors if there were any, and implications for practice. There will also be a
look ahead as to what questions this research has created and what research is still needed
to determine if NWEA MAP is any value to teachers preparing students for MO MAP.

70
CHAPTER FOUR
RESULTS
The results of the regression analyses performed comparing the statistical results
of the Northwest Evaluation Association’s Measures of Academic Progress Assessment
and the Missouri Assessment Program’s annual, required test of mathematics and
language arts, is presented in this chapter. In order to address the three research questions
and the research questions found within the three basic questions, a bivariate linear
regression was conducted between each predictor and criterion variable and a backward
multiple regression was conducted between all predictor variables and their
corresponding criterion variables.
The assessments in question were administered within one average sized
Missouri school district. The Missouri Assessment Program (MO MAP) was a required
assessment given annually to all students in grades three through eight in Missouri public
schools. The Northwest Evaluation Association’s Measures of Academic Progress
(NWEA MAP) was a computer-adaptive test adopted by some Missouri school districts
as an extra test to enhance the ability of teachers to increase student learning.
The predictive power of the scores of the NWEA MAP test on the MO MAP was
examined by this study. The results of the MO MAP were expressed as two scores,
mathematics and language arts. These scores were presented as the dependent
variables/criterion variables. The results of the NWEA MAP were expressed in RIT
scores in three areas: mathematics, reading, and language usage. Each area contained
four-five subtest RIT scores. These area RIT scores and their subtest RIT scores formed
the independent/predictor variable. A simple linear regression was performed on each of

71
the variables under each of the three research questions to establish a correlation between
each predictor variable and the corresponding criterion variable. One backward multiple
regression was conducted for each of the three research questions, including all of the
variables within each question. The purpose of the forward multiple regression was to
discover the best predictor of success on the Missouri Assessment Program’s annual
Mathematics and Language Arts tests.
Overview of Data
The data from NWEA MAP test and MO MAP assessment was taken from the
school years of 2005-2006 and 2006-2007. The NWEA MAP test was taken by students
in both fall and spring; however data from the fall testing was utilized, since spring
testing of the NWEA MAP occurred after the MO MAP spring testing. The population of
the sixth, seventh, and eighth grade students at one middle sized, rural school district was
used. Since this school has a mobile population, scores were disqualified because the
student was not present for both tests or did not complete both tests. For this study,
N = 800-900 students.
NWEA MAP scores were reported as Rasch Unit (RIT) scores for both the
Mathematics, Reading, and Language Usage tests and the 5-6 subtests of each test. The
Mathematics, Reading, and Language Usage tests were a compilation of the scores on the
corresponding subtests. RIT scores were a scaled score which was based on a constant
scale, no matter what grade a student was in, which enabled the test to measure academic
growth from semester to semester or year to year.

72
MO MAP scores were reported as number scores which were converted to
achievement level for that grade level. Achievement levels were reports as below basic,
basic, proficient, and advanced. For this research, number scores were used.
Presented in Table 1 is the descriptive data from the MO MAP mathematics and
communication arts assessments: number of students completing the assessment,
minimum and maximum scores, mean score, and standard deviation. The displayed data
are combined from grades sixth, seventh, and eighth, and from school years, 2005-2006
and 2006-2007.
Table 1
Descriptive Statistics for MO MAP Assessment
Assessment N Minimum Maximum Mean Std.
Deviation
Mathematics Score 995 91 808 690.58 41.969
Communication Arts Score 993 505 775 682.02 31.723
Presented in Table 2 is the descriptive data from the three areas of tests within the
NWEA MAP test: mathematics, language usage, and reading. The displayed data were
combined from three grades, sixth, seventh, and eighth, and school years 2005-2006 and
2006-2007. The table displays number of students completing the assessment, minimum
and maximum scores, mean score, and standard deviation. Data from both tests and
corresponding subtests are displayed.

73
Table 2
Descriptive Statistics for NWEA MAP Tests and Subtests
N Minimum Maximum Mean Std.
Deviation
Number & Operations 860 130 274 222.51 16.607
Algebraic Relationships 860 165 269 224.71 16.074
Geometric Relationships 860 152 268 222.82 16.122
Measurements 860 150 259 220.61 16.181
Data & Probability 860 154 273 227.19 16.182
Overall Mathematics Score 867 152 262 223.51 14.353
Apply Writing Process 894 151 255 218.02 12.624
Capitalization & Punctuation 894 158 256 217.43 13.233
Parts of Speech/Spelling/Sentence
Structure
894 146 252 215.81 12.693
Forms & Types of Writing 894 158 252 217.35 13.339
Overall Language Usage Score 893 150 238 217.06 11.485
Overall Reading Score 883 153 255 217.54 12.875
Skills for Reading Process 882 154 264 216.74 14.087
Strategies for Reading Process 882 146 259 217.90 14.722
Comprehend/Analyze LIterature 882 154 278 218.19 14.916
Comprehend/Analyze NonFiction 882 150 274 218.21 14.577
Valid N (listwise) 812

74
Research Question One
The question asked in research question one was “How well do RIT scores on the
mathematics test of the NWEA MAP test predict scores on the Missouri MAP
mathematics test.” There were five questions within the first research question
corresponding to the subtests of the NWEA MAP mathematics test, finishing with the
final question of “Which RIT scores on the mathematics test of the NWEA MAP are the
best predictors of the Missouri MAP mathematics test?” First, a bivariate regression was
run on overall RIT score of the mathematics test, and second, a bivariate regressions was
run on each of the scores of each subtest, correlating them with the mathematics score on
the MO MAP assessment. Second, a forward multiple regression was run to understand
the how the group of predictor variables influenced the criterion variable.
Bivariate Linear Regression
Overall mathematics RIT score. The overall mathematics RIT score was a
compilation of the RIT scores from the subtests of the mathematics test: number and
operations, algebraic relationship, geometric relationship, measurement, and data and
probability. A biariate linear regression analysis was conducted to determine the
predictive power of the overall NWEA MAP Mathematics RIT score on the MO MAP
mathematics score. The bivariate scatterplot indicated that the two variables had a
positive linear relationship i.e., as the independent variable increased, the dependent
variable increased. Based on R (R= the Pearson product-moment correlation coefficient)
of .822 and the standard deviation of 14.35, the NWEA MAP mathematics test was a
good predictor of the MO MAP mathematics assessment. Table 3 illustrates the mean,

75
standard deviation, r, r2, and standard error of the estimate of the overall mathematics
RIT score correlated to the MO MAP mathematics score.
Table 3
Bivariate Linear Regression for Overall Mathematics RIT Score
Predictor Mean
(sd)
R R
Square
Std. Error of
the Estimate
NWEA MAP Mathematics RIT Score 223.51
(14.35)
.822 .676 20.625
Note. Dependent variable: MO MAP mathematics score. N=867.
Mathematics subtests RIT scores. The bivariate linear regression analyses were
conducted to determine the predictive power of each of the subscores of the NWEA MAP
mathematics test. The scatterplots (see Appendix B) for each subscore indicated a
positive linear relationship for each subscore and the criterion variable. Table 4 presents
the bivariate linear regression of each of the predictor subscores with the criterion
variable, the MO MAP mathematics score. Table 4 displays the mean, standard deviation
R, R 2, and standard error of the estimate of the predictor subscores. The table shows the
data and probability subscore explained 55% of the variance (R2 = .548) of the criterion
variable, the MO MAP mathematics score at a 95% confidence level. Considered as
separate predictors, measurement explained 54%, geometric relationship 53%, number
and operation 52%, and algebraic relationship 49% of the variance of the criterion
variable.

76
Table 4
Bivariate Linear Regression for NWEA MAPMathematics subtests RIT score
Predictor Mean (sd) R R
Square
Std. Error of
the Estimate
Number & Operation subtest RIT
score
222.51 (16.61) .722 .521 25.053
Algebraic relationship RIT score 224.71 (16.07) .702 .493 25.761
Geometric relationship RIT score 222.82 (16.12) .731 .534 24.705
Measurement RIT score 220.62 (16.18) .733 .538 24.614
Data and probability RIT score 227.19 (16.18) .741 .548 24.325
Note. Dependent variable: MO MAP mathematics score. N= 860
Multiple Regression of Subtests RIT Scores
To determine what best predicted the criterion variable, a forward multiple
regression analysis was used with the score on the mathematics test of the MO MAP
assessment as the criterion variable, and subtests of the mathematics portion of the
NWEA MAP test as the predictor variables. Those subtests were number and operations,
algebraic relationships, geometric relationships, measurement, and data and probability.
Table 5 presents the description statistics of the regression output.

77
Table 5
Descriptive Statistics of the Multiple Regression of Subtests of NWEA MAP Mathematics
Test and MO MAP Mathematics Assessment
Predictor Mean Std. Deviation N
MO MAP Mathematics Scale Score 692.76 36.174 853
NWEA MAP Number & Operations 222.95 15.747 853
NWEA MAP Algebraic Relationships 224.96 15.662 853
NWEA MAP Geometric Relationships 223.18 15.521 853
NWEA MAP Measurements 220.99 15.584 853
NWEA MAP Data & Probability 227.59 15.488 853
All nonordered subtest predictors were entered with a forward regression
performed. All variables were found to be good predictors of success on the criterion
variable. Data and probability was the best predictor, followed by measurement,
geometric relationships, number and operations, with algebraic relationships coming in
last. Table 6 presents the regression model showing that all predictor variables were
entered; none were removed from the regression.

78
Table 6
Regression Model of Subtests of NWEA MAP Mathematics Test
Model Variables Entered Variables
Removed
Method
1 NWEA MAP Data &
Probability
. Forward (Criterion: Probability-
of-F-to-enter <= .050)
2 NWEA MAP Geometric
Relationships
. Forward (Criterion: Probability-
of-F-to-enter <= .050)
3 NWEA MAP
Measurements
. Forward (Criterion: Probability-
of-F-to-enter <= .050)
4 NWEA MAP Number &
Operations
. Forward (Criterion: Probability-
of-F-to-enter <= .050)
5 NWEA MAP Algebraic
Relationships
. Forward (Criterion: Probability-
of-F-to-enter <= .050)
Note. Criterion variable: MO MAP mathematics score.
Results indicated a significant regression model that explained 69% of the
variance in the mathematics score of the MO MAP assessment (R2 = .687) after all
variables have been entered. Table 7 presents the model summary with Pearson product-
moment coefficient (R) above the .5 level determined as a large coefficient and the
standard error of the estimate determined as small compared to the actual scores. With
each added predictor variable, the change in R2 was smaller, indicating that the predictor
variable, data and probability, in model 1 produced the largest effect and the variable

79
added in model 5, algebraic relationships, produced the smallest effect on the criterion
variable. Although all predictors demonstrated large correlation (R), data and probability
was suggested to be the best predictor with 74% of the variance of the criterion variable
explained at a 95% confidence level.
Table 7
Model Summary for Subtests of NWEA MAP Mathematics Test and MO MAP
Mathematics Assessment
Model R R
Square
Adjusted R
Square
Standard Error of the
Estimate
R Square
Change
1 .741 .548 .548 24.325 .548
2 .798 .636 .635 21.847 .088
3 .816 .665 .664 20.971 .029
4 .825 .681 .679 20.480 .016
5 .829 .687 .685 20.295 .006
Note. Dependent variable: MO MAP mathematics score.
In Table 8, the B values suggested data and probability to have the largest
influence on the criterion variable. The prediction formula was:
Predicted MO MAP math score = 202.18 + .398(N&O) + .299(Alg) + .437(Geo) + .569(D&P) + .486(Mea).
The standardized Beta is a standardized Z score for B scores. The prediction equation for
Beta was:
ZPredicted MO MAP mathematics score = .244 ZD&P + .188 ZGeom + .210 ZMeas + .173 ZN&O + .129 ZAlg.
Each predictor variable in successive models increased predictive power of the equation.
All predictor variables were significantly related to the criterion variable (p = <.001).

80
Table 8
Regression Coefficients of NWEA MAP Math Subtests and MO MAP Mathematics Score
Model B Std.
Error
Beta t p Zero-
order
Part
(Constant) 299.137 12.274 24.372 <.001 1
Data & Probability 1.730 .054 .741 32.144 <.001 .741 .741
(Constant) 237.997 11.822 20.132 <.001
Data & Probability 1.047 .068 .448 15.434 <.001 .741 .319
2
Geometric
Relationships
.970 .068 .416 14.317 <.001 .731 .296
(Constant) 220.313 11.534 19.101 <.001
Data & Probability .791 .072 .339 11.030 <.001 .741 .219
Geometric
Relationships
.674 .074 .289 9.151 <.001 .731 .182
3
Measurements .643 .075 .277 8.573 <.001 .733 .170
(Constant) 209.186 11.393 18.360 <.001
Data & Probability .636 .074 .272 8.594 <.001 .741 .167
Geometric
Relationships
.522 .076 .224 6.906 <.001 .731 .134
Measurements .529 .075 .228 7.024 <.001 .733 .136
4
Number &
Operations
.473 .073 .206 6.497 <.001 .722 .126
5 (Constant) 202.218 11.420 17.708 <.001

81
Model B Std.
Error
Beta t p Zero-
order
Part
Data & Probability .569 .075 .244 7.579 <.001 .741 .146
Geometric
Relationships
.437 .078 .188 5.629 <.001 .731 .108
Measurements .486 .075 .210 6.450 <.001 .733 .124
Number & Operations .398 .074 .173 5.343 <.001 .722 .103
Algebraic
Relationships
.299 .073 .129 4.066 <.001 .702 .078
Note. Criterion variable: MO MAP mathematics score.
Research Question Two
“How well do RIT scores on the NWEA MAP reading test predict scores on the
Missouri MAP communication arts assessment?” was raised in Question Two. The four
questions within the second research question corresponded with the subtests of the
NWEA MAP reading test, finishing with the final question “Which RIT scores on the
reading test of the NWEA MAP test are the best predictors of the Missouri MAP
communication arts assessment?” As with the previous question, bivariate linear
regression analyses were first run on each subtest RIT score and overall RIT score.
Second, a forward multiple regression was run using each subtest RIT score as predictor
variables of the criterion variable which was the MO MAP communication arts
assessment.

82
Bivariate Linear Regression
Overall reading RIT scores. The overall reading RIT score was a compilation of
the RIT scores from the subtests of the NWEA MAP reading test: skills for reading
process, strategies for reading process, comprehend/analyze literature, and
comprehend/analyze nonfiction. A bivariate linear regression analysis was conducted to
determine the predictive power of the overall NWEA MAP reading RIT score on the MO
MAP communication arts score. The bivariate scatterplot (See Appendix B) indicated the
predictor variable and criterion variable had a positive correlation. Table 9 displays the
descriptive data from the bivariate linear regression for the overall reading RIT score of
the NWEA MAP test against the MO MAP communication arts score. Based on the R2
value of .632, the NWEA RIT reading score accounted for 63% of the variance on the
MO MAP communication arts tests at a 95% accuracy rate. The NWEA reading
assessment was a good predictor of the MO MAP communication arts score. Table 9
displays the mean, standard deviation, R, R2, and standard error of the estimate of the
overall reading RIT score correlated to the MO MAP communication arts score.
Table 9
Bivariate Linear Regresson for Overall Reading RIT Score of NWEA MAP Test
Predictor Mean (sd) R R
Square
Std. Error of
the Estimate
NWEA MAP Reading RIT score 217.82 (12.40) .795 .632a 18.708
Note. Dependent variable: MO MAP language arts score. N= 874.
Reading subtest scores. The bivariate linear regressions conducted to determine
the predictive power of each of the subtests of the NWEA MAP reading tests indicated

83
the strategies for reading process explains 51% of the variance in the MO MAP
communication arts test (R2 = .511) with a 95% confidence rate. All of the predictor
variables had a large Person product-moment correlation coefficient.
Comprehend/analyze literature explained 49.6% of the variance in the MO MAP
communication arts score (R2 = .496) at a 95% confidence level. Comprehend/analyze
nonfiction explained 48% of the variance of the MO MAP communication arts score (R2
= .480). Skills for reading process explained 48% of the variance of the MO MAP
communication arts score (R2 = .479). Using the R value, all predictors exhibited a large
correlation coefficient. Table 10 presents the bivariate linear regression of each individual
subtest of the NEW MAP reading RIT scores against the MO MAP communication arts
score.
Table 10
Bivariate Regressions for Subtests of NWEA MAP Reading Test RIT Scores
Predictor Mean (sd) R R
Square
Std. Error of
the Estimate
Skills for reading process RIT score 216.99 (13.75) .692 .479. 22.275
Stategies for reading process RIT score 218.16 (14.32) .715 .511. 21.59
Comprehend/analyze literature 218.52 (14.46) .705 .496. 21.91
Comprehend/analyze nonfiction 218.51 (14.05) .693 .480. 22.26
Note. Dependent variable: MO MAP language arts score. N= 874.
Multiple Regression of Subtest RIT Scores
A forward multiple regression analysis was used to determine which predictor
variable from the subscores of the NWEA MAP reading test was most useful at

84
predicting the criterion variable, the MO MAP communication arts assessment score. The
subscores were: skills for reading process, strategies for reading process,
comprehend/analyze literature, and comprehend/analyze nonfiction. All nonordered
subscores were entered with a forward regression performed. Table 11 displays the
descriptive statistics of the regression output.
Table 11
Descriptive Statistics of the Forward Multiple Regression of Subtests of NWEA MAP
Reading Test on MO MAP Communication Arts Assessment
Mean Std. Deviation N
MO MAP Communication Arts Scale Score 683.24 30.850 874
NWEA MAP Reading --Skills for Reading Process 216.99 13.754 874
NWEA MAP Strategies for Reading Process 218.16 14.324 874
NWEA MAP Comprehend/Analyze Literature 218.52 14.459 874
NWEA MAP Comprehend/Analyze Nonfiction 218.51 14.048 874
All nonordered subtest predictors were entered with a forward regression
performed. All subtest scores were found to be good predictors of success on the criterion
variable. Table 12 presents the regression model showing that all predictor variables were
entered, none were left out of the regression.

85
Table 12
Regression Model of Subtests of NWEA MAP Reading Test
Model Variables Entered Variables
Removed
Method
1 NWEA MAP Strategies for
Reading Process
. Forward (Criterion: Probability-
of-F-to-enter <= .050)
2 NWEA MAP Reading --Skills for
Reading Process
. Forward (Criterion: Probability-
of-F-to-enter <= .050)
3 NWEA MAP
Comprehend/Analyze Literature
. Forward (Criterion: Probability-
of-F-to-enter <= .050)
4 NWEA MAP
Comprehend/Analyze Nonfiction
. Forward (Criterion: Probability-
of-F-to-enter <= .050)
Note. Criterion variable: MO MAP communication arts score.
Results indicated a significant regression model that explained 63% of the
variance in the communication arts score of the MO MAP assessment after all variables
have been entered. No predictor variables were removed by the analysis; all variables
were high predictors. Table 13 represents the regression output. All predictor variables in
the reading test were well over the .5 level for large correlation coefficients (R), with
strategies for reading process being the most highly correlated. With each added predictor
variable, the change in R2 was smaller, indicating that predictor variable, strategies for
reading process, in model 1 produced the largest effect and the variable added in model 5,
analyze/comprehend nonfiction, produced the smallest effect on the criterion variable.
Although all predictors demonstrated large correlation, strategies for reading process was

86
suggested to be the best predictor with .51% (R2 = .511) of the variance of the criterion
variable explained at a 95% confidence level.
Table 13
Model Summary of NWEA MAP Reading Subtests and MO MAP Communication Arts
Assessment
Model R R
square
Adjusted R
square
Standard Error of the
Estimate
R Square
Change
1 .715 .511 .510 21.590 .511
2 .765 .585 .584 19.891 .074
3 .784 .615 .613 19.185 .029
4 .794 .630 .628 18.808 .015
Note. Criterion variable: MO MAP communication arts score.
In Table 14, the B value also suggested strategies for reading process to have the
largest influence on the criterion variable. The prediction formula was:
Predicted CA MO MAP score = 256.166 + .519(STR) + .518(SKI) + .481(CAL) + .441(CAN).
The standardized Beta is a standardized Z score for B scores. The prediction equation for
Beta was:
ZPredicted CA MO MAP Score = .241 Zstr + .231 Zski + .225 Zcal + .201Zcan.
Each predictor variable added in the successive models increased the predictive power of
the equation. All predictor variables were significantly related to the criterion variable
(p = <.001).
The zero order statistic is the Pearson’s product moment correlation coefficient.
Zero order shows the correlation between the predictor and criterion variables without
87
taking into account the other predictor variables. The semipartial correlation (part)
explains the variance of the criterion variable that is not explained by other variables. In
Table 14, part equals zero order for the predictor variable of the first model and decreases
with each variable added to the model.

88
Table 14
Regression Coefficients of Subtests of NWEA MAP Reading Test
Model B Std.
Error
Beta t Sig. Zero-
order
Part
(Constant) 347.436 11.153 31.151 <.001 1
Strategies for Reading
Process
1.539 .051 .715 30.172 <.001 .715 .715
(Constant) 286.527 11.372 25.196 <.001
Strategies for Reading
Process
.973 .065 .452 14.917 <.001 .715 .326
2
Skills for Reading
Process
.850 .068 .379 12.503 <.001 .692 .273
(Constant) 269.318 11.169 24.112 <.001
Strategies for Reading
Process
.673 .073 .312 9.220 <.001 .715 .194
Skills for Reading
Process
.640 .070 .285 9.089 <.001 .692 .191
3
Comprehend/Analyze
Literature
.587 .072 .275 8.147 <.001 .705 .171
(Constant) 256.166 11.167 22.940 <.001 4
Strategies for Reading
Process
.519 .076 .241 6.836 <.001 .715 .141

89
Skills for Reading
Process
.518 .072 .231 7.192 <.001 .692 .148
Comprehend/Analyze
Literature
.481 .073 .225 6.605 <.001 .705 .136
Comprehend/Analyze
NonFiction
.441 .073 .201 6.014 <.001 .693 .124
Note. Criterion variable: MO MAP communication arts assessment.
Research Question Three
Research question three posed the question “How well do RIT scores on the
NWEA MAP language usage test predict scores on the Missouri MAP communication
arts test?” There were four questions within the third research question corresponding to
the subtests of the NWEA MAP language usage test, finishing with the final question of
“Which RIT scores on the language usage test of the NWEA MAP test are the best
predictors of the Missouri MAP communication arts assessment?” First bivariate
regressions were run on the overall reading RIT score, with the individual subscores next.
Second, a multiple regression was run on all of the subtests of the NWEA MAP language
usage test as predictor variables and the MO MAP communication arts assessment as the
criterion variable.
Bivariate Linear Regression
Overall language usage RIT scores. The overall language usage RIT score was a
compilation of the RIT sores from the subtests of the NWEA MAP language usage test:
apply writing process, capitalization and punctuation, parts of speech/spelling/sentence

90
structure, and forms and types of writing. A bivariate linear regression analysis was
conducted to determine the predictive power of the overall NWEA MAP language usage
RIT score on the MO MAP communication arts score. The bivariate scatterplot (see
Appendix B) indicated that the two variables had a positive linear relationship: as the
independent variable increases, the dependent variable increases. Based on the R2 value
of .632, the NWEA RIT language usage score accounted for 63% of the variance of the
MO MAP communication arts assessment at a 95% accuracy rate. The NWEA language
usage RIT score was a good predictor of the MO MAP communication arts score since
the R was above .50 which is considered a large correlation coefficient. Table 15
illustrated the mean, standard deviation, R, R2, and standard error of the estimate of the
overall language usage RIT score correlated to the MO MAP communication arts score.
Table 15
Bivariate Linear Regression for Overall Language Usage RIT score of NWEA MAP Test
Predictor Mean
(sd)
R R
Square
Std. Error of
the Estimate
NWEA MAP language usage RIT score 217.39
(10.85)
.795 .631 18.705
Note: Criterion variable: MO MAP Language Arts score. N= 893.
Language usage subtest scores. The bivariate linear regression conducted to
determine the predictive power of the subtests of the NWEA MAP language usage test
indicated that the writing process subtest explained 63% of the variance in the MO MAP
communication arts test (R2 = .631) at a 95% confidence rate. The capitalization and
punctuation subtest explained 47% (R2 = .474) of the variance in the MO MAP

91
communication arts score. The parts of speech/spelling/sentence structure subtest
explained 47% of the variance in the MO MAP communication arts score (R2 = 467). The
forms and types of writing subtest explained 50% of the variance in the MO MAP
communication arts score (R2 =.499). Table 16 presented the bivariate linear regression of
each individual subtest of the NWEA MAP language usage test against the MO MAP
communication arts test.
Table 16
Bivariate Regressions for Subtests of NWEA MAP Language Usage RIT Scores
Predictor Mean (sd) R R
square
Std. error of
the estimate
Apply writing process subtest RIT score 218.33
(12.09)
.795 .631 18.705
Capitalization and punctuation subtest RIT
score
217.39
(12.68)
.689 .474 22.429
Parts of speech/spelling/sentence structure
RIT score
216.16
(11.97)
.684 .467 22.576
Forms and Types of Writing 217.65
(12.89)
.706 .499 21.900
Note. Criterion variable: MO MAP Language Arts Score. N= 894
Multiple Regression of Subtest RIT Scores
To determine what best predicted the criterion variable, a forward multiple
regression analysis was used with the score on the communication arts test of the MO
MAP assessment as the criterion variable, and subtests of the language usage portion of

92
the NWEA MAP test were used as predictor variables. These subtests were: apply writing
process, capitalization and punctuation, parts of speech/spelling/sentence structure, and
forms and types of writing. Table 17 presents the description statistics of the regression
output.
Table 17
Description Statistics of the Multiple Regression of Subtests of NWEA MAP Language
Usage Test Against MO MAP Communication Arts Assessment
Mean Std.
Deviation
N
MO MAP Communication Arts Scale Score 683.34 30.917 886
NWEA MAP Language Usage--Apply Writing Process 218.33 12.088 886
NWEA MAP Language Usage--Capitalization &
Punctuation
217.77 12.680 886
NWEA MAP Language Usage--Parts of
Speech/Spelling/Sentence Structure
216.16 11.967 886
NWEA MAP Forms & Types of Writing 217.65 12.894 886
All nonordered subtest predictors were entered with a forward regression
performed. Forms and types of writing was the best predictor, followed by apply writing
process, capitalization and punctuation, with parts of speech/spelling/sentence structure
coming in last. Table 18 presents the regression model showing that all predictor
variables were entered, none were left out of the regression.

93
Table 18
Forward Regression Model of Subtests of NWEA MAP Language Usage Test
Model Variables Entered Variables
Removed
Method
1 Forms & Types of Writing Forward (Criterion: Probability-
of-F-to-enter <= .050)
2 Apply Writing Process . Forward (Criterion: Probability-
of-F-to-enter <= .050)
3 Capitalization & Punctuation . Forward (Criterion: Probability-
of-F-to-enter <= .050)
4 Parts of
Speech/Spelling/Sentence
Structure
. Forward (Criterion: Probability-
of-F-to-enter <= .050)
Note. Criterion variable: MO MAP communication arts score.
Results indicated a significant regression model that explained 63 % of the
variance of the criterion variable, communication arts assessment (R2 = .632) after all
variables have been entered. Table 19 presents the model summary with Pearson product-
moment coefficient (R) above the .5 level determined as a large coefficient and the
standard error of the estimate determined as small compared to the actual scores. With
each added predictor variable, the change in R2 was smaller, indicating that the predictor
variable, forms and types of writing, in model 1 produced the largest effect and the
variable added in model 5, parts of speech/spelling/sentence structure, produced the
smallest effect on the criterion variable. Although all predictor variables demonstrated

94
large correlation (R2), forms and types of writing was suggested to be the best predictor
with 50% of the variance in the criterion variable explained at a 95% confidence level.
Table 19
Model Summary of NWEA MAP Language Usage Subtests and MO MAP Communication
Arts Assessment
Model R R
square
Adjusted R
square
Standard error of the
estimate
R Square
Change
1 .706 .499 .498 21.900 .499
2 .765 .585 .584 19.950 .086
3 .787 .620 .619 19.089 .036
4 .796 .634 .632 18.748 .014
Note. Criterion variable: MO MAP communication arts assessment.
In Table 20, the B value suggested forms and types of writing to have the largest
influence on the criterion variable. The prediction formula was:
Predicted CA MO MAP score = 190.728 + .612(FTW) + .632(AW) + .540(CP) +.480(PS).
The standardized Beta is a standardized Z score for B scores. The prediction equation for
Beta was:
ZPredicted CA MO MAP Score = .255 Zftw + .247 Zaw + .221 Zcp + .186Zps.
Each predictor variable added in the successive models increased the predictive power of
the equation. All predictor variables were significantly related to the criterion variable
(p = <.001).
The zero order statistic, Pearson’s product moment correlation coefficient, shows
the correlation between the predictor and criterion variables without taking into account

95
the other predictor variables. The semipartial correlation (part) explains the variance of
the criterion variable that is not explained by other variables. In Table 14, part equals
zero order for the predictor variable of the first model and decreases with each variable
added to the model.

96
Table 20
Regression Coefficients of NWEA MAP subscores
Model B Std.
Error
Beta t Sig. Zero-
order
Part
(Constant) 314.763 12.448 25.286 <.001 1
Forms & Types of Writing 1.693 .057 .706 29.661 <.001 .706 .706
(Constant) 235.787 12.759 18.480 <.001
Forms & Types of Writing 1.001 .073 .418 13.708 <.001 .706 .297
2
Apply Writing Process 1.052 .078 .411 13.503 <.001 .704 .293
(Constant) 207.481 12.600 16.467 <.001
Forms & Types of Writing .730 .076 .304 9.599 <.001 .706 .199
Apply Writing Process .778 .080 .304 9.679 <.001 .704 .201
3
Capitalization &
Punctuation
.676 .074 .277 9.081 <.001 .689 .188
(Constant) 190.728 12.710 15.006 <.001
Forms & Types of Writing .612 .077 .255 7.913 <.001 .706 .161
Apply Writing Process .632 .083 .247 7.618 <.001 .704 .155
Capitalization &
Punctuation
.540 .077 .221 7.034 <.001 .689 .143
4
Parts of
Speech/Spelling/Sentence
Structure
.480 .083 .186 5.778 <.001 .684 .118
Note. Criterion variable: MO MAP communication arts assessment.

97
Summary
In order to determine the best predictors of scores on the MO MAP assessments
of mathematics and communication arts, bivariate linear regression analyses and multiple
regression analyses were conducted with the mathematics and reading tests and subtests.
Bivariate analyses were conducted with individual test and subtest of the NWEA MAP
against the two MO MAP assessment scores to examine the correlation of each test and
subtest. The multiple regressions examined the correlation of all of the subtests together
to determine the best predictor of each score of the MO MAP mathematics and
communication arts assessment.
The bivariate linear regression results and the bivariate scatterplots demonstrated
that all of the subtests had a positive, linear correlation. All of the Pearson product
moment coefficients (R) of the multiple regressions were large, falling between .693 and
.795. The strongest correlations were found within the mathematics subtests with Pearson
correlation coefficient between .702 and .741. Data and Probability was the best predictor
of the mathematics score of the MO MAP assessment. The reading and language usage
test scores were both correlated with the MO MAP communication arts scores. The
reading test scores had higher correlation, between .693 and .714, with the
communication arts scores. The strategies of reading process subscore had the highest
correlation and therefore was the best predictor. The language usage scores had the
lowest correlation, but were still highly correlated with scores from .684-.795. The apply
writing process of the language usage test was the most correlated with .795 and was
therefore the best predictor.

98
Using the forward multiple regression, all variables were entered, none were
removed. In the mathematics regression model, data and probability was the best
predictor of success on the MO MAP mathematics assessment among the predictor
variables. However, the other variables and the overall RIT score were also good
predictors. On the MO MAP communications arts assessment, strategies for reading
process was the best predictor from the NWEA MAP reading test and forms and types of
writing was the best predictor from the NWEA MAP Language usage test.
Presented in this chapter were the statistical results of the study. Chapter 5 is a
review of the reason for the research study, the discussion of the results, implication for
practice, and implications for further research.

99
CHAPTER FIVE
DISCUSSION
Introduction
Reforms are characteristic of American education. In recent memory, the launch
of Sputnik in 1957 began the criticism of American education. Fanning the flame of self
doubt was the concept that something must be wrong with education if the USSR could
win the space race. The 1960s were characterized by an emphasis on science and
mathematics (Guthrie & Springer, 2004). The 1970s changed this with the emphasis on
minimum competence in schools. It was an attempt to reach all students with basic
educational skills (Amrein & Berliner, 2002b). Sparked by the publication of A Nation at
Risk (National Commission on Education) in 1983, American K-12 education plunged
into a death spiral of self criticism and judgment.
The standards movement, the nation’s response to pull education out of this spiral,
was composed of three waves (Guthrie & Springer,2004). The first wave of reform was
initiated in the years immediately following A Nation at Risk, instituting challenging
academic standards for students, longer school days, longer school years, and more
required courses, especially in math and science. The second wave, between 1990 and
2000 involved alignment of testing, teacher certification, and accountability programs to
the standards created in the first wave. The National Educational Goals Panel was created
in 1990 to monitor the progress of the states toward these educational goals, beginning
the accountability movement (Joles, 2003). The third wave of change was in the
restructuring of state laws that made districts and schools accountable for meeting the
standards of the first reform. The NO Child Left Behind Act (2001) was the beginning of
the third wave of change that is still affecting education today (Guthrie & Springer).

100
Standards based reform ideas had their inception in the schools of Texas, North
Carolina, and South Carolina in the early 1980s. The emphasis of their reforms was on
the ideas of improving the capacity of teachers, administrators, and on curriculum
alignment (Carnoy & Loeb, 2002). As other states adopted reform, states developed
performance standards as a cheaper way of producing increased student learning than the
more expensive way of decreasing class size (Lee. 2006). Even though Title 1 of the
Improving America’s Schools Act (IASA) of 1994 required state assessments aligned to
state standards, with NCLB more importance was given to those assessments
(McDermott, 2003). The purpose of the state assessments became to track student
achievement and identify low performing schools by expanding testing and
accountability (Goertz & Duffy, 2003).
The state of Missouri was quick to adopt the required educational reforms and
took seriously the effort to improve student learning with assessment. In 1985, Missouri’s
83rd General Assembly published the list of Core Competencies and Key Skills which the
state identified as information that all students should know. Schools were expected to
align their curriculum to the new competency and key skills list. The Missouri Mastery
and Achievement Test was developed to test that the Core Competencies and Key Skills
were being taught. Accountability began to shift from the teacher and community to the
state. In 1993, the Outstanding Schools Act was signed which enacted the Missouri
Assessment Program to create a new assessment system based on performance. Missouri
teachers, congressmen, and community members met to establish standards and write an
assessment aligned to those standards. Professional development for teachers was

101
provided to orient teachers to performance assessment. The first test was administered in
1997 (“Missouri Assessment,” 2006).
In 2001, when the No Child Behind Act passed congress, Missouri changed its
testing to align with NCLB. Students were tested every year from grades three to eight in
mathematics and communication arts. The old standards and the test to go with it were
revised. Sanctions were put in place to encourage all districts to strive to improve student
learning as measured by the MAP assessment (“Missouri Assessment”, 2006). High-
stakes testing had come to Missouri.
The Northwest Evaluation Association (NWEA) produced a computer-adaptive
test that many districts were using along with the state mandated test. The Measures of
Academic Progress (MAP) was adopted by five school districts in Missouri, one of which
was the district in the research study. This middle sized, rural Missouri school was giving
the test twice a year, spring and fall. This test had some advantages over the Missouri
Assessment Program. First, questions were provided to students that were both higher
and lower than grade level, adjusting to keep the student appropriately challenged, while
Missouri’s MAP test was composed of grade level questions. Second, NWEA MAP
could measure academic growth of a student from semester to semester or year to year.
MO MAP only told if the student was at grade level for that year. Third, scores from the
NWEA MAP test were available in a timely manner, two days after the test, while scores
from the MO MAP were available four months later. The new school year had begun
before last year’s results had arrived. Fourth, NWEA MAP scores were scaled RIT
scores. One year’s scores could be compared with the last year’s scores because they
were scored in Rasch units (RIT) that remain the same from year to year (Woodfield,

102
2002; Stokes, 2005). MO MAP scores only provided a score that related to the individual
test given and grade level expectations for that test. Drawbacks to computer adaptive
testing were that students could not return to questions to change answers and some
students are not comfortable on computers (Olson, 2002).
Could the NWEA MAP help teachers increase student learning as measured on
the MO MAP required annual assessment? Were there any scores or subscores on the
NWEA MAP test that could prove diagnostic for teachers after the fall testing, to help
teachers prepare for the required MO MAP assessment in the spring? These were all
questions that begged to be investigated.
Findings
There were three research questions, each with four/five questions within the
main question. The three main research questions corresponded to three sections of
testing with the Northwest Evaluation Association’s Measures of Achievement computer
adaptive test. Those sections were: mathematics, reading, and language usage. Scores on
those three tests were compared with scores on the Missouri Achievement Program’s
mathematics and communication arts assessment. The four/five questions within each
main question corresponded to subscores within each NWEA MAP test. These were all
regressed with the corresponding score on the MO MAP assessment. A bivariate linear
regression was conducted on the overall score as well as on the subscores. A forward
multiple regression was then performed on the three sets of subscores to see if all of the
scores were increasing the predictive value of the predictor variable.
In question one, the scores of the NWEA MAP mathematics test were compared
to the MO MAP mathematics test, looking for predictive value of the former on the latter.
The bivariate regressions on each score provided scatterplots that demonstrated that all

103
predictor variables were positively related to the criterion variables i.e., as the predictor
variable increased, the criterion variable increased. The bivariate regression also
suggested that data and probability was the most predictive subscore, accounting for 55%
of the variance of the criterion variable. Measurement was the next best predictor,
accounting for 54% of the variance, geometric relationship the next accounting for 53%,
number and operations accounting for 52%, and lowest was algebraic relationships,
accounting for 49%. The overall score, which was a combination of all of the subscores,
accounted for 68% of the variance of the criterion variable. The forward multiple
regression showed that the addition of predictor variable, beginning with data and
probability increased the predictive value on the criterion variable. The regression did not
exclude any variable. The regression suggested that data and probability had the highest
predictive value and algebraic relationships had the lowest.
Predictive value is also addressed in Question Two. The overall score and
subscores of the NWEA MAP reading test were compared with the MO MAP
communication arts scores. The bivariate scatterplots indicated a positive, linear
relationship between the NWEA MAP scores, both the overall and the subtest scores with
the MO MAP communication arts score. The overall score explained 63% of the variance
of the MO MAP score. The strategies for reading process explained 51% of the variance,
comprehend/analyze literature explained 50% of the variance, comprehend/analyze
explained 49.6% of the variance, and skills for reading process explained 47.9% of the
variance of the MO MAP communication arts score. The forward multiple regression
showed increased predictability with the addition of each predictor variable, strategies for
reading process, skills for reading process, comprehend/analyze literature,

104
comprehend/analyze nonfiction. The regression did not exclude any variable. Although
all predictor variables were significant, the regression model suggested that strategies for
reading process had the highest predictive value and comprehend/analyze nonfiction had
the lowest predictive value.
In looking for predictive power of the NWEA MAP language usage scores and
subscores on the MO MAP communication arts scores, question 3 was answered in a
similar way as the other two research questions. The bivariate scatterplots showed a
positive linear relationship. The bivariate regression showed that the overall language
usage score accounted for 63% of the variance of the MO MAP communication arts
score. The subscores, apply writing process explained 63% of the variance, forms and
types of writing explained 50% of the variance, capitalization and punctuation explained
47.4% of the variance, and parts of speech/spelling/sentence structure explained 46.7% of
the variance. The forward multiple regression did not exclude any of the predictor
variables. All variables were significant and increased the predictive power as new
variables were added to the regression. The regression suggested forms and types of
writing to be the most predictive, with parts of speech/spelling/sentence structure as the
least predictive.
Limitations
This study was limited to one, rural, medium sized school district. Even though
N=800-900 for each regression, studies in the other five districts in Missouri who have
adopted the NWEA MAP test are needed to confirm the results. Larger and smaller
districts cannot be assumed to have similar results.

105
The district studied has a large fluctuation in population. About 20% of student
data was not utilized because testing had not been completed for both tests. Two reasons
explain this: students move in or out during the school year, and diligence to require
students to complete testing after an absence is not always present. Nothing can be done
about students who move in and out, but more diligence can be applied to require
students who are in the district to complete the entire battery of tests.
Implications for Practice
Since NWEA MAP was given in the fall and MO MAP was given in the spring,
the NWEA MAP could be used as a diagnostic tool for curriculum planning to increase
student learning as measured by the MO MAP. But does the cost of the computer
adaptive testing balance the predictive power of the test?
The cost of the test does not stop with the purchase of the test from the Northwest
Evaluation Association. There was the cost of the computer labs needed to give the test.
One of the drawbacks of using more than one test to measure student achievement was
that the combined testing takes so much time out of the actual classroom learning time
(Kuhm, 2007). At least one computer lab with enough computers for a whole class to
take the test at one time would be a necessity. Two computer rooms would be even better.
Otherwise, the time involved for testing would be extended. Many districts are feeling the
economic crunch and must consider the hidden cost of this test carefully.
Another hidden cost is the cost of computer training for students. In order for
students to be comfortable with a computer adaptive test, students must be experienced
on the computer (Olson, 2002). Even though it is hard to imagine students in this
computer age without exposure to computers, there are students, especially in elementary

106
and middle school who do not have a computer at home and need computer instruction at
school.
Students with disabilities might be at a disadvantage because of the sight tracking
of questions on the computer screen. Students who are not comfortable with a computer
might be at a disadvantage in taking the test and not score as well as they could with the
more common paper and pencil test (Olson, 2002).
With the desire to enhance a school district’s curriculum, adopting a computer
adaptive test must be balanced with the obvious and the hidden costs of the test. Some
districts are further ahead at providing computer services and training for their students
and so the additional diagnostic information made available by the NWEA MAP test may
be a good choice. Other districts may find the costs prohibitive.
Implications for Research
In this study two years worth of data from grades six, seven, and eight was
utilized. The NWEA MAP test is a consistent test. Questions that have been entered into
the test bank that spans the K-12 grade levels, so that each time a student takes the test,
the student answers determine the next questions the test presents. The MO MAP
assessment changes each year and each grade level have different questions. The state of
Missouri is constantly employing teachers to write questions (“Missouri Assessment”,
2006). As a result the test was bound to change in emphasis occasionally, even though it
was guided by the Grade Level Expectations. Because the MO MAP is not a static test
and changes every year, more research needs to be conducted to ensure the predictive
power of the NWEA MAP test on the MO MAP assessment. Since NWEA MAP is fairly
new in Missouri, research across grade levels would be more productive than research
across years.

107
Questions raised for further research are: Since the MO MAP changes from year
to year, does the predictive power hold up when each grade level across the state for one
year are compared? Are teachers in the five Missouri districts that have implemented this
computer adaptive test using the test as a diagnostic tool to enhance student learning? Do
similar studies to this one, but conducted in different years or different grade levels
support these results?
The NWEA MAP is a popular test in states other than Missouri (Woodfield,
2003). All states have required annual testing (Goertz, 2005). NWEA conducts alignment
analysis to see if their test meets state standards (Northwest Evaluation Association,
2005). However a research study such as this one guarantees that results from both the
NWEA MAP and required state tests are correlated. Knowing which subtest is the best
predictor gives both district and state information to guide curriculum to better prepare
students for the required tests. If student learning can be measured by the required state
tests, then knowing in September in what areas a teacher needs to direct curriculum then
student learning can definitely be influenced by the NWEA MAP tests.
Just giving students another test is counterproductive unless it serves a purpose. If
educators can use the test to increase student learning as measured by required state
testing, then it is serving an important purpose.

108
Appendix
Scatterplots for Bivariate Linear Regressions
Figure 1
Scatterplot for MO MAP Mathematics Score and NWEA MAP Mathematics RIT Score

109
Figure 2
Scatterplot for MO MAP Mathematics Score and NWEA MAP Number and Operations RIT Score

110
Figure 3
Scatterplot for MO MAP Mathematics Score and NWEA MAP Algebraic Relationships
RIT Score

111
Figure 4
Scatterplot for MO MAP Mathematics Score and NWEA MAP Geometric Relationships
RIT Score

112
Figure 5
Scatterplot of MO MAP Mathematics Score and NWEA MAP Measurements RIT Score

113
Figure 6
Scatterplot of MO MAP Mathematics Score and NWEA MAP Data & Probability RIT
Score

114
Figure 7
Scatterplot of MO MAP Communications Arts Score and Language Usage RIT Score

115
Figure 8
Scatterplot of MO MAP Communications Art Score and Language Usage—Parts of
Speech/Spelling/Sentence Structure RIT Score

116
Figure 9
Scatterplot of MO MAP Communication Arts Score and NWEA MAP Language Usage—
Forms and Types of Writing

117
Figure 10
Scatterplot for MO MAP Communication Arts Score and NWEA MAP Language Usage—
Apply Writing RIT Score
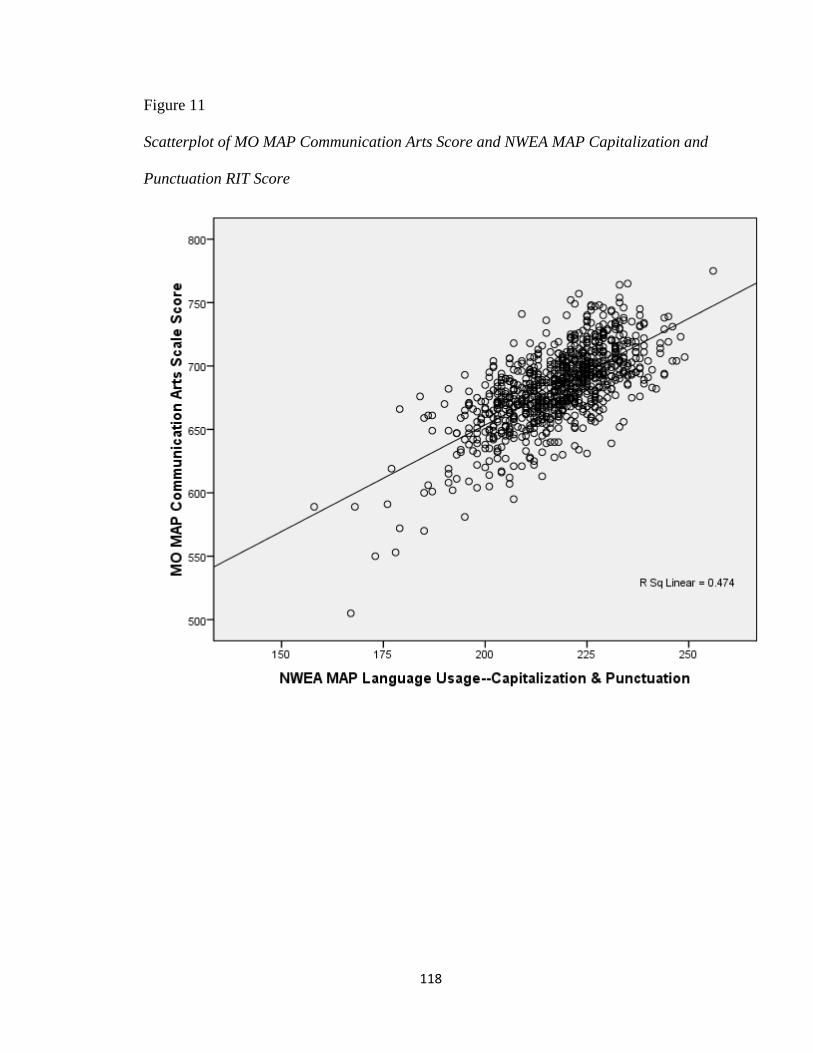
118
Figure 11
Scatterplot of MO MAP Communication Arts Score and NWEA MAP Capitalization and
Punctuation RIT Score

119
Figure 12
Scatterplot for MO MAP Communication Arts Score and NWEA MAP Reading RIT
Score

120
Figure 13
Scatterplot of MO MAP Communication Arts Score and NWEA MAP Apply Writing
Process RIT Score

121
Figure 14
Scatterplot of MO MAP Communication Arts Score and NWEA MAP Strategies for
Reading Process RIT Score

122
Figure 15
Scatterplot of MO MAP Communication Arts Score and NWEA MAP
Comprehend/Analyze Literature RIT Score

123
Figure 16
Scatterplot of MO MAP Communication Arts Score and NWEA MAP
Comprehend/Analyze Non-Fiction RIT Score

124
References
American Evaluation Association position statement on high-stakes testing in preK-12
education. American Evaluation Association. Retrieved March 30, 2002, from
http://www.eval.org/hst3.html
Amrein, A. L., & Berliner, D. C. (2002a). An analysis of some unintended and negative
consequences of high-stakes testing. Retrieved December 1, 2007, from
http://www.greatlakescenter.org/pdf/H-5%20Analysis%20final.pdf
Amrein, A. L., & Berliner, D. C. (2002b). High-stakes testing, uncertainty, and student
learning. Education Policy Analysis Archives, 10. Retrieved December 13,
2005, from http://epaa.edu.epaa.v10on18
Baines, L. A., & Stanley, G. K. (2004). High stakes hustle: public schools and the new
billion dollar accountability [Electronic version]. The Education Forum, 69, 8-15.
Ballou, D. (2002). Sizing up test scores. Education Next. Retrieved January 21, 2006,
from www.educationnext.org/2002/10.html
Bartlett, J. E., II, Kotrlik, J. W., & Higgins, C. C. (2001). Organizational research:
Determining appropriate sample size in survey research. Information
Technology, Learning, and Performance Journal, 19, 43-50.
Berube, C. T. (2004). Are standards preventing good teaching [Electronic version]? The
Clearing House, 77, 264-267.
Bolman, L. G., & Deal, T. (1997). Reframing organizations. San Francisco: Jossey-Bass
Publishers.

125
Callahan, S., & Spalding, E. (2006). Can high-stakes writing assessment support high
quality professional development [Electronic version]. The Education Forum, 70,
337-350.
Carnoy, M., & Loeb, S. (2002). Does external accountability affect student outcomes?
Educational Evaluation and Policy Analysis, 24, 305-331.
Carpenter, S. (2001). The high stakes of educational testing. Monitor on Psychology, 32.
Retrieved December 13, 2005, from
http://www.apa.org/monitor/may01/edtesting.html
Christenson, S., Nelson, J. R., & Yseldyke, J. (2004). What we need to know about the
consequences of high-stakes testing for students with disabilities. Exceptional
Children, 71, 75-95.
Christie, K., & Wanker, W. P. (2005). State implementation of the No Child Left Behind
Act. Peabody Journal of Education, 80, 57-72.
CTB/McGraw-Hill. (2006). Missouri Assessment Program Technical Support. Monterey,
CA: Author.
Dallal, G. E. (2007a). Introduction to simple linear equations from The Little Handbook
of Statistical Practice. Boston, MA: Tufts University. Retrieved October 9, 2007,
from http://www.tufts.edu/~gdallal/slr.htm
Dallal, G. E. (2007b). Simplifying a multiple Regression Equation from The Little
Handbook of Statistical Practice. Boston, MA: Tufts University. Retrieved
October 9, 2007, from http://www.tufts.edu/~gdallal/simplify.htm
126
Eccles, J. S., Wigfield, A., Midgley, C., Reuman, D., Mac Iver, D., & Feldlaufer, H.
(1993). Negative effects of traditional middle schools on students’ motivation.
The Elementary School Journal, 93, 553-574.
Elmore, R.,& Furhman, S. (2001). Holding schools accountable: Is it working? Phi Delta
Kappan, 83, 67-72.
Firestone, W. A., Fitz, J., & Broadfoot P. (1999). Power, learning, and legitimation:
Assessment implementation across levels in the United State and the United
Kingdom [Electronic version]. American Educational Research Journal, 36, 759-
793.
Fisher, D., & Ivey, G. (2006). Evaluating the interventions for struggling adolescent
readers. Journal of Adolescent and Adult Literacy, 50, 180-189.
Forgione, P. D., Jr. (1999). The National Assessment of Educational Progress (NAEP)
1998 report card for the nation and the states. National Center for Educational
Statistics. Retrieved September 27, 2007, from
http://nces.ed.gov/Pressrelease/statenaep.asp
Fowler, F. C. (2004). Policy studies for educational leaders. Upper Saddle River, NJ:
Pearson.
Fraenkel, J. R., & Wallen, N. E. (2003). How to design and evaluate research in
education. Boston: McGraw-Hill.
French, D. (2003). A new vision of authentic assessment to overcome the flaws in high-
stakes testing [Electronic version]. Middle School Journal, 35, 14-23.
Garson, G. D. (2007). Multiple regression. Retrieved September 27, 2007, from
http://www2.chass.ncsu.edu/grson/pa765/regress.htm

127
Goertz, M. (2005). Implementing the No Child Left Behind Act: Challenges for the
states. Peabody Journal of Education, 80, 73-89.
Goertz, M., & Duffy, M. (2003). Mapping the landscape of high-stakes testing and
accountability programs. Theory into Practice, 42. Retrieved January 2, 2006,
from http://sas.epnet.com/citation.asp
Goycochea, B. B. (1997). Rich school, poor school [Electronic version]. Educational
Leadership, 55, 30-33.
Groves, P. (2002). Doesn’t it feel morbid hear [Electronic version]? Educational
Foundations, 16, 15-31.
Gunzenhauser, M. C. (2003). High-stakes testing and the default philosophy of Education
[Electronic version]. Theory into Practice, 42, 176-185.
Guthrie, J. W., & Springer, M. G. (2004). A nation at risk revisited: Did “wrong”
reasoning result in “right” results? At what cost? Peabody Journal of Education,
79, 7-35.
Harter, S. (1981). A new self-report scale in intrinsic versus extrinsic orientation in the
classroom: Motivational and informational components. Developmental
Psychology, 17, 300-312.
Horn, C. (2003). High-stakes testing and students: Stopping a perpetuating cycle of
Failure [Electronic Version]? Theory into Practice, 42, 30-41.
Hoyt, W. T., Leier, S., & Millington, M. J. (2006). Analysis and interpretation of findings
using multiple regression techniques. Rehabilitation Counseling Bulletin, 49, 223-
233.

128
Jerry, L., & Lutkus, A. (2003). The nation's report card: State reading 2002. Report for
Missouri. NCES 2003-526 MO.
Johnson, J. A., Dupuis, V. L., Musial, D., Hall, G. E., & Gollnick, D. M. (1996).
Introduction to the Foundations of American Education. Boston: Allyn and
Bacon.
Joles, C. (2003). Accountability and access to opportunity: Mutually exclusive tenets
under a high-stakes testing mandate [Electronic version]. Preventing School
Failure, 47, 86-91.
Kohn, A. (2000). Standardized testing and its victims. Education Week, 20, 60-
63.
Kuhm, G. (2007). The great American pastime: High-stakes testing [Electronic version].
School Science and Mathematics, 107, 84-85.
Lee, J. (2006). Input-guarantee vs. performance-guarantee approaches to school
accountability: Cross state comparisons of policies, resources, and outcomes
[Electronic version]. Peabody Journal of Education, 81, 43-64.
Leftkowitz, L., & Miller, K. (2006). Fulfilling the promise of the standards movement.
Phi Delta Kappan, 87, 403-407.
Lenters, K. (2006). Resistance, struggle, and the adolescent reader. Journal of Adolescent
and Adult Literacy, 50, 136-146.
Lewis, A. C. (2002). A horse called NCLB. Phi Delta Kappan, 84, 179-180.
Massell, D., Kirst, M., & Hoppe, M. (1997). Persistence and change: Report on standards
based reform in nine states. (ERIC Document Reproduction Service No. ED
407732)

129
McAdams, D. R. (2002). Enemy of the good. Education Next, 2, 1-3.
McDermott, K. A. (2003). What causes variation in state’ accountability policies?
Peabody Journal of Education, 78, 153-176.
Mintrop, H., & Trujillo, H. (2005). Corrective action in low-performing schools: Lessons
for NCLB implementation from state and district strategies from first-generation
accountability systems. Los Angeles: Center for the Study of Evaluation. (ERIC
Document Reproduction Service No. ED483408)
Missouri Department of Elementary and Secondary Education. (1986). Core
Competencies and Key Skills for Missouri Schools. Retrieved September 4,
2007, from http://dese.mo.gov.divimprove/assess/tech
Missouri Department of Elementary and Secondary Education. (2005). Questions and
answers about No Child Left Behind: 2005 update. Retrieved November 29, 2007,
from http://www.dese.mo.gov/divimprove/nclb/QandA.html
Missouri Department of Elementary and Secondary Education. (2007a). News Release,
41, 59. Retrieved September 27, 2007, from
http://dese.mo.gov/news/2007/naep.htm
Missouri Department of Elementary and Secondary Education. (2007b). Preliminary
Adequate Yearly Progress. Retrieved September 27, 2007 from
http://dese.mo.gov/planning/profile/apr/ayp1040443000.html
Missouri Department of Elementary and Secondary Education. (2007c). Update 2007:
The Missouri Assessment Program. Retrieved October 2, 2007, from
http://dese.mo.gov
Montague, D. (2000). Is your testing on the level? Multimedia Schools, 7, 56-59.

130
Morgan, G. (1997). Images of organization. Thousand Oaks, CA: Sage Publications.
National Assessment of Educational Progress. (2005). The Nation’s Report Card.
Retrieved September 20, 2007, from http://nationsreportcard.gov/
National Assessment of Educational Progress. (2007). NAEP overview. Retrieved
November 29, 2007, from http://nces.ed.gov/nationsreportcard/about/
National Center for Educational Statistics. (2005). The nation’s report card: State reading
2005. Retrieved September 20, 2007, from
http://nces.ed.gov/nationsreportcard/states/profile.asp
National Education Goals Panel. (1999). Building on the momentum. Retrieved
August 28, 2007, from http://govinfo.library.unt.edu.negp
National Forum to Accelerate Middle-Grades Reform. (2002). High-stakes testing policy
statement, issue 3. Retrieved October 4, 2007, from
http://www.mgforum.org/Policy/highstakes/page1.htm
No Child Left Behind Act of 2001, Pub. L. 107-110, 115 Stat. 1425 (2002).
Northwest Evaluation Association. (n. d.). NWEA position statement on the
reauthorization of “No Child Left Behind”. Retrieved September 1, 2007, from
http://www.nwea.org/about/nclb.aspx
Northwest Evaluation Association. (2003). Technical Manual for the NWEA Measures of
Academic Progress and Achievement Level Tests. Retrieved October 23, 2007,
from http://nwea.org
Northwest Evaluation Association. (2004). Reliability and validity estimates: NWEA
achievement level tests and Measures of Academic Progress. Retrieved
October 1, 2007, from http://www.nwea.org

131
Northwest Evaluation Association. (2005). Measures of academic progress (MAP)
Missouri state-aligned version 3. Retrieved October 1, 2007, from
http://www.nwea.org
Northwest Evaluation Association. (2007a). Research-based accuracy. Retrieved
September 1, 2007, from http://nwea.org/assessments/researchbased.asp
Northwest Evaluation Association. (2007b). State information. Retrieved October 4,
2007, from http://www.nwea.org/research/state.asp
Olson, A. (2002). Technology solutions for testing. School Administrator, 59, 20-23.
Osterlind, S. J. (n. d.). Missouri Mastery and Achievement Tests. Columbia, MO:
University of Missouri, Center for Educational Assessment.
Outstanding Schools Act, Missouri Senate Bill 380, Sections 160.514, 160.518, 160.522,
160.526 (1993).
Patton, M. Q. (1997). Utilization-focused evaluation. Thousand Oaks, CA: Sage
Publications.
Peterson, P. E., & Hess, F. M. (2005). Johnny can read . . . Assessing the rigor of state
assessment systems. Education Next, 5, 52-53.
Peterson, P. E., & Hess, F. M. (2006). Keeping an eye on state standards. Education Next,
6, 28-29.
Primont, D., & Domazlicky, B. (2006). Student achievement and efficiency in Missouri
schools and the No Childs Left Behind Act. Economics of Education Review,
25, 77-90.
Ritter, G. W., & Lucas, C. J. (2003). Puzzled States. Education Next, 3, 54-61.

132
Roediger, R. (2004). What happened to behaviorism? APS Observer, 17. Retrieved
August 26, 2007, from http://www.behavior.org/member_roediger.cfm
Schein, E. H. (1992). Organizational culture and leadership (2nd ed.) San Francisco:
Jossey Bass.
Seidman, E., Allen, L., Aber, J. L., Mitchell, C., & Feinman, J. (1994). The impact of
school transitions in early adolescence on the self-system and perceived social
context of poor urban youth. Child Development, 65, 507-522.
Shepard, L. A. (2002). The hazards of high stakes testing. Issues of Science and
Technology Online. Retrieved January 21, 2006, from
www.issues.org/issues/19.2/shepard.htm
Sloan, F. C., & Kelly, A. E. (2003). Issues in high-stakes testing programs [Electronic
Version]. Theory into Practice, 42, 12-14.
Steeves, K. A., Hodgson, J., & Peterson, P. (2002). Are we measuring student success
with high-stakes testing? The Educational Forum, 66, 228-235.
Stokes, V. (2005). No longer a year behind. Learning and Leading with Technology, 33,
15-17.
Strauss, J. D. (n. d.). Logical Positivism: The Vienna Circle Unity of Science. Retrieved
August 26, 2007, from
www.worldview/resources/strauss/logical/Positivism.htm
Summers, A. (2002). Expert measures. Retrieved January 21, 2006, from
www.educationnext.org/20022/IB.html
Thomas, R. M., & Brubaker, D. L. (2000). Theses and dissertations. Westport, CN:
Bergin and Garvey.
133
U. S. Department of Education. (1983). A nation at risk. Retrieved August 18, 2007, from
http://www.ed.gov.pubs/NatAtRisk/index.html
U. S. Department of Education. (2007). Reauthorization of No Child Left Behind:
Questions frequently asked. Retrieved November 29, 2007, from
http://www.ed.gov/nclb/landing.jhtml
U. S. Metric Association (2005). Improving America’s Schools Act of 1994. Retrieved
November 29, 2007, from
http://lamar.colostate.edu/~hillger/laws/schools-94.html
Van Alphen, A., Halphen, R., Hasman, A., & Imbos, T. (1994). Likert or Rasch?
Chicago: Institute for Objective Measurement, Inc. Retrieved September 1,
2007, from http://www.rasch.org/rmt/rmt82d.htm
Van Horn, R. (2003). Computer adaptive tests and computer-based tests. Phi Delta
Kappan, 84. 1-4.
Vogler, K., & Virtue, D. (2007). Just the facts, ma’m: Teaching social studies in the era
of standards and high-stakes testing. The Social Studies, 98, 54-56.
Wall, J. E., Baker, H., & Sampson, J. P., Jr. (2004). Editorial comments for the special
issue on the use of technology in assessment. Measurement and Evaluation in
Counseling and Development, 37, 66-69.
Walker, D. (1990). Fundamentals of curriculum. Saddlebrook, NJ: Harcourt, Brace,
Jonavich, Inc.
Wiersma, W. (2000). Research methods in education (7th ed.). Needham Heights,
MA: Allyn Bacon.

134
WINKS SDA Software (6th ed.). (2007). [Computer Software]. Cedar Hill, TX:
Texasoft. Retrieved October 9, 2007, from
http://www.texasoft.com/winkslr.html
Weiss, C. H. (1998). Have we learned anything new about the use of evaluation?
American Journal of Evaluation, 19, 21-34.
Woodfield, K. (2003). Getting on board with online testing. T.H.E. Journal, 30, 34-37.

135
VITA
Judith Ann Williams Shields was born October 11, 1947 in St. Louis County, Missouri.
She grew up is Overland, Missouri where her mother was a sixth grade school teacher
and father was an electronics engineer. Her family instilled in her a value for education
and a desire to learn new things. One important value of her early life was that a person
can accomplish anything. She graduated in May, 1969 from Abilene Christian College
with a Bachelor of Science in Education, majoring in biology. In August of 1969, she left
the United States of America to journey to Brazil as a missionary in Sao Paulo. She and
her husband worked as missionaries in Sao Paulo, Brazil, East Kilbride, Scotland, and
Lisburn, Northern Ireland. While in Northern Ireland, Ms. Shields also worked for
Lisburn Technical College and Banbridge Technical College teaching life skills classes
and soft furnishing classes.
Upon returning to the United States in 1984, Ms. Shields and her family moved to
Kimberling City, Missouri. Ms. Shields began work for Reeds Spring School District and
worked there for 22 years. She has been a kindergarten aid, special education
paraprofessional; taught introduction to biology and biology, family and consumer
science, seventh grade life science, seventh and eighth grade integrated science. She has
written curriculum for all of those courses and guided other teachers in writing
curriculum. She has presented in-service training to district teachers of increasing student
learning through the Missouri MAP process. She has led a team of teachers for extended
MAP training, and also been involved in question writing and scoring the MAP
assessment. In the summer of 2002, she received training form Glencoe/McGraw Hill in
Sacramento, California, and worked at table leader for science assessment scoring.

136
Ms. Shields graduated from Southwest Baptist University with a Master of Science in
Education in 1998 and from Southwest Missouri State University with a Specialist
Degree in Educational Administration in 2004. She has principal secondary licensure in
Missouri. She has made presentations at the National Science Teachers Association in
New Orleans, at INTERFACE in Missouri, and at the Interdisciplinary Forum at Missouri
State University.
Ms. Shields is married with three children, five grandchildren, and living in Colorado.