a comparison of nga ground-motion prediction...
TRANSCRIPT

A Comparison of NGA Ground-Motion Prediction
Equations to Italian Data
by Giuseppe Scasserra, Jonathan P. Stewart, Paolo Bazzurro, Giuseppe Lanzo,and Fabrizio Mollaioli
Abstract Ground-motion prediction equations (GMPEs) have recently been devel-oped in the Next Generation Attenuation (NGA) project for application to shallowcrustal earthquakes in tectonically active regions. We investigate the compatibilityof those models with respect to magnitude scaling, distance scaling, and site scalingimplied by Italian strong motion data. This is of interest because (1) the Italian data areprincipally from earthquakes in extensional regions that are poorly represented in theNGA dataset, and (2) past practice in Italy has been to use local GMPEs based onlimited datasets that cannot resolve many significant source, path, and site effects.We find that the magnitude scaling implied by the Italian data is compatible with fourNGA relations. However, the Italian data attenuate faster than implied by the four NGAGMPEs at short periods; the differences are statistically significant. Comparison withthe fifth one was not possible because it was developed for rock conditions only. Threeregression coefficients are reevaluated for the four NGA GMPEs to reflect the fasterattenuation: a constant term, a term controlling the slope of distance attenuation, and asource fictitious depth term. The scaling of ground motion with respect to site shearwave velocity is consistent between the NGA models and Italian data. Moreover, thedata are found to contain a nonlinear site effect that is generally compatible with NGAsite terms. The intraevent scatter of Italian data is higher than in the NGA models,although interevent scatter is comparable to NGA recommendations when the fasterdistance attenuation is considered. On the basis of these findings, we recommendusing the NGA relations, with the aforementioned minor modifications, to evaluateground motions for seismic hazard analysis in Italy.
Introduction
The characterization of earthquake ground motions forengineering applications generally involves the use of em-pirical models referred to as ground-motion prediction equa-tions (GMPEs). Ground-motion prediction equations describethe variation of the median and lognormal standard deviationof intensity measures (such as peak acceleration, spectral ac-celeration, or duration) with magnitude, site-source distance,site condition, and other parameters. A review of GMPEs forpeak acceleration and spectral acceleration published prior to2006 is given by Douglas (2003, 2006).
In recent years a number of GMPEs have been redefiningthe state of practice for probabilistic seismic hazard analysis(PSHA) in many earthquake-prone regions. For European ap-plications, Ambraseys et al. (2005) and Akkar and Bommer(2007a, b) have introduced GMPEs that are considerably moresophisticated thanwidely used previous relations such asAm-braseys et al. (1996) and Sabetta and Pugliese (1996). TheNext Generation Attenuation (NGA) project developed aseries of GMPEs intended for application to geographically
diverse regions; the only constraint is that the region be tec-tonically active with earthquakes occurring in the shallowcrust. The NGA GMPEs are presented by Abrahamson andSilva (2008), Boore and Atkinson (2008), Campbell and Bo-zorgnia (2008), Chiou and Youngs (2008), and Idriss (2008).
An important issue for many practical applications iswhether ground motions or GMPEs for one region can beapplied to another. For example, this issue prompted consider-able study for the Senior Seismic Hazard Analysis Com-mittee Level 4 PSHA (Budnitz et al., 1997) performed for thePEGASOS project in Switzerland (Abrahamson et al., 2002).The subject region for the PEGASOS project had relatively fewground-motion recordings; hence, GMPEs were borrowedfrom other areas for use in PSHA. Cotton et al. (2006) describehow source characteristics, path effects related to geometricspreading and anelastic attenuation, and site effects can varyfrom region to region. Those underlying physics ideallyshould be manifest in how a GMPE represents the scalingof a particular ground-motion intensity measure (IM) with
2961
Bulletin of the Seismological Society of America, Vol. 99, No. 5, pp. 2961–2978, October 2009, doi: 10.1785/0120080133

respect to magnitude, distance, and site condition. Thoseissues are explored subsequently in this article.
The database used to develop the NGA GMPEs is large(3551 recordings from 173 earthquakes; subsets used for par-ticular GMPEs) relative to those developed for relatively localregions, as is common in Europe. As mentioned previously,the NGA database is international, with most recordings de-rived from Taiwan, California, and Europe/Turkey (Chiouet al., 2008). As noted by Stafford et al. (2008), because ofthe large size and high quality of the NGA database, certaineffects arewell resolved in some of the NGAGMPEs that couldnot be evaluated using only Italian (or European) data. Exam-ples include the effects of depth to top of rupture and nonlinearsite response. The NGA data also provide the opportunity toconstrain relatively complex functional forms for magnitudeand distance scaling as compared with models typically usedin Europe, as described subsequently in this article.
Because of the relative sophistication of the NGAGMPEs,it is of interest to evaluate whether they can be applied inspecific geographic regions such as Italy. This issue has beenexamined in a number of previous studies, the results of whichare summarized in thenext section.Ourobjective is to examinethis issue by specifically testing the ability of the NGAmodelsto capture the magnitude scaling, distance scaling, and siteeffects represented in the Italian dataset. This testing is ofinterest for two reasons: (1) to evaluate whether it is appropri-ate to apply NGA GMPEs for PSHA in Italy and elsewhere inEurope and (2) to check NGAGMPEs against a dataset princi-pally populated by extensional (normal fault) earthquakes,which are poorly represented in the NGA database.
Our focus on Italian data is a matter of convenience; itdoes not reflect any opinion that ground motions should beexamined on the basis of political boundaries. Our focus onItaly is predicated on the reevaluation of the Italian datasetaccording to standards similar to those used for the NGAdatabase presented by Scasserra et al. (2009).
Recent Studies Comparing European and CaliforniaStrong Ground Motions
Three general approaches have been used to compareground motions or GMPEs between regions: (1) direct com-parison of median predictions of particular IMs from GMPEsfor different regions (Campbell andBozorgnia, 2006; Staffordet al., 2008); (2) analysis of variance (Douglas, 2004a, b); and(3) evaluation of the consistency of data distributions with re-spect to aGMPE (Scherbaum et al., 2004; Stafford et al., 2008)using likelihood concepts.
Comparison of Medians from GMPEs
Figure 1 shows an example of the first approach. Esti-mates of peak horizontal acceleration (PHA) and 5% dampedpseudo-spectral acceleration at 2.0 sec from the Akkar andBommer (2007a) and Ambraseys et al. (2005) models arecompared with those from the NGA models of Abrahamsonand Silva (2008), Boore and Atkinson (2008), Campbell andBozorgnia (2008), and Chiou and Youngs (2008). As shownby Campbell and Bozorgnia (2006) and Stafford et al. (2008),the European and NGA predicted medians generally comparewell over the range of distances and magnitudes well con-strained by the data. The bands of results for the two magni-tudes generally show reasonably consistent vertical offsetsfrom model to model (e.g., the difference between M 7 and5 peak ground acceleration (PGA) at Rjb ! 30 km is reason-ably consistent across models). This suggests generally con-sistent levels of magnitude scaling. The slopes of the medianPGA curves for a givenmagnitude are generally steeper for theEuropean relations than the NGA relations, suggesting fasterdistance attenuation. This potential difference in the distanceattenuation was not noted by Campbell and Bozorgnia (2006)and Stafford et al. (2008).
Figure 1. Comparison of median predictions of average horizontal component of peak ground acceleration (PGA) and 2.0 sec pseudo-spectral acceleration for strike-slip earthquakes and soft rock site conditions from NGA and European GMPEs. Assumed condition is ver-tically dipping fault with zero depth to top of rupture, for which R ! Rjb. AS: Abrahamson and Silva (2008); BA: Boore and Atkinson(2008); CB: Campbell and Bozorgnia (2008); CY: Chiou and Youngs (2008); ADSS: Ambraseys et al. (2005); AB: Akkar and Bommer(2007a). Ambraseys et al. (2005) median values adjusted from maximum component to average horizontal per Beyer and Bommer (2006).
2962 G. Scasserra, J. P. Stewart, P. Bazzurro, G. Lanzo, and F. Mollaioli

Analysis of Variance
The approach termed analysis of variance was appliedby Douglas (2004a) to compare ground motions for five localregions within Europe; Douglas (2004b) compared groundmotions from Europe, New Zealand, and California. Theprocedure involved calculating the mean (!) and variance("2) of the log of data inside particular magnitude and dis-tance bins (M-R bins) for two different regions (e.g., Europeand California) and combined data for those regions. Thedistance metric used by Douglas was the closest distanceto the surface projection of the fault forM >6 and epicentraldistance otherwise. Individual data points were adjusted for alinear site factor from Ambraseys et al. (1996) before thecalculation of mean and variance. These results were thenused in two ways. First, for a given M-R bin and pair of re-gions, the variance of the combined data for both regions[termed ""2#interregion] was compared to the within-region var-iance [termed ""2#intraregion] using statistical tests that evalu-ated whether the datasets were significantly distinct. If""2#interregion > ""2#intraregion in a statistically significant way,there were likely to be significantly different means betweenregions. Second, the binned results were used to plot meansfor each M-R bin together for pairs of regions.
Using this approach, Douglas (2004a) found similar var-iances for the various regions in Europe, indicating a lack ofregional variations. Accordingly, Douglas (2004b) combinedall of the European data into a single category for comparisonwith the New Zealand and California data. The Europe–California comparisons indicated that approximately half ofthe M-R bins demonstrated significantly different inter- andintraregion variances. The distinction was toward largerground motions in California (Douglas, 2004b). Carefulanalysis of figure 1 of Douglas (2004b) indicates that theCalifornia and European means for most M-R bins havesimilar amplitudes in short distance bins (<20 km), whereasCalifornia amplitudes are larger at larger distances (>30 km).Thus, Douglas’s (2004b) finding of larger California groundmotions could be alternatively expressed as more rapid dis-tance attenuation in Europe. Offsets between California andEuropean means within a given well-populated distance cate-gory (e.g., 10–15 km) do not vary significantly across magni-tude bins, suggesting similar levels of magnitude scaling.
Overall Goodness-of-Fit of Model to Data
This approach, developed by Scherbaum et al. (2004),provides an evaluation of overall goodness-of-fit of a GMPEto a dataset. A normalized residual is calculated for recordingj from event i in a dataset
ZT;ij !ln"IMobs;ij# $ ln"IMmod;ij#
"T; (1)
where ln"IMobs;ij# represents the IM value from the record;ln"IMmod;ij# represents the median model prediction for thesame magnitude, site-source distance, and site condition ofthe record; and "T represents the total standard deviation of
the model (combination of inter- and intraevent standarddeviations). If the data are unbiased with respect to the modeland have the same dispersion, the normalized residuals (ZT)should have zero mean and standard deviation of one (i.e.,the properties of the standard normal variate). Accordingly,in simple terms, the procedure of Scherbaum et al. (2004)consists of comparing the actual ZT distribution to that of thestandard normal variate. Note that this procedure tests bothmisfit of the median and standard deviation.
Stafford et al. (2008) extended this method to consid-er both inter- and intraevent variability. They comparedEuropean data to the NGA relation of Boore and Atkinson(2008) and the European models of Ambraseys et al. (2005)and Akkar and Bommer (2007a, b). The Boore and Atkinson(2008) relation was shown to match the median of theEuropean data nearly as well as European GMPEs. The Booreand Atkinson standard deviation, however, was lower thanvalues from the European relations. This discrepancy wasattributed to the magnitude dependence of the EuropeanGMPE standard deviation models, whereas the Boore andAtkinson standard deviation was homoscedastic (constantwith respect to magnitude).
Interpretation
It should be emphasized that the Scherbaum et al.(2004) approach assesses model performance in an overallsense. All aspects of the model (magnitude scaling, distancescaling, site effects) are evaluated in a lumped manner. If oneof these model components was in error, that effect could beobscured through compensating errors in the analysis of nor-malized residuals. Accordingly, while the results of Staffordet al. (2008) are certainly promising with respect to the ap-plication of NGA relations in Europe, they do not specificallyaddress whether individual components of the NGA modelsare adequate with respect to European data. Because there issome evidence of faster distance attenuation of Europeandata relative to California data (Douglas, 2004b) and activeregions generally (Fig. 1), a formal analysis of the adequacyof the NGA relations with respect to magnitude scaling, dis-tance scaling, and site effects is needed. We address theseissues in the remainder of this article.
Attributes of NGA and European Ground-MotionPrediction Equations
GMPEs are formulated with varying degrees of complex-ity in their functional form as a result of author preference anddatabase size. The NGA models include two relatively simplemodels (Boore and Atkinson, 2008; Idriss, 2008) and threemore complex models (Abrahamson and Silva, 2008; Camp-bell and Bozorgnia, 2008; Chiou and Youngs, 2008). Attri-butes of the NGA models and several European relationswith respect tomagnitude, distance, andVS30 scaling are sum-marized in this section. The European models considered areAmbraseys et al. (2005) and Akkar and Bommer (2007a).
A Comparison of NGA Ground-Motion Prediction Equations to Italian Data 2963

Magnitude scaling varies from linear (Idriss, 2008;Ambraseys et al., 2005) to nonlinear functions expressedas second-order polynomials (Abrahamson and Silva, 2008;Boore and Atkinson, 2008; Akkar and Bommer, 2007a),piecewise linear relations (Campbell and Bozorgnia, 2008),and bilinear relations with smooth transitions (Chiou andYoungs, 2008). As shown in Stewart et al. (2008), the varia-tion with magnitude of PGA and T ! 2:0 sec 5% dampedspectral acceleration are similar for the NGA and EuropeanGMPEs at a site-source distance of 30 km.
Table 1 shows the forms of the distance-attenuationfunctions in the selected GMPEs. Many of the models (Abra-hamson and Silva, 2008; Campbell and Bozorgnia, 2008;Akkar and Bommer, 2007a; Ambraseys et al., 2005) use arelatively simple form consisting of the product of a linearfunction of magnitude and the natural log of the square rootof sum of squares of distance and a fictitious source depthterm (denoted byh in Table 1). The linear term accounts forthe decrease of attenuation with increasing magnitude (theintercept is negative and the coefficient for the change ofslope with magnitude is positive). The Chiou and Youngs(2008) model produces a similar trend using a magnitude-dependent fictitious depth. The Chiou and Youngs (2008)model also accounts for the variation of distance attenuationwith distance to capture the dominant effects of body wavesat distances <40–70 km and Lg waves at larger distances.The Boore and Atkinson (2008) model has a similar changeof rate of attenuation in this distance range, which is attrib-uted to anelastic attenuation. Additional anelastic attenuationterms (represented by #"M#) are included by Chiou andYoungs (2008) and Idriss (2008). Figure 1 compares the dis-tance attenuation of NGA and European models. As notedpreviously, the slopes from European models are slightlygreater. Among the NGA models, the steepening of the slopeof the median curve for PGA at distances exceeding about70 km is apparent in Figure 1 from the Boore and Atkinson(2008) and Chiou and Youngs (2008) models, whereas theAbrahamson and Silva (2008) and Campbell and Bozorgnia(2008) slopes at large distance are constant. Also noteworthyare the relative slopes in the 10–70 km distance range, wheremuch of the data lie. In this range, the steepest slope is Chiouand Youngs (2008), the flattest is Boore and Atkinson(2008), while Abrahamson and Silva (2008) and Campbelland Bozorgnia (2008) are intermediate. These differenceshave implications with respect to the Italian data, as discuss-ed subsequently.
The models by Abrahamson and Silva (2008), Campbelland Bozorgnia (2008), and Chiou and Youngs (2008) includehanging wall terms, which account for the larger groundmotions observed on the hanging wall of dipping faults. Asshown in Table 1, a distance parameter used to evaluate thiseffect for the Abrahamson and Silva (2008) and Chiou andYoungs (2008) models is Rx, which is defined in Figure 2.Additional terms used to evaluate hangingwall effects includedepth to top of rupture (Ztor), dip angle ($), and down-dip faultwidth (W).
The site terms utilized in the GMPEs vary in complexity.All NGA models except Idriss (2008) use VS30 as a predictorof site effects. The level of amplification for weak inputmotions (corresponding to nearly linear conditions) increaseswith decreasing VS30. In the Abrahamson and Silva (2008)and Campbell and Bozorgnia (2008) GMPEs, the referencerock parameter used with the nonlinear components of thesite terms is dPGA1100, which is roughly the median peak ac-celeration on rock with VS30 ! 1100 m=sec. (Boore andAtkinson [2008] similarly used PGA on rock with VS30 !760 m=sec.) The Chiou and Youngs (2008) site model re-places dPGA1100 with the median rock spectral accelerationat the period of interest. The slopes of the amplification func-tions relative to dPGA1100 become flatter with increasing VS30.The Ambraseys et al. (2005) and Akkar and Bommer(2007a) site terms are linear and constant for qualitative sitedescriptors (soft soil, stiff soil, rock). In addition to VS30, theAbrahamson and Silva (2008), Campbell and Bozorgnia(2008), and Chiou and Youngs (2008) site models includea basin depth term, which is taken as the depth to a particularshear wave velocity isosurface. The Abrahamson and Silva(2008) and Chiou and Youngs (2008) models take this depthas Z1:0 (depth to VS ! 1:0 km=sec), whereas the Campbelland Bozorgnia (2008) model takes this depth as Z2:5 (depthto VS ! 2:5 km=sec).
We consider each of the GMPEs listed in Table 1 exceptIdriss (2008). That model is excluded due to its lack of a siteterm. A significant fraction of the Italian data has soil siteconditions and, hence, requires the use of a site term.
Database
The database used in this study is presented by Scasserraet al. (2009). The strong motion data were corrected anduniformly processed by the same seismologists (WalterSilva and Robert Darragh) who prepared the data for NGA.During this process, about 50% of the Italian motions werescreened out because of S-triggers and other problems.Figure 3 shows the number of available recordings withM >4 as a function of the maximum usable period, taken as theinverse of 1:25 ! fHP, where fHP is the high-pass corner fre-quency used in the data processing, which varies from accel-erogram to accelerogram according to signal characteristics.Note that there is a significant drop-off in the data for peri-ods >2–3 sec.
Source parameters were compiled from databanks main-tained by the Italian Institute of Geology and Vulcanology(INGV; see the Data and Resources section), and includedmo-ment magnitude, focal mechanism, and hypocenter locationfor 52 of the 89 events. The other 37 events were small mag-nitude (ML 3–5); for those eventsML was taken as an estimateofMw. For events with magnitudes > !5:5, finite source pa-rameters were compiled from INGV. Closest distance (R),Joyner–Boore distance (Rjb), and a hanging wall index wereevaluated by Brian Chiou (personal communication, 2008)using the source parameters and site locations in the database.
2964 G. Scasserra, J. P. Stewart, P. Bazzurro, G. Lanzo, and F. Mollaioli

Table
1Distance-ScalingFu
nctio
nsUsedin
NGA
andRecentEuropeanGMPE
s
GMPE
R-Scalin
g*Notes
Parameters†
NGA
Abraham
sonandSilva(2008)
%a2&
a3"M
$M
r#'!
ln"
!!!!!!!!!!!!!!!!!
R2&
h2
p#
Additional
hangingwall,depth
totopof
rupture,
andlarge
distance-scalin
gterm
s
R,Rjb,Rx,Ztor,W,$
NGA
Boore
andAtkinson(2008)
%c1&
c 2"M
$M
r#'!
ln"
!!!!!!!!!!!!
R2 jb&h2
p
Rref
#
&c 3"
!!!!!!!!!!!!!!!!!!
R2 jb&
h2
q$Rref#
None
Rjb
NGA
Cam
pbellandBozorgnia
(2008)
"c4&
c 5M#!
ln"
!!!!!!!!!!!!!!!!!
R2&
h2
p#
Additional
hangingwallterm
with
functio
naldependence
on$andZtor
R,Rjb,Ztor,$
NGA
Chiou
andYoungs(2008)
c 4ln%R
&c 5
coshfc
6max"M
$M
r;0#g'
&"c
4a$c 4#ln"
!!!!!!!!!!!!!!!!!!!!
R2&
c2 RB
p#&
#"M#!
R
Additional
hangingwallterm
swith
functio
naldependence
on$andZtor
R,Rjb,Rx,
Ztor,$
NGA
Idriss(2008)
$"%
1&
% 2M#!
ln"R
&10#
&#"T#R
None
R
European
Akkar
andBom
mer
(2007a)
"b4&
b5M#!
ln"
!!!!!!!!!!!!!!!!!!
R2 jb&
h2
q#
None
Rjb
European
Ambraseyset
al.(2005)
"a3&
a4M#!
ln"
!!!!!!!!!!!!!!!!!!
R2 jb&
h2
q#
Separate
styleof
faultin
gterm
Rjb
* a,c
,and
%term
sform
atretained
from
originalmodel;h
andM
rvaria
bles
used
here
toshow
compatib
ility
across
models.These
term
sdo
notn
ecessarilymatch
thosein
the
source
publications.Rrefis
specificto
Boore
andAtkinson(2008).
† R!
rupturedistance;R
jb!
closestdistance
tohoriz
ontalp
rojectionof
ruptureplane;Rxdefin
edinFigure2;
Ztor!
depthtotopof
rupture;W
!faultwidth;$
!dipangle.
A Comparison of NGA Ground-Motion Prediction Equations to Italian Data 2965

Where available, distance R was taken to the fault ruptureplane and Rjb to the surface projection of the fault ruptureplane. For small magnitude earthquakes without a finite faultmodel, R was taken as the hypocentral distance and Rjb wastaken as the epicentral distance. Because the only events with-out finite fault models were small in magnitude and, hence,had small fault dimensions, this approximation was consid-ered to be reasonable. For one event with unknown hypocen-tral depth and focal mechanism, those parameters wereestimated based on available data from the local region.
The hanging wall index compiled by Chiou indicateswhether a site is located on the hanging wall, footwall, or ina neutral (side) position relative to a dipping fault. For hang-ing wall sites, parameter Rx is estimated as
Rx " Rjb &W cos"$#; (2)
where W ! fault width and $ ! dip angle. Parameters Wand $ are compiled by Scasserra et al. (2009) for earthquakeswith finite source models. For other events where these pa-rameters were needed, they were estimated using empiricalmodels forW (Wells and Coppersmith, 1994) and dip anglesfor nearby faults (for $). The approximation in equation 2 isbecause Rx is strictly measured normal to the fault strike, asshown in Figure 2, whereas Rjb is not measured normal to thefault strike for sites beyond the ends of the fault but withinthe hanging wall region. As indicated in Table 1, anotherparameter needed for some of the NGA hanging wall termsis depth to top of rupture (Ztop). As with dip angle, this istaken from the finite fault database where available andotherwise is calculated assuming the hypocenter is at mid-width as equation (3) shows
Ztop " Zhyp $W
2sin"$#; (3)
where Zhyp ! hypocentral depth. Additional adjustments aremade on a case by case basis as needed (e.g., if Ztop < 0 byassuming the hypocenter is at mid-width, it is moved down).
Figure 4 shows the magnitude distance scattergramrelative to that in the NGA database described by Chiou et al.(2008). Relative to the NGA data, the Italian data are gener-ally sparse for Repi < 10 km andM >6:5. There is a reason-able degree of overlap in the datasets for Repi ! 10–70 kmand M 4:5–6. The Italian data are richer than NGA forM <4:5, which occur because the NGA models are intendedfor application to M >5 earthquakes. An important distinc-tion between the NGA and Italian databases concerns the pre-ponderance of normal fault earthquakes in the Italian data(44 of 89 events). In contrast, the NGA database has only13 normal fault earthquakes with 87 recordings (2.5% oftotal). Accordingly, comparison of NGA relations to Italiandata provides the opportunity to test their applicability for a
Figure 2. Schematic illustration of dipping fault and measurement of Rx parameter used in hanging wall terms for the Abrahamson andSilva (2008) and Chiou and Youngs (2008) GMPEs.
Figure 3. Variation of number of available recordings withM >4 in the Italian database with the maximum usable period,which is taken as the inverse of 1:25 ! fHP (fHP ! high pass cornerfrequency used in data processing).
2966 G. Scasserra, J. P. Stewart, P. Bazzurro, G. Lanzo, and F. Mollaioli

predominantly extensional region (although we do not claimthe results to be applicable to extensional regions generally).
Scasserra et al. (2009) present VS30 parameters for allItalian sites utilized in the present analysis. Basin depth termZ1:0 is taken from velocity profiles where available. Other-wise Z1:0 is estimated from VS30 using the following functionproposed by Chiou and Youngs (2008):
ln"Z1:0# ! 28:5 $ 0:4775 ln"V8S30 & 378:78#; (4)
where Z1:0 is in m and VS30 is in m=sec. It is not possible tovalidate equation (4) using existing data from sites in Italy.Depth term Z2:5 is evaluated from Z1:0 using the followingrelation similarly derived from the NGA data by Campbelland Bozorgnia (2007):
Z2:5 ! 0:519& 3:595Z1:0; (5)
where both depths are in kilometers. Use of equation (5)implies similar velocity gradients in rock for California andItalian sites, which may not be the case.
We recognize that these empirical sediment depth esti-mates may not apply to Italy. By using median depths that aredependent on VS30 for the majority of sites, we are essentiallyusing the average basin effect in the NGA GMPEs. If we aresignificantly in error, it would be expected to produce bias atlong periods, where the basin effects are most pronounced.This is evaluated subsequently in the article.
Data Analysis
Overall GMPE Bias and Standard Deviation Relativeto Italian Data
We begin by evaluating residuals between the data and aparticular GMPE referred to with index k. Residuals are cal-culated as
"Ri;j#k ! ln"IMi;j#data $ ln"IMi;j#k: (6)
Index i refers to the earthquake event and index j refers to therecording within event i. Hence, "Ri;j#k is the residual ofdata from recording j in event i as calculated using GMPE k.Term ln"IMi;j#data represents the GMRotI50 parameter(Boore et al., 2006) computed from recording j (similarto geometric mean). Term ln"IMi;j#k represents the mediancalculated using GMPE k in natural log units.
Residuals are calculated using equation (6) for sixGMPEs: Abrahamson and Silva (2008), Boore and Atkinson(2008), Campbell and Bozorgnia (2008), Chiou and Youngs(2008), Akkar and Bommer (2007a), and Ambraseys et al.(2005). The analysis of residuals with respect to magnitude,distance, and site scaling requires that event-to-event varia-tions be separated from variations of residuals within events.This is accomplished by performing a mixed effects regres-sion (Abrahamson and Youngs, 1992) of residuals accordingto the following function:
"Ri;j#k ! ck & "&i#k & "'i;j#k; (7)
where ck represents a mean offset (or bias) of the data relativeto GMPE k, &i represents the event term for event i (explainedin the following section), and 'i;j represents the intraeventresidual for recording j in event i. Event term &i representsapproximately the mean offset of the data for event i from thepredictions provided by the GMPE median (after adjustingfor mean offset ck, which is based on all events). Event termsprovide a convenient mechanism for testing the ability of aGMPE to track the magnitude scaling of a dataset. Eventterms are assumed to be normally distributed with zero meanand standard deviation ! ( (in natural log units). Intraeventerror ' is also assumed to be normally distributed with zeromean and standard deviation ! ".
Figure 5 shows the distribution of event terms from theItalian data as a function of the number of recordings perevent. The scatter of event terms is large for sparsely recordedevents (1–2 recordings), but it is relatively stable for eventswith three or more recordings. Accordingly, for subsequent
Figure 4. Distribution of NGA and Italian data with respect tomagnitude and epicentral distance.
Figure 5. Variation of PGA event terms for Abrahamson andSilva (2008) GMPE with number of recordings, showing decreaseof scatter for events with more recordings. Data from 1- and 2-recording events are not used in this study because of large scatterof event terms.
A Comparison of NGA Ground-Motion Prediction Equations to Italian Data 2967
analysis we remove from the dataset events with only one ortwo recordings. The three outlier events with large nega-tive event terms (with 6, 7, and 8 recordings) are recorded pre-dominantly at large distance (the events are Molise, Mw 5:7,31 October 2002 andMw 5:7, 1 November 2002; Trasaghis–Friuli,ML 4:1, 28 May 1998). The large negative event termsfor these events are attributed in part to a distance-attenuationbias in the NGA GMPEs described subsequently. The Moliseevents also appear to have had low stress drops (Calderoniet al. 2010).
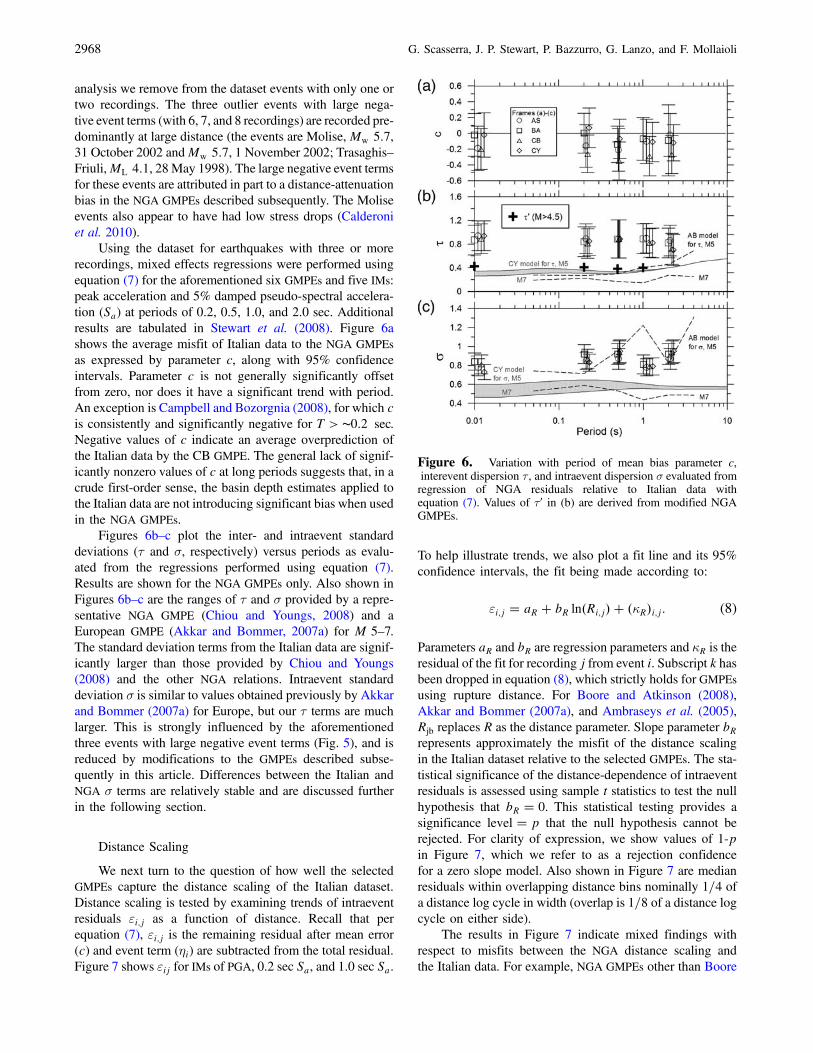
Using the dataset for earthquakes with three or morerecordings, mixed effects regressions were performed usingequation (7) for the aforementioned six GMPEs and five IMs:peak acceleration and 5% damped pseudo-spectral accelera-tion (Sa) at periods of 0.2, 0.5, 1.0, and 2.0 sec. Additionalresults are tabulated in Stewart et al. (2008). Figure 6ashows the average misfit of Italian data to the NGA GMPEsas expressed by parameter c, along with 95% confidenceintervals. Parameter c is not generally significantly offsetfrom zero, nor does it have a significant trend with period.An exception is Campbell and Bozorgnia (2008), for which cis consistently and significantly negative for T > !0:2 sec.Negative values of c indicate an average overprediction ofthe Italian data by the CB GMPE. The general lack of signif-icantly nonzero values of c at long periods suggests that, in acrude first-order sense, the basin depth estimates applied tothe Italian data are not introducing significant bias when usedin the NGA GMPEs.
Figures 6b–c plot the inter- and intraevent standarddeviations (( and ", respectively) versus periods as evalu-ated from the regressions performed using equation (7).Results are shown for the NGA GMPEs only. Also shown inFigures 6b–c are the ranges of ( and " provided by a repre-sentative NGA GMPE (Chiou and Youngs, 2008) and aEuropean GMPE (Akkar and Bommer, 2007a) for M 5–7.The standard deviation terms from the Italian data are signif-icantly larger than those provided by Chiou and Youngs(2008) and the other NGA relations. Intraevent standarddeviation " is similar to values obtained previously by Akkarand Bommer (2007a) for Europe, but our ( terms are muchlarger. This is strongly influenced by the aforementionedthree events with large negative event terms (Fig. 5), and isreduced by modifications to the GMPEs described subse-quently in this article. Differences between the Italian andNGA " terms are relatively stable and are discussed furtherin the following section.
Distance Scaling
We next turn to the question of how well the selectedGMPEs capture the distance scaling of the Italian dataset.Distance scaling is tested by examining trends of intraeventresiduals 'i;j as a function of distance. Recall that perequation (7), 'i;j is the remaining residual after mean error(c) and event term (&i) are subtracted from the total residual.Figure 7 shows 'ij for IMs of PGA, 0.2 sec Sa, and 1.0 sec Sa.
To help illustrate trends, we also plot a fit line and its 95%confidence intervals, the fit being made according to:
'i;j ! aR & bR ln"Ri;j# & ")R#i;j: (8)
Parameters aR and bR are regression parameters and )R is theresidual of the fit for recording j from event i. Subscript k hasbeen dropped in equation (8), which strictly holds for GMPEsusing rupture distance. For Boore and Atkinson (2008),Akkar and Bommer (2007a), and Ambraseys et al. (2005),Rjb replaces R as the distance parameter. Slope parameter bRrepresents approximately the misfit of the distance scalingin the Italian dataset relative to the selected GMPEs. The sta-tistical significance of the distance-dependence of intraeventresiduals is assessed using sample t statistics to test the nullhypothesis that bR ! 0. This statistical testing provides asignificance level ! p that the null hypothesis cannot berejected. For clarity of expression, we show values of 1-pin Figure 7, which we refer to as a rejection confidencefor a zero slope model. Also shown in Figure 7 are medianresiduals within overlapping distance bins nominally 1=4 ofa distance log cycle in width (overlap is 1=8 of a distance logcycle on either side).
The results in Figure 7 indicate mixed findings withrespect to misfits between the NGA distance scaling andthe Italian data. For example, NGA GMPEs other than Boore
Figure 6. Variation with period of mean bias parameter c,interevent dispersion ( , and intraevent dispersion " evaluated fromregression of NGA residuals relative to Italian data withequation (7). Values of ( 0 in (b) are derived from modified NGAGMPEs.
2968 G. Scasserra, J. P. Stewart, P. Bazzurro, G. Lanzo, and F. Mollaioli

Figure 7. Variation of intraevent residuals for Italian data with distance for PGA, 0.2 sec Sa, and 1.0 sec Sa.
A Comparison of NGA Ground-Motion Prediction Equations to Italian Data 2969

and Atkinson (2008) have unbiased distance attenuation atlong period (T # 1:0 sec), as evidenced by low rejectionconfidence for the zero slope null hypothesis. On the otherhand, NGA GMPEs produce statistically significant values ofbR ranging from approximately $0:15 to $0:4 at short peri-ods (PGA and 0.2 sec Sa). These negative values of bR atshort periods indicate faster distance attenuation of the Italiandata relative to these GMPEs. The smallest bR values (inan absolute sense) occur for the Chiou and Youngs (2008)model, which is consistent with its steeper IM distance slopein the 10–70 km range relative to the other NGA GMPEs(Fig. 1). The largest bR values occur for the Boore andAtkinson (2008) model, which has the slowest distance at-tenuation, with Abrahamson and Silva (2008) and Campbelland Bozorgnia (2008) being intermediate cases. As shown inFigure 7, the bin medians generally track the fit lines fordistance bins beyond 10 km, where bin populations are lar-gest. This indicates that the trend lines provide a reasonablemeasure of the data trend (at least for distances >10 km).
The Europeanmodels (Ambraseys et al., 2005 andAkkarand Bommer, 2007a) also indicate mixed results. As shown in
Figure 7, slope parameter bR is insignificant to marginallysignificant at short periods (PGA and 0.2 sec) for Ambraseyset al. (2005) but significant (at the 95% level) for Akkar andBommer (2007a). At T ! 1:0 sec, Akkar and Bommer(2007a) and Ambraseys et al. (2005) have insignificantvalues of bR. We interpret these results to suggest reduceddistance-attenuation bias of the European GMPEs relative toNGA, which might be expected because Italian groundmotions contributed data to the European GMPEs.
To further examine the distance-attenuation misfit ofthe NGA models, we regress the Italian data against theNGA functional forms to reevaluate selected coefficientscontrolling the distance attenuation, with the results shownin Table 2. Recalling the distance-attenuation functions fromTable 1, the principal coefficient that is reevaluated is the termexpressing the magnitude-independent slope of the distanceattenuation (a2 for Abrahamson and Silva (2008), c1 forBoore and Atkinson (2008), c4 for Campbell and Bozorgnia(2008), and c4a for Chiou and Youngs, 2008). In general,the constant term must also be changed to fit the data (a1 forAbrahamson and Silva, 2008; c0 for Campbell andBozorgnia,
Table 2Summary of Modified GMPE Parameters for Constant and Distance-Scaling Terms*
Regression Coefficients Error Terms
GMPE Period (sec) Constant Term† Slope Term h Term *"‡ ( 0 ( 0
Abrahamsonand Silva (2008)
a1 a01 a2 a02 c4 c04 all M M >4:5
PGA 0.80 2:12( 0:60 $0:97 $1:42( 0:16 4.5 6.6 0.07 0.64 0.470.2 1.69 2:71( 0:64 $0:97 $1:34( 0:19 4.5 6.0 0.02 0.56 0.420.5 1.40 1:92( 0:62 $0:85 $1:11( 0:18 4.5 5.0 0.06 0.59 0.431 0.92 n/c§ $0:81 n/c 4.5 n/c 0.10
2 0.19 n/c $0:80 n/c 4.5 n/c 0.18
Boore andAtkinson (2008)
e0 e00 c1 c01 h all M M >4:5
PGA 0.00 0:11( 0:54 $0:66 $0:79( 0:16 1.35 1.50 0.27 0.53 0.450.2 0.00 n/c $0:58 $0:67( 0:08 1.98 1.75 0.21 0.53 0.470.5 0.00 0.10 $0:69 $0:78( 0:07 2.32 n/c 0.14 0.45 0.361 0.00 0.10 $0:82 $0:89( 0:07 2.54 n/c 0.04 0.51 0.392 0.00 n/c $0:83 n/c 2.73 n/c 0.11
Campbell andBozorgnia (2008)
c0 c00 c4 c04 c6 c06 all M M >4:5
PGA $1:72 1.20 $2:12 $2:58( 0:07 5.60 7.14 0.18 0.51 0.390.2 $0:49 n/c $2:22 $2:26( 0:07 7.60 7:00( 4:00 0.23 0.49 0.400.5 $2:57 n/c $2:04 $2:03( 0:07 4.73 n/c 0.19 0.51 0.371 $6:41 n/c $2:00 n/c 4.00 n/c 0.13
2 $9:70 n/c $2:00 n/c 4.00 n/c 0.25
c1 c01 c4a c04a cRB c0RB all M M >4:5
Chiou andYoungs (2008)
PGA $1:27 3:3( 2:1 $0:5 $1:64( 0:50 50 45 0.08 0.57 0.390.2 $0:64 4:8( 2:2 $0:5 $1:85( 0:54 50 n/c 0.11 0.45 0.330.5 $1:47 n/c $0:5 n/c 50 n/c 0.10
1 $2:25 n/c $0:5 n/c 50 n/c 0.12
2 $3:41 n/c $0:5 n/c 50 n/c 0.26
*Original coefficients are shown without primes and modified coefficients with primes (0).†Modified for Abrahamson and Silva (2008), Campbell and Bozorgnia (2008), and Chiou and Youngs (2008). Constant term for Boore and
Atkinson (2008) is e1 to e4 (dependent on source type); e0 is an additive term for any focal mechanism.‡Additive intraevent standard deviation term.§n=c ! no change in recommended coefficient.
2970 G. Scasserra, J. P. Stewart, P. Bazzurro, G. Lanzo, and F. Mollaioli

2008; c1 for Chiou and Youngs, 2008), which are evaluatedthrough regression simultaneously with the distance attenua-tion term. In the case of Boore and Atkinson (2008), the con-stant term depends on focal mechanism, taking on values ofe1 $ e4. The Italian data are not sufficiently voluminous tocheck the scaling of ground motion with focal mechanism,sowe retain the e1 $ e4 values and simply provide an additiveterm (e0) that could be applied to each (e.g., the new constantterm for strike-slip would be e0 & e1). Finally, we constrainthe resulting modified GMPEs to match reasonably closely tothe original GMPEs at close distance (R or Rjb < 3 km). Thisis done because the Italian data cannot constrain groundmotions in that range, so we rely on the constraint providedby the NGA models. If the modified NGA models do notprovide this match from the regression on the identified coef-ficients, then we enforce the match through minor manualadjustment of the fictitious depth term along with an occa-sional added adjustment to the constant term, as shown inTable 2. All other coefficients in the GMPEs are fixed atthe published values.
An alternative approach to that previously mentioned(modification of magnitude-independent slope term) wouldhave been to modify the parameters controlling the change ofattenuation rate with magnitude (e.g., a3 in Abrahamson andSilva, 2008). By increasing such parameters, we could ac-complish faster attenuation at low magnitude and retainthe approximate NGA rate of attenuation at larger magni-tudes. The choice of approach is arbitrary because the Italiandata are not sufficient to resolve both terms. More discussionon the implication of this approach is provided in the Inter-pretation and Conclusions section.
In Table 2, values established through regressions areshown with 95% confidence intervals, whereas values fixedmanually have no confidence intervals. The absolute valuesof the modified distance-attenuation terms (a02 for Abraham-son and Silva (2008), c01 for Boore and Atkinson (2008), c04for Campbell and Bozorgnia (2008), c04a for Chiou andYoungs, 2008) are larger than the original values, consistentwith the faster distance attenuation in the Italian data. Thiscan also be seen in Figure 8, which shows the distance at-tenuation of the original and modified Boore and Atkinson
(2008) and Campbell and Bozorgnia (2008) GMPEs forPGA and 0.2 sec Sa for soft rock site conditions (VS30 !620 m=sec) and magnitudes of M 5 and 7. Similar trendsoccur for the Abrahamson and Silva (2008) and Chiouand Youngs (2008) GMPEs.
After adjusting the constant and distance terms as de-scribed previously, the distance dependence of intraeventresiduals ('0i;j) were checked and found to be negligible.The intraevent standard deviation of the modified GMPEs(") is only slightly affected by the distance adjustmentsand remains higher than the original NGA values; the *"values in Table 2 are the offset between the intraevent stan-dard deviations and the NGA values. The standard deviationof event terms for the modified GMPEs (( 0) is reduced be-cause events with predominantly large-distance recordingsshow less bias. Those values of ( 0 are listed in Table 2 (underheading “( 0 all M”).
Magnitude Scaling
Magnitude scaling is tested by examining trends ofevent terms versus magnitude. The event terms presentedare recomputed using the modified GMPEs where applicable(denoted as &0i); for IMs without modified GMPEs the originalGMPE is used to evaluate event terms (denoted as &i). Themodified GMPEs are used so that distance bias is not mappedinto event terms. Figure 9 shows event terms for the IMs ofPGA, 0.2 sec Sa, and 1.0 sec Sa. Event terms are shown sep-arately for normal fault earthquakes and other mechanisms(generally strike-slip). To help illustrate trends, we also plota fit line (for all of the data) and its 95% confidence intervals,the fit being made according to
&0i ! aM & bMMi & ")M#i: (9)
Separate regressions are performed for each GMPE. Param-eters aM and bM represent the regression coefficients and")M#i is the residual of the fit for event i. If slope bM is non-zero and significant, it suggests the magnitude scaling in themodel does not match the data. Slope bM cannot capturehigher-order (e.g., quadratic) dependence of residuals onmagnitude, although visual inspection of Figure 9 does notsuggest the presence of such higher-order trends in the data.
While the slopes of the trend lines (bM) in Figure 9 arenonzero, we find that they are generally not statistically sig-nificant at the 95% confidence level. To the extent that trendsin the data exist, they are generally strongest at T ! 1:0 sec(e.g., for the Abrahamson and Silva, 2008; Campbell andBozorgnia, 2008; Ambraseys et al., 2005 GMPEs). On thebasis of hypothesis testing for slope parameter bM, we con-clude that the GMPEs (some original; some modified) ade-quately capture the magnitude scaling of the Italian dataset.However, it is visually apparent in Figure 9 that the fit is notas good and the scatter is relatively large at low magnitudes(M >4:5), which is beyond the intended range of the NGAmodels. Although not shown in Figure 9, the trends with
Figure 8. Variation of median ground motions with distanceand magnitude from NGA and modified NGA relations developedin this study.
A Comparison of NGA Ground-Motion Prediction Equations to Italian Data 2971

Figure 9. Variation of event terms for Italian data with magnitude for PGA, 0.2 sec Sa, and 1.0 sec Sa.
2972 G. Scasserra, J. P. Stewart, P. Bazzurro, G. Lanzo, and F. Mollaioli

magnitude weaken (lines become flatter) when only datawith M >4:5 are used in the equation 9 regression. Table 2shows that the standard deviation of event terms is reducedsignificantly when only events with M >4:5 are considered(compare terms under headings “all M” and “M >4:5” inTable 2). As shown in Figure 6, ( 0 values averaged acrossthe four GMPEs for M >4:5 are similar to published values.Hence, the NGA GMPEs can be applied with greater confi-dence for a limiting magnitude of approximately 4.5 to5.0 (5.0 is the minimum magnitude in the NGA relations).
We do not consider the Italian data to be adequatelylarge to formally test focal mechanism terms in the NGAGMPEs. Accordingly, the residuals analysis (equation 6) usedNGA focal mechanism terms. As a rough check, we see inFigure 9 that event terms for normal fault earthquakes (themost common focal mechanism in the Italian data) are not
visually distinct from the data as a whole, which supportsour use of the NGA focal mechanism terms.
Site Effects
We evaluate the scaling of ground motions with VS30
using the modified NGA GMPEs (for appropriate spectralperiods) so that distance bias is not mapped into the analysisof VS30. In Figure 10, we examine trends of intraevent resid-uals ('ij or '0i;j) as a function ofVS30 for the IMs of PGA, 0.2 secSa, and 1.0 sec Sa. Trends are illustrated with a fit line
'0i;j ! aV & bV ln"VS30#i;j & ")V#i;j: (10)
Parameters aV and bV are regression parameters; )V is the re-sidual of the fit for recording j from event i. Equation (10)strictly holds for the modified GMPE; for original models,
Figure 10. Variation of intraevent residuals with average shear wave velocity in upper 30 m (VS30). Residuals are for original GMPEwhen shown without prime ('ij) and for modified GMPE when shown with prime ('0ij).
A Comparison of NGA Ground-Motion Prediction Equations to Italian Data 2973

'i;j replaces '0i;j. Slope parameterbV represents approximatelythe misfit of the VS30-scaling in the GMPEs relative to theItalian dataset. Table 3 shows values of bV , their 95% confi-dence intervals, and the rejection confidence for a bV ! 0model (1-p) from hypothesis testing. The results in Figure 10and Table 3 indicate a general lack of statistically significanttrends with VS30. This suggests that the VS30-based site termsin the NGA GMPEs may be compatible with the Italian data.
Because of the established use of linear site terms inEuropean GMPEs, we explore more deeply the nonlinearityof site effects implied by the Italian data. This analysis beginsby reevaluating residuals in a manner similar to equation (6),but withmodified GMPEs (as appropriate) and withVS30 fixedat a reference value of 1100 m=sec, basin depth Z1:0 setto zero, and Z2:5 set to 0.52 km (per equation 5). Residualsevaluated in this manner are written as '1100i;j and are calcu-lated as
"'1100i;j #k ! ln"IMi;j#data $ %ln"IM1100i;j #k & &0i'; (11)
where "IM1100i;j #k indicates the prediction of GMPE k for the
reference rock conditions described previously (using modi-fied GMPEs where appropriate) and &0i is the event term eval-uated for the modified GMPE where applicable (which isreplaced with the event term from equation 7 otherwise).Those residuals are then grouped into two categories, one cor-responding to recordings made on firm rock site conditions(VS30 ! 800 to 1100 m=sec) and the other to soft to medium-stiff soil conditions (VS30 ! 180 to 300 m=sec). Figure 11shows those residuals plotted as a function of dPGA1100, whichis themedian peak acceleration from the respective GMPEs forthemagnitude, distance, and other parameters associated withthe recordings. We illustrate trends in the results with fit linesregressed according to equation (12) for data in each category
'1100i;j ! aPGA & bPGA ln" dPGA1100i;j # & ")PGA#i;j; (12)
where aPGA and bPGA are the regression parameters and")PGA#i;j is the misfit of the line to the residual for recordingj from event i. Those coefficients are given in Table 3.
For each of the GMPEs considered, the results show (1)for low values of dPGA1100, larger residuals occur for the soilcategory than the rock category, and (2) the slope of the'1100i;j - dPGA1100 relationship (bPGA) is significantly negative,as established by hypothesis test results, for the soil categorybut is not significantly different from zero for the rock cate-gory. These results demonstrate a nonlinear site effect for theIMs of PGA and Sa for T $ 1:0 sec. Moreover, the differencebetween the '1100i;j fit for soil and rock represents an impliedsite effect inherent to the Italian data relative to the VS30 !1100 m=sec site condition adopted as a reference in equa-tion (11). That implied site effect is compared with theVS30-based site term in the Abrahamson and Silva (2008),Boore and Atkinson (2008), and Campbell and Bozorgnia(2008) GMPEs in Figure 12. Although the absolute positionof the implied site term varies somewhat relative to the GMPEsite term, the slopes are generally similar. In the few caseswhere the slopes appear dissimilar (e.g., Boore and Atkinson[2008] and Campbell and Bozorgnia [2008] at T ! 1:0 sec),the slopes of the implied site term are not significant, as in-dicated by the wide confidence intervals. This suggests thatthe NGA site terms are providing approximately the correctlevel of nonlinearity for these Italian soil sites.
Interpretation and Conclusions
We have investigated the compatibility of strong motiondata in Italy with ground-motion prediction equations(GMPEs) established by the Next Generation Attenuation(NGA) project for shallow crustal earthquakes in active re-gions. Using a mixed effects procedure, we evaluated eventterms (interevent residuals) and intraevent residuals of theItalian data relative to the NGA GMPEs.
Table 3Summary of Slope Terms Indicating Lack of Trend of Intraevent Residuals with VS30 and Fit Coefficients for Rock and Soil Categories
with Specified VS30 Ranges
VS30-Scaling (modified GMPE) Rock (VS30 ! 800–1100 m=sec) Soil (VS30 ! 180–300 m=sec
GMPE Period (sec) bv 1$ p aPGA bPGA "1$ p#b aPGA bPGA "1$ p#b
Abrahamson and Silva (2008) PGA 0:1396( 0:1780 0.88 0.60 0.15 0.74 $0:68 $0:33 1.000.2 0:1102( 0:1751 0.79 0.32 0.09 0.45 $0:12 $0:07 0.641 0:0225( 0:1894 0.19 0.09 0.18 0.60 $0:36 $1:33 0.97
Boore and Atkinson (2008) PGA 0:2267( 0:2326 0.95 0.89 0.14 0.65 $0:33 $0:26 1.000.2 0:0774( 0:2443 0.47 $0:11 $0:08 0.35 $1:08 $0:44 1.001 0:0824( 0:2180 0.55 0.17 $0:03 0.14 $0:96 $0:25 1.00
Campbell and Bozorgnia (2008) PGA $0:2444( 0:1770 0.99 0.67 0.16 0.76 $0:73 $0:31 1.000.2 $0:0901( 0:2205 0.59 0.66 0.23 0.88 $0:49 $0:21 1.001 $0:0624( 0:2099 0.45 $0:23 $0:02 0.11 $0:38 $0:22 1.00
Chiou and Youngs (2008) PGA 0:0823( 0:1740 0.66 0.66 0.12 0.69 0.67 $0:35 1.000.2 0:0481( 0:1996 0.37 $0:05 0.02 0.14 1.14 $0:26 1.001 0:0486( 0:2004 0.37 0.62 0.16 0.66 $0:10 $0:29 0.99
2974 G. Scasserra, J. P. Stewart, P. Bazzurro, G. Lanzo, and F. Mollaioli

Distance scaling was investigated by examining trendsof intraevent residuals with distance. For the four NGA rela-tions considered (Abrahamson and Silva, 2008; Boore andAtkinson, 2008; Campbell and Bozorgnia, 2008; Chiou andYoungs, 2008), the residuals demonstrated a statisticallysignificant trend with distance for short periods (T $ 0:2–0:5 sec), which was suggestive of faster attenuation of Italiandata. For two recent European GMPEs, the residuals demon-stratedmixed trends with distance, but the trends wereweakerthan those for the NGAGMPEs . Parameters in the NGAGMPEsthat accounted for magnitude independent distance attenua-tion were adjusted through regression, which detrends theresiduals. As noted previously, a different approach couldhave been adopted in which the rate of attenuation wasadjusted for lowmagnitude earthquakes only (through adjust-
ment of terms controlling the rate of changeof attenuationwithmagnitude). Such an approach has been advocated recently toaccount for observed fast attenuation of some low magnitudeCalifornia data (e.g., Chiou, personal communication, 2009).Either approach would have produced reasonable results forthe present study, which contains a significant amount of datawithMw < 5:5. However, it is interesting to note that the 2009Mw 6.3 L’Aquila earthquake data (which became availablefollowing the writing of this article) is consistent with the rateof attenuation in the modified Boore and Atkinson (2008)GMPE from this study (Di Capua et al., 2009). Had the adjust-ment to faster attenuation been concentrated at low magni-tudes, this fit may not have been achieved.
The observed faster attenuation of Italian data relative tomany of the NGA GMPEs was consistent with previous work
Figure 11. Variation of reference-site intraevent residuals (defined using equation 11) with median anticipated reference site peak accel-eration, dPGA1100.
A Comparison of NGA Ground-Motion Prediction Equations to Italian Data 2975

that showed faster distance attenuation of European datarelative to California data (e.g., Douglas, 2004b). Moreover,as shown in Figure 13, our finding of faster attenuation ofItalian data was consistent with higher crustal damping as re-presented by lower frequency-dependent Q values from theUmbria/Apennines region of Italy (which contributed about2=3 of the Italian recordings) relative to values for centraland southern California (which contributed much of theNGA data).
Event terms from the NGAGMPEs (modified as appropri-ate to remove the biased distance attenuation) did not show astatistically significant trend with magnitude, indicating thatthe magnitude scaling was generally compatible with Italiandata. The two European GMPEs were also compatible withmagnitude scaling implied by the Italian data.
Scaling with respect to site condition was investigatedby plotting intraevent residuals versus average shear wavevelocity in the upper 30 m (VS30). Those residuals were cal-culated relative to modified NGA GMPEs as applicable.The results indicated no general trend with VS30, suggestingthat the NGA site terms were compatible with Italian data.Because the NGA site terms were nonlinear, which was in-consistent with the linear site terms in European GMPEs, wealso investigated whether the Italian data supported the use ofa nonlinear site term. This was done by examining residualsof Italian data relative to the NGA GMPEs evaluated for areference firm rock condition. A group of data on firm rockshowed no trend of residuals with dPGA1100, which repre-sented the median amplitude of shaking expected on firmrock. However, a group of data from soil sites showed a
Figure 12. Comparison of range of GMPE site terms for VS30 ! 180 and 300 m=sec sites to approximate site effect inferred from Italiandata relative to VS30 ! 1100 m=sec reference condition.
2976 G. Scasserra, J. P. Stewart, P. Bazzurro, G. Lanzo, and F. Mollaioli

statistically significant trend with dPGA1100. The differencesbetween these trends for firm rock and soil implied a non-linear site term having a slope relative to dPGA1100 that wasgenerally consistent with the NGA site terms. Accordingly,we concluded that nonlinear site response should be incor-porated into site terms for European GMPEs.
Turning next to data dispersion as represented by stan-dard deviation terms, we found the event-to-event variabilityas expressed by the standard deviation of event terms (( ) tobe compatible with NGA recommendations when the mod-ified GMPEs were used and the lower bound magnitude wasset to 4.5. Intraevent standard deviation (") was larger inItalian data than in NGA, but by amounts on the order of*" ! 0:05 to 0.3.
In summary, we recommend that the Abrahamson andSilva (2008), Boore and Atkinson (2008), Campbell andBozorgnia (2008), andChiou andYoungs (2008) NGAGMPEsfor median ground motions be utilized for hazard analysis inItaly alongwith existingEuropeanmodels (especiallyAmbra-seys et al., 2005 and Akkar and Bommer, 2007a). However,we recommend modification of (generally) two or three pa-rameters in the evaluation of median ground motions fromthe NGAmodels: one being a constant term, the second repre-senting attenuation from geometric spreading and anelasticattenuation, and the third representing the source fictitiousdepth term. Those parameters and the recommended newcoefficients are given in Table 2. The associated functionalforms for distance attenuation are given in Table 1. With re-spect to standard deviation terms, we recommend the use ofthe ( terms (representing interevent variability) in the originalNGA equations. We recommend " (representing intraeventvariability) be taken as the sum of the NGA values and the*" values given in Table 2. The revised GMPEs are consid-ered valid over the magnitude range 4.5 to 7.0 and for dis-tances (R or Rjb) under 200 km.
Finally, while this work has focused on Italy, we believeground motions know nothing of political boundaries; theresults presented here may be applicable elsewhere inEurope. The applicability of the results to extensional regionsgenerally remains an open question. We anticipate that futurework will formally evaluate data from other regions in a man-ner similar to what is described here.
Data and Resources
The strong motion data utilized in this study are avail-able at http://sisma.dsg.uniroma1.it/ (last accessed May2009). Metadata associated with the recordings is given inScasserra et al. (2009). Source parameters were compiledfrom databanks maintained by the Italian Institute of Geol-ogy and Vulcanology (INGV, www.ingv.it, last accessed Sep-tember 2008).
Acknowledgments
This work began during a collaborative research and teaching programin which Jonathan Stewart was supported by a Fulbright Scholarship whileworking at the University of Rome. That support is gratefully acknowledged.We thank Brian Chiou for computing source distances and identifying hang-ing wall sites. David M. Boore and Jennie Watson–Lamprey are thanked forproviding the source codes for calculation of rotated geometric mean re-sponse spectral accelerations. Robert Graves is thanked for his useful inputregarding Q values in California. We sincerely thank the anonymous re-viewers and BSSA editors Julian Bommer and Peter Stafford for their helpfulcomments, which improved the manuscript.
References
Abrahamson, N. A., and W. J. Silva (2008). Summary of the Abrahamsonand Silva NGA ground motion relations, Earthq. Spectra 24, no. S1,67–97.
Abrahamson, N. A., and R. R. Youngs (1992). A stable algorithm for regres-sion analyses using the random effects model, Bull. Seismol. Soc. Am.82, 505–510.
Abrahamson, N. A., P. Birkhauser, M. Koller, D. Mayer–Rosa, P. M. Smit,C. Sprecher, S. Tinic, and R. Graf (2002). PEGASOS: A comprehen-sive probabilistic seismic hazard assessment for nuclear power plantsin Switzerland, in Proc. of the Twelfth European Conf. on Earthq.Engineering, Paper no 633, London.
Akkar, S., and J. J. Bommer (2007a). Prediction of elastic displacementresponse spectra in Europe and the Middle East, Earthq. Eng. Struct.Dynam. 36, 1275–1301.
Akkar, S., and J. J. Bommer (2007b). Empirical prediction equations forpeak ground velocity derived from strong motion records from Europeand the Middle East, Bull. Seismol. Soc. Am. 97, no. 2, 511–530.
Ambraseys, N. N., J. Douglas, P. Smit, and S. K. Sarma (2005). Equationsfor the estimation of strong ground motions from shallow crustal earth-quakes using data from Europe and the Middle East: Horizontal peakground acceleration and spectral acceleration, Bull. Earthq. Eng. 3,no. 1, 1–53.
Ambraseys, N. N., K. A. Simpson, and J. J. Bommer (1996). Prediction ofhorizontal response spectra in Europe, Earthq. Eng. Struct. Dynam. 25,371–400.
Beyer, K., and J. J. Bommer (2006). Relationships between medianvalues and between aleatory variabilities for different definitions ofthe horizontal component of motion, Bull. Seismol. Soc. Am. 96,1512–1522.
Boore, D. M., and G. M. Atkinson (2008). Ground motion prediction equa-tions for the average horizontal component of PGA, PGV, and 5%-damped PSA at spectral periods between 0.01 and 10.0 s, Earthq.Spectra 24, no. S1, 99–138.
Boore, D. M., J. Watson–Lamprey, and N. A. Abrahamson (2006).Orientation-independent measures of ground motion, Bull. Seismol.Soc. Am. 96, no. 4a, 1502–1511.
Budnitz, R. J., G. Apostolakis, D. M. Boore, L. S. Cluff, K. J. Coppersmith,C. A. Cornell, and P. A. Morris (1997). Recommendations forprobabilistic seismic hazard analysis: guidance on uncertainty
Figure 13. Comparison of relatively large Q values fromCalifornia with smaller values from Apennines region of Italy, in-dicating higher crustal damping in the Italian region producing mostof the recordings in the present database.
A Comparison of NGA Ground-Motion Prediction Equations to Italian Data 2977

and use of experts, Nuclear Regulatory Commission, NUREG/CR–6372.
Calderoni, G., A. Rovelli, G. Milana, and G. Valensise (2010). Do strike-slipfaults of Molise, central-southern Italy, really release a high stress?,Bull. Seismol. Soc. Am. (in press).
Campbell, K. W., and Y. Bozorgnia (2006). Next Generation Attenuation(NGA) empirical ground motion models: Can they be used in Europe?,in Proc. of the First European Conf. on Earthq. Engineering andSeismol., Paper No. 458.
Campbell, K. W., and Y. Bozorgnia (2007). Campbell–Bozorgnia NGAground motion relations for the geometric mean horizontal componentof peak and spectral ground motion parameters, PEER ReportNo. 2007/02, Pacific Earthquake Engineering Research Center,University of California, Berkeley, 238 pp.
Campbell, K. W., and Y. Bozorgnia (2008). NGA ground motion model forthe geometric mean horizontal component of PGA, PGV, PGD, and5%-damped linear elastic response spectra for periods ranging from0.01 to 10 s, Earthq. Spectra 24, no. S1 139–171.
Castro, R. R., F. Pacor, D. Bindi, G. Franceschina, and L. Luzi (2004). Siteresponse of strong motion stations in the Umbria, central Italy, region,Bull. Seismol. Soc. Am. 94, no. 2, 576–590.
Chiou, B. S.–J., and R. R. Youngs (2008). An NGA model for the averagehorizontal component of peak ground motion and response spectra,Earthq. Spectra 24, no. S1 173–215.
Chiou, B. S.–J., R. Darragh, D. Dregor, and W. J. Silva (2008). NGA projectstrong-motion database, Earthq. Spectra 24, no. S1, 23–44.
Cotton, F., F. Scherbaum, J. J. Bommer, and H. Bungum (2006). Criteria forselecting and adjusting ground-motion models for specific targetregions: Application to central Europe and rock sites, J. Seism. 10,137–156.
DiCapua,G.,R. E.Kayen,D. S.Kieffer, E.Button,G.Biscontin,G. Scasserra,G. Lanzo, P. Tommasi, A. Pagliaroli, F. Silvestri, A. d’Onofrio,A. L. Simonelli, R. Puglia, G. Mylonakis, G. Athanasopoulos,V. Vlahakis, and J. P. Stewart (2009). Preliminary report on theseismological and geotechnical aspects of the 6 April 2009 L’Aquilaearthquake in central Italy, GEER Association Report, No. GEER–016, Web report.
Douglas, J. (2003). Earthquake ground motion estimation using strong-motion records: A review of equations for the estimation of peakground acceleration and response spectra ordinates, Earth Sci. Rev.61, 43–104.
Douglas, J. (2004a). An investigation of analysis of variance as a tool forexploring regional differences in strong ground motions, J. Seism. 8,485–496.
Douglas, J. (2004b). Use of analysis of variance for the investigation of re-gional dependence of strong ground motion, Proc. of the ThirteenthWorld Conf. Equation Engineering, Vancouver, Canada, Paper 29(electronic file).
Douglas, J. (2006). Errata of and additions to “Ground motion estimationequations 1964–2003”, Intermediary Report BRGM/RP-54603-FR,Bureau de recherches géologiques et miniéres.
Fatehi, A., and R. B. Herrmann (2008). High-frequency ground-motion scal-ing in the Pacific northwest and in northern and central California,Bull. Seismol. Soc. Am. 98, no. 2, 709–721.
Idriss, I. M. (2008). An NGA empirical model for estimating the horizontalspectral values generated by shallow crustal earthquakes, Earthq.Spectra 24, no. S1, 217–242.
Malagnini, L., and R. B. Herrmann (2000). Ground-motion scaling in theregion of the 1997 Umbria–Marche earthquake (Italy), Bull. Seismol.Soc. Am. 90, no. 4, 1041–1051.
Malagnini, L., R. B. Herrmann, and M. Di Bona (2000). Ground motionscaling in the Apennines (Italy), Bull. Seismol. Soc. Am. 90, no. 4,1062–1081.
Raoof, M., R. B. Herrmann, and L. Malagnini (1999). Attenuation and ex-citation of three-component ground motion in southern California,Bull. Seismol. Soc. Am. 89, no. 4, 888–902.
Sabetta, F., and A. Pugliese (1996). Estimation of response spectra andsimulation of nonstationary earthquake ground motion, Bull. Seismol.Soc. Am. 86, no. 2, 337–352.
Scasserra, G., J. P. Stewart, R. E. Kayen, and G. Lanzo (2009). Database forearthquake strong motion studies in Italy, J. Earthq. Eng. 13, no. 6,852–881.
Scherbaum, F., F. Cotton, and P. Smit (2004). On the use of response spectralreference data for the selection and ranking of ground motion modelsfor seismic hazard analysis in regions of moderate seismicity: The caseof rock motion, Bull. Seismol. Soc. Am. 94, no. 6, 2164–2185.
Stafford, P. J., F. O. Strasser, and J. J. Bommer (2008). An evaluation of theapplicability of the NGA models to ground motion prediction in theEuro-Mediterranean region, Bull. Earthq. Eng. 6, 149–177.
Stewart, J. P., G. Scasserra, G. Lanzo, F. Mollaioli, and P. Bazzurro (2008).Critical evaluation of Italian strong motion data and comparison toNGA ground motion prediction equations, Report No. UCLA SGEL2008/03, University of California, Los Angeles, Structural andGeotechnical Engineering Laboratory.
Wells, D. L., and K. J. Coppersmith (1994). New empirical relationshipsamong magnitude, rupture length, rupture width, rupture area, andsurface displacement, Bull. Seismol. Soc. Am. 84, 974–1002.
Department of Structural and Geotechnical EngineeringUniversità di Roma La SapienzaRome, [email protected]
(G.S., G.L., F.M.)
Civil and Environmental Engineering DepartmentUniversity of California5731 Boelter HallLos Angeles, California [email protected]
(J.P.S.)
AIR Worldwide Corporation388 Market Street, Suite 610San Francisco, California 94111
(P.B.)
Manuscript received 12 June 2008
2978 G. Scasserra, J. P. Stewart, P. Bazzurro, G. Lanzo, and F. Mollaioli