a comparison of national vs. multinational … - a... · a comparison of national vs. multinational...
TRANSCRIPT

A COMPARISON OF NATIONAL VS. MULTINATIONAL
FIRMS’ PERFORMANCE USING A GENERAL EQUILIBRIUM PERSPECTIVE
MARÍA C. LATORRE
FUNDACIÓN DE LAS CAJAS DE AHORROS DOCUMENTO DE TRABAJO
Nº 640/2011
De conformidad con la base quinta de la convocatoria del Programa
de Estímulo a la Investigación, este trabajo ha sido sometido a eva-
luación externa anónima de especialistas cualificados a fin de con-
trastar su nivel técnico. ISSN: 1988-8767 La serie DOCUMENTOS DE TRABAJO incluye avances y resultados de investigaciones dentro de los pro-
gramas de la Fundación de las Cajas de Ahorros.
Las opiniones son responsabilidad de los autores.
1
“A comparison of national vs. multinational firms’ performance using a
general equilibrium perspective”
María C. Latorre (Universidad Complutense de Madrid)
Abstract
The main contribution of this paper is the use of a computable general equilibrium perspective
to compare the performance of national firms and multinationals (MNEs). We replicate the
arrival of MNEs to different sectors of the Czech Republic in turn and analyse the responses of
both types of firms across the 20 different sectors in which the Czech economy has been split.
The higher labour intensity of national firms leads them to different patterns of production and
labour demand, compared to MNEs operating within the same sector. The demand side of the
model (particularly, exports and private consumption), drives the evolution of production and
labour demand across sectors. Regarding prices, we also find a differential pattern between
both types of firms within and across sectors. Our analysis offers detailed evidence on how the
impact of MNEs will differ depending on the sector to which they arrive.
Key words: Multinationals, foreign direct investment, market performance, computable general
equilibrium, Czech Republic.
JEL Classification: C68, F21, F23
Acknowledgements: The author thanks Oscar Bajo-Rubio and Antonio G. Gómez-Plana for
helpful comments and suggestions. Financial support from the Spanish Ministry of Science and
Innovation, through the project ECO2008-05072-C02-01, is also gratefully acknowledged.
María C. Latorre: Departamento de Economía Aplicada II, Universidad Complutense de Madrid, Campus de Somosaguas, 28223 Madrid (Spain), Tel: +34 91 3944023, Fax: +34 91 3942457, e-mail: [email protected]

2
Introduction
Multinational enterprises (MNEs) exhibit fairly different characteristics compared to national
firms (i.e., firms with no foreign operations). This idea is intuitive and has been well established
in the literature for a long time. However, the analyses of market performance considering jointly
national firms and MNEs are scarce and troubled with methodological issues (e.g., Barba
Navaretti and Venables, 2004, chapter 7). Furthermore, few studies offer evidence on their
(expected) differential responses after a shock affecting both types of firms from a general
equilibrium perspective.
Empirical studies have found that the arrival of MNEs may result either in a pro-competitive
effect, i.e. the entry of MNEs promotes competition and reduces price-cost margins; or in a
more concentrated structure, with MNEs “crowding out” (less efficient) domestic firms. The
result would depend on different circumstances such as the sector in which MNEs operate, the
type of foreign direct investment (FDI) and the timing of the analysis (e.g., Co, 2001; Barrios et
al., 2005; Sembenelli and Siotis, 2005). Theoretical approaches also leave the question open
(e.g., Markusen and Venables, 1998, 2000; Ferrett, 2004).
This article aims at offering some new evidence on the differential patterns of performance of
MNEs versus national firms. We analyse the impact of the arrival of MNEs, paying particular
attention to the contrasting adjustment of both types of firms to this shock within and across
twenty different sectors in which the Czech economy has been split. We choose the case of the
Czech Republic because the capacity of attraction of MNEs in this country has been remarkable
during the last three decades and we have fairly good data to analyse it.
Our computable general equilibrium (CGE) methodology allows us to take into account the
economy wide effects of the entry of MNEs. It integrates both the macroeconomic and
microeconomic side of the process, the demand and the production aspects as well as both
good and factor markets. An important feature of the present study is precisely related to its
microeconomic foundations. Empirical approaches often base the analysis of market
performance on the impact of FDI inflows. By contrast, we explicitly model the differential cost
structures of national firms and MNEs within each sector, as a basis for both type of firms’
behaviour. The microeconomic adjustment will lead to a consistent set of aggregate outcomes,
due to the CGE nature of the model. We thus, offer the microeconomic results (national firms
and MNEs’ sectoral production, labour demand and prices) together with their impact at the
aggregate level (GDP, welfare, CPI, foreign trade, wages…).
Our results show that the higher labour intensity of national firms leads them to different
patterns of production and labour demand, compared to MNEs operating within the same
sector. The demand side of the model (particularly, exports and private consumption), drives the

3
evolution of production and labour demand across sectors. Regarding prices, we also find a
differential pattern between both types of firms within and across sectors. The study also
presents detailed evidence on how the impact of MNEs differs depending on the sector to which
they go. Furthermore, we analyse whether similar results at the aggregate level may underlie
different microeconomic outcomes.
The rest of the paper is organised as follows. Section 2 reviews the literature concerning the
possible differential behaviour of both types of firms. Section 3, offers a nontechnical description
of the model used in the analysis. In section 4 we describe the data, looking at the information
on the production and demand sides of the host economy. We emphasise the contrasting cost
structures of national firms and MNEs. In section 5 the consistent macro and microeconomic
results are discussed while the sensitivity analysis is performed in section 6. Finally, section 7
offers the main conclusions.
2. The literature on the differential behaviour of domestic firms versus MNEs.
As mentioned in the introduction, the literature has established for a long time that the
characteristics of MNEs are different from those exhibited by national firms. Complete reviews
of theory and evidence on this matter can be found in Barba Navaretti and Venables (2004) and
in Latorre (2010, chapter 2). In this section we will outline the main conclusions regarding some
important questions analysed in the studies of this area.
Hymer (1976) pointed out that MNEs must have some advantages such as, brand name,
reputation, skills, experience, good engineering and marketing techniques,... Otherwise, they
would not establish plants where local competitors have a priori a better position (i.e., national
firms exhibit advantages such as geographical proximity and knowledge of customers’
preferences, legal system, institutional framework…etc). Dunning (1979, 2000), following
Hymer’s work, has identified a triad of conditions that MNEs tend to exhibit. According to his
eclectic or OLI paradigm, MNEs simultaneously have advantages in “ownership, location and
internalisation”.
Empirical studies have clearly identified that MNEs are more productive than domestic firms.
This condition holds for both labour productivity (e.g., Djankov and Hoekman, 2000; Conyon et
al., 2002) and total factor productivity (e.g., Evenett and Voicu, 2001). More recently, studies
taking into account intra-industry firm heterogeneity have derived that MNEs are more
productive than exporting firms, which in turn, are more productive than firms with no foreign
operations (theoretically, e.g., Grossman et al., 2006; empirically, e.g., Aw and Lee, 2008;
theoretically and empirically, e.g., Helpman et al., 2004).

4
Many empirical analyses have also found that MNEs pay higher wages than their domestic
counterparts. However, it is less clear whether the reason for their higher wages is strictly
related to their foreign-owned character or to other characteristics of MNEs, such as, the type of
sector in which they operate, their larger size, their superior technologies because of the
specific and superior assets they use and other “superior” characteristics, always compared to
domestic firms (Latorre, 2010, chapter 2).
From a theoretical point of view, as noted earlier, the microeconomic adjustment in a setting
considering national firms and MNEs may lead to either a pro-competitive effect or to a more
concentrated structure (Ferrett, 2004). Aitken and Harrison (1999) offer the intuition that the
entry of FDI inflows (i.e., a stronger presence of MNEs) will bring about a reduction in the output
of domestic firms due to stronger competition. This will induce domestic firms to produce in less
efficient points of their declining average cost curve, thus, reducing their productivity. However,
in general, applied studies face particular difficulties in this area of analysis. Barba Navaretti and
Venables (2004, chapter 7) notice that it is difficult to disentangle the effects on market
performance produced by the possible effects of MNEs’ presence (such as spillovers or
backward and forward linkages) from those directly derived from market competition itself. A few
exceptions are the following studies. Co (2001) derives a complex interplay between previous
levels of concentration, the type of FDI undertaken (i.e., greenfield versus non-greenfield) and
the timing of adjustments in the levels of concentration after the entry of MNEs in the US
economy. Barrios et al. (2005) and Sembenelli and Siotis (2005) find that after the arrival of FDI
flows the pro-competitive effect first dominates but is gradually outweighed by positive
externalities in Ireland and in non R&D intensive sectors in Spanish manufacturing, respectively.
However, these two latter studies find that in R&D intensive sectors positive spillovers result in
an increase in margins after the entry of FDI flows, thus leading to a more concentrated market
structure. These empirical studies use FDI flows to analyse market performance. By contrast,
our approach analyses this issue in a framework explicitly considering national firms and MNEs’
cost structures. In this setting we derive the results on their differential behaviour regarding
labour demand, production and prices.
3. The model and simulations
We provide now a brief description of the main features of the model and of the focus of the
simulations in this paper. To begin with, the model is an extension of a widely used CGE model
called GTAP (Hertel, 1997). GTAP stands for “Global Trade Analysis Project”. The standard
version of the GTAP model is a static one, with which the medium term impact of different
shocks can be analysed. It rests on the rigorous theoretical framework of the Arrow-Debreu
general equilibrium model, thus the interactions among firms in the economy are based on
microeconomic optimisation behaviour. The macroeconomic perspective is embedded in a set
of equations reflecting the national accounts identities. These latter equations reproduce the
5
circular flow of the economy: production, income distribution, and (domestic and foreign)
demand. We use a modern formulation of the Arrow-Debreu approach following Rutherford
(2005) and use GAMS programming.
We construct a 2-region, 2-factor, 20-sector model. MNEs are only present in one region,
namely, the host economy. By contrast, the other region, the rest of the world (ROW), has no
MNEs due to the absence of data. Indeed, it is data availability which has led to the introduction
of MNEs in the GTAP model in a particular way. The OECD (2009) and Eurostat (2009) offer
rather homogeneous statistics on the activities of MNEs for a set of countries at the sectoral
level. The scope of information varies across countries but for most of them, we can find some
information regarding the differences in cost structures between national firms and MNEs. We
have expanded the standard GTAP model using this information. Therefore, we have two
sources of production of each good and sector i in the economy hosting MNEs. In other words,
for each i good and sector there are two different varieties –a foreign and a national one–.
In the few CGE models including MNEs it is common to make a “symmetry assumption”, by
which the combinations of capital and labour, and domestic versus imported intermediates are
the same for national firms and MNEs operating within the same sector (see Lejour and Rojas-
Romagosa, 2006, and Latorre, 2009, for reviews of this literature). A notable exception is the
model by Rutherford and Tarr (2008). In their model, MNEs produce using an extra intermediate
imported input which is not present in the technology of national firms. However, there is no
difference in capital intensity or in the use of domestic intermediates. Rutherford and Tarr
(2008) introduce monopolistic competition which they find important to derive their results. By
contrast, Verikios and Zhang (2001) and Dee et al. (2003) claim that this latter feature does not
seem to be important in their CGE model outcomes. In any case, in the scarce CGE models
with MNEs that include economies of scale and imperfect competition, the symmetry
assumption also applies to these characteristics. Indeed, national firms and MNEs operating
within the same sector exhibit identical magnitudes of economies of scale and mark-ups.
Further, none of these models presents any detailed sectoral outcomes, since the focus of their
analysis is different from the one adopted here.
We try to break the symmetry assumption by relying on real data about the production
structures of national firms and MNEs as supplied by the OECD and Czech National Bank (see
below). Thus, the input mix will differ between both types of firms within the same sector.
Further, capital is modelled as a specific factor which befits the extended conclusion in the
literature that MNEs have some “specific assets” and “ownership advantages”. Capital, thus,
exhibits different prices according not only to the type of good for which it is used, as in the
standard GTAP model, but also according to whether it is used in the production of the foreign

6
or the national variety of that good1. Because of all these differences in cost structures and the
specific capital assumption, costs, prices and quantities produced of the different (i.e., the
foreign and national) varieties within the same sector will differ.
In our model, in the country hosting MNEs the national and foreign variety are blended into a
unique composite good i − the “domestic” good −, which is the one available for final or
intermediate consumption. We further simplify the demand side of the model by assuming a
representative household in each region. His budget is formed by adding the remuneration of all
factors of production as well as fiscal revenues from several taxes. She fully spends his income
in investment, government consumption, and public consumption. Due to our static framework,
investment is an exogenous component of final demand. To prevent biases from government
activities the real level of public consumption is kept constant. The demand side of the model
will allow us to distinguish the contrasting patterns of behaviour among sectors mainly devoted
to private consumption versus those more devoted to exports. It further facilitates making
welfare evaluations.
Labour is perfectly mobile across sectors and its endowment is fixed. By contrast, in our
simulations of the entry of MNEs, capital increases in the foreign part of the particular sector
receiving FDI flows, while in the rest of sectors it remains fixed, due to its sector-specific nature.
The amount by which foreign capital is increased reflects the increase really experienced in the
FDI position of MNEs across the five sectors considered in the period 2001-2004. The sectors
include manufacturing as well as services sectors: (i) Chemicals, rubber and plastics
(Chemicals, henceforth); (ii) Motor vehicles; (iii) Electronics; (iv) Trade, repair; hotels and
restaurants (Trade, henceforth); and (v) Finance, insurance, real estate, business activities
(Finance, henceforth). As will be seen in the next section, these sectors have received
significant amounts of FDI and they account for an important share in the overall production in
the Czech economy. Furthermore, for manufactures, they represent mostly dynamic activities,
i.e., they are medium- and high-technology sectors.
Notice that we are assuming that the entry of MNEs (or FDI flows) brings about an increase of
the capital available for MNEs’ production, while among developed countries most FDI flows are
1 In the present version of the model, there is an extra feature to differentiate national firms and MNEs’
technology. They differ in the capability to substitute domestic intermediates by imported ones. This
feature was absent in our previous simulations in Latorre (2010, chapter 3) or in Latorre et al. (2009).
Technically this is done by introducing in the code a new elasticity in production functions, whose value is
3 times bigger in MNEs compared to national firms. However, the impact of this assumption, which could
capture potential effects of off-shoring, is small. A huge, e.g., 8 times bigger, difference has to be assumed
to obtain substantial differences in results.

7
related to mergers and acquisitions (Barba Navaretti and Venables, 2004). For Central Eastern
European (CEE) Countries, however, it makes sense to interpret the arrival of MNEs as a
capital increase. It is well known that the capital stocks in these economies were obsolete by
the end of the 1980s, when the Berlin Wall (and the barriers to the entry of MNEs) fell (Krkoska,
2001; Bornstein, 2001; Lizal and Svegnar, 2002). Furthermore, Greenfield investments are
more common in these CEE countries than among developed ones (Schöllmann, 2001). This
way of modelling the entry of MNEs contrasts with the one usually undertaken in the few CGE
models considering the presence of MNEs. Most of them have analysed the impact of the fall in
barriers to FDI. However, the estimation of those barriers faces no few difficulties, while being
influential for the model outcomes. Thus, we opt to rely on the public available data about the
increase in the FDI position in the period 2001-4.
4. Data
As noted above, our specification of the GTAP model corresponds to a 2-region, 2-factor, 20-
sector CGE model. In this section we will offer a panorama of the importance of the twenty
sectors in the Czech Republic and their demand orientation, stressing the differential cost
structures between national firms and MNEs operating in them.
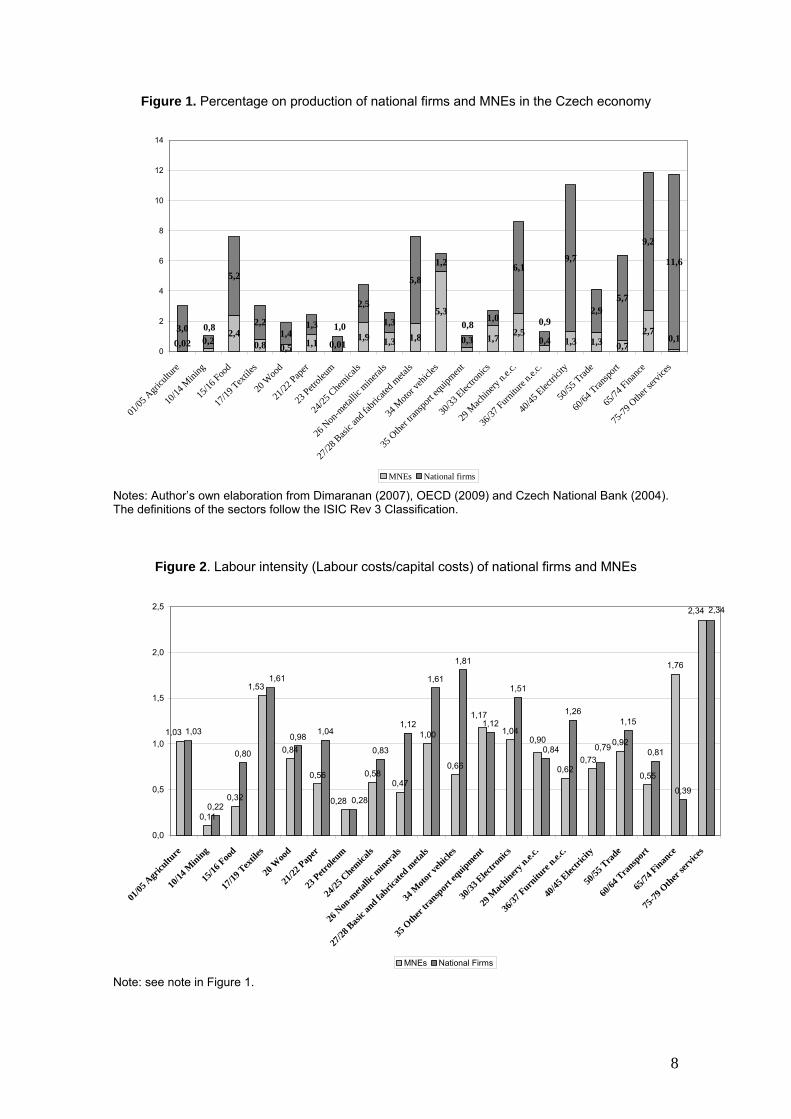
We present 5 Figures indicating the situation in the year 2001. Figure 1 shows the weights on
total production of the Czech Republic of national firms and MNEs in each of the twenty sectors
in which this country has been split. The weight of MNEs is particularly remarkable for sectors
such as Motor vehicles (5.3 percent of total Czech production) and Finance (2.7 percent).
Overall, 29.1 percent of gross production in the Czech Republic is in the hands of MNEs.
Figure 2, shows labour intensity of national firms and MNEs across sectors. As expected,
national firms are in general more labour intensive than MNEs. This is a rather simple
characterisation between national firms and MNEs’ technology. However, it has recently been
related with important characteristics such as the differential patterns of foreign trade across
sectors and countries. In particular, Antràs (2003) derives that capital intensity is the main
determinant of the considerable variation of intrafirm trade across industries. This means that
industries producing more complex goods (which are capital-intensive, e.g., chemicals) are
more likely to be produced within MNEs, under vertical integration, thus, bringing about intrafirm
trade. By contrast, simpler goods (labour-intensive, e.g., textiles) tend to be bought under
contract, through outsourcing and involve arm’s length trade.
8
Figure 1. Percentage on production of national firms and MNEs in the Czech economy
2,40,8 0,5 1,1
1,9 1,3 1,8
5,3
1,72,5
1,3 1,3 0,7
2,73,0
5,2
2,21,4
1,3
2,5
1,3
5,8
1,2
1,0
6,19,7
2,95,7
9,2
11,6
0,010,10,3 0,40,20,02
1,0 0,8 0,90,8
0
2
4
6
8
10
12
14
01/0
5 Agr
icultu
re
10/14
Mini
ng
15/1
6 Foo
d
17/1
9 Tex
tiles
20 W
ood
21/22
Pap
er
23 P
etrole
um
24/25
Che
micals
26 N
on-m
etalli
c mine
rals
27/28
Bas
ic an
d fab
ricate
d meta
ls
34 M
otor v
ehicl
es
35 O
ther t
ransp
ort e
quipm
ent
30/3
3 Elec
tronic
s
29 M
achin
ery n.
e.c.
36/37
Fur
nitur
e n.e.
c.
40/45
Elec
tricit
y
50/5
5 Trad
e
60/6
4 Tran
spor
t
65/74
Fina
nce
75-7
9 Othe
r serv
ices
MNEs National firms
Notes: Author’s own elaboration from Dimaranan (2007), OECD (2009) and Czech National Bank (2004). The definitions of the sectors follow the ISIC Rev 3 Classification.
Figure 2. Labour intensity (Labour costs/capital costs) of national firms and MNEs
0,11
0,32
0,84
0,56 0,580,47
1,00
0,66
1,04
0,62
0,92
0,55
1,76
0,22
0,80
0,981,04
0,83
1,12
1,61
1,81
1,12
1,51
1,261,15
0,81
0,39
2,34
0,73
0,90
1,17
1,53
1,03
0,28
2,34
0,790,84
1,61
1,03
0,28
0,0
0,5
1,0
1,5
2,0
2,5
01/05
Agr
icultu
re
10/14
Min
ing
15/16
Foo
d
17/19
Tex
tiles
20 W
ood
21/22
Pap
er
23 P
etrole
um
24/25
Chem
icals
26 N
on-m
etalli
c min
erals
27/28
Bas
ic an
d fabric
ated
meta
ls
34 M
otor
vehicl
es
35 O
ther
tran
spor
t equip
men
t
30/33
Elec
tronics
29 M
achin
ery n
.e.c.
36/37
Furn
iture
n.e.
c.
40/45
Elec
tricit
y
50/55
Tra
de
60/64
Tra
nspor
t
65/74
Fin
ance
75-7
9 Oth
er se
rvice
s
MNEs National Firms
Note: see note in Figure 1.

9
In addition to the labour intensity differential, our model includes features related with the origin
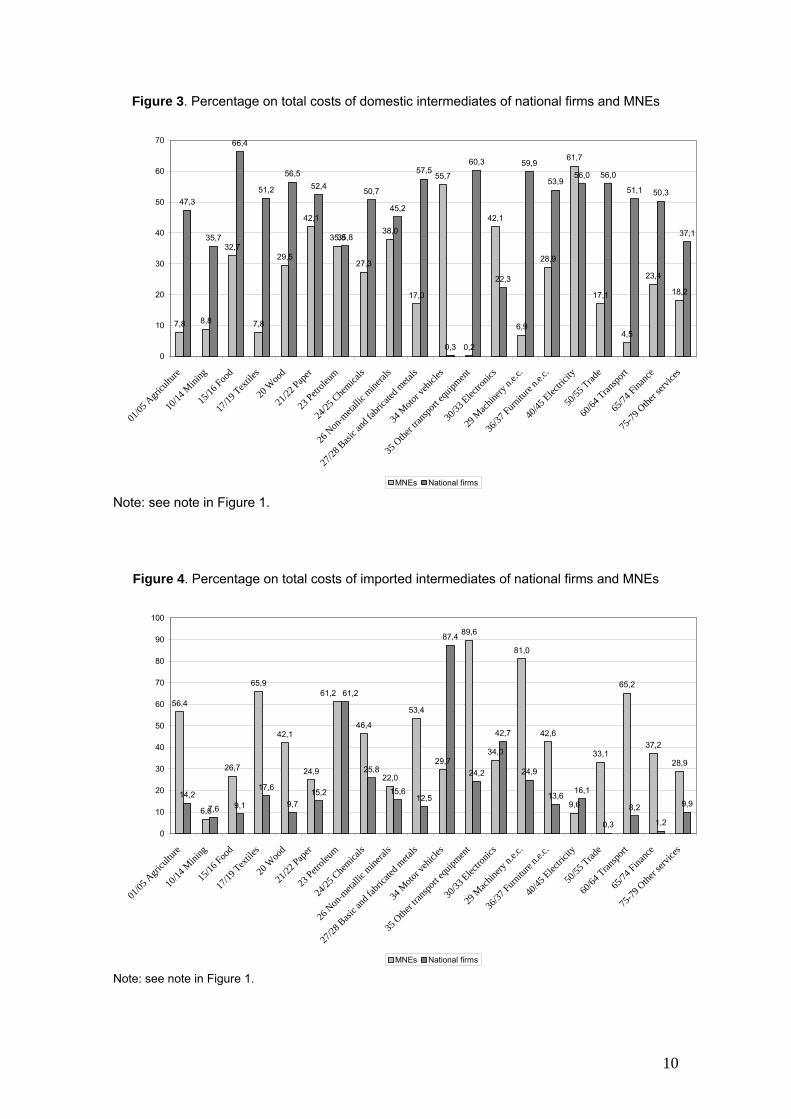
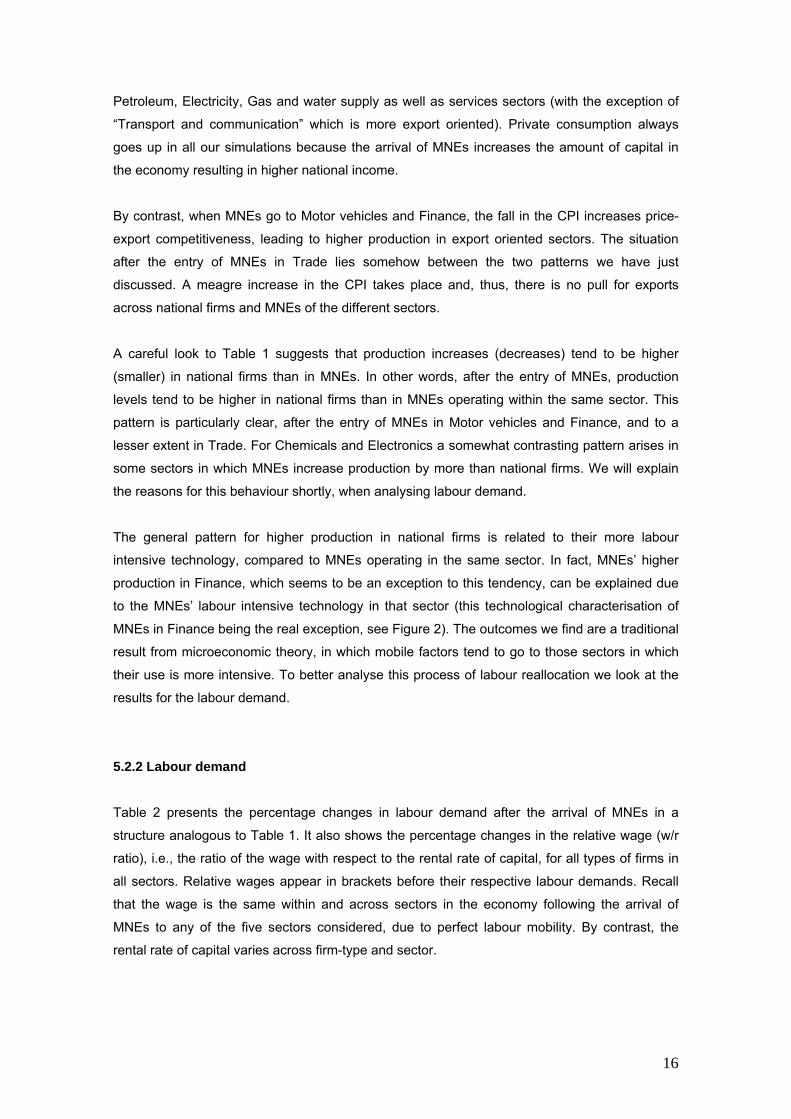
of the intermediate goods used for production. Figure 3 presents the weight in total costs of
domestic intermediates (i.e., intermediates bought within the Czech economy). National firms
rely much more on these domestic intermediates, because as Figure 4 shows MNEs tend to
buy intermediates abroad. The weight of imported intermediates in total costs tends, then, to be
much higher in MNEs than in national firms. Note that the weight of intermediate costs (i.e., of
domestic and imported intermediates) is very relevant in total costs in general across sectors.
This characteristic will be important for the result in prices.
Figure 5 turns to the demand side of the economy. It shows the different uses of sectoral
production, together with their relative importance across sectors. This information is not
available at the firm-type level but at the sectoral level. Gross production can be devoted to five
different uses: 1) Intermediates 2) Investment, 3) Exports, 4) Private consumption, and 5) Public
consumption. The Figure again makes clear the importance of intermediates in the model; this
time in the demand side, as reflected in the high share of production devoted to intermediates.
Analysing the role of intermediates is complex, due to the 20-sector level of disaggregation. In
order to grasp their effects, we need to rely on the general equilibrium nature of our model,
which takes into account these sectoral relationships. The weight of exports and private
consumption is also of considerable relevance, though. Indeed, we will see that by looking at
the evolution of these two latter components of demand the response in sectoral output and
labour demand across sectors can be traced.
The process to obtain the information shown in the previous Figures has been as follows. First,
we have disaggregated the Czech Republic into a 20-sector level using the GEMPACK software
package and the GTAP6 database (Dimaranan, 2007). GTAP6 is a unique source of data for
general equilibrium analysis elaborated by the GTAP group of researchers. It offers an
ambitious set of information for 87 regions in the world (most of them countries) at a 57 sector
level and 5 factors of production. In order to split the information on costs for national firms and
MNEs in each or our twenty sectors, the OECD (2009) and Czech National Bank’s (2004) data
have been exploited. We end up with a snapshot of the situation of the Czech economy in the
year 2001. This snapshot will constitute the benchmark or reference point to analyse the results
of the entry of MNEs.
Finally, regarding data on elasticities, the elasticity of transformation of capital across sectors is
set at 10-6, to reflect that capital is specific and does not move across sectors. The elasticity of
substitution between national and foreign production within the Czech Republic has the same
value to that between domestic and imported final goods (Armington elasticity supplied by
GTAP). The elasticity of substitution between domestic and imported intermediates takes a
value three times bigger in MNEs than in national firms. For the rest of elasticities the values
calculated by the GTAP team from econometric evidence have been taken (Hertel et al., 2007).
10
Figure 3. Percentage on total costs of domestic intermediates of national firms and MNEs
7,8 8,8
32,7
7,8
29,5
42,1
35,8
27,3
38,0
17,0
55,7
0,2
42,1
6,9
28,9
61,7
17,1
4,5
23,4
18,2
47,3
35,7
66,4
51,2
56,5
52,4
35,8
50,7
45,2
57,5
0,3
60,3
22,3
59,9
53,956,0 56,0
51,1 50,3
37,1
0
10
20
30
40
50
60
70
01/05
Agr
icultu
re
10/14
Mini
ng
15/16
Foo
d
17/19
Tex
tiles
20 W
ood
21/22
Pap
er
23 P
etrol
eum
24/25
Che
micals
26 N
on-m
etalli
c mine
rals
27/28
Bas
ic an
d fab
ricate
d meta
ls
34 M
otor v
ehicl
es
35 O
ther t
ransp
ort e
quipm
ent
30/33
Elec
tronic
s
29 M
achin
ery n.
e.c.
36/37
Fur
nitur
e n.e.
c.
40/45
Elec
tricit
y
50/55
Trad
e
60/64
Tran
spor
t
65/74
Fina
nce
75-7
9 Othe
r serv
ices
MNEs National firms
Note: see note in Figure 1.
Figure 4. Percentage on total costs of imported intermediates of national firms and MNEs
56,4
6,6
26,7
65,9
42,1
24,9
46,4
22,0
53,4
29,7
89,6
34,0
81,0
42,6
9,6
33,1
65,2
37,2
28,9
14,2
7,6 9,1
17,6
9,7
15,2
25,8
15,612,5
87,4
24,2
42,7
24,9
13,616,1
0,3
8,2
1,2
9,9
61,2 61,2
0
10
20
30
40
50
60
70
80
90
100
01/05
Agr
icultu
re
10/14
Mini
ng
15/16
Foo
d
17/19
Tex
tiles
20 W
ood
21/22
Pap
er
23 P
etrol
eum
24/25
Che
mica
ls
26 N
on-m
etalli
c mine
rals
27/28
Bas
ic an
d fab
ricate
d meta
ls
34 M
otor
vehic
les
35 O
ther t
ransp
ort e
quipm
ent
30/33
Elec
tronic
s
29 M
achin
ery n.
e.c.
36/37
Fur
nitur
e n.e.
c.
40/45
Elec
tricit
y
50/55
Trad
e
60/64
Tran
spor
t
65/74
Fina
nce
75-7
9 Othe
r serv
ices
MNEs National firms
Note: see note in Figure 1.

11
Figure 5. Output uses from sectors in the Czech Republic
66,9
76,4
34,6
28,9
40,2
54,0
74,9
38,3
44,2
56,7
35,1
38,6
30,7
31,7
40,6
72,2
32,9
58,1
58,6
17,3
8,5
2,7
5,1
7,9
0,0
3,4
13,3
8,3
2,5
17,1
2,8
3,7
7,5
10,6
50,0
0,2
10,7
11,9
8,6
19,2
9,8
46,5
50,2
28,5
9,5
49,2
41,7
34,6
55,8
35,0
62,6
57,9
30,1
6,3
3,9
28,9
10,4
5,7
15,5
1,8
55,5
24,4
4,5
9,5
15,5
6,30,9
0,4
6,7
9,3
3,6
6,7
21,9
9,8
13,0
12,6
15,8
16,6
0,5
0,2
2,8
0,3
0,1
1,1
0,2
0,2
4,6
48,5
0% 10% 20% 30% 40% 50% 60% 70% 80% 90% 100%
Agriculture, hunting and fishing
Mining and quarrying
Food, beverages and tobacco
Textiles, wearing apparel, leather, footwear
Wood and wood products, except furniture
Paper; printing and publishing
Petroleum
Chemicals, rubber and plastics
Non-metallic mineral products
Basic and fabricated metal products
Motor vehicles
Other transport equipment
Electronics
Machinery and equipment n.e.c.
Furniture, manufacturing n.e.c.
Electricity, gas and water supply; construction
Trade, repair; hotels and restaurants
Transport, storage and communication
Finance, insurance, real estate, business activities
Other services
Intermediates Investment Exports Private consumption Public consumption
Note: see note in Figure 1.

12
Because of the Walrasian nature of the model, the monetary variables (values and prices) are
expressed with respect to a numeraire. We have followed the common practice of using the
Consumer Price Index (CPI) as the numeraire.
5. Results
5.1. Aggregate results
The macroeconomic impact of the arrival of MNEs to each of the five sectors considered in turn
is presented in Figure 6. This Figure provides the percentage change in real terms with respect
to the benchmark for aggregate variables. These are: the wage, the rental rate of capital, the
GDP at factor costs, welfare (proxied by the change in private consumption and income of the
representative household2), the CPI and the value of imports and exports, the two latter being
measured at international prices. In order to compare the relative amounts of FDI flows involved
in each shock, we also offer the increase in the total stock of capital of the Czech economy that
the arrival of MNEs in the period 2001-2004 conveys. The labels of the figure indicate to which
sector MNEs have gone.
Figure 6. Simulation of the entry of MNEs in five selected sectors (2001-4): Effects on aggregate variables
-4,00
-3,50
-3,00
-2,50
-2,00
-1,50
-1,00
-0,50
0,00
0,50
1,00
1,50
2,00
2,50
3,00
3,50
4,00
wage Rental rate of capital
GDP Welfare CPI Imports Exports Increase in capital stock
Chemicals Motor vehicles Electronics Trade Finance
2 In this model, because investment and public consumption are fixed in real terms, percentage changes in
welfare can be proxied by the variation in real private consumption (Hertel, 1997, chapter 1). Additionally,
due to the mathematical properties of the function of private consumption, percentage variations in private
consumption coincide with those of household’s income.

13
The entry of MNEs always brings about an increase in the wage and a decrease in the rental
rate of capital, regardless of the sector in which it takes place. The wage of the economy is the
same across and within sectors, due to the assumption of full mobility of labour. Its increase is
consistent with the literature stressing that MNEs tend to pay higher wages than domestic firms.
The aggregate rental rate of capital is a weighted average of its price in all sectors. Its fall
makes sense in a context where more capital is added to an economy with a fixed stock of
labour. Labour will tend to be more productive (resulting in a wage increase) and capital will be
less productive (inducing a fall in its remuneration). The results agree with the predictions of the
theory of international trade under the assumption of specific capital (e.g., Jones, 1971, 2002).
The increase in the wage and the higher level of capital received in the host economy
predominate over the decrease in the rental rate of capital. Thus, the arrival of MNEs leads to,
rather small, higher levels of GDP and welfare. But note we are simulating the arrival of MNEs
to one particular sector in each simulation. The arrival of MNEs to several sectors
simultaneously would result in more intense increases.
The entry of MNEs in Motor vehicles brings about the lowest increase in GDP and welfare. This
is due to a higher fall in the rental of capital and a lower increase in the wage than what the
entry of MNEs produces in the rest of sectors. This less favourable evolution of factor prices,
compared to the rest of sectors, leaves little scope for GDP at factor costs to increase. Nor does
it help to obtain a sufficient increase in income, so that a significant rise in private consumption
(and thus in welfare) can be achieved. This seems consistent with the literature analysing MNEs
in Motor vehicles of the Czech Republic. These MNEs undertake rather low value added
operations (Pavlínek, 2003), with foreign suppliers providing almost all high-value added
components (Dycker, 2006; Pavlínek and Janâk, 2007; Pavlínek et al., 2009).
The CPI may either increase or decrease depending on the sector to which MNEs arrive. When
MNEs go to Chemicals and Electronics the relatively higher increase in wages coupled with a
relatively smaller decrease in the rental rate of capital (particularly in Electronics) lead to a
positive increase in the CPI. By contrast, after the arrival of MNEs to Motor vehicles and
Finance, and to a lesser extent to Trade, the price reduction which takes place in the particular
sector receiving MNEs (to be analysed shortly) predominates leading to a decrease in the CPI.
This evolution of the CPI will have important consequences at the microeconomic level since it
will influence the export price competitiveness of most manufacturing sectors.
Finally, aggregate foreign trade increases after the arrival of MNEs, in response to the higher
level of economic activity that their entry produces in the host economy. Let us begin with the
analysis of imports. Intermediates account for the most important share in imports in the Czech
Republic, as in most countries, but in the Czech case with an outstanding 82.8 percentage of
total aggregate imports. Note that the main microeconomic impact takes place in the sector
receiving MNEs, whose increase in production will be the highest among all sectors (as will be

14
clearer below). If that sector has an important weight in imports, the impact on aggregate
imports will be greater. Thus, the weight in imports of Chemicals (12.8 percent), Electronics (9.4
percent), Motor vehicles (7.5 percent), Finance (6.5 percent) and Trade (1.1 percent) in the
benchmark explain their relative positions in aggregate imports. On the other hand, the increase
in exports is related to the important fall in the price of the good sold in the sector receiving
MNEs (as will be seen below), which greatly enhances the competitiveness of that sector.
To sum up, after the arrival of MNEs while the aggregate rental rate of capital decreases, the
wage always increases. Factor prices, together with the corresponding increase in capital, are
behind the evolution of the GDP, measured at factor costs. This experiences small increases, in
general, ranging from 0.14 percent in Motor vehicles to 0.82 percent in the case of Finance.
Welfare results are parallel to those derived for GDP, i.e., the sectors experiencing higher
(lower) GDP increases are also experiencing higher (lower) rises in welfare. MNEs in services
lead to a smaller increase in trade activity as compared to MNEs in manufactures.
5.2. Sectoral results
5.2.1 Production
We look now at the differential responses in production of national firms and MNEs in all sectors
of the Czech Republic. Table 1 shows their corresponding percentage variations with respect to
the benchmark after the arrival of MNEs to any of the five sectors considered in turn (there is
one column for each of these five sectors). The arrival of MNEs, experienced in the period
2001-2004, brings about an important increase in their output. By contrast, output responses of
national firms and MNEs in the rest of sectors are of a rather limited magnitude.
Three different patterns of production behaviour across sectors arise. After the arrival of MNEs
to Chemicals and Electronics, there is a general decrease in production of national firms and
MNEs operating in the rest of sectors. By contrast, when MNEs go to Motor vehicles and
Finance, there is a general upward tendency in production for national firms and MNEs in the
rest of the economy. A somewhat intermediate case occurs after the arrival of MNEs to the
Trade sector. These patterns of production across the sectors not directly involved in the shock
seem to be determined by the evolution of the demand.
After the arrival of MNEs to Chemicals and Electronics, the CPI goes up (as reflected in Figure
6). This will reduce export-price competitiveness and, therefore, national firms and MNEs
operating in the sectors which are more export oriented (most manufactures, as shown in
Figure 5) will reduce exports and production. By contrast, national firms or MNEs whose output
is more oriented to private consumption increase their production. The latter are firms in Food,

15
Table 1. Simulation of the entry of MNEs in five selected sectors (2001-4): Effects on production of national firms and MNEs (percentage change from benchmark)
Chemicals Motor vehicles Electronics Trade Finance
MnesNational
firms Mnes
National firms
MnesNational
firms Mnes
National firms
MnesNational
firms Agriculture, hunting and fishing -0.10 -0.06 0.02 0.08 -0.09 -0.11 -0.03 0.06 -0.02 0.12
Mining and quarrying -0.02 -0.04 0.00 0.01 -0.02 -0.04 0.00 -0.01 0.00 0.00
Food, beverages and tobacco 0.00 0.77 -0.01 0.24 -0.18 0.53 0.12 0.66 0.18 1.16
Textiles, wearing apparel, leather, footwear -0.34 -0.17 0.06 0.33 -0.65 -0.77 -0.06 0.13 0.17 0.52
Wood and wood products, except furniture -0.41 -0.66 0.09 0.30 -0.49 -0.81 -0.11 -0.12 0.03 0.14
Paper; printing and publishing -0.45 -0.28 0.10 0.33 -0.71 -0.33 -0.11 -0.01 0.29 0.35
Petroleum -0.41 0.36 0.06 0.06 -0.30 0.18 -0.19 0.30 -0.22 0.48
Chemicals, rubber and plastics 69.41 11.79 0.14 0.35 -0.65 -0.38 -0.14 -0.07 0.12 0.17
Non-metallic mineral products -0.52 -0.21 0.09 0.44 -0.76 -0.09 -0.16 0.00 0.09 0.16
Basic and fabricated metal products -0.78 -1.09 -0.08 0.45 -0.91 -1.03 -0.25 -0.20 -0.01 0.30
Motor vehicles -0.31 -0.15 51.09 0.73 -0.36 0.07 0.00 -0.02 0.29 -0.04
Other transport equipment -0.36 -0.45 0.36 0.80 -0.28 -0.26 0.05 0.23 0.25 0.59
Electronics -0.65 -0.34 0.24 0.33 63.42 11.64 -0.19 -0.06 0.30 0.22
Machinery and equipment n.e.c. -0.36 -0.52 1.74 5.11 -0.30 -0.47 -0.06 0.03 0.10 0.42
Furniture, manufacturing n.e.c. -0.27 -0.15 0.10 0.31 -0.50 -0.51 -0.01 0.16 0.19 0.51
Electricity, gas and water supply; construction -0.44 0.12 -0.14 0.23 -0.62 0.09 -0.08 0.34 0.33 0.64
Trade, repair; hotels and restaurants -0.31 0.12 0.08 0.57 -0.61 0.11 25.44 3.56 0.72 1.25
Transport, storage and communication -0.28 -0.33 0.13 0.29 -0.19 -0.36 -0.08 0.15 -0.11 0.36
Finance, insurance, real estate, business activities 0.52 -0.23 0.51 0.02 0.10 -0.20 0.41 0.03 11.51 1.72
Other services -0.04 0.06 0.43 0.09 0.29 -0.02 0.06 0.16 -0.02 0.37
Note: The definitions of the sectors follow the ISIC Rev 3 Classification.
16
Petroleum, Electricity, Gas and water supply as well as services sectors (with the exception of
“Transport and communication” which is more export oriented). Private consumption always
goes up in all our simulations because the arrival of MNEs increases the amount of capital in
the economy resulting in higher national income.
By contrast, when MNEs go to Motor vehicles and Finance, the fall in the CPI increases price-
export competitiveness, leading to higher production in export oriented sectors. The situation
after the entry of MNEs in Trade lies somehow between the two patterns we have just
discussed. A meagre increase in the CPI takes place and, thus, there is no pull for exports
across national firms and MNEs of the different sectors.
A careful look to Table 1 suggests that production increases (decreases) tend to be higher
(smaller) in national firms than in MNEs. In other words, after the entry of MNEs, production
levels tend to be higher in national firms than in MNEs operating within the same sector. This
pattern is particularly clear, after the entry of MNEs in Motor vehicles and Finance, and to a
lesser extent in Trade. For Chemicals and Electronics a somewhat contrasting pattern arises in
some sectors in which MNEs increase production by more than national firms. We will explain
the reasons for this behaviour shortly, when analysing labour demand.
The general pattern for higher production in national firms is related to their more labour
intensive technology, compared to MNEs operating in the same sector. In fact, MNEs’ higher
production in Finance, which seems to be an exception to this tendency, can be explained due
to the MNEs’ labour intensive technology in that sector (this technological characterisation of
MNEs in Finance being the real exception, see Figure 2). The outcomes we find are a traditional
result from microeconomic theory, in which mobile factors tend to go to those sectors in which
their use is more intensive. To better analyse this process of labour reallocation we look at the
results for the labour demand.
5.2.2 Labour demand
Table 2 presents the percentage changes in labour demand after the arrival of MNEs in a
structure analogous to Table 1. It also shows the percentage changes in the relative wage (w/r
ratio), i.e., the ratio of the wage with respect to the rental rate of capital, for all types of firms in
all sectors. Relative wages appear in brackets before their respective labour demands. Recall
that the wage is the same within and across sectors in the economy following the arrival of
MNEs to any of the five sectors considered, due to perfect labour mobility. By contrast, the
rental rate of capital varies across firm-type and sector.

17
Table 2. Simulation of the entry of MNEs in five selected sectors (2001-4): Effects on the relative price of labour (in brackets) and on the labour demand of
national firms and MNEs (percentage change from benchmark)
Chemicals Motor vehicles Electronics Trade Finance
Mnes National firms Mnes National
firms Mnes National firms Mnes
National firms
Mnes National
firms
Agriculture (0.82) -0.19 (0.47) -0.11 (-0.20) 0.05 (-0.69) 0.16 (0.73) -0.17 (0.94) -0.22 (0.28) -0.07 (-0.47) 0.11 (0.19) -0.05 (-0.99) 0.23
Mining (0.87) -0.17 (1.04) -0.21 (-0.23) 0.05 (-0.31) 0.06 (0.83) -0.17 (1.00) -0.20 (0.22) -0.04 (0.24) -0.05 (0.03) -0.01 (-0.05) 0.01
Food (0.00) 0.01 (-1.53) 1.74 (0.04) -0.04 (-0.48) 0.54 (0.66) -0.74 (-1.06) 1.20 (-0.46) 0.52 (-1.32) 1.50 (-0.66) 0.75 (-2.30) 2.64
Textiles (0.45) -0.56 (0.22) -0.28 (-0.08) 0.10 (-0.43) 0.54 (0.86) -1.08 (1.00) -1.24 (0.08) -0.10 (-0.16) 0.21 (-0.23) 0.28 (-0.67) 0.85
Wood (0.72) -0.90 (1.07) -1.34 (-0.15) 0.19 (-0.48) 0.61 (0.86) -1.07 (1.32) -1.64 (0.19) -0.24 (0.20) -0.25 (-0.05) 0.06 (-0.22) 0.28
Paper (1.01) -1.25 (0.43) -0.54 (-0.22) 0.28 (-0.51) 0.65 (1.59) -1.97 (0.51) -0.64 (0.24) -0.30 (0.02) -0.03 (-0.64) 0.82 (-0.54) 0.68
Petroleum (1.37) -1.74 (-1.30) 1.66 (-0.23) 0.29 (-0.23) 0.29 (1.02) -1.29 (-0.65) 0.82 (0.70) -0.88 (-1.07) 1.36 (0.79) -0.99 (-1.75) 2.24
Chemicals (126.44) -
13.95 (-17.49) 27.42 (-0.30) 0.38 (-0.61) 0.78 (1.42) -1.77 (0.67) -0.83 (0.30) -0.37 (0.12) -0.16 (-0.26) 0.33 (-0.30) 0.37
No-met. Min. (1.29) -1.61 (0.32) -0.40 (-0.22) 0.27 (-0.66) 0.83 (1.90) -2.35 (0.14) -0.18 (0.39) -0.49 (0.00) 0.01 (-0.23) 0.30 (-0.25) 0.31
Basic metal (1.25) -1.55 (1.42) -1.76 (0.13) -0.17 (-0.57) 0.73 (1.47) -1.82 (1.34) -1.66 (0.39) -0.49 (0.25) -0.32 (0.02) -0.03 (-0.39) 0.49
Motor vehic. (0.63) -0.79 (0.19) -0.23 (198.44) -
36.96 (-0.90) 1.14 (0.72) -0.90 (-0.09) 0.11 (0.01) -0.01 (0.03) -0.04 (-0.57) 0.73 (0.05) 0.07
Other transp. (0.53) -0.66 (0.68) -0.85 (-0.53) 0.68 (-1.19) 1.52 (0.42) -0.52 (0.39) -0.49 (-0.08) 0.10 (-0.35) 0.44 (-0.37) 0.46 (-0.88) 1.12
Electronics (1.02) -1.27 (0.46) -0.57 (-0.38) 0.48 (-0.43) 0.55 (72.17) 15.48
(-13.43) 19.94 (0.30) -0.38 (0.09) -0.11 (-0.46) 0.58 (-0.29) 0.37
Machinery (0.61) -0.77 (0.91) -1.13 (-2.84) 3.70 (-8.25) 11.46 (0.50) -0.63 (0.83) -1.03 (0.10) -0.12 (-0.05) 0.06 (-0.16) 0.21 (-0.73) 0.93
Furniture (0.57) -0.71 (0.21) -0.26 (-0.20) 0.25 (-0.44) 0.55 (1.04) -1.30 (0.73) -0.91 (0.01) -0.02 (-0.22) 0.28 (-0.39) 0.49 (-0.72) 0.91
Electricity (0.77) -1.03 (-0.20) 0.27 (0.25) -0.34 (-0.38) 0.52 (1.10) -1.48 (-0.16) 0.21 (0.13) -0.18 (-0.57) 0.78 (-0.57) 0.78 (-1.06) 1.46
Trade (0.39) -0.65 (-0.13) 0.23 (-0.10) 0.16 (-0.63) 1.07 (0.77) -1.28 (-0.12) 0.20 (71.65) -
24.96 (-3.80) 6.72 (-0.88) 1.50 (-1.37) 2.35
Transport (0.51) -0.78 (0.48) -0.74 (-0.24) 0.38 (-0.42) 0.65 (0.34) -0.53 (0.52) -0.80 (0.15) -0.23 (-0.21) 0.33 (0.20) -0.31 (-0.52) 0.81
Finance (-0.64) 0.82 (0.67) -0.83 (-0.63) 0.80 (-0.06) 0.07 (-0.13) 0.16 (0.58) -0.72 (-0.51) 0.64 (-0.09) 0.12 (147.73) -
28.58 (-4.68) 6.22
Other services (0.05) -0.06 (-0.07) 0.08 (-0.48) 0.61 (-0.10) 0.13 (-0.33) 0.41 (0.02) -0.02 (-0.07) 0.08 (-0.18) 0.23 (0.02) -0.03 (-0.42) 0.53
Note: see Table 1.

18
The above mentioned higher production levels in national firms compared to MNEs within sectors are a
bit more pronounced when one looks at their respective labour demands. In this setting in which capital
is specific, and therefore fixed across sectors and type of firm, increases in output levels can only be
attained through increases in labour demands. Therefore, labour demands are parallel to the output
results displayed in Table 1, although their percentage variations are stronger.
As predicted by standard microeconomic theory, labour demand follows the evolution of the w/r ratio3.
An increase in that ratio implies that labour has become relatively expensive to the use of capital. As a
result, the national firm or MNE experiencing that increase in the w/r ratio will diminish its labour
demand. Conversely, cheaper labour relative to capital (a fall in the w/r ratio) results in an increase in
labour demand. Since the wage is the same for national firms and MNEs across sectors, it is the
evolution of the rental rate of capital which ultimately determines the w/r and the labour demand. The
rental rate of capital has traditionally presented difficulties to be well understood in economics4. Here we
can see that in the sector receiving MNEs it experiences an important fall, which is consistent with the
idea that MNEs accruing to a country do experience losses in the short run (e.g., Dycker, 2006, for
Motor vehicles companies going to Eastern European countries). We also see that the rental rate of
capital tends to be higher in national firms. As a consequence the w/r ratio tends to be lower in national
firms and their labour demands higher (always compared to their MNEs counterparts within sectors).
This explains the higher output levels in national firms compared to MNEs operating in the same sector.
We mentioned above, that after the entry of MNEs in Chemicals and Electronics, some MNEs increase
production by more than national firms within some sectors. This should not be regarded as an
exceptional behaviour. When MNEs go to Chemicals and Electronics total labour demand in that sector
increases, i.e., the resulting demand from both national firms and MNEs from that sector goes up. This
contrasts with total labour demand when MNEs go to Motor vehicles, Trade and Finance5. As a result,
more labour is available for the rest of sectors in the economy when MNEs go to these latter sectors and
that is why labour intensive firms benefit from this relatively abundant factor. However, when more
labour is allocated to the sector receiving MNEs, it makes sense that labour intensive sectors may suffer
3 The w/r ratio is the slope of the isocost line and the equilibrium is reached when that slope coincides with the slope
of an isoquant curve.
4 The exact percentage in the rental rate of capital (r) for each particular firm and sector can be easily derived by
subtracting the percentage change of the w/r ratio to its corresponding wage (Figure 6), i.e., ∆w – ∆(w/r) = ∆w –
(∆w–∆r) = ∆r.
5 When adding MNEs and national firms’ labour demands in the particular sector receiving MNEs, we obtain the
following variation in total demand of that sector: Chemicals (+10,79%), Motor vehicles (-28,21%), Electronics
(+17,72%), Trade (-3,2%) and Finance (-5,96%). So more labour would be hired in Chemicals and Electronics, and
less labour in the rest of sectors.

19
its scarcity. That is why after the entry of MNEs in Chemicals and Electronics, some national firms
exhibit lower levels of production than their MNEs counterparts.
The fact that total labour demand increases when MNEs go to Chemicals and Electronics, conveys the
idea that labour tends to be more productive in these two (more technologically advanced sectors) than
in Motor vehicles, Trade and Finance. Note also that after the arrival of MNEs in these sectors, there is
higher CPI (which makes the domestic intermediate demand of national firms more expensive) together
with an important increase in the wage, compared to the entry of MNEs in the other sectors considered.
These forces are simultaneously damaging national firms’ costs resulting in lower rental rate of capitals
in national firms than in MNEs within some sectors.
5.2.3 Prices
Table 3 presents the results for prices in a structure analogous to Tables 1 and 2. The price of the good
sold by MNEs in the sector to which they accrue diminishes. The increase in capital strongly lowers its
rental rate (a result which had appeared previously in the w/r ratio), driving costs of production and
prices down in that foreign part of the sector.
Across the rest of sectors three general patterns of responses emerge. After the entry of MNEs in
Chemicals and Electronics most prices diminish, while for their entry in Motor vehicles and Finance most
prices increase. Trade, again, lies somewhere in between. Recall that in sectors which are not receiving
MNEs output moves along with labour demand. After the entry of MNEs in Motor vehicles and Finance,
there is an upward tendency in production. This means they are increasing their labour demands. In a
context of rising wages factor costs increase. Some sectors diminish labour demand after the entry of
MNEs in Trade, however, since the increase in the wage is higher than after the entry in Motor vehicles
and Finance, we get some increases in prices after the entry of MNEs in trade. This gives an idea of the
general higher prices after the entry of MNEs in these sectors. By contrast, for the entry of MNEs in
Chemicals and Electronics, even though wages are also rising, there is a general decrease in labour
demand across sectors.
Within sectors there is a tendency for prices to increase by more (or decrease by less) in national firms
than in MNEs. In other words, after the entry of MNE in any of the five sectors analysed, prices of
national firms tend to be, in general, higher than those of MNEs. This is related to the more labour
intensive technology of national firms versus MNEs. The former will tend to experience higher factor
costs because the wage increases at the same time that they tend to increase production by more
(hiring thus more labour) than their MNEs counterparts within the same sector. Their higher factor costs
will lead them to charge higher prices. Or, put differently, the less advanced technology of technology of
national firms results in higher prices of the variety they sell.

20
Table 3. Simulation of the entry of MNEs in five selected sectors (2001-4): Effects on prices of national firms and MNEs (percentage change from benchmark)
Chemicals Motor vehicles Electronics Trade Finance
Mnes
National firms
MnesNational
firms Mnes
National firms
Mnes National
firms Mnes
National firms
Agriculture. hunting and fishing -0.05 0.07 0.19 0.22 -0.06 0.00 0.02 0.15 0.10 0.32
Mining and quarrying -0.19 -0.17 0.25 0.23 -0.22 -0.19 -0.01 0.01 0.11 0.12
Food, beverages and tobacco 0.12 0.37 0.10 0.21 -0.05 0.30 0.20 0.30 0.27 0.47
Textiles, wearing apparel, leather, footwear -0.07 -0.06 0.19 0.20 -0.09 0.00 0.02 0.06 0.14 0.13
Wood and wood products, except furniture -0.13 -0.07 0.16 0.22 -0.08 -0.09 -0.02 0.04 0.07 0.13
Paper; printing and publishing -0.16 -0.01 0.20 0.23 -0.23 0.03 0.02 0.07 0.16 0.09
Petroleum -0.21 -0.11 0.21 0.22 -0.13 -0.13 0.02 0.04 -0.06 0.16
Chemicals, rubber and plastics -11.30 1.62 0.19 0.21 -0.21 -0.05 0.01 0.04 0.13 0.10
Non-metallic mineral products -0.26 0.02 0.18 0.23 -0.37 0.12 -0.03 0.06 0.12 0.08
Basic and fabricated metal products -0.14 -0.05 0.15 0.21 -0.18 -0.06 -0.02 0.03 0.07 0.09
Motor vehicles -0.10 -0.10 -8.62 0.23 -0.12 -0.11 0.02 0.02 0.08 0.12
Other transport equipment -0.13 -0.09 0.24 0.14 -0.15 -0.15 0.02 0.00 0.13 0.08
Electronics -0.16 -0.07 0.21 0.21 -6.39 2.12 0.01 0.03 0.09 0.09
Machinery and equipment n.e.c. -0.14 -0.11 0.38 -0.46 -0.17 -0.14 0.00 0.01 0.10 0.09
Furniture, manufacturing n.e.c. -0.15 0.00 0.19 0.21 -0.14 0.00 0.01 0.08 0.13 0.16
Electricity, gas and water supply; construction -0.09 0.17 0.08 0.21 -0.23 0.10 -0.08 0.16 0.07 0.24
Trade, repair; hotels and restaurants 0.12 0.33 0.03 0.15 -0.02 0.27 -13.16 0.69 0.38 0.06
Transport, storage and communication -0.04 0.12 0.22 0.13 -0.04 0.06 -0.02 0.07 0.09 0.15
Finance, insurance, real estate, business activities 0.21 0.07 0.23 0.12 0.10 0.05 0.10 0.16 -11.62 1.34
Other services 0.13 0.29 0.20 0.12 0.26 0.25 0.04 0.14 0.13 0.07 Note: see Table 1.
21
However, factor costs are not the only forces behind the adjustment in prices. To see this, a look to the evolution
of prices after the entry in Finance is worthwhile. In this case, for an important number of sectors, national firms
experience lower prices increases than MNEs operating within the same sector. This is not the general tendency
described above, but can be explained taking into account the importance of Finance, as an intermediate
throughout all sectors of the economy. Remember that national firms rely heavily on domestic intermediates
(Figure 3), whereas MNEs rely more on imported ones (Figure 4). As a consequence, the price decrease
experienced in Finance after the arrival of MNEs to this sector, diminishes the intermediate costs of national firms.
This tendency in intermediates is strong enough so as to counteract the higher wages which tend to push up
factor costs more intensively in national firms.
6. Sensitivity
The last step of this analysis is to look at the robustness of the results we have obtained. To this aim we perform
the so called Conditional Systematic Sensitivity Analysis (CSSA) (Harrison et al., 1993). This consists in running
again the same simulations as before but with different values for the main elasticities of the model. Thus, we
repeat the simulation of the arrival of MNEs to the five same sectors changing three elasticities. These are: 1) the
elasticity of substitution between imports and domestic production (i.e., the Armington elasticity); 2) the elasticity
of substitution between national firms and MNEs’ production; and 3) the elasticity of substitution between labour
and capital. We choose one of the three elasticities, double and halve its value in all of the twenty sectors of the
Czech Republic (while holding the rest of elasticities at their initial benchmark level), and then compare the results
obtained with the ones already analysed above. Recall that the standard values of the elasticities stem from the
GTAP Database, and are the result of an important effort in econometric estimation (Hertel et al., 2007).
Table 4 displays the results of this exercise for gross production (Part A), labour demand (Part B) and prices (Part
C) of national firms and MNEs of the sector to which more MNEs go. Note that due to space constraints we
reproduce only the results for both types of firms in the particular sector receiving MNEs6 (the latter appearing at
the top of the column). The main impact of the shock takes place there. As previously explained, depending on
the adjustment in the sector to which MNEs go, the rest of forces are unleashed throughout the economy in one
direction or another. The results obtained with the standard elasticities, i.e., the ones presented in Tables 1, 2 and
3, appear in the first line of the table for the sake of comparison. In subsequent lines, we display the results
obtained when each of the elasticities analysed are multiplied or divided by two, with their corresponding “double”
and “half” labels.
6 Detailed results are available upon request.

22
Table 4. Sensitivity analysis: Effects on sectoral variables of national firms and MNEs operating in the sector receiving MNEs (2001-4) (percentage change from benchmark)
A) Impact on Production
Chemicals Motor vehicles Electronics Trade Finance
MNEs National firms
MNEs National firms
MNEs National firms
MNEs National firms
MNEs National firms
GTAP elasticities (results in Table 1) Model 69.41 11.79 49.85 0.34 63.42 11.64 25.44 3.56 11.51 1.72
Armington elasticity half 65.92 10.19 49.02 0.06 60.11 10.04 24.13 2.04 10.05 1.82
double 74.76 14.51 51.36 0.86 68.81 14.36 27.30 5.88 13.99 1.60
Elasticity of substitution between national firms vs MNEs production
Half 66.84 11.43 49.38 0.37 61.63 11.79 25.07 3.15 11.30 1.60
double 74.17 12.05 50.69 0.30 66.56 11.13 26.32 4.32 12.40 1.89
Elasticity of substitution between labour and capital Half 87.54 4.51 56.83 0.42 79.93 5.66 39.99 -0.56 25.13 -0.07
double 58.35 17.17 43.48 -0.33 50.05 13.11 16.15 5.82 7.52 2.57
B) Impact on labour demand
GTAP elasticities (results in Table 2) Model -13.95 27.42 -36.96 1.14 15.48 19.94 -24.96 6.72 -28.58 6.22
Armington elasticity half -19.41 23.52 -38.67 0.43 10.60 17.13 -26.96 3.83 -30.18 6.58
double -5.18 34.13 -33.97 2.35 23.61 24.75 -22.09 11.18 -25.83 5.80
Elasticity of substitution between national firms vs MNEs production
Half -17.99 26.53 -37.55 1.17 12.84 20.20 -25.54 5.95 -28.81 5.80
double -6.18 28.06 -35.89 1.08 20.19 19.04 -23.61 8.18 -27.60 6.83
Elasticity of substitution between labour and capital Half 30.59 10.38 -5.46 0.91 46.87 9.70 4.52 -1.05 -3.42 -0.25
double -49.56 39.24 -67.25 0.28 -12.67 22.15 -47.29 10.99 -42.71 9.25
C) Impact on Prices
GTAP elasticities (results in Table 3) Model -11.30 1.62 -8.71 0.22 -6.39 2.12 -13.16 0.69 -11.62 1.34
Armington elasticity half -11.84 1.18 -8.78 0.21 -6.74 1.83 -13.55 0.30 -11.84 1.42
double -10.44 2.37 -8.58 0.23 -5.79 2.61 -12.62 1.27 -11.26 1.26
Elasticity of substitution between national firms vs MNEs production
Half -11.68 1.57 -8.73 0.22 -6.55 2.14 -13.27 0.59 -11.66 1.21
double -10.59 1.62 -8.67 0.21 -6.11 2.04 -12.91 0.88 -11.47 1.53
Elasticity of substitution between labour and capital Half -11.87 1.13 -9.63 0.34 -7.27 2.38 -14.62 -0.31 -12.86 -0.53
double -9.94 0.75 -7.83 0.13 -5.17 1.07 -10.49 0.52 -8.64 0.94
23
Let us analyse first gross production and labour demand (Parts A and B). For the Armington
elasticity and the elasticity of substitution between national firms and MNEs’ production the
difference in results for the half and double labels are small. The results are more sensitive,
however, to the specification of the elasticity of substitution between labour and capital. For all
elasticities the results follow the patterns described earlier. After the entry of MNEs in Chemicals
and Electronics, total labour demand (i.e., of national firms and MNEs) within these sectors
increases. By contrast, for the entry of MNEs in Motor vehicles and Finance total labour demand
will decrease in them. The only exception to these patterns appears in the “half” value of the
elasticity of substitution between labour and capital in Trade7. In this case, total labour demand
increases by 0.7% (i.e., of national firms and MNEs) after the arrival of MNEs, while it used to go
down. Less labour would be available for the rest of sectors, and thus, we would be in the pattern
previously identified for Chemicals and Electronics. In any case, throughout the analysis the
results for Trade have been in a rather intermediate pattern, so no wonder that its results straddle
the origin in the sensitivity analysis.
Part C) shows that the different values of the elasticities bring about negligible changes in prices.
These outcomes for prices should then be familiar. The foreign part of the sector receiving MNEs
considerably lower its price due to the fall in its sector and firm-type specific rental rate of capital.
The sizeable increase in the capital of the foreign part of the sector brings about a reduction of its
rental rate, which strongly lowers factor costs driving prices down.
7. Conclusions
This paper uses a CGE model to analyse the differential performance in production, labour
demand and prices of national firms and MNEs within the 20 sectors in which the Czech economy
has been split. We replicate the arrival of MNEs in five different sectors of this host economy, in
turn, and look at the process of adjustment in the short run. The sectors are Chemicals,
Electronics, Motor vehicles, Trade and Finance.
The empirical literature has found difficulties to analyse the simultaneous interactions of national
firms and MNEs (e.g., Barba Navaretti and Venables, 2004, chapter 7). Among the few CGEs
incorporating the operations of MNEs none has analysed their (expected) contrasting patterns of
behaviour. Our model differentiates national firms and MNEs’ technologies, based on real data
(OCDE, 2009; Czech National Bank, 2004). This aspect tends to be neglected in previous CGEs
dealing with MNEs. We regard this technological differentiation as a former step to introduce a
7 Total labour demands after the entry of MNEs are: in Chemicals (for the half value: 18.51% and for double:
3.55%), in Electronics (half: 28.16% and double 4.85%), in Motor vehicles (half: -28.16% and double: -
4.85%), in Finance (half:-1.36% and double:-8.93%) and in Trade, the only results that straddle the origin
(half: 0.70% and double: -7.25%).

24
finer characterisation of the climate of imperfect competition. The analysis showed here suggests
that there is a differential pattern of behaviour between both types of firms. These findings may
help to disentangle what mark-ups and economies of scale, for which there is no evidence at a
20-sector level, can add to explain the contrasting performance of national firms and MNEs.
Within sectors the results point to the expected differential pattern between both types of firms in
production and labour demand. The main reason for their contrasting adjustment is the relative
labour intensive technology of national firms versus MNEs. Because we are in a setting of
specific-capital, the evolution of production reflects labour demand. The entry of MNEs leads to a
process of labour reallocation throughout the economy and national firms in the sectors not
directly involved in the shock benefit when labour becomes more abundant or may be worse off
when labour becomes less abundant. In particular, after the arrival of MNEs to Motor vehicles or
Finance, and to a lesser extent in Trade, labour becomes more abundant for the rest of sectors in
the economy. As a result, labour will be reallocated to those firms that intensively use it.
Therefore, national firms will exhibit higher percentage output increases than MNEs within
sectors. By contrast, after the arrival of MNEs to either Chemicals or Electronics, labour seems to
be more productive in these technologically advanced sectors. Thus, after the entry of MNEs they
attract more labour making it scarce for the rest of sectors. Consequently, the pattern of higher
production in national firms is not so clear, for these two latter sectors, and some national firms
exhibit lower production levels than their MNEs counterpart operating within the same sector.
Apart from this evidence on the differential patterns within sectors, this analysis sheds light on the
role of demand in determining the evolution of production and labour demand across sectors. We
can find a clear tendency for most manufacturing sectors, which follow the evolution of exports as
they tend to be more export oriented, and a different one for those other sectors more oriented to
private consumption, such as food, electricity, gas and water supply as well as most services.
Sectors oriented to private consumption tend to be better off after the entry of MNEs regardless of
the particular sector to which MNEs arrive. MNEs bring with them new capital to the host
economy, which will always increase national income and private consumption. By contrast, the
evolution of the manufacturing sectors depends on the sector in which the entry of MNEs takes
place. This is because prices and with them export-price competitiveness vary according to the
sector receiving MNEs. The entry of MNEs to Chemicals or Electronics brings about increases in
the CPI reducing output among export oriented sectors. On the contrary, their entry in Motor
vehicles or Finance decreases the CPI increasing exports and production in most manufactures.
The effects of the entry of MNEs in Trade again lie between the two previous patterns. The
general equilibrium nature of the model is important to grasp these effects stemming from its
demand side. Furthermore, it seems of interest that behind not very different GDP estimations
(0.82 percent increase after the entry of MNEs to Finance, versus 0.68 percent after their arrival
to Chemicals) a completely different panorama appears. Indeed our results suggest that if policy
makers are interested in promoting growth across sectors, the arrival of MNEs to Finance would
be positive for most sectors of the economy. By contrast, their arrival to Chemicals or Electronics

25
leads to a concentration of production in the sector receiving MNEs at the cost of reducing
production in other sectors of the Czech Republic.
Within sectors, national firms tend to exhibit higher prices than MNEs. The higher wages resulting
in all scenarios and the predominance of lower rental rates of capital tend to lead to higher prices
in the labour intensive firms. But the role of intermediate costs is also important. Thus, some
exceptions arise to the general tendency of higher prices in national firms, particularly after the
arrival of MNEs to Finance, given its important weight as an intermediate for national firms.
Across sectors prices tend to follow production patterns. In those sectors that increase
production, higher labour demand in a context of rising wages increases factor costs resulting in
higher prices. Some exceptions arise, however, again because of the importance of intermediate
costs in determining prices.
To conclude, we have shown new evidence for the contrasting patterns of behaviour between
MNEs and national firms. The study of these patterns is not straightforward and we needed
several pieces in our analysis to follow them. Besides, these patterns, bring about considerable
differential ways of adjustment throughout the economy after the arrival of MNEs. The sector to
which MNEs go matters and the response of national firms and MNEs across the rest of sectors
also matters. All in all, this points to the need for a rather complex analysis to explain firms’
performance, which demands the combination of different elements from a country-sector-firm
type perspective.
26
References
Aitken, B. and Harrison, A. (1999) “Do domestic firms benefit from direct foreign investment?
Evidence from Venezuela”, American Economic Review, vol. 89, pp. 605-618.
Antràs, P. (2003) “Firms, contracts, and trade structure”, Quarterly Journal of Economics, vol.
118, pp. 1375-1418.
Aw, B. Y. and Lee, Y. (2008) “Firm heterogeneity and location choice of Taiwanese
multinationals”, Journal of International Economics, vol. 75, pp. 167–179.
Barba Navaretti, G. and Venables, A. J. (2004) Multinational firms in the world economy,
Princeton University Press, Princeton.
Barrios, S., Görg, H. and Strobl, E. (2005) “Foreign direct investment, competition and industrial
development in the host country”, European Economic Review, vol. 49, pp. 1761-1784.
Bornstein, M. (2001) “Post-privatisation enterprise restructuring”, Post-Communist Economies,
vol. 13, pp. 189-203.
Co, C. Y. (2001) “Trade, foreign direct investment and industry performance”, International
Journal of Industrial Organization, vol. 19, pp. 163–183.
Conyon, M. J., Girma, S., Thompson, S. and Wright, P. W. (2002) “The productivity and wage
effects of foreign acquisitions in the United Kingdom”, Journal of Industrial Economics, vol. 50,
pp. 85-102.
Czech National Bank (2004) Foreign Direct Investment. Annual Reports. Available at
http://www.cnb.cz/www.cnb.cz/en/statistics/bop_stat/bop_publications/pzi_books/ index.html.
Dee, P., Hanslow, K., Phamduc, T., (2003) “Measuring the costs of barriers to trade in services”,
NBER Chapters, in: Trade in Services in the Asia Pacific Region, NBER East Asia Seminar on
Economics (EASE), vol. 11, National Bureau of Economic Research, Inc., pp., 11-46.
Dimaranan, B. V. (ed.) (2007) Global trade, Assistance, and Production: The GTAP 6 Data
Base, Center for Global Trade Analysis, Purdue University, West Lafayette, IN.
Djankov, S and Hoekman, B (2000) “Foreign investment and productivity growth in Czech
enterprises”, The World Bank Economic Review, vol. 14, pp. 49-64.

27
Dunning, J. H. (1979) “Explaining changing patterns of international production: In defence of
the eclectic theory”, Oxford Bulletin of Economics and Statistics, vol. 41, pp. 269-295.
Dunning, J. H. (2000) “The eclectic paradigm as an envelope for economic and business
theories of MNE activity”, International Business Review, vol. 9, pp. 163-190.
Dycker, D. A. (2006) “Contrasting Patterns in the Internationalisation of Supply Networks in the
Motor Industries of Emerging Economies”, Post-Communist Economies, vol. 18, pp. 289-204.
Evenett, S. J. and Voicu, A. (2001) “Picking winners or creating them? Revisiting the benefits of
FDI in the Czech Republic”, mimeo, The World Bank.
Eurostat, (2009) “Statistics on foreign control of enterprises - all activities (FATs)”, available at:
http://epp.eurostat.ec.europa.eu/portal/page/portal/european_business/data/ database
Ferrett, B. (2004) “Foreign direct investment and productivity growth: A survey of theory”, GEP
Research Paper 2004/15, Leverhulme Centre for Research on Globalisation and Economic
Policy, University of Nottingham.
Grossman, G., Helpman, E. and Szeidl, A. (2006) “Optimal integration strategies for the
multinational firm”, Journal of International Economics, vol. 70, pp. 216-238.
Hanslow, K., Phamduc, T. y Verikios, G. (1999) The Structure of the FTAP Model, Research
Memorandum MC-58, Productivity Commission, Canberra.
Harrison, G. W., Jones, R., Kimbell, L. J. and Wigle, R. (1993) “How robust is applied general
equilibrium analysis?”, Journal of Policy Modeling, vol. 15, pp. 99-115.
Helpman, E., Melitz, M. J. and Yeaple, S. R. (2004) “Exports versus FDI with heterogeneous
firms”, American Economic Review, vol. 94, pp. 300-316.
Hertel, T. W. (ed.) (1997) Global trade analysis. Modelling and applications, Cambridge
University Press, Cambridge.
Hertel, T. W., Hummels, D. L., Ivanic, M., and Keeney, R. (2007) “How confident can we be of
CGE-based assessments of Free Trade Agreements?”, Economic Modelling, vol. 24, pp. 611-
635.
Hymer, S. H. (1976) The international operations of national firms: A study of direct foreign
investment, The MIT Press, Cambridge, MA.

28
Jones, R. W. (1971) “A three-factor model in theory, trade and history”, in Bhagwati, J. N.,
Jones, R.W., Mundell, R. A. and Vanek, J. (eds.) Trade, balance of payments and growth:
Papers in International Economics in honor of Charles P. Kindleberger, North-Holland,
Amsterdam, pp. 3-21.
Jones, R. W. (2002) “Trade theory and factor intensities: An interpretative essay”, Review of
International Economics, vol. 10, pp. 581-603.
Krkoska, L. (2001) “Assessing macroeconomic vulnerability in Central Europe”, Post-
Communist Economies, vol. 13, pp. 41-55.
Latorre, M. C. (2009) “The economic analysis of multinationals and foreign direct investment: A
review”, Hacienda Pública Española, vol. 191, pp. 97-126
Latorre, M. C. (2010) The impact of foreign-owned companies on host economies: A
Computable General Equilibrium approach, Nova Science, New York.
Lejour A. and Rojas-Romagosa, H. (2006), “Foreign Direct Investment in Applied General
Equilibrium models”, CPB Netherlands Bureau for Economic Policy Analysis, CPB
Memorandum No. 169.
Latorre, M. C., Bajo-Rubio, O. and Gómez-Plana, A. G. (2009) “The effects of MNES on host
economies: A CGE approach”, Economic Modelling, vol. 26, pp. 851-864.
Lizal, L. and Svegnar, J. (2002) “Investment, credit rationing, and the soft budget constraint:
Evidence from Czech panel data”, Review of Economics and Statistics, vol. 84, pp. 353-370.
Markusen, J. R. (2002) Multinational Firms and the Theory of International Trade, The MIT
Press, Cambridge, MA.
Markusen, J. R. and Venables, A. J. (1998) “Multinational firms and the new trade theory”,
Journal of International Economics, vol. 46, pp. 183-203.
Markusen, J. R. and Venables, A. J. (2000) “The theory of endowment, intra-industry trade and
multinational trade”, Journal of International Economics, vol. 52, pp. 209-234.
OECD, (2009) “Globalisation: Activities of multinationals”, Available at:
http://stats.oecd.org/index.aspx?r=983789

29
Pavlínek, P. (2003) “Transformation of the Czech Automotive Components Industry through
Foreign Direct Investment”, Eurasian Geography and Economics, vol. 44, pp. 184-209.
Pavlínek, P. and Janâk, L. (2007) “Regional Restructuring of the Škoda Auto Supplier Network
in the Czech Republic”, European Urban and Regional Studies, vol. 14, 133-155.
Pavlínek, P., Domanski, B. and Guzik, R. (2009) “Industrial Upgrading Through Foreign Direct
Investment in Central European Automotive Manufacturing”, European Urban and Regional
Studies, vol. 16, pp. 43-63.
Rutherford, T. F. (2005) “GTAP6inGAMS: The dataset and static model”, prepared for the
workshop “Applied general equilibrium modeling for trade policy analysis in Russia and the
CIS”, Moscow, December 1-9.
Schöllmann, W. (2001) “Foreign participation in privatisation: What does it mean? Empirical
evidence from the Czech Republic, Hungary and Poland”, Post-Communist Economies, vol. 13,
pp. 373-387.
Sembenelli, A. and Siotis, G. (2005) “Foreign direct investment, competitive pressure and
spillovers. An empirical analysis of Spanish firm-level data”, Discussion Paper no. 4903, Centre
for Economic Policy Research.
Verikios, G., Zhang, X-G., (2001) “Global gains from liberalising trade in telecommunications
and financial services”, Research Paper 1683, Productivity Commission, Canberra. Available at:
http://ssrn.com/abstract=287801