a comparison of multispectral aerial and satellite imagery ... · 1. habitat-forming seaweeds are...
TRANSCRIPT
A comparison of multispectral aerial and satellite imagery for mapping intertidal seaweed communities
Juliet Brodie1, Lauren Ash1*, Ian Tittley1 & Chris Yesson2
1 Natural History Museum, Department of Life Sciences, Cromwell Road, London, SW7
5BD, United Kingdom.
2 Institute of Zoology, Zoological Society of London, Regent's Park, London, NW1 4RY,
United Kingdom.
*Current address: University of Vermont, Department of Biology, Burlington, Vermont 05405, U.S.A.
Correspondence to: J Brodie, Natural History Museum, Department of Life Sciences, Cromwell Road, London, SW7 5BD, United Kingdom. Email: [email protected]
ABSTRACT1. Habitat-forming seaweeds are vital components of marine ecosystems, supporting
immense diversity and providing ecosystem services. Reports of major changes in the
distribution and abundance of large brown seaweeds in the North-east Atlantic are an
increasing cause for concern, but a lack of consistent monitoring over time is a key
impediment in obtaining reliable evidence of change. There is an urgent need to recognize
change rapidly and efficiently in marine communities which are increasingly impacted by
pressures of human population growth, climate change and ocean acidification.
2. Here, the potential for remote monitoring of seaweed habitats is investigated using freely
available, high resolution aerial and satellite imagery. Three sources of imagery were used: i)
Channel Coastal Observatory (CCO) aerial imagery, ii) Aerial images from the Bing webmap
server, and iii) RapidEye multispectral satellite data.
3. The study area, the Thanet Coast, is an area of chalk outcrop in South-east England of high
conservation status and includes three Marine Conservation Zones. Eight habitat classes,
including brown, red and green algal zones, were recognized based on ground-truthing
surveys.
4. A multi-class classification model was developed to predict habitat classes based on the
chromatic signature derived from the aerial images. The model based on the high resolution
CCO imagery gave the best outcome (kappa value 0.89).
5. Comparing predictions for images in 2001 and 2013 revealed habitat changes, but it is
unclear as to what extent these are natural variability or real trends. This study demonstrates
the potential value for long term monitoring with remote sensing data. Repeated, standardised
coastal aerial imaging surveys, such as performed by CCO, permit rapid assessment and re-
assessment of habitat extent and change. This is of value to the conservation management of

protected areas, particularly those defined by the presence or extent of specific habitats.
KEY WORDS: aerial imagery; coastal habitats; Fucus; macroalgae; Marine Conservation
Zones; remote sensing; satellite imagery
INTRODUCTION
Seaweed habitats have great economic value and provide ecosystem services globally worth
billions of pounds annually (Beaumont, Austen, Mangi & Townsend, 2008; Smale et al.,
2013). Large brown seaweeds (Phaeophyceae) are habitat-forming components of the littoral
(fucoids – Fucales) and the shallow sub-littoral (kelps – Laminariales) of marine ecosystems
(Smale et al., 2013; Steneck et al., 2002). These seaweeds are highly productive primary
producers and important for carbon capture and transfer in coastal communities (Brodie,
Wilbraham, Pottas & Guiry, 2014; Golléty, Migné & Davoult, 2008). They also protect
shorelines by buffering currents and waves, and provide shelter for many other organisms
(Yesson et al., 2015a). Canopy-forming macroalgae, such as kelp and fucoids, can increase
the habitable surface area fourfold (Boaden 1996; Jueterbock et al., 2013), creating
conditions for diverse understorey communities of flora and fauna (Golléty, Migné &
Davoult, 2008).
There are many threats to these important and economically valuable seaweed habitats, but

predominantly from human impacts including rising CO2 levels and associated warming
(Brodie, Wilbraham, Pottas & Guiry, 2014). Already there are a number of documented cases
of kelp and fucoid species decline in abundance or loss attributed to ocean warming and a
combination of other stressors (Brodie et al., 2014; Yesson et al., 2015b). Climate change can
also facilitate the introduction of invasive species and there is evidence of an increasing rate
of introductions of non-native algae in the north-east Atlantic (Brodie et al., 2016; Sorte et al.,
2010). Despite the importance of seaweed communities, they have been afforded very little
protection through statutory conservation measures (Brodie, John, Tittley, Holmes &
Williamson, 2007; Brodie, Andersen, Kawachi & Millar, 2009). Although Marine Protected
Areas (MPAs) cover around 23% of UK waters (as of December 2017
http://jncc.defra.gov.uk/default.aspx?page_4549 ), only a small proportion of these
encompass seaweed communities, and the protection provided is highly variable and may
have no bearing on seaweed communities.
A lack of knowledge of the distribution and abundance of seaweed habitats is a major
impediment to understanding the impact of threats such as climate change. Fundamental
information on species ranges, kelp forest biodiversity, and species interactions are included
in this lack of knowledge (Harley et al., 2012; Smale et al., 2013). A limiting factor here is
the difficulty of assessing seaweed-dominated areas. Many locations are remote or
submerged, making sampling difficult and even dangerous. Scientific diving has been the
traditional method for assessing and monitoring submerged macroalgal communities, but this
can be logistically problematic and often impractical due to large time requirements as well
as the expense of training, personnel and equipment (Pauly & De Clerck, 2010; Smale et al.,
2013).

Remote Sensing
An alternative approach to direct, in-person surveys for documenting change in marine
benthic habitats is the use of remote sensing. Images of the coastline taken from aeroplanes,
drones or satellites can provide an overview of coastal habitats suitable for broad-scale
habitat assessments and monitoring. This approach can be less time consuming, generally
more cost-effective and requires less manpower than undertaking comprehensive shore work
(Pauly & DeClerck, 2010). Quantitative analysis of coastal seaweed habitats also allows for
an encompassing view of the area and provides clearer evidence for environmental change
(Kuster et al., 2006).
Despite the wide range of remote sensing options, research using these techniques in the
marine and coastal field lags far behind that for the terrestrial environment, and few
published studies have used remote sensing to examine seaweed communities (Pauly &
DeClerck, 2010). Nevertheless, a range of satellite imagery tools have been applied for
mapping spatial and temporal distributions of macrolgae and associated habitats (Hoang,
O'Leary & Fotedar, 2016 and references therein).
Mapping of three submerged macroalgal species was attempted in the Baltic Sea (Kutser
Vahtmäe, & Martin, 2006) although they encountered difficulties with sensor penetration
through the water column. A study to compare image-based and spectral library methods
undertaken to classify shallow water habitats in the Baltic concluded that image-based
methods were better (Vahtmäe & Kutser, 2013). Remote sensing was used in NW Spain to
try to detect benthic macroalgae at the species level using the hyperspectral sensor CASI-2
(Casal, Kutser, Domínguez-Gómez, Sánchez-Carnero, & Freire, 2013) but only a few species
were discernible. However, the authors reported that it was possible to discriminate between
red, green and brown taxonomic groups in shallow water. Landsat images were used to
assess spatial and temporal changes in seagrass-dominated submerged vegetation in Zanzibar
(Gullström et al., 2006). Documenting temporal change in Caribbean coastal zones was
undertaken using multispectral Landsat Thematic Mapper satellite data (Michalek, Wagner,
Luczkovich, & Stoffle, 1993), although ground-truthing was required for verification of
specific habitat changes. Mapping macroalgal communities in NW Spain was undertaken by
Casal, Kutser, Domínguez-Gómez, Sánchez-Carnero & Freire (2011) using CHRIS-PROBA
which gave good results for maximum likelihood classification, but mixed results for Spectral
Angle Mapper where brown and red algae were not clearly distinguishable. Herkül, Kotta,
Kutser & Vahtmäe, (2013) applied the spectral variation hypothesis in the Baltic Sea to
successfully make biodiversity assessments. Identification and quantification of landscape
scale algal populations were undertaken around Helgoland by Uhl et al., (2013) although they
could not distinguish between species of the same genus or family due to strong spectral
analogies. Uhl et al., (2016), who used hyperspectral data from AisaEAGLE to detect
submerged kelp, developed a fully automated simple feature detection processor which was
successful until a depth of 6 m.
Hennig, Cogan & Bartsch, (2007), who specifically focused on the intertidal zone, analysed
hyperspectral imagery from the rocky intertidal of Helgoland. Their classification based on a
spectral library allowed them to map the dominant intertidal macrophyte vegetation and
general intertidal structures but found the separation of mixed vegetation types was limited.
Floating vegetation is challenging to classify because such rafts alter the spectral properties
of the sea surface. In one of the first studies of its kind, Dierssen, Chlus & Russell, (2015)
were able to discriminate spatial distribution of the floating macroalga Sargassum and
seagrass mats in Greater Florida Bay, USA, using spectral measurements from the Portable
Remote Sensing imaging Spectrophotometer (PRISM) imagery in conjunction with spectral

measurements from experimental mesocosms, They were also able to discriminate the age of
the wrack based on an increase in reflectance with time. Hoang, O'Leary & Fotedar, (2016),
who were also working on Sargassum beds, achieved a highly accurate classification
outcome using a combination of high spatial resolution WorldView-2 imagery and in-field
observations around Rottnest Island, Western Australia.
Aims
A study was undertaken to determine whether intertidal seaweed habitats can be
differentiated using (freely available) remote sensing images.
METHODS
Study area
The Thanet coast was chosen for this study because it is an area of chalk outcrop of high
conservation importance in Kent, in the south-east of England. The Thanet Coast was
designated a Marine Conservation Zone (MCZ – a statutory Marine Protected Area) in 2013,
and Dover to Deal and Dover to Folkestone in 2016
(https://www.gov.uk/government/publications/marine-conservation-zones) under the UK’s
Marine and Coastal Access Act 2009 (www.jncc.gov). The Thanet coast was already
afforded Special Area of Conservation (SAC) and Site of Special Scientific Interest (SSSI)
status due to its chalk sea-caves and reefs (Tittley et al., 1998, 1999). The boundary of the
MCZ runs from the east of Herne Bay around Thanet to the northern wall of Ramsgate
harbour and the site protects an area of approx. 64 km2 (Figure 1). The shores are gently
sloping, uneven chalk reef incised by channels, with c. 100-140 m exposed at low tide. The
upper shore consists of bare chalk, boulders and sand over chalk and supports green seaweeds
consisting mainly of Ulva species. The middle and lower shore is chalk reef. The middle

shore consists of a zone of large brown algae dominated by Fucus vesiculosus (predominantly
higher up) and F. serratus (predominantly lower down). The lower shore consists of a zone
of predominantly red algae, including Corallina officinalis, Gelidium spp., Palmaria palmata
and Rhodothamniella floridula.
Remote sensing data
Image data were collected for North and East Kent, stretching from Herne Bay to Folkestone
(Figure 1). Imagery came from three sources, ranging from high resolution aerial surveys, to
lower resolution, multi-spectral satellite data: I) The Southeast Strategic Regional Coastal
Monitoring Programme is one of six regional programmes that form the National Network of
Regional Coastal Monitoring Programmes of England. This Network collects coastal
monitoring data, including aerial and LiDAR surveys, to inform shoreline management plans.
Data, metadata and survey reports are freely available to download from the Channel Coast
Observatory website (www.channelcoast.org). The Channel Coastal Observatory
(http://www.channelcoast.org/) is an England-wide project to collect coastal monitoring data,
including regular aerial surveys (from twice yearly to every few years, depending on the
region) conducted at low tides (Pixel resolution either 0.1x0.1m or 0.2x0.2m), data used in
this study dates from May 2001 and May 2013. The 2001 CCO imagery was collected using
a WILD RC 30 camera with 153.64 mm focal length at an average altitude of 762 metres.
The 2013 imagery was collected using a Vexcel Ultracam Xp digital camera with a focal
length of 100.5 mm at an average altitude of 1645 metres, II) Bing maps
(http://www.bing.com/maps/) provide free access to aerial image data (resolution 0.6x0.6m)
collected by Digital Globe via their representational state transfer (REST) interface
(https://msdn.microsoft.com/en-us/library/ff701713.aspx), surveyed July-October 2011
(Walcher et al., 2012), and III) The RapidEye satellite data provides five spectral bands
(blue, green, red, red edge, near infra-red) at 5 m x 5 m resolution, surveyed September 2013
(https://www.planet.com/products/satellite-imagery/rapid-eye-basic-product/), and has been
used to detect invasive aquatic plants (Roessler, Wolf, Schneider, & Melzer, 2013). RapidEye
data was freely provided by the Earthnet Online Website (http://earth.esa.int) after
registration and submission of a brief project description. RapidEye data was provided
orthorectified and corrected, so no pre-processing was required. Example images are
presented in Figure 2, demonstrating the variety of pixel resolution and tidal state.
Ground-truthing
Ground-truthing surveys were undertaken in September 2011, January and June 2014.
Transects were walked down or up the shore at low tide, sampling every 20-30 m. Habitats
were photographed and dominant taxa were recorded along with GPS coordinates of the
locations. Ground truth locations were classified into the following habitat types based on
dominant taxa or substrata: i) Brown algae, ii) Red algae, iii) Mytilus, iv) Green algae, v)
Sand, vi) Muddy-sand, vii) Bare Chalk, viii) Flint/Sand/Chalk.
Spatial error was recorded as approximately 3 m for GPS readings (Garmin eTrex 10/20 GPS
units). The resolution of the imagery is more precise than this spatial ambiguity, so that a
single pixel in the image data could not be matched to the ground truth locations. In order to
associate pixel values with ground-truth sites, the set of pixels surrounding the recorded
coordinates within a 3 m radius were collected and the combination of pixel values (Red,
Green, Blue for CCO and Bing, plus Red Edge and Near Infra-Red for RapidEye imagery)
occurring most frequently in this set were selected as the most representative of the ground-
truth location. In the event of multiple combinations being equally represented, the
combination closest to the mean was selected. The tidal state at the time of acquisition of the
Bing and RapidEye images means that fewer ground-truth locations are valid (show an
unsubmerged section of coastline). Therefore fewer ground-truth points are available for
these images. See Table S1 for a breakdown of ground-truthing data available by habitat

class, date of acquisition and image source.
Classification model
A habitat classification model was developed using a pixel-based approach. A model was
trained using a chromatic profile based on the pixel values at the locations of ground-truthing
samples. A pixel based approach has been used successfully to map coastal benthic habitats
(Hennig, Cogan & Bartsch, 2007), and has been shown to be as effective as object-based
methods for detecting small patches of vegetation (Castillejo-González, Pena-Barragán,
Jurado-Expósito, Mesas-Carrascosa & López-Granados, 2014).
Ground truth sites were used as training data to create a multi-class classification model. A
support vector machine model (SVM) was performed using the e1071 package of R statistical
software program (Meyer, Dimitriadou, Hornik, Weingessel, & Leisch, 2014). SVMs are
learning algorithms that are commonly used for supervised image classification (Mountrakis,
Im, & Ogole, 2011), including benthic habitat mapping (e.g. Gougeon, Kemp, Blicher, &
Yesson, 2016), and have been shown to perform well with small training datasets
(Mountrakis, Im, & Ogole, 2011), and for multi-spectral imagery (RapidEye data) in
terrestrial (Ustuner et al. 2015) and coastal environments (Adam, Mutanga, Odindi & Abdel-
Rahman 2014). Data were partitioned by site into spatial cross validation replicates
(Radosavljevic & Anderson, 2014). For each replicate, data for one site were kept as testing
data, with the remaining data used for training. The gamma and cost parameters were tested
in combination (gamma: 2-13, 2-12, ..., 23, cost: 2-5, 2-6, …, 213) for each spatial replicate and the
kappa evaluation parameter was calculated based on predictions for the test data (following
the recommendations of Chang and Lin, 2011). The parameter combination resulting in the
highest combined kappa was chosen for the final model.
A model was calculated based on each imagery dataset (CCO, Bing and RapidEye). Models

were projected back into the full images to predict habitat class in all areas not surveyed.
Additionally, the model based on the CCO data was projected into CCO imagery taken in
May 2001 to estimate change in habitat from May 2001 to May 2013. Areas of each
predicted habitat class were calculated using the R package raster (Hijmans, 2015). The open
source desktop GIS software QGIS was used for the manipulation of GIS layers
(https://www.qgis.org/).
RESULTS
Comparison of model evaluation statistics
Model evaluation statistics are shown in Table 1, and a confusion matrix for each model is
presented in Table S2. For all the parameters, the CCO imagery shows the best outcome.
Notably, the kappa value for the CCO (0.89) is a much closer fit (a kappa value of 1 would
equal an exact fit) of the model than either Bing (0.51) or RapidEye (0.48). The resolution is
greater for CCO (0.1 m x 0.1 m) than Bing (0.6 m x 0.6 m) which is, in turn, greater than
RapidEye (5 m x 5 m). Consequently the CCO imagery provides a higher number of pixels
per unit area and thus shows greater detail (Figure 2).
Changing communities
The change in areas using the CCO imagery for 2001 and 2013 are shown in Table 2 and
Figures 3 & 4a-d. Overall from 2001 to 2013, Flint/Sand/Chalk, Muddy-sand, Red algae and
Sand cover have decreased, whereas Mytilus cover has stayed virtually the same, and Bare
Chalk, Brown algae and Green algae cover have increased. A comparison of changes in
cover for the individual MCZs between 2001 and 2013 showed that for Thanet there was an
increase in Flint/Sand/Chalk and a decrease in Brown algae, Mytilus and Red algae, for
Dover to Deal there was a slight increase in Bare Chalk and a slight decrease in cover of
Brown algae, and for Dover to Folkestone a slight decrease in Bare Chalk, and a decrease in
Brown algae, Mytilus and Red algae.
Predicted areas
The modelled areas based on CCO 2013, Bing and RapidEye imagery, adjusted to compare
only the shoreline observable in all three images, is shown in Table 3. The adjustment for the
CCO reduces the shore line by 2/3rds (from 1163 ha to 389 ha). Bing and RapidEye models
more or less fail to detect Chalk although RapidEye predicts Flint/Sand/Chalk. The model
based on RapidEye data over-predicts Green algae whereas the model using Bing images
under-predicts this group. Both sets of imagery fail to pick up Muddy Sand, which is a
consequence of there being no valid (unsubmerged) ground-truth sites for Muddy Sand in
these images. The Bing model is reasonable at predicting Mytilus but the RapidEye model
fails completely to predict this category. The Bing model over-predicts Red algae, whereas
the RapidEye model under-predicts them.
DISCUSSION
The value of coastal aerial surveys for conservation
This pilot project has demonstrated, using an SVM model, that intertidal seaweed
communities can be differentiated using the freely available high resolution imagery of CCO
and that it was possible to detect temporal and spatial changes for the habitat-forming
species. There are direct conservation and management benefits to be able to produce
widespread habitat maps (Medcalf, Parker, Turton, & Bell, 2013; Petchey, Brown, Hambidge,
Porter, & Rees, 2011). For example, mapping UK habitats is essential for UK authorities to

meet reporting and legal obligations, such as the EC habitats directive (Medcalf, Parker,
Turton, & Bell, 2013). The standardised, repeated nature of many remote sensing surveys
(including CCO) lends itself towards re-assessment of habitats, this creates an opportunity to
assess variations in habitat coverage during a time of rapid environmental change (Secades,
O'Connor, Brown, & Walpole, 2014). This is of great value to conservation management,
particularly for protected areas which are defined by the presence of specific habitats, or
those with the objective of protecting a particular habitat.
In comparison to this study, the majority of other studies that have used remote sensing to
differentiate seaweed communities have concentrated on the shallow subtidal. A major
problem with working in the subtidal is turbidity which can vary both spatially and seasonally
such as was experienced in the Baltic (Kuster et al., 2006, Vahtmäe & Kuster, 2013).
However, this can be much less of a problem in clear, tropical water such as was experienced
in the study of seagrasses in Zanzibar (Gullström et al.,, 2006) and Michalek, Wagner,
Luczkovich, & Stoffle, (1993) who worked in the Caribbean coastal zone.
As with our study, Vahtmäe & Kuster (2013) found that benthic habitat maps could be
constructed from aerial images, but they point out the requirement for extensive fieldwork.
This is dependent, in part, on the variability of the habitat. For the present study, we
performed 2 days of ground-truthing and this permitted the construction of a habitat map
covering more than 70km/1100ha of coastline. Our ground-truthing surveys were performed
at different times to the image collection, both in a different year and month. It has been
suggested that ground-truthing should be contemporaneous with imagery surveys to ensure
results are not compounded by seasonal or annual changes (Vahtmäe & Kuster, 2013).
However, our model produced good evaluation statistics (at least for the high-resolution
imagery), although areas with less long-term stability may be less robust to asynchronous
ground-truthing. This is likely to be an issue for many studies seeking to use freely available
aerial/satellite imagery.
There are a number of advantages of the specialist low tide CCO imagery. The programme
for coastal monitoring for the English coast (http://www.channelcoast.org/programme)
collects tidally coordinated aerial imagery, thus significant coverage of intertidal seaweed
communities are available, and this has recently been supplemented with near infra-red data
which gives greater discriminatory powers. Furthermore, the very high resolution (0.1 m x
0.1 m) provides images with excellent differentiation of boundaries, making it more reliable
to match with ground-truthing data. In contrast, using more sensors from hyperspectral
satellite imagery can provide more information to discriminate habitats, but because the
imagery is of a relatively coarse resolution, the relative gain from the additional sensors does
not compensate the inability to detect smaller features. For example, Kuster et al., (2006),
who used multispectral satellites, found that the sensors they used could only detect
differences in brightness in one band which was insufficient to recognize different benthic
types.
One of the few specifically intertidal studies which used hyperspectral remote sensing
methods to classify rocky habitats on Helgoland (Hennig, Cogan & Bartsch, 2007) was able
to map the dominant intertidal seaweed vegetation and general intertidal structures, although
additional data were required to separate mixed vegetation types. In our study, the
disadvantage of satellite data is that they are not specifically collected to capture the
intertidal. The differences in the amount of shore exposed between images, combined with
the coarseness of the resolution, do not provide the reliability of coverage and clarity of CCO.
Indeed one habitat class, Muddy Sand, is not observed in some images because of the tidal
state. However, rapid advancement in technology and cost of image acquisition may change
what is possible with satellite data (Hoang, O'Leary & Fotedar, 2016).
Changing communities
Observed changes in cover between 2001 and 2013 may represent natural variation that
occurs in shore communities with time. There were pronounced differences between
individual MCZs (Figures 4b-d), which showed local variations but a decrease in bare
substrata (Flint/Sand/Chalk and Sand) and an increase in Red algae and Mytilus might
indicate a general trend with time for an increase in the cover of these organisms. However,
the increase observed in Bare Chalk in the Dover to Folkestone MCZ, in comparison with
Thanet and Dover to Deal, could relate to the physical protection of chalk cliffs. Much of the
chalk cliffs of Thanet and Dover to Deal (c. 80%) are incarcerated in concrete (Tittley et al.,
1998), whereas Dover to Folkestone is a natural area of chalk and therefore subject to greater
erosion. Smothering by chalk could explain the observed decrease in sand for Dover to
Folkestone. However, sand cover changes rapidly and is reported locally to rise or fall by
over a metre annually (I. Tittley, personal observation), so this change might be ephemeral in
nature, rather than a sign of any long-term trend. Multi-year comparisons are possible with
the repeated imaging surveys. Future work examining multiple years will help distinguish
longer term trends from short term fluctuations. Detection of changing habitat cover could be
an important monitoring tool within this protected area.
Fucus serratus and F. vesiculosus are the two main habitat-forming species of brown algae
on the shores of this study. A slight but not significant decrease was reported for F. serratus
for the Eastern English Channel between 1974 and 2010 and the trend for this species in other
geographical regions around Britain was for a non-significant decrease in abundance, with
the exception of the Western Channel and Celtic Sea where there was a significant increase in
abundance (Yesson et al., 2015b). Furthermore, Fucus vesiculosus tended to show increases
in abundance but only significantly so in the North Sea and warmer summer and winter
temperatures appear favourable for this species (Yesson et al., 2015b).
Seasonality
An increase in Green algae may reflect differences in seasonal progression, although both
2001 and 2013 images were collected in May, this month in 2013 was unseasonably cold,
while in 2001 it was closer to the long term average (http://www.metoffice.gov.uk/).
Alternatively, variation in cover from year to year of Ulva species may influence observed
patterns, which tend to be most abundant in the spring-summer (I. Tittley personal
observation). A decrease in the Red algae overall may reflect the increase in Brown algae but
it is possible that the red species are still present but inconspicuous underneath the fucoids at
the time images were taken. Any image-based habitat classification will be biased in favour
of the top-most layer of observed fauna/flora, as this is the layer picked up by the images.
Ideally an assessment of understory taxa could be undertaken at the time of ground-truthing
to assess the potential impact of this issue.
Modelling methods
The example classification presented herein employs a relatively simple pixel-based
classification using a SVM model. There are a variety of models available to perform pixel-
based classifications, and different methods may perform better on different datasets (Adam,
Mutanga, Odindi & Abdel-Rahman, 2014; Mountrakis, Im, & Ogole, 2011). Object-oriented
methods for classification are an alternative approach to pixel based assessment, the latter
independently assesses the chromatic signature of each pixel, whereas the former examines

local neighbourhoods to incorporate shape and texture features (Ouyang et al. 2011).
Alternative methods might help produce better models for the coarser pixel resolutions.
Conclusions
The MCZs in Kent represent most of the rocky areas in the county, making them particularly
crucial for the conservation and management of seaweed communities in the region. The high
resolution habitat maps presented here form a baseline for future assessment. The problem of
distinguishing natural variation between years and long term trends highlights the need for
multiple year comparisons. The method we have piloted in this study would enable a periodic
review of these communities and provide a tool for monitoring over the long term. As such,
this could provide a valuable addition to the monitoring of SACs which have to be monitored
by law under the EU habitats directive (Davies et al., 2001) every six years.
ACKNOWLEDGEMENTS
We are extremely grateful to Professor Mike Cowling (Chief Scientist, The Crown Estate) for
his interest in this project. We thank Paula Lightfoot for her constructive review. The project
was funded by The Crown Estate with additional support from the Natural History Museum
Development Initiative Fund.
SUPPORTING INFORMATION
Table S1 – Summary of ground truthing observations by time of observation. The tide
position in the Bing and RapidEye images mean that some observations cannot be tied to a
valid (unsubmerged) section of image.

Table S2 – Confusion matrices evaluating predicted and observed habitat classes for ground-
truth sites.
REFERENCES
Adam, E., Mutanga, O., Odindi, J., Abdel-Rahman, E. M. (2014). Land-use/cover
classification in a heterogeneous coastal landscape using RapidEye imagery: evaluating the
performance of random forest and support vector machines classifiers. International Journal
of Remote Sensing, 35(10), 3440-3458.
Beaumont, N. J., Austen, M. C., Mangi, S. C., Townsend, M. (2008). Economic valuation for
the conservation of marine biodiversity. Marine Pollution Bulletin, 56, 386–396.
Boaden, P. J. S. (1996). Habitat provision for meiofauna by Fucus serratus epifauna with
particular data on the flatworm Monocelis lineata. Marine Ecology, 17, 67–75.
Brodie, J., John, D., Tittley, I., Holmes, M. J., Williamson, D. (2007). Important Plant Areas
for algae: a provisional review of sites and areas of importance for algae in the United
Kingdom. Plantlife International, Salisbury, UK.
Brodie, J., Andersen, R., Kawachi, M., Millar, A. (2009). Endangered algae and approaches
to their conservation. Phycologia, 48, 423–438.
Brodie, J., Wilbraham, J., Pottas, J., Guiry, M. D. (2016). A revised check-list of the seaweeds
of Britain. Journal of the Marine Biological Association, 96, 1005-1029.

Brodie, J., Williamson, C. J., Smale, D. A., Kamenos, N. A., Mieszkowska, N., Santos, R.,
…, Hall-Spencer, J. M. (2014). The future of the NE Atlantic benthic flora in a high CO2
world. Ecology and Evolution, 4, 2787–2798.
Casal, G., Kutser, T., Domínguez-Gómez, J. A., Sánchez-Carnero, N., Freire, J. (2011).
Mapping benthic macroalgal communities in the coastal zone using CHRIS-PROBA mode 2
images. Estuarine and Coastal Shelf Science, 94, 281e290.
Casal, G,, Kutser, T., Domínguez-Gómez, J. A., Sánchez-Carnero, N., Freire, J. (2013).
Assessment of the hyperspectral sensor CASI-2 for macroalgal discrimination on the Ría de
Vigo coast (NW Spain) using field spectroscopy and modelled spectral libraries. Continental
Shelf Research, 55, 129-140.
Castillejo-González, I. L., Pena-Barragán, J. M., Jurado-Expósito, M., Mesas-Carrascosa, F.
J., López-Granados, F. (2014). Evaluation of pixel-and object-based approaches for mapping
wild oat (Avena sterilis) weed patches in wheat fields using QuickBird imagery for site-
specific management. European Journal of Agronomy, 59, 57-66.
Chang, C. C., & Lin, C. J.. (2011). LIBSVM: A Library for Support Vector Machines. ACM
Transactions on Intelligent Systems Technology, 2, 27.
Davies, J., Baxter, J., Bradley, M., Connor, D., Khan, J., Murray, E., … Vincent, M.. (2001).
Marine Monitoring Handbook. JNCC. Retrieved from http://jncc.defra.gov.uk/PDF/MMH-
mmh_0601.pdf.

Dierssen, H. M., Chlus, A., & Russell, B. (2015). Hyperspectral discrimination of floating
mats of seagrass wrack and the macroalgae Sargassum in coastal waters of Greater Florida
Bay using airborne remote sensing. Remote Sensing of Environment, 167, 247–258.
Harley, C. D. G., Anderson, K. M., Demes, K. W., Jorve, J. P., Kordas, R. L., Coyle, T. A., &
Graham, M. H. (2012). Effects of climate change on global seaweed communities. Journal of
Phycology, 48, 1064–1078.
Hennig, B. D., Cogan, B. C., & Bartsch, I. (2007). Hyperspectral remote sensing and analysis
of intertidal zones: a contribution to monitor coastal biodiversity. In: Car, A., Griesebner, G.,
Strobl, J. (Eds.), Geospatial Crossroads, GI Forum. Wichmann, Heidelberg, pp. 62e73.
Herkül, K., Kotta, J., Kutser, T., & Vahtmäe, E. (2013). Relating Remotely Sensed Optical
Variability to Marine Benthic Biodiversity. PLOS ONE, 8, e55624.
Hijmans, R. J. (2015). raster: Geographic Data Analysis and Modeling. R package version
2.3–33. https://cran.r-project.org/web/packages/raster/index.html
Hoang, T. C., O'Leary, M. J., & Fotedar, R. K. (2016). Remote-Sensed Mapping of
Sargassum spp. Distribution around Rottnest Island, Western Australia, Using High-Spatial
Resolution WorldView-2 Satellite Data. Journal of Coastal Research, 32, 1310-1321.
Jueterbock, A., Tyberghein, L., Verbruggen, H., Coyer, J. A., Olsen, J. L., & Hoarau, G.
(2013). Climate change impact on seaweed meadow distribution in the North Atlantic rocky
intertidal. Ecology and Evolution, 3, 1356–1373.

Golléty, C., Migné, A., & Davoult, D. (2008). Benthic metabolism on a sheltered rocky shore:
role of the canopy in the carbon budget. Journal of Phycology, 44,: 1146–53.
Gougeon, S., Kemp, K. M., Blicher, M. E., & Yesson, C. (2017). Mapping and classifying the
seabed of the West Greenland continental shelf. Estuarine, Coastal and Shelf Science, 187,
231-240.
Gullström, M., Lundén, B., Bodin, M., Kangwe, J., Öhman, M. C., Mtolera, M. S. P., &
Bjork, M. (2006). Assessment of changes in the seagrass-dominated submerged vegetation of
tropical Chwaka Bay (Zanzibar) using satellite remote sensing. Estuarine and Coastal Shelf
Science, 67, 399–408.
Kutser, T., Vahtmäe, E., & Martin, G. (2006). Assessing suitability of multispectral satellites
for mapping benthic macroalgal cover in turbid coastal waters by means of model
simulations. Estuarine and Coastal Shelf Science, 67, 521–529.
Medcalf, K. A., Parker, J. A., Turton, N., & Bell, G. (2013). Making Earth Observation Work
for UK Biodiversity Conservation – Phase 2. Report to the JNCC and Defra. Retrieved from
http://jncc.defra.gov.uk/PDF/MEOW_Phase2Norfolk_Report_Draft_highres_web-
2_p1_63.pdf
Meyer, D., Dimitriadou, E., Hornik, K., Weingessel, A., & Leisch, F. (2014). e1071: Misc
Functions of the Department of Statistics (e1071), TU Wien. R package version 1.6-4.

Michalek, J. L., Wagner, T. W., Luczkovich, J. J., & Stoffle, R. W. (1993). Multispectral
Change Vector Analysis for monitoring coastal marine environments. Photogrammetric
Engineering and Remote Sensing, 59, 381–384.
Mountrakis, G., Im, J., & Ogole, C. (2011). Support vector machines in remote sensing: A
review. ISPRS Journal of Photogrammetry and Remote Sensing, 66(3), 247-259.
Ouyang, Z. T., Zhang, M. Q., Xie, X., Shen, Q., Guo, H. Q., & Zhao, B. (2011). A
comparison of pixel-based and object-oriented approaches to VHR imagery for mapping
saltmarsh plants. Ecological informatics, 6(2), 136-146.
Pauly, K., & De Clerck, O. (2010). GIS-Based environmental analysis, remote sensing, and
niche modeling of seaweed communities. In Israel, A., Einav, R., Seckbach, J. (Eds.)
Seaweeds and their role in globally changing environments (Vol. 15, pp. 93-+). Dordrecht:
Springer.
Petchey, S., Brown, K., Hambidge, C., Porter K., & Rees, S. (2011). Natural
England/Environment Agency Collaboration: Operational Use of Remote Sensing for
Environmental Monitoring. Environment Agency Geomatics Group, Bath and Natural
England, Peterborough. Retrieved from http://publications.naturalengland.org.uk/file/205029.
Radosavljevic, A., & Anderson, R. P. (2014). Making better Maxent models of species
distributions: complexity, overfitting and evaluation. Journal of Biogeography, 41, 629–643.
Roessler, S., Wolf, P., Schneider, T., & Melzer, A. (2013). Multispectral remote sensing of
invasive aquatic plants using RapidEye. In Earth Observation of Global Changes (pp. 109-
123). Springer Berlin Heidelberg.
Secades, C., O'Connor, B., Brown, C., & Walpole, M. (2014). Earth Observation for
Biodiversity Monitoring: A review of current approaches and future opportunities for
tracking progress towards the Aichi Biodiversity Targets. Secretariat of the Convention on
Biological Diversity, Montréal, Canada. Technical Series No. 72, 183 pages. Retrieved at
https://www.cbd.int/doc/publications/cbd-ts-72-en.pdf
Smale, D. A., Burrows, M. T., Moore, P., O’Connor, N., Hawkins, S. J. (2013). Threats and
knowledge gaps for ecosystem services provided by kelp forests: a northeast Atlantic
perspective. Ecology and Evolution, 3, 4016–4038.
Sorte, C. J. B., Williams, S. L., Zerebecki, R. A. (2010). Ocean warming increases threat of
invasive species in a marine fouling community. Ecology, 91, 2198–2204.
Steneck, R. S., Graham, M. H., Bourque, B. J., Corbett, D., Erlandson, J. M., Estes, J. A., et
al. (2002). Kelp forest ecosystems: biodiversity, stability, resilience and future.
Environmental Conservation, 29, 436–459.
Tittley, I., Spurrier, C. J. H., Chimonides, P. J., George, J. D., Moore, J. A., Evans, N. J., et al.
(1998). Survey of chalk cave, cliff, intertidal and subtidal reef biotopes in the Thanet coast
cSAC. English Nature, Peterborough, UK.
Tittley, I., Gilliland, P., Pound, D. (1999). Marine flora of the Thanet coast marine cSAC: A
conservation and management perspective. In Scott, G. W., Tittley, I. (eds) Changes in the
marine flora of the North Sea. CERCI, Scarborough. Pp 65-75.
Uhl, F., Bartsch, I., Oppelt, N. (2016). Submerged kelp detection with hyperspectral data.
Remote Sensing, 8, 487.
Uhl, F., Oppelta, N., Bartsch, I. (2013). Spectral mixture of intertidal marine macroalgae
around the island of Helgoland (Germany, North Sea). Aquatic Botany, 111, 112–24.
Ustuner, M., Sanli, F. B., Dixon, B. (2015). Application of support vector machines for
landuse classification using high-resolution RapidEye images: a sensitivity analysis.
European Journal of Remote Sensing, 48(1), 403-422.
Vahtmaë, E., Kuster, T. (2013). Classifying the Baltic Sea Shallow Water Habitats Using
Image-Based and Spectral Library Methods. Remote Sensing, 5, 2451–2474.
Walcher, W., Leberl, F., Gruber, M. (2012) The Microsoft Global Ortho Program. ISPRS
Annals of the Photogrammetry, Remote Sensing and Spatial Information Sciences, Volume 1-
4, 53-58. https://doi.org/10.5194/isprsannals-I-4-53-2012
Yesson, C., Bush, L., Davies, A., Maggs, C. A., Brodie, J. (2015a). The distribution and
environmental requirements of large brown seaweeds in the British Isles. Journal of the
Marine Biological Association, 95, 669–680.

Yesson, C., Bush, L., Davies, A., Maggs, C. A., Brodie, J. (2015b). Large brown seaweeds of
the British Isles: evidence of changes in abundance over four decades. Estuarine and
Coastal Shelf Science, 155, 167–175.

Figures
Figure 1. Isle of Thanet and south Kent coast study area. The Thanet Coast Marine
Conservation Zone (MCZ) was designated in 2013. Tranche 2 MCZs were designated in
January 2016.

Figure 2. Sources of imagery. CCO = The Channel Coastal Observatory. Landsat data is not
used in this analysis (the resolution is too coarse for useful modelling in this area), but is
included for reference as this is a very popular remote sensing product.

Figure 3. An example of a stretch of shore showing 2013 and 2001 imagery and predicted
habitat. The shore is Hackemdown Point, the headland between Kinsgate Bay and Joss Bay,
Kent, UK.
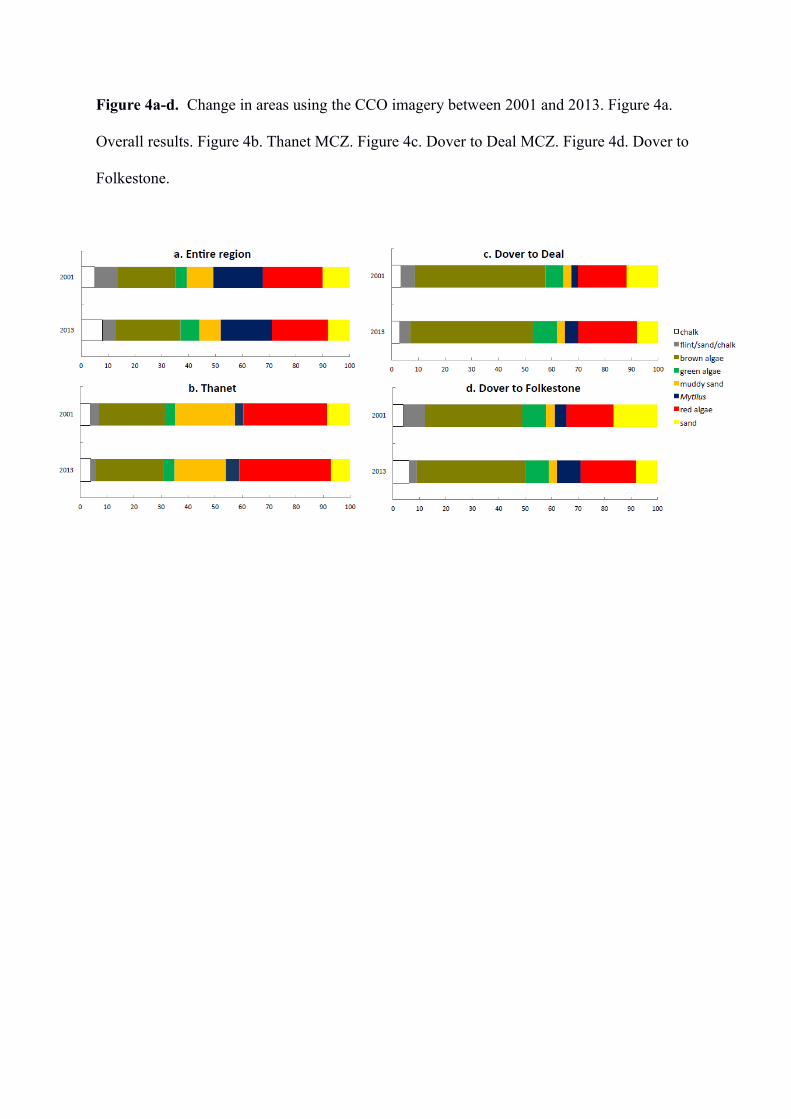
Figure 4a-d. Change in areas using the CCO imagery between 2001 and 2013. Figure 4a.
Overall results. Figure 4b. Thanet MCZ. Figure 4c. Dover to Deal MCZ. Figure 4d. Dover to
Folkestone.
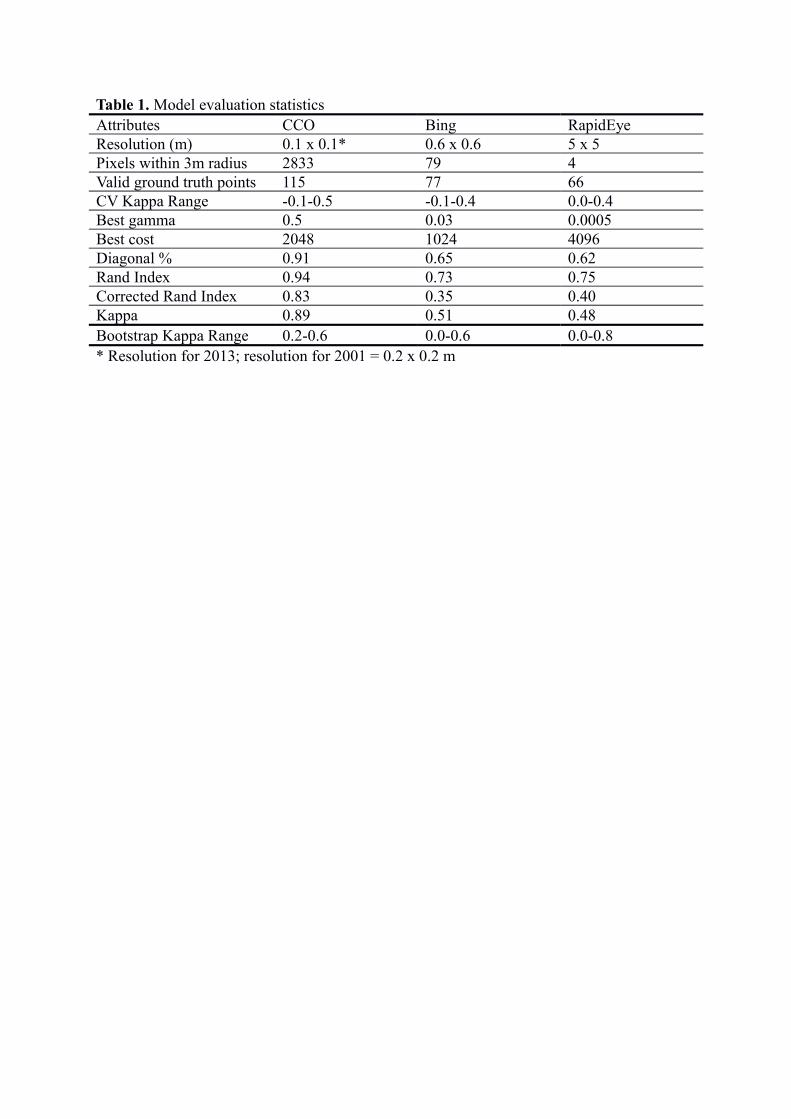
Table 1. Model evaluation statisticsAttributes CCO Bing RapidEyeResolution (m) 0.1 x 0.1* 0.6 x 0.6 5 x 5Pixels within 3m radius 2833 79 4Valid ground truth points 115 77 66CV Kappa Range -0.1-0.5 -0.1-0.4 0.0-0.4Best gamma 0.5 0.03 0.0005Best cost 2048 1024 4096Diagonal % 0.91 0.65 0.62Rand Index 0.94 0.73 0.75Corrected Rand Index 0.83 0.35 0.40Kappa 0.89 0.51 0.48Bootstrap Kappa Range 0.2-0.6 0.0-0.6 0.0-0.8* Resolution for 2013; resolution for 2001 = 0.2 x 0.2 m
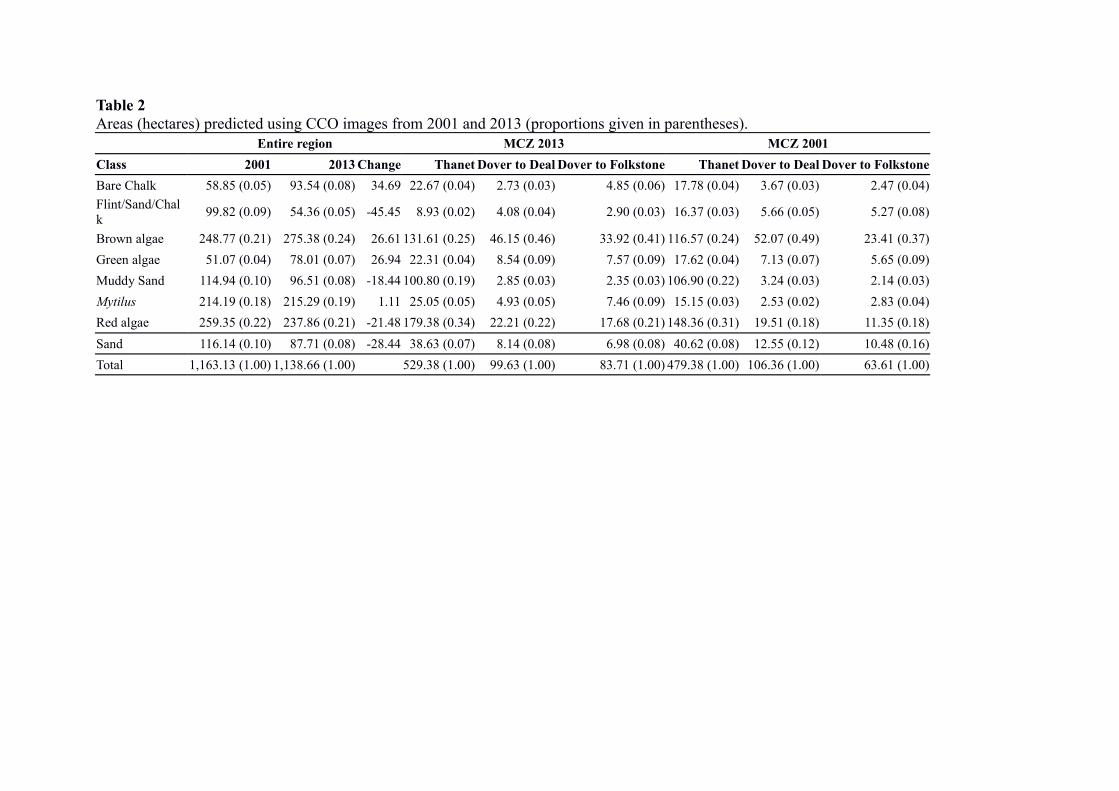
Table 2 Areas (hectares) predicted using CCO images from 2001 and 2013 (proportions given in parentheses).
Entire region MCZ 2013 MCZ 2001
Class 2001 2013 Change Thanet Dover to Deal Dover to Folkstone Thanet Dover to Deal Dover to Folkstone
Bare Chalk 58.85 (0.05) 93.54 (0.08) 34.69 22.67 (0.04) 2.73 (0.03) 4.85 (0.06) 17.78 (0.04) 3.67 (0.03) 2.47 (0.04)
Flint/Sand/Chalk
99.82 (0.09) 54.36 (0.05) -45.45 8.93 (0.02) 4.08 (0.04) 2.90 (0.03) 16.37 (0.03) 5.66 (0.05) 5.27 (0.08)
Brown algae 248.77 (0.21) 275.38 (0.24) 26.61 131.61 (0.25) 46.15 (0.46) 33.92 (0.41) 116.57 (0.24) 52.07 (0.49) 23.41 (0.37)
Green algae 51.07 (0.04) 78.01 (0.07) 26.94 22.31 (0.04) 8.54 (0.09) 7.57 (0.09) 17.62 (0.04) 7.13 (0.07) 5.65 (0.09)
Muddy Sand 114.94 (0.10) 96.51 (0.08) -18.44 100.80 (0.19) 2.85 (0.03) 2.35 (0.03) 106.90 (0.22) 3.24 (0.03) 2.14 (0.03)
Mytilus 214.19 (0.18) 215.29 (0.19) 1.11 25.05 (0.05) 4.93 (0.05) 7.46 (0.09) 15.15 (0.03) 2.53 (0.02) 2.83 (0.04)
Red algae 259.35 (0.22) 237.86 (0.21) -21.48 179.38 (0.34) 22.21 (0.22) 17.68 (0.21) 148.36 (0.31) 19.51 (0.18) 11.35 (0.18)
Sand 116.14 (0.10) 87.71 (0.08) -28.44 38.63 (0.07) 8.14 (0.08) 6.98 (0.08) 40.62 (0.08) 12.55 (0.12) 10.48 (0.16)
Total 1,163.13 (1.00) 1,138.66 (1.00) 529.38 (1.00) 99.63 (1.00) 83.71 (1.00) 479.38 (1.00) 106.36 (1.00) 63.61 (1.00)

Table 3 Predicted areas (hectares) based on three sets of images. Study area is the shoreline observable in all three images.Classes CCO 2013 Bing Rapid EyeBare Chalk 30.49 2.45 0.00Flint/Sand/Chalk 16.49 6.13 23.08Brown algae 102.55 40.37 191.27Green algae 30.68 60.73 94.76Muddy Sand 17.02 0.00 0.00Mytilus 68.56 50.21 2.54Red algae 71.33 143.52 30.72Sand 52.13 96.71 69.05Total 389.24 400.11 411.43Total no. of pixels 97302500 1111426 164572